user manual- port tariff analysis
TRANSCRIPT
USER MANUAL- PORT TARIFF ANALYSIS CAP-HAITIEN PORT REGULATORY STRENGTHENING PROJECT
February 2018

USER MANUAL- PORT TARIFF ANALYSIS
Activity Title: Cap-Haïtien Port Regulatory Strengthening Project Sponsoring USAID Office: Economic Growth Office Contract Number: AID-521-C-16-00003 Contractor: Nathan Associates Inc.
Disclaimer
This document is made possible through the support of the American people through the U.S. Agency for International Development (USAID). The contents of this document are the sole responsibility of the author or authors and do not necessarily reflect the views of USAID or the United States government.
CONTENTS
Contents Figures ii
1. INTRODUCTION 1
2. BACKGROUND AND PURPOSE OF TARIFF ANALYSIS TOOL 1
3. INPUT COMPONENTS OF THE TOOL 3
4. OUTPUT COMPONENTS OF THE TOOL 6
5. INSTRUCTIONS ON THE USE OF THE TOOL 7
5.1 Tool Inputs 7
5.1.1 Macroeconomic Assumptions 7
5.1.2 Revenue Scenarios 8
5.1.3 Port Revenue Forecasts 9
5.1.4 Demand Forecasts 10
5.1.5 Port Operational Expenses 10
5.1.5 Port Authority Capital Expenses 12
5.2 Tool Outputs 12
6. A PRACTICE RUN 17
6.1 Inserting the Assumptions 19
Figures Figure 1 – Input components of the Tool for generating Tool output components 4 Figure 2 – Color Codes for Inputs and Formulas 7 Figure 3 – Macroeconomic Assumptions section 8 Figure 4 – Revenue Scenario Section 8 Figure 5 – Revenue Impact of Scenario Selection 9 Figure 6 – Container (in TEUs) and Non-Containerized (in tons) Demand Forecast Scenarios 9
Figure 7 – Part C’s Port Revenue Forecasts 10 Figure 8 – Part D Demand Forecasts 11 Figure 9 – Port Authority Operational Expenses 11 Figure 10 – Port Authority Capital Expenses 13 Figure 11 – Snapshot Financial Results from WS1 – Inputs 14 Figure 12 – Pro Forma Financial Statement 15 Figure 13 – Graphical Depictions Pro Forma Financial Statement 16 Figure 14 – Setting the Base Case by Inserting the Number 1 for Each of Seven Revenue Categories 17 Figure 15 – Setting the Base Case by Inserting the Number 1 for Container and Non-Containerized Demand Forecasts 18 Figure 16 – Base Case Revenues for the Revenue Categories 18 Figure 17 – Changing the Scenarios for Revenue Categories in Part B. Revenue Scenarios 19 Figure 18 – Changing the Cargo Demand Scenarios in Part B. Revenue Scenarios 19 Figure 19 – Financial Results from Practice Run 21
U S E R M A N U A L - P O R T T A R I F F A N A L Y S I S | 1
INTRODUCTION
Like many countries around the world, Haiti aims to transform its port sector to reflect modernized institutional arrangements in order to boost trade and grow the national economy. This transformation, commencing years ago, includes converting Haiti’s National Port Authority (APN) from a direct provider of port services (an “operating port”) to its ongoing evolution as a regulatory and planning body (“landlord port”). Doing so will highly increase the efficiency of ports and bring Haiti closer to industry practice—greater than 95 percent of the world’s largest container ports and 80 percent of Latin American-Caribbean region ports are administered as landlord ports.
USAID is also supporting efforts to prepare Haiti to assume its regulatory role: determining port authority tariff levels, engaging private port service providers in contracts and monitoring their performance, and imposing operational rules governing the conduct of activities within the harbor and port areas. The efforts include the preparation of the Port Authority Regulation series of textbooks, tools, and regulatory procedures manuals addressing the range of regulatory activities conducted by landlord port authorities, with procedures manuals outlining the activities for implementing and/or updating regulatory practices. The Port Authority Regulation series includes the:
1. Practical Guide and Tool for Monitoring Port Performance 2. Port Authority Tariff Analysis Guide and Tool 3. Guidebook on Port Service Contracts and Sample Annotated Templates 4. Guidebook for Port Operational Regulations and Sample Annotated Template
Each Port Authority Regulation series textbook, prepared in both student and instructor editions, provides background on best practices and prescribes the frameworks governing the regulatory function at hand. Student texts are accompanied by tools, tool instruction manuals, and manuals outlining the procedures that APN and each of its regional ports should employ to ensure effective implementation of the regulatory activity. These procedures manuals will assure consistency of regulatory procedures across Haiti’s entire port system.
This document composes the Tariff Analysis Tool User Instruction Manual as part of the Port Authority Tariff Analysis Guide and Tool. Chapter 2 describes the purpose of the Tool, Chapters 3 and 4 present the Tool’s input and output components, respectively, and Chapter 5 provides instructions on the Tool’s use. The user has the opportunity to apply the Tool, with Chapter 6 directing the user to input

U S E R M A N U A L - P O R T T A R I F F A N A L Y S I S | 2
assumptions and providing the output that the user should generate from changes the user makes in the assumptions.
U S E R M A N U A L - P O R T T A R I F F A N A L Y S I S | 1
1. BACKGROUND AND PURPOSE OF TARIFF ANALYSIS TOOL
The purpose of the Tariff Analysis Tool is to enable APN to test the effects of adjustments to port authority tariffs on APN cash flows. The Tool provides a systematic simulation of the cash flows generated by APN. It is composed of a dashboard that enables the Tool user to develop multiple tariff and traffic demand scenarios and change operational assumptions - representing major determinants or components of the APN’s financial flows. Revenues can be modified to reflect changes in APN’s port tariffs as well as other revenue sources. Similarly, the effect of changes in macroeconomic factors, demand forecasts, and capital (CAPEX) and operating (OPEX) expenses can be illustrated in the pro forma financial statements, generating income statements and cash flow statements in accord with changing assumptions.
The user can also test the effects of incorporating tariff levels of non-Haitian port authorities to gauge the impact on APN’s financial performance if it matched the tariffs of benchmark ports in order to remain competitive. For example, in a scenario where non-Haitian Port A, which handles some Haitian cargoes, charges lower port authority fees than those of APN, then the user can change the Tool’s spreadsheet to reflect Port A’s port authority charges. This will allow the user to observe the impact on APN financial performance if port authority tariffs are adjusted to reflect competing port authority charges in a rival port.
The tariff tool is structured to reflect the terminal operator’s concession contract payment terms, in this case, the one expected for the port of Cap Haitien. As is typical for port concession contracts, this encompasses fixed and variable fee revenues that are generated for APN. The fixed fee comprises the annual lease payment to APN by the terminal operator holding the concession. The variable fee consists of a royalty payment paid to APN based on a per unit charge for cargo handled. For example, there is a royalty payment paid by the terminal operator per container handled in the terminal, in this case on a per TEU basis. As the terminal operator may also serve non-containerized cargoes, such as bulk and breakbulk cargoes, there is also a royalty payment paid to the port authority on each ton of cargo handled. As the Cap Haitien concession represents the first port concession of public facilities in Haiti, it is expected that future concession contracts will reflect similar payment terms.

U S E R M A N U A L - P O R T T A R I F F A N A L Y S I S | 2
There are also charges not now imposed by APN that are imposed by port authorities in other countries. These include security surcharges as well as miscellaneous charges related to services the port authority provides. While these charges are not currently imposed in Haiti, the Tool allows the user to incorporate such charges in the event APN decides to impose them in future years. Additionally, as earlier noted, the Tool allows for assessing the impact on APN’s financial performance if APN adopts the port authority tariffs applied in other countries. So the user can input such charges in the Tool.
As in all Excel-based spreadsheets, the Tool also allows the user to create a number of “what if” scenarios. The Tool provides for the use of five different scenarios, four of which are based on the structure of Scenario 1, which forms the base case scenario. All five scenarios reflect seven general categories of port authority charges (fixed and variable and hence revenue sources for APN). Scenarios 2-5 reflect percentage adjustments, up or down, from Scenario 1’s base case. While the Tool shows five Scenarios to select from, the user can assign a different Scenario to each of the seven categories of port authority charges. Additionally, port authority revenues are affected by both the level of charges imposed by the port authority as well as cargo and ship volumes handled. Hence, the Tool also allows for adjustments to demand forecasts using three different demand scenarios. Altogether, the user has the possibility of testing nearly 235,000 different configurations and potentially exponentially more given the ability to “hard code” other numbers in a custom run of the model.
U S E R M A N U A L - P O R T T A R I F F A N A L Y S I S | 3
2. INPUT COMPONENTS OF THE TOOL
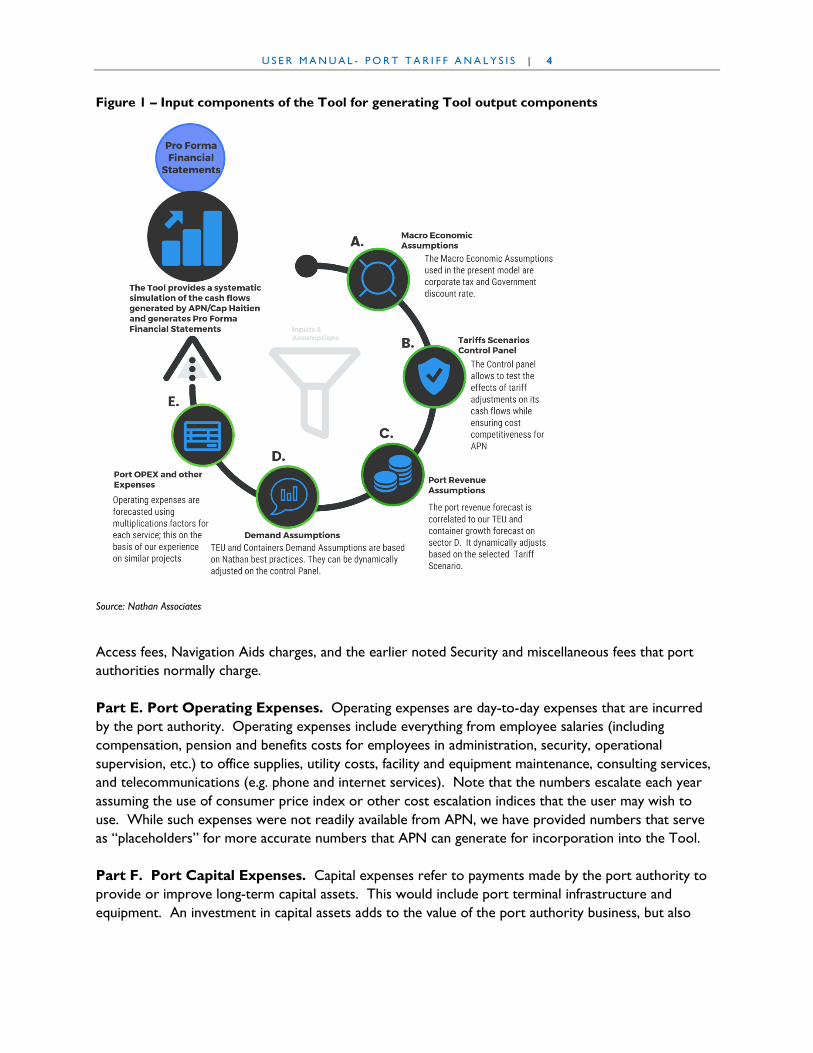
The Tariff Analysis Tool structure is depicted in Figure 1. It is composed of six components that together will generate port authority financial performance. These components are found in the Tool’s first worksheet (WS1 – INPUTS). The six components include:
Part A. Macroeconomic Assumptions. Macroeconomic inputs refer to corporate tax and the government’s discount rate. The prevailing rates in Haiti are 30% for the corporate tax rate and 12% for the government discount rate. But the user has the ability to change these as desired.
Part B. Revenue Scenarios. This part enables the user to test the effects of revenue adjustments, relative to fixed, variable, and other charges, on APN’s cash flows based on the Scenario the user configures. The user can select a Scenario among the Tool’s pre-configured scenario options, or build a customized one based on the user’s own changes relative to the seven categories of port authority charges.
Part C. Port Revenue Forecast. The port revenue forecast is tied to Part D’s TEU and container growth forecasts as well as the user’s selected (or configured) revenue scenarios. Hence, the revenues depicted in the Tool change when selecting a Revenue Scenario in Part B or developing a customized one. Forecasted revenues are based on the terminal operator’s fixed and variable charges as well as revenues generated from services provided by the Port Authority, such as Tug Assist, Channel Access, and Navigation Aids. Part C is the only one of the six components that does not require input from the user, as inputs are automated based on the inputs made by users in the other parts. However, the user can still make hard entries in Part C if so desired.
Part D. Demand Forecasts. The Container Demand Forecast Growth Scenario selected by the user in Part B is reflected over a 20-year forecast horizon in Part D. Containers (in TEUs) and non-containerized cargo (in tons) forecasts are generated. Based on expected vessel size and capacity, the model calculates the number and size (length overall – LOA) of vessels that will carry the forecasted cargo volumes as the port authority generates revenues from vessel activity in the form of Channel
U S E R M A N U A L - P O R T T A R I F F A N A L Y S I S | 4
Figure 1 – Input components of the Tool for generating Tool output components
Source: Nathan Associates
Access fees, Navigation Aids charges, and the earlier noted Security and miscellaneous fees that port authorities normally charge. Part E. Port Operating Expenses. Operating expenses are day-to-day expenses that are incurred by the port authority. Operating expenses include everything from employee salaries (including compensation, pension and benefits costs for employees in administration, security, operational supervision, etc.) to office supplies, utility costs, facility and equipment maintenance, consulting services, and telecommunications (e.g. phone and internet services). Note that the numbers escalate each year assuming the use of consumer price index or other cost escalation indices that the user may wish to use. While such expenses were not readily available from APN, we have provided numbers that serve as “placeholders” for more accurate numbers that APN can generate for incorporation into the Tool. Part F. Port Capital Expenses. Capital expenses refer to payments made by the port authority to provide or improve long-term capital assets. This would include port terminal infrastructure and equipment. An investment in capital assets adds to the value of the port authority business, but also

U S E R M A N U A L - P O R T T A R I F F A N A L Y S I S | 5
increases the value of the port authority’s net worth, the expense associated with a capital investment increases the port authority’s liability. Additionally, because capital investments lose value over time, they reduce the port authority’s value, which is reflected in depreciation. This loss of value (depreciation) is capitalized over a period of time equal to the expected or useful life of the capital asset. The Tool separates capital expenses by infrastructure and equipment assets. As APN is receiving a grant to cover Cap Haitien’s port capital asset improvements, capital asset expenses would not be shown here; however, for purposes of demonstration, the Tool shows a terminal investment of $20 million and an equipment investment of $1.5 million. These capital expenses in turn are depreciated annually over the useful life of the asset, in this case 20 years each, as the Tool shows.
U S E R M A N U A L - P O R T T A R I F F A N A L Y S I S | 6
3. OUTPUT COMPONENTS OF THE TOOL
The Tool’s principal output consists of APN’s pro forma financial statements, as generated in the second worksheet (WS2 – Financial Performance) and graphical depictions of the financial results (WS3 – Graphical Depictions). Pro forma financial statements are intended to depict a reasonably accurate portrayal of a port authority’s financial situation if prevailing trends continue or if certain assumptions hold true. As noted earlier, pro forma financial statements can also be used to gauge the effects of “what if” scenarios by changing certain assumptions, which reflect possible events that have a potential effect on the port authority’s financial outcome.
Normally, there are three primary financial statements composed in pro forma financial statements, including 1) the balance sheet, which depicts the port authority’s assets, liabilities, and net worth; 2) the income statement (or profit and loss statement), which reflects an itemization of revenues and expenses and provides insight on what can be done to improve the bottom line, and 3) the cash flow statement, which shows cash inflows and outflows caused by the port authority’s activities during a stated period. For our purposes here, the balance sheet is omitted from the Tool as there was insufficient information available to generate one that is reasonably reflective of the Cap Haitien situation.
As noted, the pro forma financial statements are reflected graphically in the Tool’s third worksheet, WS3 – Graphical Depictions. Here, the Tool generates graphics depicting income and cash flow statements. We also include a depiction of EBITDA (Earnings Before Interest, Taxes, Depreciation, and Amortization) drawn from the WS2 – Financial Performance worksheet. Some financial analysts believe that EBITDA is a more accurate reflection of an entity’s financial health as non-cash expenses do little to say about the actual cash flows of an entity. On the other hand, the use of EBITDA can also disguise financial risk and for this reason is not included as a part of the Generally Accepted Accounting Principles (GAAP) standards and procedures that entities follow in compiling their financial statements. However, EBITDA, along with other financial statements, are useful when presenting the full picture of an entity’s financial health.
U S E R M A N U A L - P O R T T A R I F F A N A L Y S I S | 7
4. INSTRUCTIONS ON THE USE OF THE TOOL
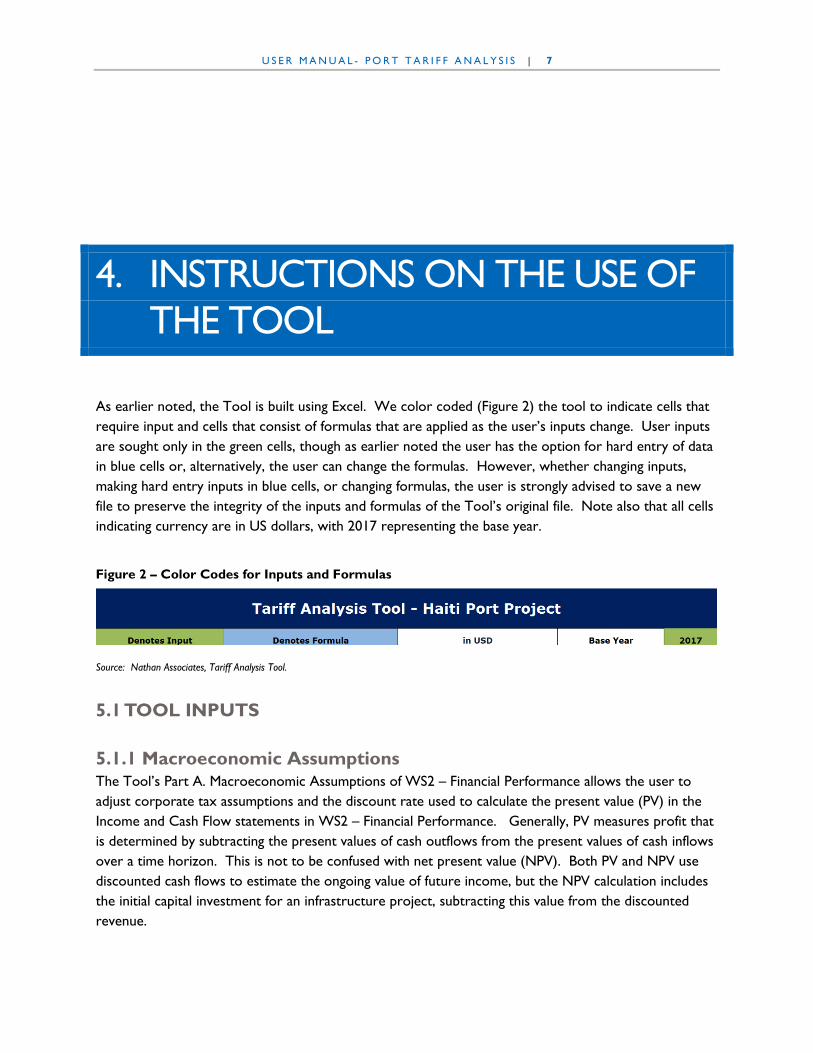
As earlier noted, the Tool is built using Excel. We color coded (Figure 2) the tool to indicate cells that require input and cells that consist of formulas that are applied as the user’s inputs change. User inputs are sought only in the green cells, though as earlier noted the user has the option for hard entry of data in blue cells or, alternatively, the user can change the formulas. However, whether changing inputs, making hard entry inputs in blue cells, or changing formulas, the user is strongly advised to save a new file to preserve the integrity of the inputs and formulas of the Tool’s original file. Note also that all cells indicating currency are in US dollars, with 2017 representing the base year.
Figure 2 – Color Codes for Inputs and Formulas
Source: Nathan Associates, Tariff Analysis Tool.
5.1 TOOL INPUTS
5.1.1 Macroeconomic Assumptions The Tool’s Part A. Macroeconomic Assumptions of WS2 – Financial Performance allows the user to adjust corporate tax assumptions and the discount rate used to calculate the present value (PV) in the Income and Cash Flow statements in WS2 – Financial Performance. Generally, PV measures profit that is determined by subtracting the present values of cash outflows from the present values of cash inflows over a time horizon. This is not to be confused with net present value (NPV). Both PV and NPV use discounted cash flows to estimate the ongoing value of future income, but the NPV calculation includes the initial capital investment for an infrastructure project, subtracting this value from the discounted revenue.

U S E R M A N U A L - P O R T T A R I F F A N A L Y S I S | 8
The user can change the assumed rates in the green cells in Part A. Macroeconomic Assumptions in WS – Inputs, as shown in Figure 3. Once these rates are set by the user, they are automatically carried into adjacent cells for the entire 20-year financial performance horizon. No inflation rate is considered.
Figure 3 – Macroeconomic Assumptions section
Source: Nathan Associates, Tariff Analysis Tool
5.1.2 Revenue Scenarios The Tool allows the user to select a Revenue Scenario in Part B of WS1 – Inputs. As earlier noted, the user can select a Scenario by inputting scenario numbers in the green cells under each of the seven revenue categories (Figure 4). The user need not select the same scenario for each revenue category. In Figure 4, for example, the user may select scenario 1 for fixed annual fees, 2 for variable fees, 5 for security, and so on.
Figure 4 – Revenue Scenario Section
Source: Nathan Associates, Tariff Analysis Tool
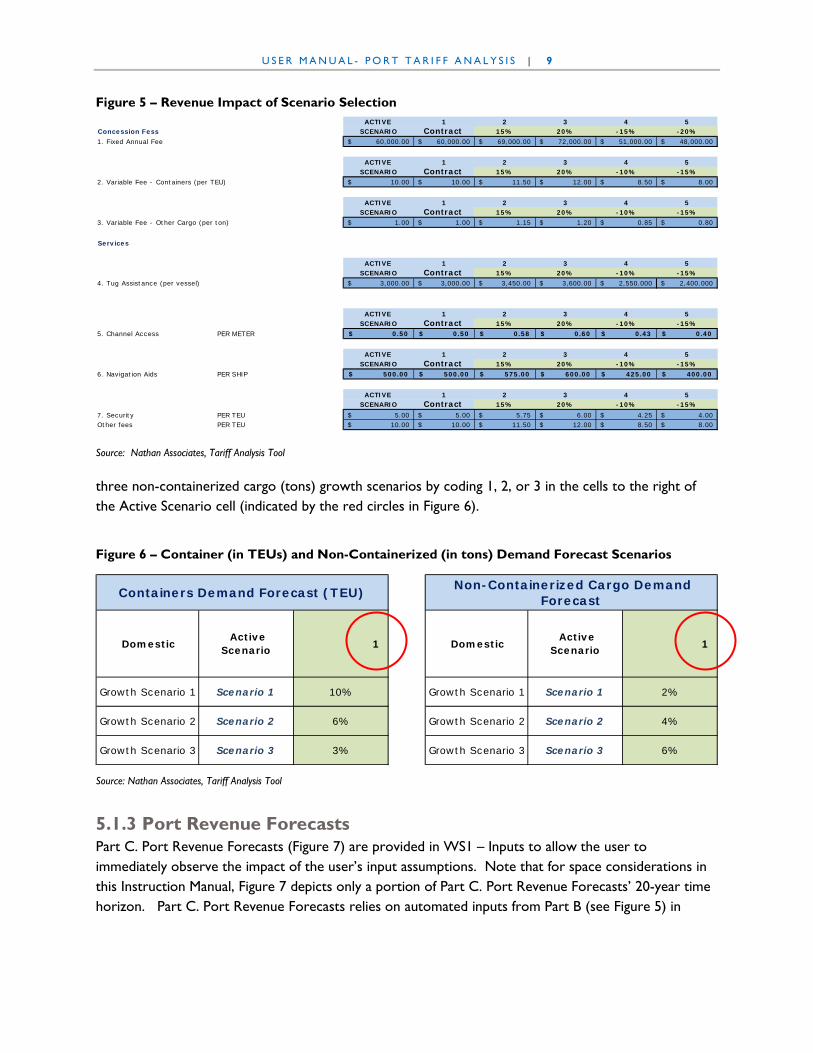
Figure 5, copied from Part B of WS1 – Inputs, illustrates the impact of the scenario selection on concession fee revenues and revenues from port authority-provided services. For comparison purposes, the impact of other selected scenarios is also shown in the green cells; and, because these cells are green, the user can input any percentage as desired to create more aggressive or conservative scenarios and assess sensitivity in accord with the user’s “customized inputs” on these revenue sources.
Revenues are affected by the volume of cargo and vessels handled in the terminal or port as the port authority applies charges based on volumes. For example, assuming the same container surcharge is continuously applied over the coming years, the total revenue from a $10 surcharge per TEU of 20,000 TEUs handled in year 1 would certainly be less than the same $10 surcharge per TEU of 30,000 TEUs handled in year 5. So, we designed three scenarios that the user can select in the Container Demand Forecast and Non-Containerized Cargo Demand portion of Part B. Revenue Scenarios. The user can select one of three container (TEU) growth scenarios (10 percent, 6 percent, and 3 percent) and one of
Concession Contract Base Scenario 1 Base
Scenario 2 Base + 15% 2
1. Fixed Annual Fee2. Variable Fee - Containers (per
TEU)
3. Variable Fee - Other Cargo
(per ton)
4. Tug Assistance
(per vessel)
5. Channel Access
6. Navigation Aids 7. Security
Scenario 3 Base + 20% 3 1 1 1 1 1 1 1
Scenario 4 Base -15% 4
Scenario 5 Base -20% 5
APN Active Tariff Scenario
U S E R M A N U A L - P O R T T A R I F F A N A L Y S I S | 9
Figure 5 – Revenue Impact of Scenario Selection
Source: Nathan Associates, Tariff Analysis Tool
three non-containerized cargo (tons) growth scenarios by coding 1, 2, or 3 in the cells to the right of the Active Scenario cell (indicated by the red circles in Figure 6).
Figure 6 – Container (in TEUs) and Non-Containerized (in tons) Demand Forecast Scenarios
Source: Nathan Associates, Tariff Analysis Tool
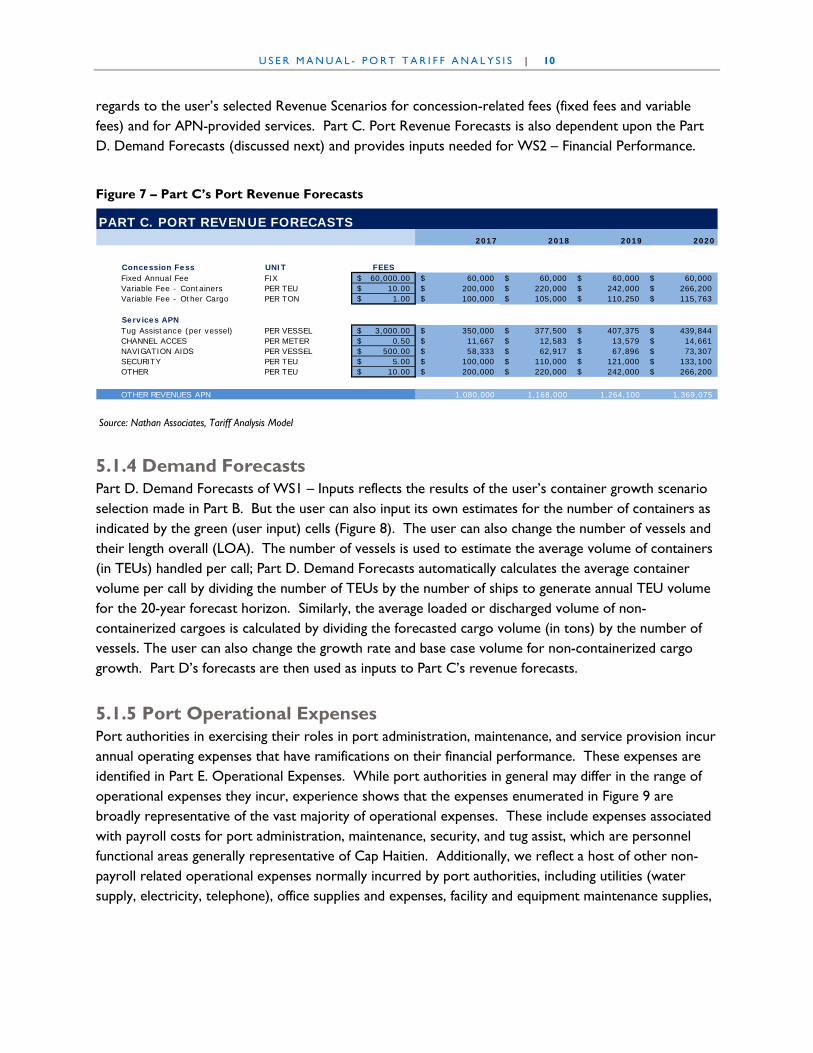
5.1.3 Port Revenue Forecasts Part C. Port Revenue Forecasts (Figure 7) are provided in WS1 – Inputs to allow the user to immediately observe the impact of the user’s input assumptions. Note that for space considerations in this Instruction Manual, Figure 7 depicts only a portion of Part C. Port Revenue Forecasts’ 20-year time horizon. Part C. Port Revenue Forecasts relies on automated inputs from Part B (see Figure 5) in
ACTIVE 1 2 3 4 5Concession Fess SCENARIO Contract 15% 20% -15% -20%1. Fixed Annual Fee 60,000.00$ 60,000.00$ 69,000.00$ 72,000.00$ 51,000.00$ 48,000.00$
ACTIVE 1 2 3 4 5SCENARIO Contract 15% 20% -10% -15%
2. Variable Fee - Containers (per TEU) 10.00$ 10.00$ 11.50$ 12.00$ 8.50$ 8.00$
ACTIVE 1 2 3 4 5SCENARIO Contract 15% 20% -10% -15%
3. Variable Fee - Other Cargo (per ton) 1.00$ 1.00$ 1.15$ 1.20$ 0.85$ 0.80$
Services
ACTIVE 1 2 3 4 5SCENARIO Contract 15% 20% -10% -15%
4. Tug Assistance (per vessel) 3,000.00$ 3,000.00$ 3,450.00$ 3,600.00$ 2,550.000$ 2,400.000$
ACTIVE 1 2 3 4 5SCENARIO Contract 15% 20% -10% -15%
5. Channel Access PER METER 0.50$ 0.50$ 0.58$ 0.60$ 0.43$ 0.40$
ACTIVE 1 2 3 4 5SCENARIO Contract 15% 20% -10% -15%
6. Navigation Aids PER SHIP 500.00$ 500.00$ 575.00$ 600.00$ 425.00$ 400.00$
ACTIVE 1 2 3 4 5SCENARIO Contract 15% 20% -10% -15%
7. Security PER TEU 5.00$ 5.00$ 5.75$ 6.00$ 4.25$ 4.00$ Other fees PER TEU 10.00$ 10.00$ 11.50$ 12.00$ 8.50$ 8.00$
Domestic Active
Scenario 1 Domestic Active
Scenario 1
Growth Scenario 1 Scenario 1 10% Growth Scenario 1 Scenario 1 2%
Growth Scenario 2 Scenario 2 6% Growth Scenario 2 Scenario 2 4%
Growth Scenario 3 Scenario 3 3% Growth Scenario 3 Scenario 3 6%
Non-Containerized Cargo Demand Forecast Containers Demand Forecast (TEU)
U S E R M A N U A L - P O R T T A R I F F A N A L Y S I S | 10
regards to the user’s selected Revenue Scenarios for concession-related fees (fixed fees and variable fees) and for APN-provided services. Part C. Port Revenue Forecasts is also dependent upon the Part D. Demand Forecasts (discussed next) and provides inputs needed for WS2 – Financial Performance.
Figure 7 – Part C’s Port Revenue Forecasts
Source: Nathan Associates, Tariff Analysis Model
5.1.4 Demand Forecasts Part D. Demand Forecasts of WS1 – Inputs reflects the results of the user’s container growth scenario selection made in Part B. But the user can also input its own estimates for the number of containers as indicated by the green (user input) cells (Figure 8). The user can also change the number of vessels and their length overall (LOA). The number of vessels is used to estimate the average volume of containers (in TEUs) handled per call; Part D. Demand Forecasts automatically calculates the average container volume per call by dividing the number of TEUs by the number of ships to generate annual TEU volume for the 20-year forecast horizon. Similarly, the average loaded or discharged volume of non-containerized cargoes is calculated by dividing the forecasted cargo volume (in tons) by the number of vessels. The user can also change the growth rate and base case volume for non-containerized cargo growth. Part D’s forecasts are then used as inputs to Part C’s revenue forecasts.
5.1.5 Port Operational Expenses Port authorities in exercising their roles in port administration, maintenance, and service provision incur annual operating expenses that have ramifications on their financial performance. These expenses are identified in Part E. Operational Expenses. While port authorities in general may differ in the range of operational expenses they incur, experience shows that the expenses enumerated in Figure 9 are broadly representative of the vast majority of operational expenses. These include expenses associated with payroll costs for port administration, maintenance, security, and tug assist, which are personnel functional areas generally representative of Cap Haitien. Additionally, we reflect a host of other non-payroll related operational expenses normally incurred by port authorities, including utilities (water supply, electricity, telephone), office supplies and expenses, facility and equipment maintenance supplies,
PART C. PORT REVENUE FORECASTS2017 2018 2019 2020
Concession Fess UNIT FEESFixed Annual Fee FIX 60,000.00$ 60,000$ 60,000$ 60,000$ 60,000$ Variable Fee - Containers PER TEU 10.00$ 200,000$ 220,000$ 242,000$ 266,200$ Variable Fee - Other Cargo PER TON 1.00$ 100,000$ 105,000$ 110,250$ 115,763$
Services APNTug Assistance (per vessel) PER VESSEL 3,000.00$ 350,000$ 377,500$ 407,375$ 439,844$ CHANNEL ACCES PER METER 0.50$ 11,667$ 12,583$ 13,579$ 14,661$ NAVIGATION AIDS PER VESSEL 500.00$ 58,333$ 62,917$ 67,896$ 73,307$ SECURITY PER TEU 5.00$ 100,000$ 110,000$ 121,000$ 133,100$ OTHER PER TEU 10.00$ 200,000$ 220,000$ 242,000$ 266,200$
OTHER REVENUES APN 1,080,000 1,168,000 1,264,100 1,369,075

U S E R M A N U A L - P O R T T A R I F F A N A L Y S I S | 11
and advertising and promotion. We have also included an “other expenses” items that port authorities may incur that cannot be apportioned to the other operational expense categories.
Figure 8 – Part D Demand Forecasts
Source: Nathan Associates, Tariff Analysis Model
As shown in Part E. Operational Expenses, the user has the ability to insert these costs directly. Additionally, we assume an inflation adjustment factor of 3 percent.
Figure 9 – Port Authority Operational Expenses
Source: Nathan Associates, Tariff Analysis Model
PART D. DEMAND FORECASTS2017 2018 2019 2020
Containers Demand Forecast (TEU)Domestic 20,000 22,000 24,200 26,620 Growth Scenario 1 20,000 10% 10% 10%Growth Scenario 2 20,000 6% 6% 6%Growth Scenario 3 20,000 3% 3% 3%
Total Containers (TEUs) 20,000 22,000 24,200 26,620
Number of Vessels 300 67 73 81 89 LOA (m) 200 13,333 14,667 16,133 17,747
General Cargo Demand Forecast (Tons)Domestic 5% 100,000 105,000 110,250 115,763Transit
Total Cargo (Tons) 100,000 105,000 110,250 115,763
Number of Vessels 2,000 50 53 55 58 LOA (m) 200 10,000 10,500 11,025 11,576
PART E. OPERATIONAL EXPENSESTRAFFIC AND TERMINAL AREA FACTORS FOR EXPENSES 2017 2018 2019 2020
C1- EXPENSES CALCULATIONSPort Authority Total Annual Payroll 193,000$ 198,790$ 204,754$ 210,896$ 217,223$ Port Administration 80,000$ 82,400$ 84,872$ 87,418$ 90,041$ Maintenance crews and supervisor 35,000$ 36,050$ 37,132$ 38,245$ 39,393$ Security 45,000$ 46,350$ 47,741$ 49,173$ 50,648$ Tug assist 33,000$ 33,990$ 35,010$ 36,060$ 37,142$
Pension and other benefits
assumed factor = 22% of total APN/Cap Haitian Payroll 42,460$ 43,734$ 45,046$ 46,397$ 47,789$
Payroll taxesassumed factor = 8% of total APN/Cap Haitian Payroll 15,440$ 15,903$ 16,380$ 16,872$ 17,378$
Other Operating Expenses 31,700$ 32,651$ 33,631$ 34,639$ 35,679$ Water supply 1,000$ 1,030$ 1,061$ 1,093$ 1,126$ Electricity 15,000$ 15,450$ 15,914$ 16,391$ 16,883$ Telephone 4,000$ 4,120$ 4,244$ 4,371$ 4,502$ Office supplies and expenses 1,200$ 1,236$ 1,273$ 1,311$ 1,351$ Facility and equipment maintenance supplies 7,000$ 7,210$ 7,426$ 7,649$ 7,879$ Advertising and promotion 2,000$ 2,060$ 2,122$ 2,185$ 2,251$ Other expenses 1,500$ 1,545$ 1,591$ 1,639$ 1,688$
Inflation Factor 3%
OPERATING EXPENSES (USD) (APN) 291,078$ 299,810$ 308,805$ 318,069$
U S E R M A N U A L - P O R T T A R I F F A N A L Y S I S | 12
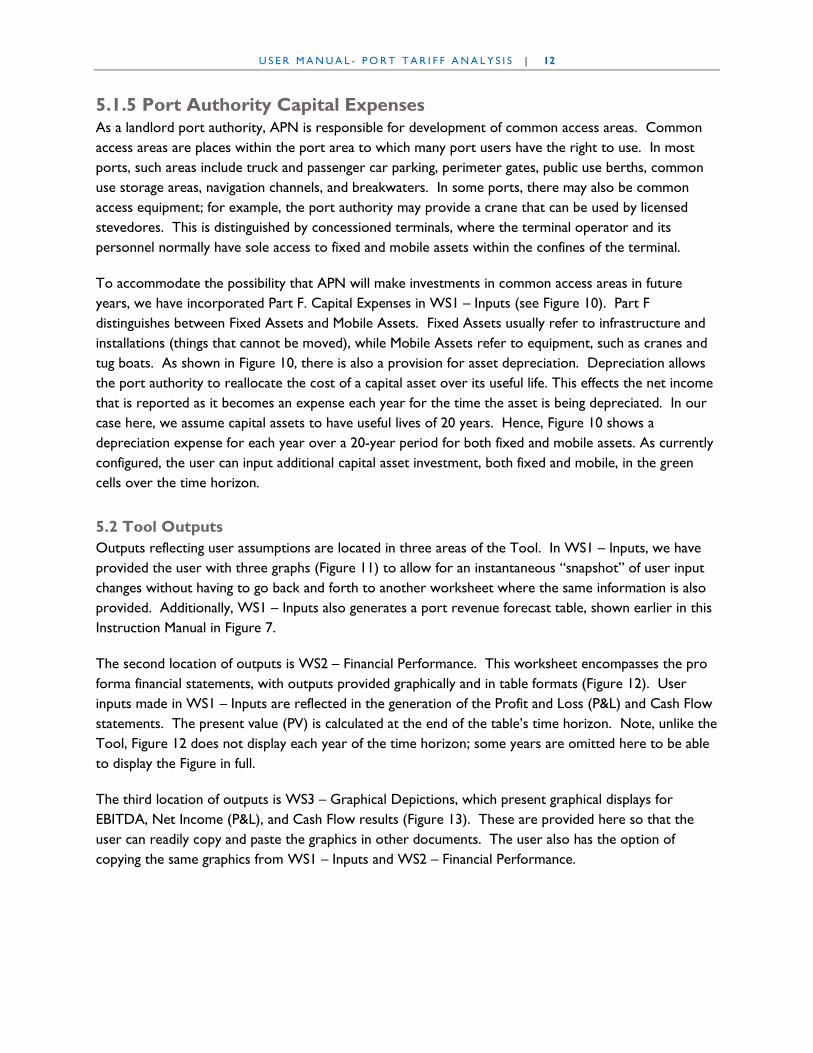
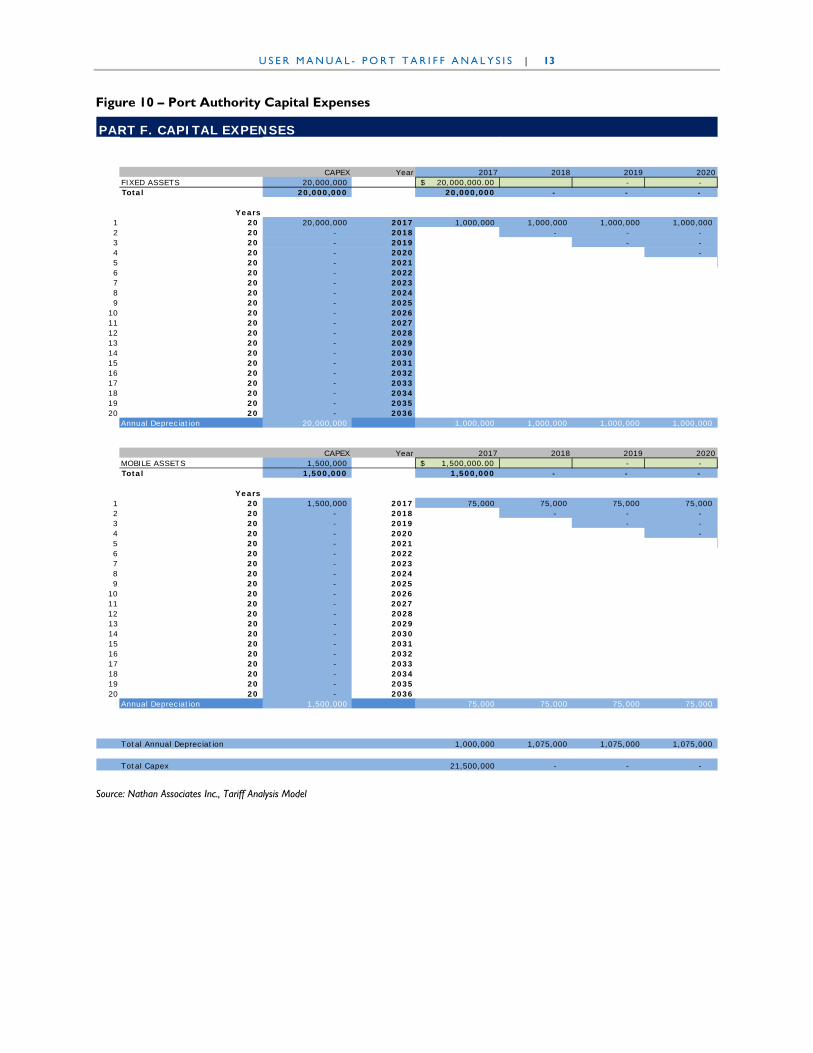
5.1.5 Port Authority Capital Expenses As a landlord port authority, APN is responsible for development of common access areas. Common access areas are places within the port area to which many port users have the right to use. In most ports, such areas include truck and passenger car parking, perimeter gates, public use berths, common use storage areas, navigation channels, and breakwaters. In some ports, there may also be common access equipment; for example, the port authority may provide a crane that can be used by licensed stevedores. This is distinguished by concessioned terminals, where the terminal operator and its personnel normally have sole access to fixed and mobile assets within the confines of the terminal.
To accommodate the possibility that APN will make investments in common access areas in future years, we have incorporated Part F. Capital Expenses in WS1 – Inputs (see Figure 10). Part F distinguishes between Fixed Assets and Mobile Assets. Fixed Assets usually refer to infrastructure and installations (things that cannot be moved), while Mobile Assets refer to equipment, such as cranes and tug boats. As shown in Figure 10, there is also a provision for asset depreciation. Depreciation allows the port authority to reallocate the cost of a capital asset over its useful life. This effects the net income that is reported as it becomes an expense each year for the time the asset is being depreciated. In our case here, we assume capital assets to have useful lives of 20 years. Hence, Figure 10 shows a depreciation expense for each year over a 20-year period for both fixed and mobile assets. As currently configured, the user can input additional capital asset investment, both fixed and mobile, in the green cells over the time horizon.
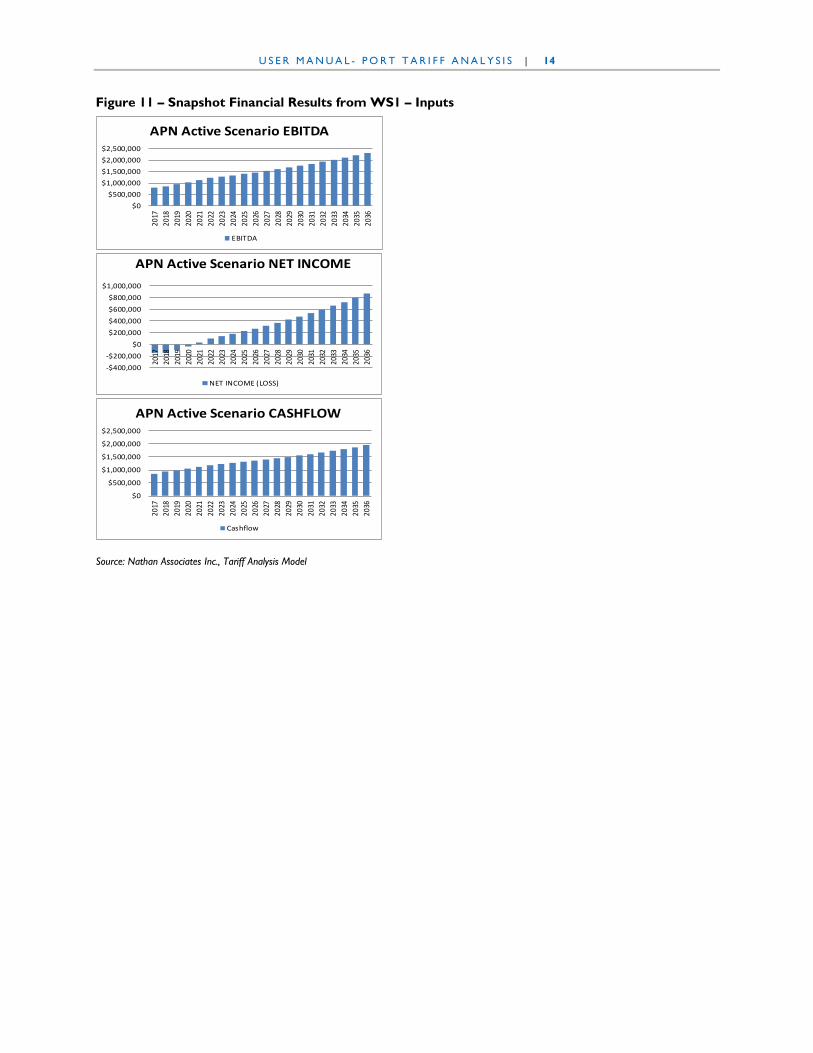
5.2 Tool Outputs Outputs reflecting user assumptions are located in three areas of the Tool. In WS1 – Inputs, we have provided the user with three graphs (Figure 11) to allow for an instantaneous “snapshot” of user input changes without having to go back and forth to another worksheet where the same information is also provided. Additionally, WS1 – Inputs also generates a port revenue forecast table, shown earlier in this Instruction Manual in Figure 7.
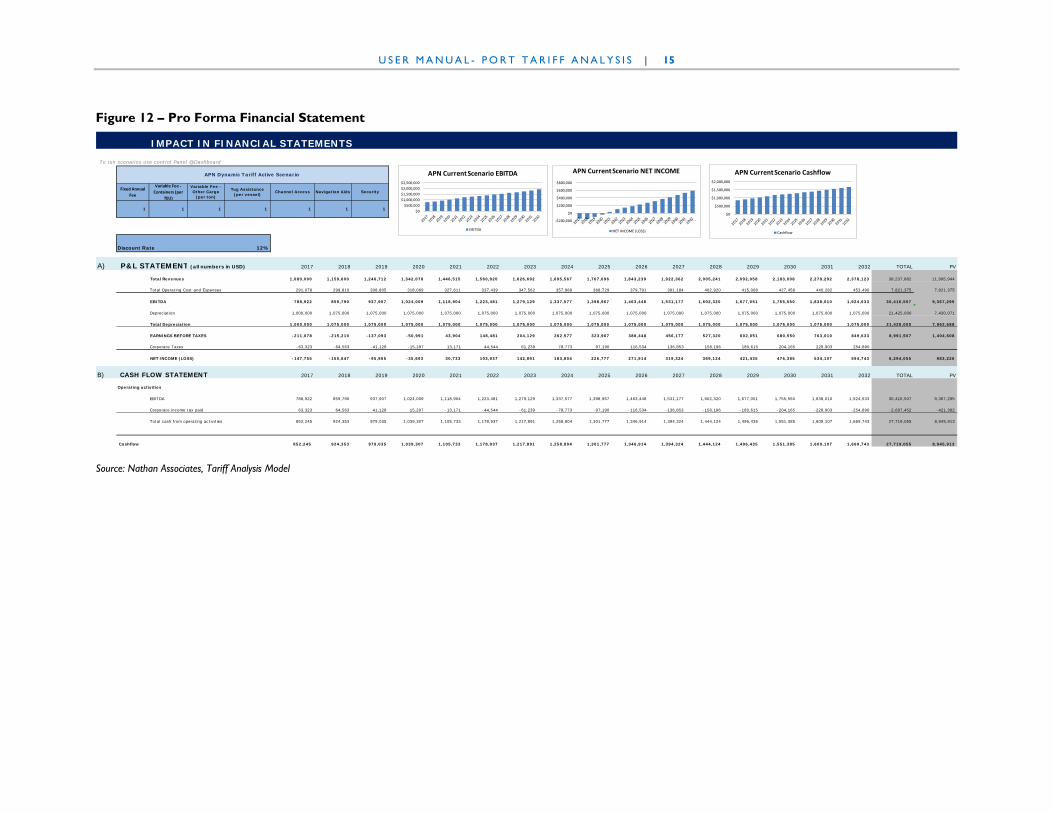
The second location of outputs is WS2 – Financial Performance. This worksheet encompasses the pro forma financial statements, with outputs provided graphically and in table formats (Figure 12). User inputs made in WS1 – Inputs are reflected in the generation of the Profit and Loss (P&L) and Cash Flow statements. The present value (PV) is calculated at the end of the table’s time horizon. Note, unlike the Tool, Figure 12 does not display each year of the time horizon; some years are omitted here to be able to display the Figure in full.
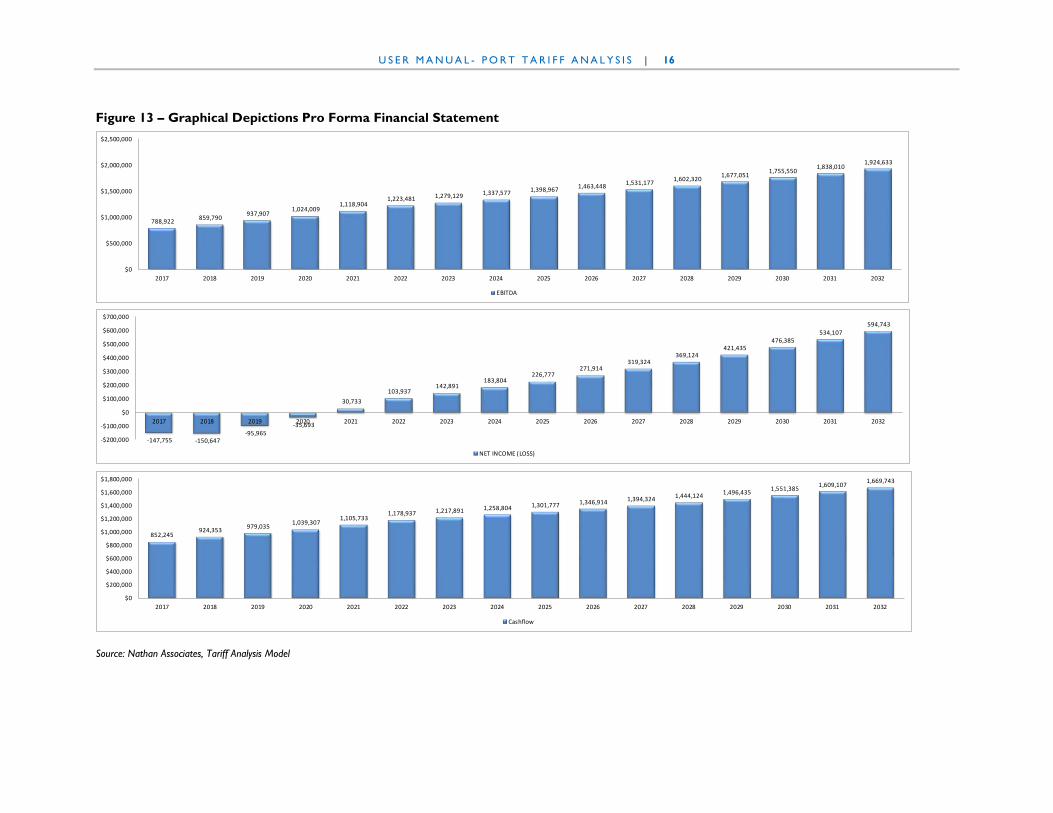
The third location of outputs is WS3 – Graphical Depictions, which present graphical displays for EBITDA, Net Income (P&L), and Cash Flow results (Figure 13). These are provided here so that the user can readily copy and paste the graphics in other documents. The user also has the option of copying the same graphics from WS1 – Inputs and WS2 – Financial Performance.
U S E R M A N U A L - P O R T T A R I F F A N A L Y S I S | 13
Figure 10 – Port Authority Capital Expenses
Source: Nathan Associates Inc., Tariff Analysis Model
PART F. CAPITAL EXPENSES
CAPEX Year 2017 2018 2019 2020FIXED ASSETS 20,000,000 20,000,000.00$ - - Total 20,000,000 20,000,000 - - -
Years1 20 20,000,000 2017 1,000,000 1,000,000 1,000,000 1,000,000 2 20 - 2018 - - - 3 20 - 2019 - - 4 20 - 2020 - 5 20 - 20216 20 - 20227 20 - 20238 20 - 20249 20 - 2025
10 20 - 202611 20 - 202712 20 - 202813 20 - 202914 20 - 203015 20 - 203116 20 - 203217 20 - 203318 20 - 203419 20 - 203520 20 - 2036
Annual Depreciation 20,000,000 1,000,000 1,000,000 1,000,000 1,000,000
CAPEX Year 2017 2018 2019 2020MOBILE ASSETS 1,500,000 1,500,000.00$ - - Total 1,500,000 1,500,000 - - -
Years1 20 1,500,000 2017 75,000 75,000 75,000 75,000 2 20 - 2018 - - - 3 20 - 2019 - - 4 20 - 2020 - 5 20 - 20216 20 - 20227 20 - 20238 20 - 20249 20 - 2025
10 20 - 202611 20 - 202712 20 - 202813 20 - 202914 20 - 203015 20 - 203116 20 - 203217 20 - 203318 20 - 203419 20 - 203520 20 - 2036
Annual Depreciation 1,500,000 75,000 75,000 75,000 75,000
Total Annual Depreciation 1,000,000 1,075,000 1,075,000 1,075,000
Total Capex 21,500,000 - - -
U S E R M A N U A L - P O R T T A R I F F A N A L Y S I S | 14
Figure 11 – Snapshot Financial Results from WS1 – Inputs
Source: Nathan Associates Inc., Tariff Analysis Model
$0$500,000
$1,000,000$1,500,000$2,000,000$2,500,000
2017
2018
2019
2020
2021
2022
2023
2024
2025
2026
2027
2028
2029
2030
2031
2032
2033
2034
2035
2036
APN Active Scenario EBITDA
EBITDA
-$400,000-$200,000
$0$200,000$400,000$600,000$800,000
$1,000,000
2017
2018
2019
2020
2021
2022
2023
2024
2025
2026
2027
2028
2029
2030
2031
2032
2033
2034
2035
2036
APN Active Scenario NET INCOME
NET INCOME (LOSS)
$0
$500,000
$1,000,000
$1,500,000
$2,000,000
$2,500,000
2017
2018
2019
2020
2021
2022
2023
2024
2025
2026
2027
2028
2029
2030
2031
2032
2033
2034
2035
2036
APN Active Scenario CASHFLOW
Cashflow
U S E R M A N U A L - P O R T T A R I F F A N A L Y S I S | 15
Figure 12 – Pro Forma Financial Statement
Source: Nathan Associates, Tariff Analysis Model
IMPACT IN FINANCIAL STATEMENTS
To run scenarios use control Panel @Dashboard
Fixed Annual Fee
Variable Fee - Containers (per
TEU)
Variable Fee - Other Cargo
(per ton)
Tug Assistance (per vessel)
Channel Access Navigation Aids Security
1 1 1 1 1 1 1
Discount Rate 12%
A) P&L STATEMENT (all numbers in USD) 2017 2018 2019 2020 2021 2022 2023 2024 2025 2026 2027 2028 2029 2030 2031 2032 TOTAL PV
Total Revenues 1,080,000 1,159,600 1,246,712 1,342,078 1,446,515 1,560,920 1,626,692 1,695,567 1,767,696 1,843,239 1,922,362 2,005,241 2,092,058 2,183,008 2,278,292 2,378,123 38,237,882 11,995,944
Total Operating Cost and Expenses 291,078 299,810 308,805 318,069 327,611 337,439 347,562 357,989 368,729 379,791 391,184 402,920 415,008 427,458 440,282 453,490 7,821,375 7,821,375
EBITDA 788,922 859,790 937,907 1,024,009 1,118,904 1,223,481 1,279,129 1,337,577 1,398,967 1,463,448 1,531,177 1,602,320 1,677,051 1,755,550 1,838,010 1,924,633 30,416,507 9,367,295
Depreciation 1,000,000 1,075,000 1,075,000 1,075,000 1,075,000 1,075,000 1,075,000 1,075,000 1,075,000 1,075,000 1,075,000 1,075,000 1,075,000 1,075,000 1,075,000 1,075,000 21,425,000 7,430,071
Total Depreciation 1,000,000 1,075,000 1,075,000 1,075,000 1,075,000 1,075,000 1,075,000 1,075,000 1,075,000 1,075,000 1,075,000 1,075,000 1,075,000 1,075,000 1,075,000 1,075,000 21,425,000 7,962,688
EARNINGS BEFORE TAXES -211,078 -215,210 -137,093 -50,991 43,904 148,481 204,129 262,577 323,967 388,448 456,177 527,320 602,051 680,550 763,010 849,633 8,991,507 1,404,608
Corporate Taxes -63,323 -64,563 -41,128 -15,297 13,171 44,544 61,239 78,773 97,190 116,534 136,853 158,196 180,615 204,165 228,903 254,890
NET INCOME (LOSS) -147,755 -150,647 -95,965 -35,693 30,733 103,937 142,891 183,804 226,777 271,914 319,324 369,124 421,435 476,385 534,107 594,743 6,294,055 983,226
B) CASH FLOW STATEMENT 2017 2018 2019 2020 2021 2022 2023 2024 2025 2026 2027 2028 2029 2030 2031 2032 TOTAL PV
Operating activities
EBITDA 788,922 859,790 937,907 1,024,009 1,118,904 1,223,481 1,279,129 1,337,577 1,398,967 1,463,448 1,531,177 1,602,320 1,677,051 1,755,550 1,838,010 1,924,633 30,416,507 9,367,295
Corporate income tax paid 63,323 64,563 41,128 15,297 -13,171 -44,544 -61,239 -78,773 -97,190 -116,534 -136,853 -158,196 -180,615 -204,165 -228,903 -254,890 -2,697,452 -421,382
Total cash from operating activities 852,245 924,353 979,035 1,039,307 1,105,733 1,178,937 1,217,891 1,258,804 1,301,777 1,346,914 1,394,324 1,444,124 1,496,435 1,551,385 1,609,107 1,669,743 27,719,055 8,945,913
Cashflow 852,245 924,353 979,035 1,039,307 1,105,733 1,178,937 1,217,891 1,258,804 1,301,777 1,346,914 1,394,324 1,444,124 1,496,435 1,551,385 1,609,107 1,669,743 27,719,055 8,945,913
APN Dynamic Tariff Active Scenario
$0$500,000
$1,000,000$1,500,000$2,000,000$2,500,000
APN Current Scenario EBITDA
EBITDA
-$200,000
$0
$200,000
$400,000
$600,000
$800,000
APN Current Scenario NET INCOME
NET INCOME (LOSS)
$0
$500,000
$1,000,000
$1,500,000
$2,000,000
APN Current Scenario Cashflow
Cashflow
U S E R M A N U A L - P O R T T A R I F F A N A L Y S I S | 16
Figure 13 – Graphical Depictions Pro Forma Financial Statement
Source: Nathan Associates, Tariff Analysis Model
788,922 859,790 937,907 1,024,009
1,118,904 1,223,481 1,279,129 1,337,577 1,398,967 1,463,448 1,531,177 1,602,320 1,677,051 1,755,550
1,838,010 1,924,633
$0
$500,000
$1,000,000
$1,500,000
$2,000,000
$2,500,000
2017 2018 2019 2020 2021 2022 2023 2024 2025 2026 2027 2028 2029 2030 2031 2032
EBITDA
-147,755 -150,647 -95,965
-35,693
30,733 103,937
142,891 183,804
226,777 271,914
319,324 369,124
421,435 476,385
534,107 594,743
-$200,000
-$100,000
$0
$100,000
$200,000
$300,000
$400,000
$500,000
$600,000
$700,000
2017 2018 2019 2020 2021 2022 2023 2024 2025 2026 2027 2028 2029 2030 2031 2032
NET INCOME (LOSS)
852,245 924,353 979,035 1,039,307
1,105,733 1,178,937 1,217,891 1,258,804 1,301,777 1,346,914 1,394,324 1,444,124 1,496,435 1,551,385 1,609,107 1,669,743
$0
$200,000
$400,000
$600,000
$800,000
$1,000,000
$1,200,000
$1,400,000
$1,600,000
$1,800,000
2017 2018 2019 2020 2021 2022 2023 2024 2025 2026 2027 2028 2029 2030 2031 2032
Cashflow
U S E R M A N U A L - P O R T T A R I F F A N A L Y S I S | 17
5. A PRACTICE RUN
Armed with the descriptions and instructions provided above, the user will now proceed through a practice run. The intent is to provide the user with some assumptions to achieve the results that should be generated given these assumptions. This practice run will provide the user with familiarity for inputting assumptions and generating correct outputs. In the following, we will provide assumptions that the user should input into the Tool. We will then present the pro forma financials that should be generated given these inputs.
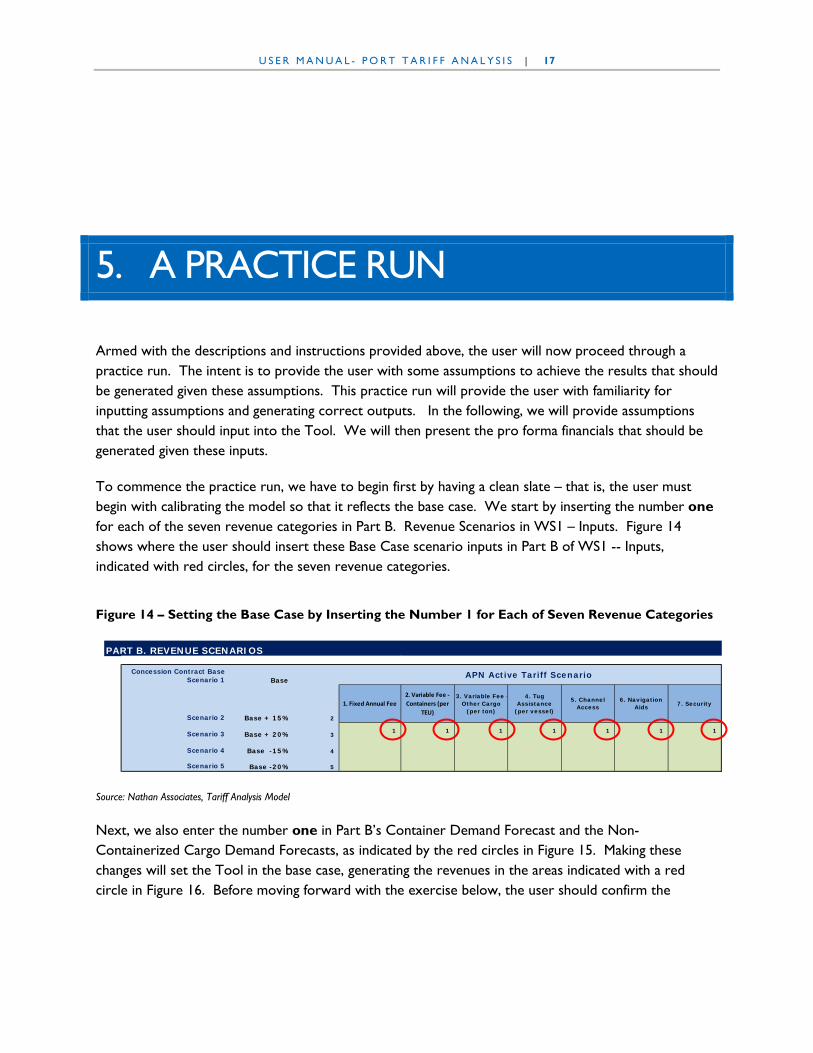
To commence the practice run, we have to begin first by having a clean slate – that is, the user must begin with calibrating the model so that it reflects the base case. We start by inserting the number one for each of the seven revenue categories in Part B. Revenue Scenarios in WS1 – Inputs. Figure 14 shows where the user should insert these Base Case scenario inputs in Part B of WS1 -- Inputs, indicated with red circles, for the seven revenue categories.
Figure 14 – Setting the Base Case by Inserting the Number 1 for Each of Seven Revenue Categories
Source: Nathan Associates, Tariff Analysis Model
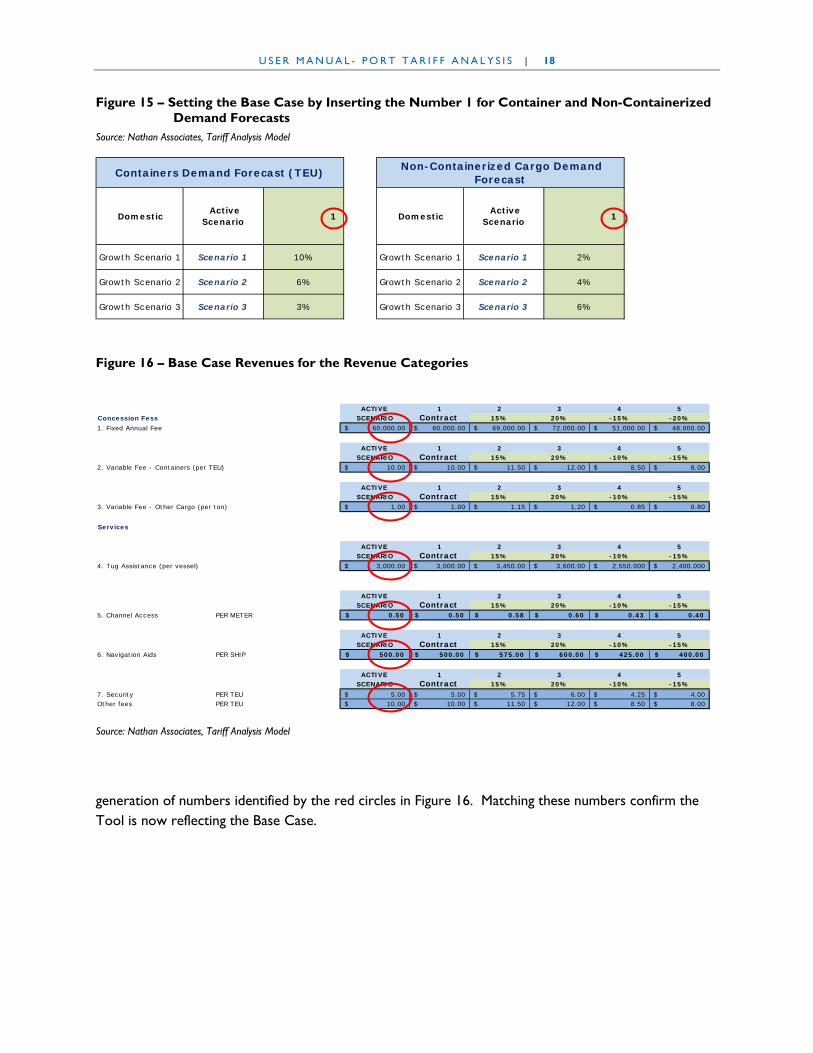
Next, we also enter the number one in Part B’s Container Demand Forecast and the Non-Containerized Cargo Demand Forecasts, as indicated by the red circles in Figure 15. Making these changes will set the Tool in the base case, generating the revenues in the areas indicated with a red circle in Figure 16. Before moving forward with the exercise below, the user should confirm the
PART B. REVENUE SCENARIOS
Concession Contract Base Scenario 1 Base
Scenario 2 Base + 15% 2
1. Fixed Annual Fee2. Variable Fee - Containers (per
TEU)
3. Variable Fee - Other Cargo
(per ton)
4. Tug Assistance
(per vessel)
5. Channel Access
6. Navigation Aids 7. Security
Scenario 3 Base + 20% 3 1 1 1 1 1 1 1
Scenario 4 Base -15% 4
Scenario 5 Base -20% 5
APN Active Tariff Scenario
U S E R M A N U A L - P O R T T A R I F F A N A L Y S I S | 18
Figure 15 – Setting the Base Case by Inserting the Number 1 for Container and Non-Containerized Demand Forecasts
Source: Nathan Associates, Tariff Analysis Model
Figure 16 – Base Case Revenues for the Revenue Categories
Source: Nathan Associates, Tariff Analysis Model
generation of numbers identified by the red circles in Figure 16. Matching these numbers confirm the Tool is now reflecting the Base Case.
ACTIVE 1 2 3 4 5Concession Fess SCENARIO Contract 15% 20% -15% -20%1. Fixed Annual Fee 60,000.00$ 60,000.00$ 69,000.00$ 72,000.00$ 51,000.00$ 48,000.00$
ACTIVE 1 2 3 4 5SCENARIO Contract 15% 20% -10% -15%
2. Variable Fee - Containers (per TEU) 10.00$ 10.00$ 11.50$ 12.00$ 8.50$ 8.00$
ACTIVE 1 2 3 4 5SCENARIO Contract 15% 20% -10% -15%
3. Variable Fee - Other Cargo (per ton) 1.00$ 1.00$ 1.15$ 1.20$ 0.85$ 0.80$
Services
ACTIVE 1 2 3 4 5SCENARIO Contract 15% 20% -10% -15%
4. Tug Assistance (per vessel) 3,000.00$ 3,000.00$ 3,450.00$ 3,600.00$ 2,550.000$ 2,400.000$
ACTIVE 1 2 3 4 5SCENARIO Contract 15% 20% -10% -15%
5. Channel Access PER METER 0.50$ 0.50$ 0.58$ 0.60$ 0.43$ 0.40$
ACTIVE 1 2 3 4 5SCENARIO Contract 15% 20% -10% -15%
6. Navigation Aids PER SHIP 500.00$ 500.00$ 575.00$ 600.00$ 425.00$ 400.00$
ACTIVE 1 2 3 4 5SCENARIO Contract 15% 20% -10% -15%
7. Security PER TEU 5.00$ 5.00$ 5.75$ 6.00$ 4.25$ 4.00$ Other fees PER TEU 10.00$ 10.00$ 11.50$ 12.00$ 8.50$ 8.00$
Domestic Active
Scenario 1 Domestic Active
Scenario 1
Growth Scenario 1 Scenario 1 10% Growth Scenario 1 Scenario 1 2%
Growth Scenario 2 Scenario 2 6% Growth Scenario 2 Scenario 2 4%
Growth Scenario 3 Scenario 3 3% Growth Scenario 3 Scenario 3 6%
Non-Containerized Cargo Demand Forecast Containers Demand Forecast (TEU)
U S E R M A N U A L - P O R T T A R I F F A N A L Y S I S | 19
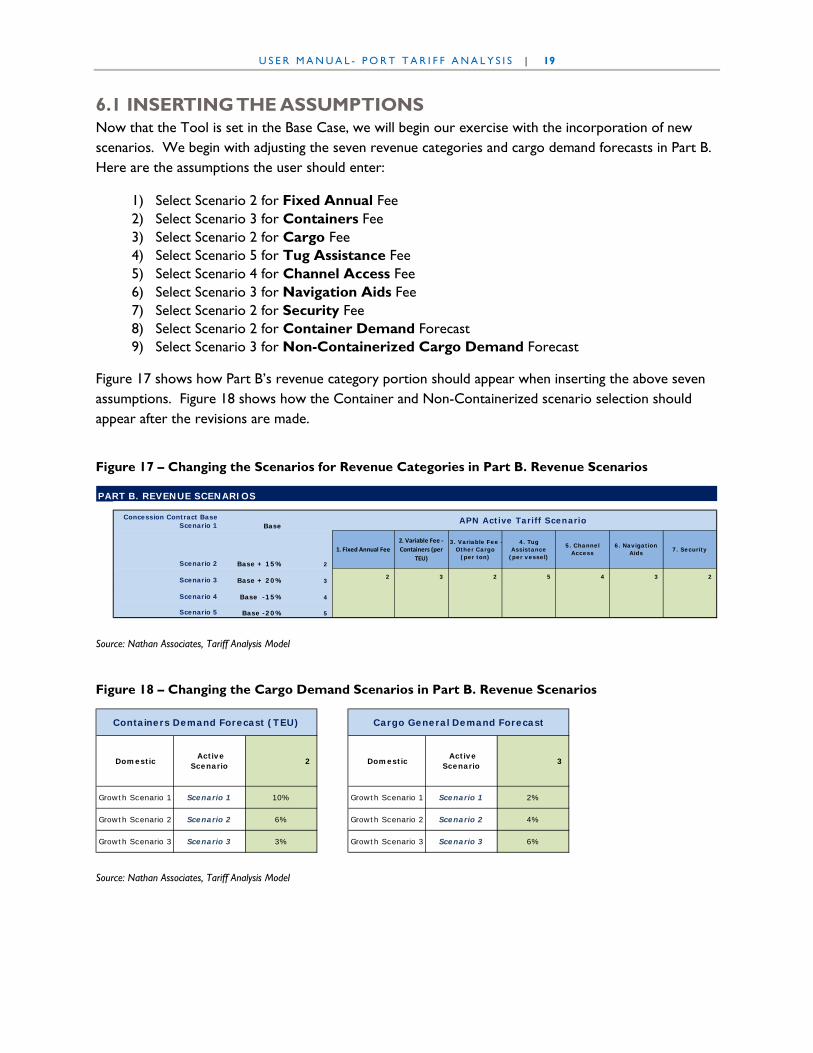
6.1 INSERTING THE ASSUMPTIONS Now that the Tool is set in the Base Case, we will begin our exercise with the incorporation of new scenarios. We begin with adjusting the seven revenue categories and cargo demand forecasts in Part B. Here are the assumptions the user should enter:
1) Select Scenario 2 for Fixed Annual Fee 2) Select Scenario 3 for Containers Fee 3) Select Scenario 2 for Cargo Fee 4) Select Scenario 5 for Tug Assistance Fee 5) Select Scenario 4 for Channel Access Fee 6) Select Scenario 3 for Navigation Aids Fee 7) Select Scenario 2 for Security Fee 8) Select Scenario 2 for Container Demand Forecast 9) Select Scenario 3 for Non-Containerized Cargo Demand Forecast
Figure 17 shows how Part B’s revenue category portion should appear when inserting the above seven assumptions. Figure 18 shows how the Container and Non-Containerized scenario selection should appear after the revisions are made.
Figure 17 – Changing the Scenarios for Revenue Categories in Part B. Revenue Scenarios
Source: Nathan Associates, Tariff Analysis Model
Figure 18 – Changing the Cargo Demand Scenarios in Part B. Revenue Scenarios
Source: Nathan Associates, Tariff Analysis Model
PART B. REVENUE SCENARIOS
Concession Contract Base Scenario 1 Base
Scenario 2 Base + 15% 2
1. Fixed Annual Fee2. Variable Fee - Containers (per
TEU)
3. Variable Fee - Other Cargo
(per ton)
4. Tug Assistance
(per vessel)
5. Channel Access
6. Navigation Aids 7. Security
Scenario 3 Base + 20% 3 2 3 2 5 4 3 2
Scenario 4 Base -15% 4
Scenario 5 Base -20% 5
APN Active Tariff Scenario
Domestic Active
Scenario 2 Domestic Active
Scenario 3
Growth Scenario 1 Scenario 1 10% Growth Scenario 1 Scenario 1 2%
Growth Scenario 2 Scenario 2 6% Growth Scenario 2 Scenario 2 4%
Growth Scenario 3 Scenario 3 3% Growth Scenario 3 Scenario 3 6%
Cargo General Demand Forecast Containers Demand Forecast (TEU)

U S E R M A N U A L - P O R T T A R I F F A N A L Y S I S | 20
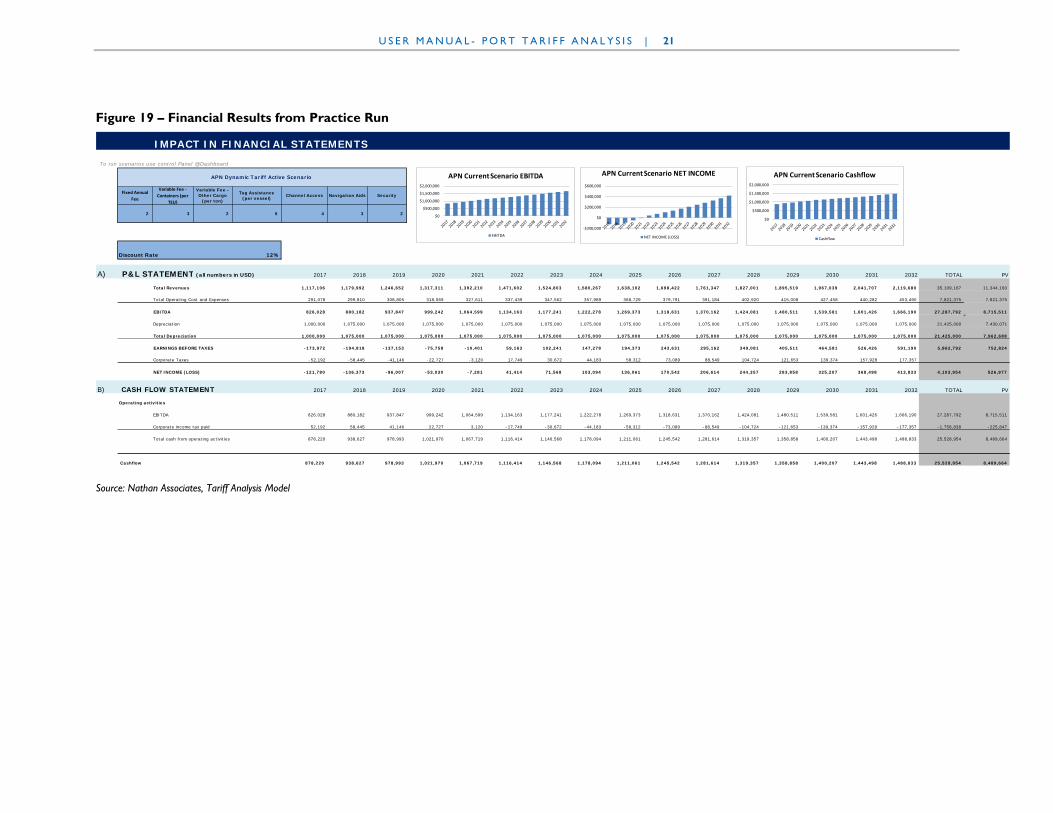
The changes to the scenarios will have an effect on the port authority’s financial performance results (WS2 – Financial Performance). Figure 19 presents the pro forma financial statements that should be generated when the user makes the scenario changes as instructed above. If the financial results the user generates are different from those presented in Figure 19, then the user should return to WS1 – Inputs and ensure changes were made as earlier instructed.
U S E R M A N U A L - P O R T T A R I F F A N A L Y S I S | 21
Figure 19 – Financial Results from Practice Run
Source: Nathan Associates, Tariff Analysis Model
IMPACT IN FINANCIAL STATEMENTSTo run scenarios use control Panel @Dashboard
Fixed Annual Fee
Variable Fee - Containers (per
TEU)
Variable Fee - Other Cargo
(per ton)
Tug Assistance (per vessel)
Channel Access Navigation Aids Security
2 3 2 5 4 3 2
Discount Rate 12%
A) P&L STATEMENT (all numbers in USD) 2017 2018 2019 2020 2021 2022 2023 2024 2025 2026 2027 2028 2029 2030 2031 2032 TOTAL PV
Total Revenues 1,117,106 1,179,992 1,246,652 1,317,311 1,392,210 1,471,602 1,524,803 1,580,267 1,638,102 1,698,422 1,761,347 1,827,001 1,895,519 1,967,039 2,041,707 2,119,680 35,109,167 11,344,160
Total Operating Cost and Expenses 291,078 299,810 308,805 318,069 327,611 337,439 347,562 357,989 368,729 379,791 391,184 402,920 415,008 427,458 440,282 453,490 7,821,375 7,821,375
EBITDA 826,028 880,182 937,847 999,242 1,064,599 1,134,163 1,177,241 1,222,278 1,269,373 1,318,631 1,370,162 1,424,081 1,480,511 1,539,581 1,601,426 1,666,190 27,287,792 8,715,511
Depreciation 1,000,000 1,075,000 1,075,000 1,075,000 1,075,000 1,075,000 1,075,000 1,075,000 1,075,000 1,075,000 1,075,000 1,075,000 1,075,000 1,075,000 1,075,000 1,075,000 21,425,000 7,430,071
Total Depreciation 1,000,000 1,075,000 1,075,000 1,075,000 1,075,000 1,075,000 1,075,000 1,075,000 1,075,000 1,075,000 1,075,000 1,075,000 1,075,000 1,075,000 1,075,000 1,075,000 21,425,000 7,962,688
EARNINGS BEFORE TAXES -173,972 -194,818 -137,153 -75,758 -10,401 59,163 102,241 147,278 194,373 243,631 295,162 349,081 405,511 464,581 526,426 591,190 5,862,792 752,824
Corporate Taxes -52,192 -58,445 -41,146 -22,727 -3,120 17,749 30,672 44,183 58,312 73,089 88,549 104,724 121,653 139,374 157,928 177,357
NET INCOME (LOSS) -121,780 -136,373 -96,007 -53,030 -7,281 41,414 71,568 103,094 136,061 170,542 206,614 244,357 283,858 325,207 368,498 413,833 4,103,954 526,977
B) CASH FLOW STATEMENT 2017 2018 2019 2020 2021 2022 2023 2024 2025 2026 2027 2028 2029 2030 2031 2032 TOTAL PV
Operating activities
EBITDA 826,028 880,182 937,847 999,242 1,064,599 1,134,163 1,177,241 1,222,278 1,269,373 1,318,631 1,370,162 1,424,081 1,480,511 1,539,581 1,601,426 1,666,190 27,287,792 8,715,511
Corporate income tax paid 52,192 58,445 41,146 22,727 3,120 -17,749 -30,672 -44,183 -58,312 -73,089 -88,549 -104,724 -121,653 -139,374 -157,928 -177,357 -1,758,838 -225,847
Total cash from operating activities 878,220 938,627 978,993 1,021,970 1,067,719 1,116,414 1,146,568 1,178,094 1,211,061 1,245,542 1,281,614 1,319,357 1,358,858 1,400,207 1,443,498 1,488,833 25,528,954 8,489,664
Cashflow 878,220 938,627 978,993 1,021,970 1,067,719 1,116,414 1,146,568 1,178,094 1,211,061 1,245,542 1,281,614 1,319,357 1,358,858 1,400,207 1,443,498 1,488,833 25,528,954 8,489,664
APN Dynamic Tariff Active Scenario
$0
$500,000
$1,000,000
$1,500,000
$2,000,000
APN Current Scenario EBITDA
EBITDA
-$200,000
$0
$200,000
$400,000
$600,000
APN Current Scenario NET INCOME
NET INCOME (LOSS)
$0
$500,000
$1,000,000
$1,500,000
$2,000,000
APN Current Scenario Cashflow
Cashflow