user manual for delphos viewer in anywave
TRANSCRIPT
User manual for Delphos Viewer in AnyWave
Nicolas ROEHRIAix Marseille Univ,
Inserm,INS, Institut de Neurosciences des Systèmes
Marseille, France,Version 1.0
Contents
1 Preamble 2
2 How to cite 2
3 Requirements 3
4 Usage 44.1 Main panel, Fig. 3 A . . . . . . . . . . . . . . . . . . . . . . . . . . . . . . . . . . . . . . 44.2 Parameters Panel, Fig. 3 A . . . . . . . . . . . . . . . . . . . . . . . . . . . . . . . . . . . 44.3 Markers Panel, Fig. 3 B . . . . . . . . . . . . . . . . . . . . . . . . . . . . . . . . . . . . . 64.4 Set Axis Panel, Fig. 3 C . . . . . . . . . . . . . . . . . . . . . . . . . . . . . . . . . . . . . 64.5 Detection Panel, Fig. 3 D . . . . . . . . . . . . . . . . . . . . . . . . . . . . . . . . . . . . 74.6 Extra Panel, Fig. 3 E . . . . . . . . . . . . . . . . . . . . . . . . . . . . . . . . . . . . . . 7
Figure 1: Delphos Viewer splash screen
1
2 HOW TO CITE
1 Preamble
Delphos, standing for Detector of ElectroPhysiological Oscillations and Spikes, is a detector based onthe ZH0-normalisation of the wavelet transform described in [Roehri et al., 2016]. As its name suggests,Delphos was designed to detect both oscillations and spikes. Moreover, because the detection happens inthe time-frequency plane, the oscillations are not restrain to a frequency band. Two separate interfaces weredeveloped: Delphos and Delphos Viewer, the multi-channel detection algorithm and the single channel re-viewer, respectively. This manual is for the Delphos Viewer.Delphos Viewer was designed to display the raw signal of a single channel along its ZH0 whitened time-domain and time-frequency versions and to review previously marked events.
2 How to cite
Please cite Delphos using [Roehri et al., 2016] for the method and [Roehri et al., 2017] for the validation.
2
3 REQUIREMENTS
3 Requirements
• Delphos_Viewer.zip: Zip folder containing Delphos Viewer plugin and required components,
• MCR_R2018b_win64_installer.exe: Matlab Runtime Executable 2018b.
Delphos_Viewer.zip must be unzip in C:\Documents\AnyWave\Plugins\Matlab\Delphos_Viewer.MCR_R2018b_win64_installer will install a Matlab engine to run compiled code such as Delphos Viewer.
3
4 USAGE
4 Usage
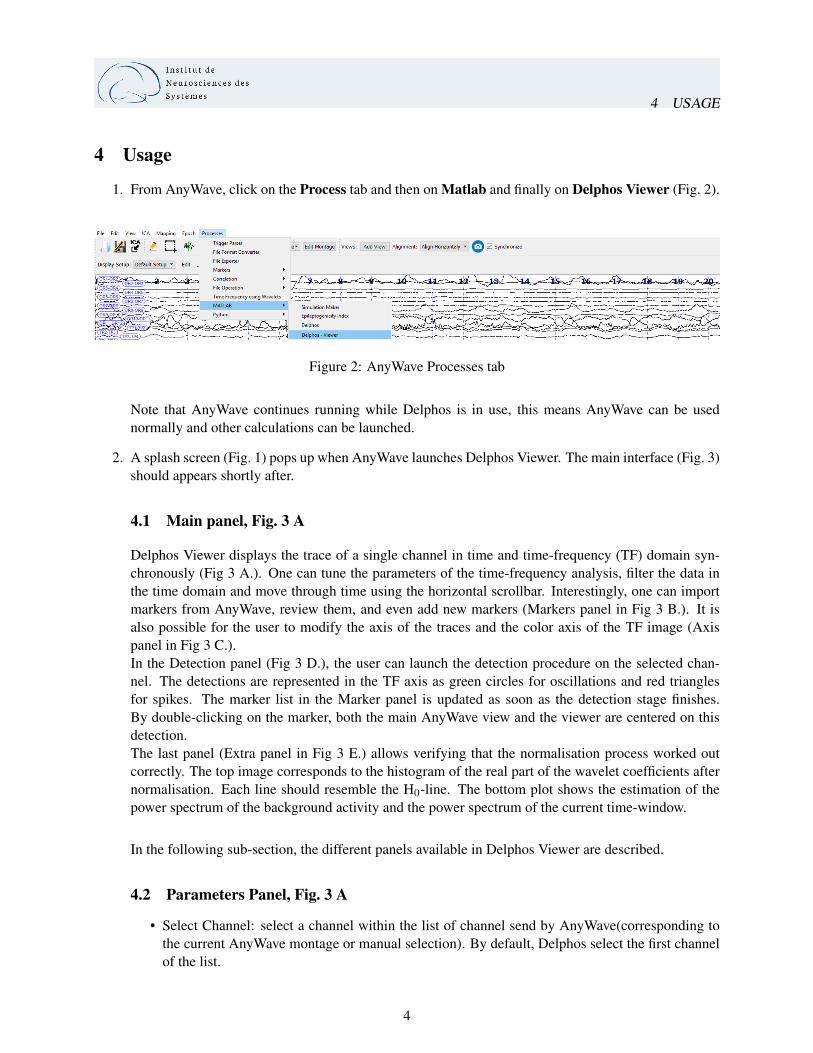
1. From AnyWave, click on the Process tab and then on Matlab and finally on Delphos Viewer (Fig. 2).
Figure 2: AnyWave Processes tab
Note that AnyWave continues running while Delphos is in use, this means AnyWave can be usednormally and other calculations can be launched.
2. A splash screen (Fig. 1) pops up when AnyWave launches Delphos Viewer. The main interface (Fig. 3)should appears shortly after.
4.1 Main panel, Fig. 3 A
Delphos Viewer displays the trace of a single channel in time and time-frequency (TF) domain syn-chronously (Fig 3 A.). One can tune the parameters of the time-frequency analysis, filter the data inthe time domain and move through time using the horizontal scrollbar. Interestingly, one can importmarkers from AnyWave, review them, and even add new markers (Markers panel in Fig 3 B.). It isalso possible for the user to modify the axis of the traces and the color axis of the TF image (Axispanel in Fig 3 C.).In the Detection panel (Fig 3 D.), the user can launch the detection procedure on the selected chan-nel. The detections are represented in the TF axis as green circles for oscillations and red trianglesfor spikes. The marker list in the Marker panel is updated as soon as the detection stage finishes.By double-clicking on the marker, both the main AnyWave view and the viewer are centered on thisdetection.The last panel (Extra panel in Fig 3 E.) allows verifying that the normalisation process worked outcorrectly. The top image corresponds to the histogram of the real part of the wavelet coefficients afternormalisation. Each line should resemble the H0-line. The bottom plot shows the estimation of thepower spectrum of the background activity and the power spectrum of the current time-window.
In the following sub-section, the different panels available in Delphos Viewer are described.
4.2 Parameters Panel, Fig. 3 A
• Select Channel: select a channel within the list of channel send by AnyWave(corresponding tothe current AnyWave montage or manual selection). By default, Delphos select the first channelof the list.
4

4.2 Parameters Panel, Fig. 3 A 4 USAGE
Figure 3: Delphos Viewer interface and the different panels. A. Main frame which displays the traces inoriginal and whitened time domains above the whitened time-frequency image. The associated panel handlesthe parameters such as the channel selection or the filtering settings. B. Marker panel. C. Axis Setting panel.D. Detection panel. E. Extra panel for sanity check.
5
4.3 Markers Panel, Fig. 3 B 4 USAGE
• Duration: set the beginning and duration (in seconds) of the section to be analysed. By default,Delphos analyses 5 minutes (duration = 300s) – or the duration of the file if shorter than 5 minutes– starting from the beginning (start = 0s). To tell Delphos to analyse the whole section you haveto set start at 0 and write all in duration.
• Wavelet Settings:
– the number of voices corresponds to the resolution of the time-frequency plane (similar tothe frequency step in linear scale but in log-scale). Lowering the number of voices speedsup the analysis but lower the sensitivity of the detection.
– the vanishing moment controls the time and frequency resolution of the wavelet. The greater,the higher the frequency resolution but the lower the time resolution.
• Time window: size of the time window displaying the different raw and transformed signals.
• Filter Raw Signal: panel to filter the raw signal. Set the filter to on to display the filtered signal.
• Filter Whitened Signal: panel to filter the whitened signal. Set the filter to on to display thefiltered signal.
• Time-frequency normalisation: permits to switch between z-H0 normalisation and no normali-sation. It is also possible to display the real part of the wavelet (instead of the usual power). The’Pulse Pattern’ allow displaying the impulse response of the wavelet transform. The ’Contour’button permits to show the iso-contour instead of all values.
• Go To: Permits to center the window at a specific timing in second.
4.3 Markers Panel, Fig. 3 B
• Import Marker: it imports the markers from AnyWave to Delphos Viewer.
• Default Marker Setting: set the label and value of the default marker used when a new marker isadded manually.
• Add Marker: Add a new marker in the list. Click on any window with a time-series to set thetiming. Make a drag-and-drop to set the duration.
• Go To Marker: Center the displayed window on the selected marker (in both Delphos - Viewerand AnyWave). Double clicking on a given marker in the marker list has the same effect.
• Edit Marker: Permit to modify the attributed of the selected marker.
• Sort by: It allows sorting the marker list according their latency, channel or label.
• Export Markers: Export the markers as AnyWave marker file (.mrk).
• Send To AnyWave: Send the markers from Delphos to AnyWave.
4.4 Set Axis Panel, Fig. 3 C
• Set Raw Axis: set the x-axis of the axis with the raw signal.
• Set Whitened Axis: set the x-axis of the axis with the whitened signal.
• Set Scalogram Axis: set the limit of the color map coding the time-frequency plane.
6

4.5 Detection Panel, Fig. 3 D 4 USAGE
4.5 Detection Panel, Fig. 3 D
In the installation folder of Delphos Viewer(C:\Documents\AnyWave\Plugins\Matlab\Delphos_Viewer),there is a file named default_ freqband.txt where default settings of the oscillations markers are set (la-bel, color and frequency bands) in a semicolon separated file. The first column corresponds to thelabel of the oscillation, the second and third columns to its lower and higher limits of its frequencyband respectively, and the last column to the color of the marker in hexadecimal. An example is givenbelow:
%%Oscillation name;lower frequency;higher frequencyVery Fast Osc;500;Inf;#ff00ffFast Ripple;250;500;#ff0000Ripple;80;250;#ff8000Gamma;24;80;#800000Beta;12.4;24;#00b000Alpha;7.4;12.4;#00b0b0Theta;3.5;7.4;#0070ffDelta;1;3.5;#0000ffInfra slow;0;1;#000090
• Detection Settings:
– Threshold corresponds to the level in the ZH0 time-frequency image separating the back-ground from an event of interest. Default is set to 40.
– Osc width thr is the lowest time width defining an oscillation,– Osc freq spread thr is the highest frequency spread defining an oscillation,– Spk width thr is the highest time width defining a spike,– Spk freq spread is the lowest frequency spread defining a spike,
• Detect Events: launch Delphos detector on the selected channel. The detected events will popu-late the marker list.
• Export Detection: export the detection and/or the candidate events in Matlab file. Candidateevents corresponds to events which exceeded the threshold but did not meet the other criteria.
• Set Bar Plot: Select the types of events you want to look at in the bar plot of the rates. Thedefault_freqband.txt file is used to define the name of the event type.
• Export Rates: Export the rates in an Excel file.
4.6 Extra Panel, Fig. 3 E
This panel permits to verify that the normalisation is done properly. The histograms (the counts arecolor coded) should be the same across frequencies. The power spectrum of the current window isdisplayed in blue in the bottom panel along with the estimated background power spectrum in orange.
7

References
[Roehri et al., 2016] Roehri, N., Lina, J.-M., Mosher, J. C., Bartolomei, F., and Bénar, C.-G. (2016). Time-frequency strategies for increasing high frequency oscillation detectability in intracerebral. IEEE Trans-actions on Biomedical Engineering, 63(12):2595–2606.
[Roehri et al., 2017] Roehri, N., Pizzo, F., Bartolomei, F., Wendling, F., and Bénar, C.-G. (2017). What arethe assets and weaknesses of HFO detectors? A benchmark framework based on realistic simulations.PLoS ONE, 12(4).
8