user habits, impact on energyconsumption in passive houses
DESCRIPTION
Results of a comprehensive long-term measurement This brochure describes the result of monitoring of Passive Houses in 6 alpine space regions. The study was commissioned by the project partner EURAC and provides an overview on energy consumption and living comfort of actual best practice buildings with the objective to examine problems of existing constructions, to evaluate the problem areas and derive solutions and expertise by collecting empirical values. The results can be used as support for impulses for the Alpine region enterprises dealing with energy efficiency in buildings and can help developers and technology suppliers by giving inputs for discussion and orientation on energy efficient buildings. The documented positive experiences of inhabitants are suitable for advertising and foster high energy efficient buildings in the alpine space.TRANSCRIPT

Result 5.4
June 2012
User habits, impact on energy consumption in passive housesResults of a comprehensive long-term measurement

Page 2 of 79 ENERBUILD: Final Result 5.4User habits, impact on energy consumption in passive houses
User habits, impact on energy consumption in passive housesResults of a comprehensive long-term measurement
IntroductionThe project ENERBUILD stands for Energy Effi-ciency and Renewable Energies in the Building Sector in the Alpine Space. It deals with critical points in the dissemination of know-how on energy-efficient and energy-producing buil-dings. Key factors identified by the transnati-onal consortium relate to vocational training, to additional research on user behavior, to role models in public construction, to financing of energy-producing plants on buildings and to the placement of sample planning processes around energy-efficient building.
This brochure describes the result of monitoring of Passive Houses in 6 alpine space regions. The study was commissioned by the project partner EURAC and provides an overview on energy consumption and living comfort of actual best practice buildings with the objective to examine problems of existing constructions, to evaluate the problem areas and derive solutions and ex-pertise by collecting empirical values.
The results can be used as support for impulses for the Alpine region enterprises dealing with energy efficiency in buildings and can help de-velopers and technology suppliers by giving inputs for discussion and orientation on energy efficient buildings. The documented positive ex-periences of inhabitants are suitable for adverti-sing and foster high energy efficient buildings in the alpine space.
Franz Rüf
Regional Development of Vorarlberg
Note on further results of ENERBUILD
Education
• Overview of education programs and voca-tional trainings for energy saving and produ-cing buildings in the Alpine Space
Examination
• Summarizing survey on existing buildings on healthy living with new and advanced construction technology
• Killer arguments and opportunities for en-ergy-efficient construction and the passive house
• User habits, impact on energy consumpti-on in passive houses - results of a compre-hensive long-term measurement
Efficiency
• Certification of energy-efficient public buil-dings Summary of instruments in the Alpine Space
• Transnational comparison of instruments ac-cording to ecological evaluation of public buildings
• ENERBUILD Tool: Transnational Pilot Testing on 46 Buildings and Experiences on Advisory Services
E-Producing
• Synthesis on producing energy on buildings in the Alpine Space
• Green Electricity? - Yes, please! 100% local Green Electricity in combination with private funding for the development of power plants on buildings using the example of Vorarlberg
• Eco Power Stock Exchange – In-depth infor-mation for monitoring offices
Innovation
• The Alpine World of Innovation - A collection of innovative examples in planning processes, pilot initiatives and stimulation of innovation
EditorsEURAC researchEuropean Academy of Bozen/Bolzano, www.eurac.edu
Regionalentwicklung Vorarlbergwww.leader-vlbg.at
Hochschule Rosenheimwww.fh-rosenheim.de
Standortargentur Tirolwww.zukunftsstiftung.at
Regione Piemontewww.regione.piemonte.it
Lucerne University of Applied Sciences and Arts Department of Engineering & Architecture on behalf of ZVDK (Zentralschweizer Volkswirt-schaftsdirektorenkonferenz), www.hslu.ch

ENERBUILD: Final Result 5.4 Page 3 of 79User habits, impact on energy consumption in passive houses
Table of Contents Editor:Dagmar ExnerHannes MahlknechtEurac research - European Academy of BolzanoInstitute for Renewable EnergyViale Druso 1 39100 Bozen T:+39 0471 055 055www.eurac.edu
Design:Peter SteurerRegionalentwicklung VorarlbergHof 196861 Alberschwende T: +43 5579 7171www.leader-vlbg.at
Published:June 2012Project ENERBUILDResult 5.4
Alpine Space Programmewww.alpine-space.eu
1 Methodological approach
6 General Building description 10 Germany – Upper Bavaria 11 Italy – South Tyrol 14 Switzerland – Central Switzerland 14 Austria – Tyrol 16 Italy – Piemonte 17 Austria – Vorarlberg
18 Comprehensive questionnaire
23 Measurement data acquisition 24 Germany – Upper Bavaria 32 Italy – South Tyrol 53 Switzerland – Central Switzerland 56 Austria – NorthTyrol 66 Italy – Piemonte 72 Austria – Vorarlberg
76 Results and Conclusions

Page 4 of 79 ENERBUILD: Final Result 5.4User habits, impact on energy consumption in passive houses
Introduction
It is a fact that not all energy efficient buildings have the performance promised by building planners and designers. This transnational stu-dy „performance of existing buildings” has the aim to provide information about sources of pro-blems with energy efficient buildings and recom-mendations for improvements. The objective is to examine the actual behavior and to under-stand possible problems of existing construc-tions, to evaluate the problem areas and to find solutions or highlight open challenges as well as relative needed expertise.
Especially SMEs in the building sector are one of the target groups which could benefit from this study by being involved into scientifically evalua-tions of high energy efficient buildings. They are informed on new developments in the building sector beyond the border of their region and their country and has the possibility to introduce impulses on innovation. Craftsmen and archi-tects as a second target group acquires know-how from each other and can transfer it in their countries of origin.
To be able to give an answer to the question about possible deviations between the actual and designed performance of Passive Houses and relative causes, a monitoring campaign in six alpine space regions was carried out. Topics of the analysis were: the thermal and electric energy consumption, the actual external and internal climate, the indoor comfort and the per-formance of the ventilation system.
After excluding the fact that deviations could de-rive also from wrong planning of thermal bridges or from wrong execution of construction details, it was a central aim to identify the impact of user behavior on the energy consumption. Some open questions about the actual benefits of a Passive House ... (also analyzed in „Results 5.3: Killer arguments and opportunities“), as well as the will to give an impulse for the Alpine regi-on enterprises dealing with energy efficiency in building, address the assessment of reasons for different consumption under the same circum-stances and thus the interpretation of user beha-vior concerning different energy consumptions.
In the following the results of the long-term mea-surement are presented, starting with the expla-nation of the methodical approach, followed by a short overview and description of the Passive Houses analysed and documented in a first stage by means of on-site inspection, building documents, energy bills and questionnaires. Afterwards the results of a comprehensive que-stionnaire carried out among the inhabitants of the surveyed Passive Houses are presented. The results of the long-term monitoring campaign are explained and illustrated, ordered by the six regions. This part is divided for every building in a general description of the building (architec-ture, building services and construction) and a presentation of the monitoring results and their interpretation. The document closes with a sum-mary of the results.
EURAC ResearchDagmar Exner
Hannes Mahlknecht

ENERBUILD: Final Result 5.4 Page 5 of 79User habits, impact on energy consumption in passive houses
Methodological approach
Building analysis concept: general approach
The monitoring of Passive Houses in 6 alpine space regions was carried out in two stages:
• First Level-study (Level I): analysis of buil-dings by means of questionnaires to the inhabitants, project plans analysis, energy calculations and energy bills elaborations
• Second Level-monitoring (Level II): analysis of buildings by means of long term monitoring of energy consumption and comfort parame-ters plus additionally short term monitoring interventions like measuring of air tightness, thermal bridges assessment
Aims of first level:
By means of project plans, the building construc-tion and technological systems features were identified, while from the energy calculations and
energy bills the planned and actual energy con-sumptions were documented. Questionnaires from the inhabitants helped to understand their general satisfaction and use of the building (user behaviour).
Aims of second level:
The long term monitoring gave quantitative in-formation on the building performances in terms of thermal and electric energy consumptions (final energy and primary energy consumption) and in terms of indoor comfort and user behavi-our. By knowing detailed energy consumptions and related energy-efficiency attitudes, the in-fluence of user behaviour and HVAC+L systems settings on the building performances was eva-luated.
EURAC - European Academy of BolzanoInstitute for Regional Development and Location ManagementViale Druso 1 39100 Bozen T:+39 0471 055 055www.eurac.edu
Selection criteria for passive houses (categorization)
To achieve comparable results, every partner re-gion selected their passive houses in compliance with the following selection parameters:
Fixed parameters:
Energy standard:
The building had to comply with the ener-gy standard and its top level requirements, or, where there is no regulation, what is considered as „best practice„ in the partner region. For ex-ample the „passive house„ standard for Upper Bavaria requires a limit of annual heat demand of 15 kWh/(m²a); in South Tyrol the „CasaCli-ma Oro„ requires an annual heat demand of 10 kWh/(m²a), Piemonte Region has not a specific regulation so it was considered the known best practice.
Climate:
Typical climate for partner region was requested to avoid extreme exceptions: For example:
South Tyrol HDD (12/20):
• Village with highest HDD(12/20): Selva di Gar-dena (1563 m a. s. l.): 5246 HDD/y
• Village with lowest HDD(12/20): Salurn (226 m a. s. l.): 2740 HDD/y
As stated above the requested building for South Tyrol should have a climate between min.
3.000 HDD/y and max. 4.000 HDD/y.
Use of building:
residential building; to allow a good comparison on the collected data it was chosen to select only one type of building.
Year of construction:
max. 5 years old (on 1st of July 2009, which is the beginning of ENERBUILD project)
Variable parameters:
Typology of building (dimensions):
One to two family house, apartment building or multi-family house (possibly social housing). In general typical building types for the partner area were requested, which represent the most used building types in the partner area. We di-stinguished between buildings with one or two apartments (also e.g. row houses) and buildings with more than two apartments. In the case of apartments building or multi-family house more than two units (flats) should be considered.
Construction method:
• Massive construction: for example masonry, concrete
• Light-weight construction: for example wood construction (frame mode of construction; X-lam)

Page 6 of 79 ENERBUILD: Final Result 5.4User habits, impact on energy consumption in passive houses
Methodological approach
• In general typical construction solutions for the partner region were requested, which re-presented the most used handcraft construc-tion methods.
User of building:
Parameters Typology of building (dimensions)
Construction method: Building User
Building Type I
One/semi-detached house
Massive construction owner
Building Type II
One/semi-detached house
Light-weight construction owner
Building Type III
apartment building, ulti-family house
Massive/light-weight construction
Social housing tenant
Building Type IV
apartment building, multi-family house
Massive/light-weight construction
owner
Fig. 1: Variable parameters of the selection criteria
of passive houses
We distinguished among three „user-types”:
• Owner: the building is inhabited by the ow-ner, which possibly was also the investor and/or the builder
• Council tenant: the building is inhabited by a council tenant (social housing)
• Tenant: the building is inhabited by a tenant
In every participating partner region were chosen from two to twelve buildings for the „First-level”-study, which should answer to the parameters listed in the table above. The parti-cipating partner regions were: Vorarlberg, South
Tyrol, Piemonte, Upper Bavaria, Tyrol and Cen-tral Switzerland
According to the selection criteria of the first level-study the overall case studies chosen were:
• 10 buildings of type I
• 10 buildings of type II
• 11 buildings of type III
• 1 building of type IV
In every participating partner area were cho-sen from one to five buildings for the „Second-level”-Monitoring, starting from the buildings analysed in the first stage. In order to choose the smaller set of buildings the following criteria has been defined:
• the building had to correspond to the parameters and the building type of table 1
• actual building documentation availability
• inhabitant availability for the long term monitoring
According to the selection criteria of the second level the overall case studies chosen were:
• 4 buildings of type I
• 7 buildings of type II
• 7 building of type III
In the case of the apartment building (Building type III) only one flat had to be measured.
The selection of the buildings corresponding to the listed parameters allowed a common evalu-ation with more coherent and consistent results.
First level: survey and energy analysis
For the first-level-studies in all partner regions were documented and analysed in total 33 buil-dings. After contacting the inhabitants of the buildings an on-site inspection has been carried out, to accomplish the questionnaire and also to collect documents of the building. Through pro-ject plans and the on-site inspection, the buil-ding typology in terms of sizes, materials and type of construction, room use etc. has been de-termined. The collected energy bills and energy calculations or certificates should result in a first identification and comparison of calculated and actual building performance data.
Additionally the first-stage included a calculation with the PHPP-software.
Summary first-level tasks:
• Documentation and analysis of buildings in terms of:
• On-site inspection
• Documents to be collected:
• Project plans
• Energy bills, water consumption bills
• Energy calculation (certificate)
• Questionnaire

ENERBUILD: Final Result 5.4 Page 7 of 79User habits, impact on energy consumption in passive houses
Monitoring system „Simple”:
Energy consumption, at least weekly meter-reading:
• Electric energy consumption
• Thermal energy consumption
• Water consumption
Comfort:
• Continuous measuring of ambient air (T, H, CO2, surf. T)
User behaviour, more detailed questionnaire on:
• Ventilation system use
• Windows use: opening/closing
• Shading use: opening/closing
Weather data, from a near weather station:
• Outdoor air temperature
• Outdoor relative humidity
• Global irradiation
All collected data was inserted and compared in a common database in terms of:
• Thermal and electric energy consumption
• User behaviour
• Comfort
• Characteristics of construction, HVAC system
The questionnaire, which had the aim to get information on the user-satisfaction and on the building use, covers the following issues:
User satisfaction: (evaluation 1-6)
• Satisfaction on living comfort
• Satisfaction on ventilation system
• Fulfillment of the expectations
• Relation costs/benefits
• Ventilation noise during the day
• Ventilation noise during the night
• Overall impression room comfort
• Life quality
Temperature and humidity (comfort) from the user point of view: (evaluation 1-6)
• Room temperature in summer
• Room temperature in winter
• Air humidity in summer
• Air humidity in winter
User behaviour:
• Frequency of window ventilation (evaluation no – > 4 times/day)
• Duration of window ventilation (evaluation no - > 60 min.)
• Frequency of changing of filters (evaluation no - > 4 times/year)
• Regulation room temperature (evaluation 18° - 23°C)
• Attitude energy saving (evaluation 0-9)
Consumption parameters:
• Number of inhabitants
• Occupancy times of building
Information of user:
• Information on instructions for use
• Information on passive house concept
• Information on handling of the ventilation sy-stem
Second level: instrumental monitoring
For the monitoring activities two different moni-toring layouts have been elaborated mainly to match different budget availability. Basically the same parameters should have been monitored in every building, so that a common elaboration and evaluation of the acquired data was possi-ble. Therefore one monitoring system layout covers a minimum of continuous measurements. In the following the minimum monitoring layout will be called „Simple”.
In some cases was not possible to install a long term monitoring system because of technical and financial reasons. A short term monitoring with portable instruments was applied with the aim to assess the main thermal performance of the buildings.
In this way 3 different monitoring approaches were experienced allowing an overall evaluation of pros and cons for each of them.

Page 8 of 79 ENERBUILD: Final Result 5.4User habits, impact on energy consumption in passive houses
The aim was to cover the most important para-meters affecting the energy consumption and the comfort.
In this case the energy and water consumption data was read and collected weekly from the heat and electricity meter by the inhabitant or facility manager. The comfort data was mea-sured per living zone by a data acquisition box, in which the sensors for temperature, relative hu-midity and CO2 are integrated. The number of zones per building to monitor was decided in-dividually according to the size and subdivision of each apartment. Additionally to these three parameters the wall surface and/or outdoor tem-perature could have been measured.
The other monitoring layout, which will be called „Detailed” in the following, allows a continuative and deepen measurement of the building per-formances and user behaviour parameters.
Monitoring system „Detailed”:
Energy consumption:
• Electric energy consumption
• Thermal energy consumption
• Optionally: water consumption (manually me-ter reading)
Comfort:
• Ambient Air (T, H, CO2, surf. T)
• External Air T
• Ventilation system – heat recovery (T, air speed)
User behaviour:
• Windows use: opening/closing
• Shading use: opening/closing
Weather data, from a near weather station or optionally from a dedicated meteo station:
• Outdoor air temperature
• Outdoor relative humidity
• Global irradiation
The aim was to cover the most important para-meters affecting the energy consumption, the comfort and the user behaviour.
In some cases the long term monitoring could be supplemented with short term (one time) measurements like:
• Air tightness (Blower Door test)
• Thermal bridges (infra-red thermography)
• U-value measurement
In this case the energy consumption data was read and collected automatically by electricity and heat meters. In the four ducts of the venti-lation system (air in, air out, outdoor air and ex-haust air) the temperature was measured as well as the air speed in the air-in duct.
The comfort data was measured per living zone by a data acquisition box, in which the sensors for temperature, relative humidity and CO2 are integrated. The number of zones per building to monitor was decided individually according to the size and subdivision of each apartment. Additionally to the three parameters the wall surface and/or outdoor temperature could have been measured.
In this monitoring layout also the measurement of window and shading opening could have been foreseen (window opening: two sensors per window). The number of sensors depended strongly on the number of windows, which are of interest.
All sensors positioned in the living area were connected with a wireless communication mo-dule in order to transfers the data via a gateway to a central computer.
The weather data could have been acquired or from a near weather station or by installing de-dicated sensors.
The best solution for the chosen buildings de-pended very much on the type of the building (dimensions, and above all the building services) and on the budget.
For the monitoring of a „compact unit machine”, which is a widespread system application in pas-sive houses, an adapted monitoring structure for measuring all different loads was developed.
Monitoring system „compact machine”:
Ventilation system:
• Temperature: Air in, air out, outdoor air, ex-haust air
• Air speed
• Ventilation system motor: voltage
Solar thermal:
• Temperature: outlet, inlet
• Pump: on/off
Heat pump:
• Temperature: outlet, inlet
• Pump: on/off
Electric heating element:
• On/off
Methodological approach

ENERBUILD: Final Result 5.4 Page 9 of 79User habits, impact on energy consumption in passive houses
Monitoring data analysis - scope
EURAC, as coordinator of the monitoring cam-paign, has prepared a data-analysis-tool to allow a common elaboration of the collected data and the relative results comparison.
The following list shows the main kind of elabo-ration that has been carried out.
Energy consumption
Analysis:
Thermal energy consumption
• Monitoring of heat flow, read out of bills
• Subtraction of standard consumption for DHW according to user quantity
Electric energy consumption
• Monitoring of electricity (sum of the con-sumptions of devices and domestic uses)
Calculation of primary energy consumption
• Subtraction of renewable energies
Results:
• Comparison between PHPP calculations and local energy certification tools (e. g. CasaCli-ma for South Tyrol)
• Comparison between measured external air temperature and standard weather data, cal-culation of actual heating degree days
• Analysis of monitored user behaviour in terms of presence, window-handle for natural venti-lation and shading practice
Ventilation system
Analysis:
Air temperatures in the ventilation pipes
• Effectiveness of the heat recovery*
• Effectiveness of the geothermal heat exchan-ger (optional)**
• Air speed measurement of supply air
• Air temperature in exemplary days
• Air temperatures in the ventilation pipes
Results:
• Assessment of effectiveness of heat recovery/geothermal heat exchanger under in use con-ditions, interpretation of deviations
• Assessment of ventilation system perfor-mance under in use conditions, interpretati-on of deviations. Control of settings and user maintenance
Thermal and hygro-thermal comfort
Analysis:
• Trend of ambient air temperature and relative humidity
• Thermal comfort during winter (Fanger mo-del, EN ISO 7730)
• Thermal comfort during summer (adaptive model EN 15251)
• Comparison of internal surface temperature and ambient air temperature (optional)
• Frequency distribution of CO2 concentration
Results:
• Evaluation of comfort conditions

Page 10 of 79 ENERBUILD: Final Result 5.4User habits, impact on energy consumption in passive houses
Overview of selected buildings
In total 32 Passive Houses in six regions (Up-per Bavaria, Central Switzerland, Vorarlberg, Tyrol, South Tyrol and Piemonte) were analysed and documented in level I in terms of building construction, energy bills and energy calculati-ons in order to achieve a first identification of the actual building performance data.
In a second step out of these 32 Passive Houses 18 were chosen and analysed by long term mo-nitoring in Level II collecting data on the thermal and electric energy consumption, the com-fort and the user behaviour.
The following map of the Alpine Space Pro-gramme cooperation area shows the distribution of the monitored Passive Houses in Level I and Level II in the participating regions.
In the following the Passive Houses documented in Level I are described in short tables, ordered per region. Under chapter „Measurement data acquisition, Page 23“ a selection of buildings monitored in Level II are reported in detail with monitoring results.
General building description
Piemonte
South Tyrol
Upper Bavaria
Tyrol
CentralSwitzerland
Vorarlberg
Monitoring Level I
Monitoring Level II
Fig. 5: Map of the Alpine Space Programme cooperation area with the distribution of monitored Passive Houses in Level I and II.
Germany – Upper Bavaria (3 buildings)
Passive House Samerberg
Location Törwang
Category/building type Building type II
Year of construction 2004
Energy performance* 14 kWh/(m²a)
Certification Passive house
MonitoringLevel I and II - „detailed”
Passive House Prantl
Location Wolfratshausen
Category/building type Building type II
Year of construction 2004
Energy performance* 14 kWh/(m²a)
Certification Passive house
MonitoringLevel I and II - „detailed”

ENERBUILD: Final Result 5.4 Page 11 of 79User habits, impact on energy consumption in passive houses
Italy – South Tyrol (12 buildings)
Passive House Bruckmühl
Location Bruckmühl
Category/building type Building type III
Year of construction 2009
Energy performance* 22 kWh/(m²a)
Certification Next to passive house
MonitoringLevel I and II - „detailed”
Passive House Caldaro
Location Caldaro, Italy
Category/building type Building Type I
Year of construction 2008
Energy performance* 9,66 kWh/(m²a)
Certification CasaClima Oro
MonitoringLevel I and II - „detailed”
Passive House Tesimo
Location Tesimo, Italy
Category/building type Building Type II
Year of construction 2007
Energy performance* 16 kWh/(m²a)
Certification CasaClima A
MonitoringLevel I and II - „detailed”
Passive House San Lorenzo di Sebato
Location San Lorenzo, Italy
Category/building type Building Type II/IV
Year of construction 2009
Energy performance* 9 kWh/(m²a)
Certification CasaClima Oro
MonitoringLevel I and II - „simple”
*calculated with regional calculation tool („CasaClima-Software”)
*calculated with PHPP

Page 12 of 79 ENERBUILD: Final Result 5.4User habits, impact on energy consumption in passive houses
Passive House House Selva di Val Gardena
Location Selva di Gardena, Italy
Category/building type Building Type II
Year of construction 2008
Energy performance* 13 kWh/(m²a)
Certification CasaClima A
MonitoringLevel I and II - „simple”
Social Housing Bronzolo
Location Branzolo, Italy
Category/building type Building type III
Year of construction 2005/2006
Energy performance* 11 kWh/(m²a)
Certification CasaClima A+
MonitoringLevel I and II - „detailed”
Passive House Tesimo I
Location Tesimo, Italy
Category/building type Building type I/II
Year of construction 2007
Energy performance* 12 kWh/(m²a)
Certification CasaClima A
Monitoring Level I
Passive House Caldaro I
Location Caldaro, Italy
Category/building type Building type I
Year of construction 2009
Energy performance* 5,51 kWh/(m²a)
Certification CasaClima Oro
Monitoring Level I
Passive House Brunico
Location Brunico, Italy
Category/building type Building type I
Year of construction 2006
Energy performance* 9 kWh/(m²a)
Certification CasaClima Oro
Monitoring Level I
General building description

ENERBUILD: Final Result 5.4 Page 13 of 79User habits, impact on energy consumption in passive houses
*calculated with regional calculation tool („CasaClima-Software”)
Passive House Tesimo II
Location Tesimo, Italy
Category/building type Building type I
Year of construction 2008
Energy performance* 19 kWh/(m²a)
Certification CasaClima A
Monitoring Level I
Passive House Merano
Location Merano, Italy
Category/building type Building type I
Year of construction 2008
Energy performance* 9,2 kWh/(m²a)
Certification CasaClima A+
Monitoring Level I
Passive House Caldaro II
Location Caldaro, Italy
Category/building type Building type IV
Year of construction 2009
Energy performance* 14,16 kWh/(m²a)
Certification CasaClima A
Monitoring Level I
Passive House Ortisei
Location Ortisei, Italy
Category/building type Building type III/IV
Year of construction 2009
Energy performance* 5 kWh/(m²a)
Certification CasaClima Oro
Monitoring Level I

Page 14 of 79 ENERBUILD: Final Result 5.4User habits, impact on energy consumption in passive houses
Switzerland – Central Switzerland (2 buildings)
Austria – North Tyrol (6 buildings)
Passive House LU-004-P
Location Lucerne
Category/building type Building type I
Year of construction 2005
Energy performance* 10 kWh/(m²a)
Certification MINERGIE-P
MonitoringLevel I and II - „simple”
Passive House Gaigg
Location Innsbruck
Category/building type Building Type I
Year of construction 2003
Energy performance* 19 kWh/(m²a)
Certification A+
MonitoringLevel I and II - „simple”
Passive House NW-002-P
Location Beckenried
Category/building type Building type II
Year of construction 2008
Energy performance* 17,5 kWh/(m²a)
Certification MINERGIE-P
Monitoring Level I
Passive House Fügenschuh
Location Höfen, Austria
Category/building type Building Type I
Year of construction 2007
Energy performance* 15 kWh/(m²a)
Certification No certification
MonitoringLevel I and II - „simple”
*calculated with regional calculation tool (SIA 380/1)
*calculated with PHPP
General building description

ENERBUILD: Final Result 5.4 Page 15 of 79User habits, impact on energy consumption in passive houses
*calculated with PHPP
Passive House Kitzbichler
Location Niederndorferberg
Category/building type Building Type II
Year of construction 2007
Energy performance* 15 kWh/(m²a)
Certification No certification
MonitoringLevel I and II - „simple”
Passive House Walter
Location Kufstein, Austria
Category/building type Building Type I
Year of construction 2009
Energy performance* 8 kWh/(m²a)
Certification A++
MonitoringLevel I and II - „simple”
Passive House Ritzer
Location Ebbs
Category/building type Building Type II
Year of construction 2009
Energy performance* 15 kWh/(m²a)
Certification No certification
MonitoringLevel I
Passive House Krätschmer
Location Söll, Austria
Category/building type Building Type II
Year of construction 2007
Energy performance* 20 kWh/(m²a)
Certification No certification
MonitoringLevel I and II - „simple”

Page 16 of 79 ENERBUILD: Final Result 5.4User habits, impact on energy consumption in passive houses
General building description
Social Housing Orbassano
Location Orbassano
Category/building type Building type III
Year of construction 2009
Energy performance* 32,95 kWh/(m²a)
Certification A
MonitoringLevel I and II - „simple”
Social Housing Borgaro
Location Borgaro
Category/building type Building type III
Year of construction 2009
Energy performance* 29,15 kWh/(m²a)
Certification No certification
MonitoringLevel I and II - „simple”
Social Housing Moncalieri
Location Moncalieri
Category/building type Building Type III
Year of construction 2009
Energy performance* 48,04 kWh/(m²a)
Certification No certification
MonitoringLevel I and II - „simple”
Social Housing Villadossola
Location Villadossola
Category/building type Building Type III
Year of construction 2009
Energy performance* 21,71 kWh/(m²a)
Certification No certification
MonitoringLevel I and II - „simple”
*calculated with regional calculation tool
Italy – Piemonte (4 buildings)

ENERBUILD: Final Result 5.4 Page 17 of 79User habits, impact on energy consumption in passive houses
*calculated with PHPP
Passive House EFH Schedler
Location Hohenweiler
Category/building type Building type II
Year of construction 2009
Energy performance* 17 kWh/(m²a)
Certification No certification
Monitoring Level I
Passive House V111 (Alpenländische Heimstätte)Location Bregenz
Category/building type Building Type III
Year of construction 2008
Energy performance* 17 kWh/(m²a) PHPP
Certification No certification
Monitoring Level I
Passive House Gartenpark - Sandgasse (Hefel)Location Lauterach
Category/building type Building Type III
Year of construction 2008
Energy performance* 14 kWh/(m²a)
Certification Passive House
MonitoringLevel I + II „simple”
Passive House EFH Brunn
Location Hard
Category/building type Building type II
Year of construction 2012
Energy performance* 14,6 kWh/(m²a)
CertificationPassive House (planned)
Monitoring Level I
Passive House V110 (Alpenländische Heimstätte)Location Bregenz
Category/building type Building Type III
Year of construction 2008
Energy performance* 11 kWh/(m²a) PHPP
Certification No certification
Monitoring Level I
Austria – Vorarlberg (5 buildings)

Page 18 of 79 ENERBUILD: Final Result 5.4User habits, impact on energy consumption in passive houses
Comprehensive questionnaire
User satisfaction in general
50 inhabitants of the documented Passive Houses were asked within Level I to participate in a user survey. Aim of this inquiry was on one hand to get knowledge on the satisfaction of the user regarding the living comfort in Passive Houses in general and especially regarding the satisfaction about the ventilation system. On the other hand the questionnaire should give an-swers about the user behaviour concerning the frequency and duration of window opening and the maintenance of the ventilation system. This both aspects together with questions on occu-pancy times and set-point temperatures of the heating and cooling system should help to inter-pret the measured data.
Taken from the study „Vergleichende Auswer-tung schweizerischer Passivhäuser” from the „Bundesamt für Energie” (BFE) [1], the inha-bitants were asked about their satisfaction re-garding the living comfort and the ventilation system, if the expectations they had towards the Passive House were fulfilled and about the rela-tion costs/benefits. The inhabitant should indi-cate his opinion on a scale from „+3” (positive) to „-3” (negative).
Over 90% of the inhabitants are very satisfied with the living comfort in their Passive Houses. Only 6,0% regard the living comfort neither po-sitive nor negative, 2,0% are not satisfied at all. All of those inhabitants, which voted under „+2” (positive), are tenants.
The relation of costs and benefits is evaluated positive by nearly 80% of the users. The about 9%, who indicated a negative vote, are tenants. The majority of inhabitant therefore considers the required higher investment for a Passive House as well balanced by the relative benefits.
The expectations, which the inhabitants had to-wards a building with Passive House standard, could be fulfilled for the majority. 12,5 % of the inhabitants voted, that their expectations had not been fulfilled (from „-1” to „-3”). All of those, who voted from „0” to „-3” were tenants and not owners.
A lower percentage of the occupants is satisfied with the ventilation system: In this case 16,7% gave a negative vote in the scale from „3” to „-3”. Again, inhabitants who voted lower than „+2” are tenants.
Fig. 6 and 7: Diagram of residents’ inquiry about satisfaction
living comfort and relation costs/benefits.
Fig. 8 and 9: Diagram of residents’ inquiry about fulfillment of expectations and satisfaction with the ventilation system
EURAC - European Academy of BolzanoInstitute for Regional Development and Location ManagementViale Druso 1 39100 Bozen T:+39 0471 055 055www.eurac.edu
[1] Frei B., Reichmuth F., Huber H., Vergleichende Auswertung schweize-rischer Passivhäuser, Bun-desamt für Energie, Bern, 2004; p 87.
[2] S. Lenel et al.: Praxistest Minergie® – Erfahrungen aus Planung, Realisie-rung und Nutzung von Minergie® Bauten, Verein Minergie®, Schlussbericht Juni 2004

ENERBUILD: Final Result 5.4 Page 19 of 79User habits, impact on energy consumption in passive houses
Temperature and humidity (comfort) from the user point of view
Regarding the indoor comfort, the residents were asked to indicate their perception of the indoor room temperature and relative humidity. The survey distinguished between summer- and winter period. The scale here ranges from „-4” to „+4”, while „-4” describes a low value, the-refore very cold or very dry and „+4” means a high value, therefore very hot or very humid. A neutral value („0”) is regarded as optimal indoor climate.
In general inhabitants feel fine with the indoor comfort: about half of the residents give an op-timal vote for the indoor room temperature, the majority also for the air humidity, both during winter and summer period.
Fig. 10 and 11: Perception of indoor comfort: temperature in
summer and in winter
Fig. 12 and 13: Perception of indoor comfort: air humidity in
summer and in winter
long they are used to open the windows during the winter and the summer time. Another mat-ter was how often the users change the filters of
However nearly the other half of the occupants percept the mean indoor room temperature slightly too high, 5,9% even say that the room temperature is too hot. All inhabitants, who se-lected a value more than „2”, are tenants.
During the winter period 23,5% think that the room temperature is slightly cold or cool. In this case, all occupants, who indicated a value lower than „-1”, are tenants.
The air humidity in summer gets the most posi-tive evaluation: 90% regard the indoor air humi-dity as optimal.
Unlike during the winter period only nearly 60% consider the air humidity as optimal, while over 30% say that the mean air humidity is slightly too dry.
User behaviour
The following questions aim to get information about the user behaviour, asking the inhabitants about their habits regarding how often and how

Page 20 of 79 ENERBUILD: Final Result 5.4User habits, impact on energy consumption in passive houses
the ventilation system and what they think about energy saving in general, because not every Pas-sive House inhabitant has to be mandatorily an energy saver.
All these issues have an influence on the energy consumption and on the comfort and help to in-terpret the measured data in a better way.
The user behaviour shows consequent rare and short window ventilation during the winter peri-od: 38% do not open their windows at all during the winter time. In summer time the situation is different: opening times are much longer and numerous. A sixth part opens the windows only during the night for night cooling.
The question on how often inhabitants change the filters of the ventilation system result in diffe-rent user habits: 60% changes the filters one time a year, which is also the frequency recommen-ded by manufacturer. About a third part changes the filters even more often. The part of the inha-bitants, which responded, that they never chan-ge the filters, consists all of tenants, which live in buildings were most probably a caretaker takes over the aim to change the filters from the cen-tral ventilation system.
Not every Passive House inhabitant is manda-torily an energy saver: only 70,8% indicated the highest vote „+3”. Anyhow the rest of the occu-pants see their attitude towards energy saving positive or at least neutral.
Fig. 14, 15, 16, 17: Frequency and duration of window ope-
ning during summer and winters
Fig. 18 and 19: Frequency of changing the filters of the ven-
tilation system, attitude energy saving
Comprehensive questionnaire

ENERBUILD: Final Result 5.4 Page 21 of 79User habits, impact on energy consumption in passive houses
Fig. 20, 21 ,22: Information of user about the use of the buil-
ding
Fig. 23 and 24: Ventilation noise during day and during night
Provided information for the use of the buildings
Information to the user is a crucial aspect for exploiting the advantages of Passive Houses in terms of energy efficiency and comfort in an ap-propriate way. The results of the questionnaire show, that half of the inhabitants feel really well informed about the Passive House concept in general as well as about the instruction of use and about the handling of the ventilation sy-stem. Nevertheless a quite big part of about 25% feels not well informed about the passive house concept, 10% about the instruction for use.
The information about the handling of the ven-tilation system is evaluated in a better way: 4% feel not well informed. In all three cases only tenants indicated a value lower than „0”.
User satisfaction regarding ventilation system
The ventilation noise is evaluated not so posi-tively: 8,4% of the inhabitants feel disturbed by the sound of the ventilation system during the day, during the night even nearly 30%. All in-habitants, who indicated a negative value, are tenants.
The user satisfaction about the overall impres-sion of room comfort and the evaluation of life quality living in a Passive House shows the most positive result: both the room comfort and the life quality are evaluated only positive from „+1” to „+3”. This shows that in general the inhabit-ants feel comfortable in their Passive Houses.

Page 22 of 79 ENERBUILD: Final Result 5.4User habits, impact on energy consumption in passive houses
Conclusions results from the comprehensive questionnaire
The survey to the users of the documented passive houses within „ENERBUILD” showed positive results: a great majority of them were satisfied with the living comfort, the overall im-pression of room comfort and the life quality in general. Also the costs and benefits ratio was evaluated positive. Expectation the inhabitants had towards the building, could be considered as fulfilled for most of them. A bigger part of in-habitants felt fine with the indoor comfort both during summer and winter.
However, a lower percentage of the inhabitants was satisfied with the following issues:
• Mean indoor temperature in summer: nearly 50% said that indoor room temperatures were slightly too high, ca. 6% even said it was too hot
• Mean indoor air humidity in winter: over 30% said the mean air humidity was slightly too dry
• Ventilation system: about 17% were not satis-fied with the ventilation system in general; ca. 8% felt disturbed by the sound of the venti-lation during the day, during the night even nearly 30%
• Provided information: 25% felt not well infor-med about the passive house concept, 10% about the instruction of use, 4% about the handling of the ventilation system
Even if in all cases the negative votes are the minority, in the future building planners and de-signers as well as SMEs will be demanded to im-prove communication strategies of the passive house concept, to provide information to the users and to improve building comfort regar-ding especially air humidity in winter and sum-mer comfort in warmer climates as well as the
Comprehensive questionnaire
ventilation system. Sufficient information about the building performances will also have a po-sitive effect on the users behaviour and thus on the energy consumption and comfort.
Striking is the fact that in nearly all cases of ne-gative votes, the polled inhabitants were tenants and not owners. From the experience of the evaluators this could be caused by the fact that building owners are more involved in the pro-ject planning phase as well as during the phase of construction works. During the project plan-ning phase the building owner must take a lot of decisions, regarding the room layout, but also regarding building materials and elements and above all she/he chooses the elements of buil-ding systems. Every investment in the building is an owner decision.
This is why the building owner is on one hand more informed about how the building itself and how the building systems work and on the other hand she/he might be more aware of the effects the living in a passive house implicates, compa-red with a tenant which is much less prepared to live in with the peculiar features of this kind of building.
At the moment it still might be a little minority of people living in passive houses and the typi-cal passive house inhabitant is still the building owner of a single-family-house. Nevertheless in the future energy efficiency will have to be ap-plied on more and more new and old buildings. Therefore it will be a challenge to address other types of inhabitants/users by communicating the passive house concept and improving the pas-sive houses and the building systems in a way that every inhabitant could be satisfied with the dwelling.
Fig. 24 and 25: Overall impression room comfort, life quality
in Passive Houses

ENERBUILD: Final Result 5.4 Page 23 of 79User habits, impact on energy consumption in passive houses
In every Region a different number of buildings were chosen to monitor within the detailed mo-nitoring level II: a total of 18 buildings with 147 apartments. Thereof South Tyrol monitored 5 buildings with a total of 14 units, South Bavaria 3 buildings with 13 apartments, Switzerland 1 buil-dings consisting of 1 unit, North Tyrol 4 buildings with 5 apartments, Vorarlberg 1 buildings with 6 apartments and Piemonte 4 buildings with 108 apartments.
In the following table the monitored buildings were distinguished into building types – see also under the chapter „selection criteria for passive houses (categorization)”:
• Building type I: One/semi-detached house with massive construction inhabited by owner
• Building type II: One/semi-detached house with light-weight construction inhabited by owner
• Building type III: apartment building or mul-ti-family house with massive/light-weight construction inhabited by tenants
• Building type IV: apartment building or mul-ti-family house with Massive/light-weight construction inhabited by owners
Building type I II III IV
Level II
Total number of buil-
dings4 6 7 1
Total number units 6 6 129 6
Number of monitored buildings in monitoring level II.
Transnational overview
The following table gives an overview on all mo-nitored buildings of monitoring in level II and compares the monitored thermal energy con-sumption for heating and the calculated thermal energy demand with the software PHPP.
In most of the cases the measured energy con-sumption for heating was higher than the calcu-lated one in PHPP as well as the design value with regional energy calculation software. Ho-wever the consumption of the buildings was in most cases pretty close to the calculated results, when the data was corrected in terms of inter-nal temperature outdoor climate data and when taking the user behaviour into account. In one region large differences between design values and measured consumption were gathered. De-tailed results follow on the next pages divided into regions.
Measurement data acquisition Interpretation of statistical results
Fig. 26: Comparison of measured thermal energy consump-tion for heating and design values
EURAC - European Academy of BolzanoInstitute for Regional Development and Location ManagementViale Druso 1 39100 Bozen T:+39 0471 055 055www.eurac.edu

Page 24 of 79 ENERBUILD: Final Result 5.4User habits, impact on energy consumption in passive houses
Overview of measured indoor comfort
The analysis of the indoor temperatures in the monitored passive houses showed that the in-terior room temperature of 20°C set in project planning is assumed too low in most of the cases. In the present example a medium room temperature during the heating period of 23°C (±0,3°C) was measured. The effect of the high-er room temperatures and the higher measured solar radiation data on the calculation of the an-nual heating energy demand is shown in figure below.
Measuring the CO2 concentrations in the rooms (for example the living room in House Prantl, Wolfratshausen) the figure below shows that the Pettenkofer benchmark according to DIN 1946-2 by 1.000 ppm was exceeded only rarely.
Evaluation of measured data – Upper Bavaria
As part of the work package in the project the University of Applied Sciences Rosenheim mo-nitored three buildings for the region Upper Ba-varia:
• Samerberg, Single family-house in timber structure, 2004, Monitoring System: Energy and Comfort
• Wolfratshausen, Single family-house in tim-ber structure, 2004, Monitoring System: Ener-gy and Comfort
• Bruckmühl, Multifamily-house, renovation with roof elevations, 2009, Monitoring Sy-stem: Comfort
External climate of the region
All buildings were projected with the interna-tional planning tool „Passive House Planning Package 2007” (PHPP 2007). Regarding the mea-sured external climate during the monitoring period from November 2008 to March 2012 the following diagram shows, that the calculated and measured outdoor temperatures for the lo-cation Samerberg and Wolfratshausen lie close to each other.
Measurement data acquisition Interpretation of statistical results
Fig. 27: Comparison of monitored external air temperature at two of the three monitored houses with standard weather data from PHPP
Fig. 29: measured CO2 concentration in living room
Fig. 28: Comparison of annual heating demand calculated with standard and measured mean temperature and with measured global radiation
Fachhochschule RosenheimHochschulstraße 1 83024 Rosenheim T: +49 8031 805 [email protected]

ENERBUILD: Final Result 5.4 Page 25 of 79User habits, impact on energy consumption in passive houses
Building details
Category/building type Building type II
Typology of building Single-family house
Year of construction 2004
Energy performance* 14 kWh/(m²a)
Certification Passive house
MonitoringLevel I and II „detailed”
Tenants/owners Building owner m a.s.l. 714 m
Building size (TFA)** 140,8 m² HDD/CDD 3.875 HDD/a (15/20)
Number of apartments 1 Occupancy (total) 2 adults
*calculated with PHPP
**referring to the energy performance above (PHPP)
Architecture
The detached single-family house is located in a rural area with mainly one-family buildings. The passive house was constructed in 2004 in timber construction. It contains two full storeys with 9 rooms, two bathrooms and one kitchen. These two storeys are utilized residential and are he-ated during the winter season. The basement which contains office space is outside the buil-dings passive house mantle but also heated by the same heating system.
Building services
The heating demand is generally covered by a wood pellet boiler with integrated hot water heat exchanger and the geothermal heat ex-changer of the ventilation system. The heat is distributed mainly air borne and water borne. The bathrooms have radiators if additional heat-ing is required. The building has a balanced ven-tilation system with heat recovery. The sup-ply air is preheated with the geothermal heat exchan-ger. For domestic hot water there is a central hot water tank heated by 13 m² of solar thermal collectors. During winter season 21% of the hot water is provided by the hot water heat exchan-ger integrated in the wood pellet boiler. Apart from the solar thermal collectors the house has two added photovoltaic systems with a total di-mension of ca. 120 m².
Construction
The construction method is a wood construc-tion with 200 mm wood fibre insulation (thermal conductivity: 0,035 W/(mK)). An all-round insu-lation of 60 mm ensures a thermal bridge free construction. The U-Value of the wall reached 0,112 W/(m²K). The main insulation material of the roof is also wood fibre (thermal conductivity:
0,035 W/(mK)). The U-Value of the roof reached 0,103 W/(m²K). The windows and glazing have a mean U-value of 0,87 W/(m²K), roof 0,103 W/(m²K) and ceiling 0,120 W/(m²K). The air tight-ness is 0,40 h-1 according to PHPP.
Description of Monitoring System
Period of measurements 10/10 – 02/12
Monitoring system „detailed”
Electric energy consumption
Total electricity consumption [kWh]
Electric meter: Heat pump [kWh]
Electric meter: Ventilation system [kWh]
Electric meter: Direct current for heating element DHW-buffer
[kWh]
Electric meter: Direct current for heating element ventilation
[kWh]
Electric meter: Household electricity
[kWh]
Electric meter: Photovoltaic [kWh]
Thermal energy consumption
Heat meter: Solar thermal colle-ctor system
[kWh]
Heat meter: Domestic hot water circuit
[kWh]
Comfort/Indoor climate (1st and 2nd floor)
Indoor air temperature [°C]
Relative humidity [%]
CO2[ppm]
Outdoor climate (weather station)
Temperature [°C]
Relative humidity [%]
Global radiation [W/m²]
Passive House Samerberg, Törwang

Page 26 of 79 ENERBUILD: Final Result 5.4User habits, impact on energy consumption in passive houses
Energy consumption (annual heating demand)
Energy Consumption
Energy performance (monitored) 32,5 kWh/(m²a)
Primary energy (monitored) 6,5 kWh/(m²a)
Energy performance (calc. with PHPP)
23,5 kWh/(m²a)
Energy performance (calc. with regional calculation tool)
4,7 kWh/(m²a)
Calculation tool for energy certification
PHPP
Certification(energy label)
When looking at the energy consumption in the figure below it is noticeable that the demand for domestic hot water is relatively stable throughout the whole year. During the heating period the energy consumption of the floor heating and the ventilation system rise by a similar amount. Since the flow temperature of the floor heating is lower than that of the heater for the ventilation system, it usually has a higher proportion.
Fig. 30: Heating system House Samerberg
Measurement data acquisition Interpretation of statistical results - Upper Bavaria
Monitoring results and interpreta-tion - House Samerberg, Törwang
The examined building is located in a rural area with mainly one-family buildings. The detached building has a rectangular shape with an S/V-fac-tor of 0,7. It was built in 2004 in wood construc-tion and has a treated floor area of 153 m².
Two adults are living in the monitored passive house. Usually one person during working days and 2 persons during weekends use the apart-ment more than 6 hours between 8 am and 18 pm. In the afternoon both adults are at home. According to her average once a day a hot meal was prepared. Each person takes a shower about twice a week.
External climate
The diagram below on the left side shows the measured monthly values of the external air tem-perature compared with those calculated in the PHPP. The two measurement curves coincide lar-gely over the measured period of 3 years. Only in the summer, the measured temperature is hig-her than the calculated. This is mainly because the calculation is based on the weather data of Garmisch Partenkirchen, which is located about 90 km west of Samerberg.
The graph below on the right side shows that the calculated values for the monthly global radiati-on in the year 2011 differ especially during sum-mer. Although the temperature in this period is higher than the calculated, as shown in the dia-gram on the left side, the actual global radiation is significantly lower than that assumed by PHPP.
Fig. 32: Monthly thermal energy consumption
Fig. 31: Comparison of monitored external air temperature and global radiation with standard weather data from PHPP

ENERBUILD: Final Result 5.4 Page 27 of 79User habits, impact on energy consumption in passive houses
Internal air comfort
The internal temperature is mostly within an acceptable range between 20°C and 25°C ac-cording to PHPP manual. Only in August 2011 it rises to a particularly high level. The relative humidity ranges between 25% and 50%.
Fig. 33: Internal climate House Samerberg
Generally the internal room temperature in each room is always over 20°C, the standard tempera-ture for planning with the PHPP.
Conclusions
In case of measured and calculated ambient air temperature it was noted a discrepancy. The monthly average values of ambient air tempera-ture in all rooms were about 3 Kelvin higher than projected. By measuring the primary energy only the energy for heating and DHW was measured, without household electricity. In general the measured energy consumption values are high-er than the projected. One reason could be the less solar earnings between autumn and sum-mer. It is assumed that the domestic hot water was heated partially by the pellet-boiler instead of the solar thermal plant. In any case the incre-ased values are attributable to the higher indoor temperatures.
Building details
Location Building type II
Category/building type Single-family house
Year of construction 2004
Energy performance* 14 kWh/(m²a)
Certification Passive house
MonitoringLevel I and II „detailed”
Tenants/owners Building owner m a.s.l. 580 m
Building size (TFA)** 199,2 m² HDD/CDD 3.875 HDD/a (15/20)
Number of apartments 1 Occupancy (total) 2 adults, 2 children
*calculated with PHPP **referring to the energy performance above (PHPP)
Architecture
The detached single-family house is located in a rural area with mainly one-family buildings. The passive house was constructed in 2004 in timber construction. It contains two full storeys with 12 rooms, three bathrooms and one kitchen. All storeys are utilized residential and heat-ed duri-ng the winter season.
Building services
The heating demand is covered by passive en-ergy sources and a 15 kW compact unit. As supplementary heat generating source serves a re-heater unit integrated in the supply air duct
of the buildings ventilation system with 2 kW rated power which is only used if it is required. Main type of the buildings heat distribution is air borne. There also exists a heat pump integrated in the compact unit which is combined with the ventilation system including a heat recovery. The air source heat pump recovers the thermal ener-gy from extract air behind the geothermal heat exchanger. If the indoor temperature is too chilly the heat pump provides additional energy for space heating. For domestic hot water there is a central hot water tank heated by 6 m² of solar thermal collectors. In case the collectors cannot provide the total amount of energy heating is ad-ditionally done by the heat pump that also provi-des space heating. Apart from the solar thermal
Passive House Prantl, Wolfratshausen

Page 28 of 79 ENERBUILD: Final Result 5.4User habits, impact on energy consumption in passive houses
Measurement data acquisition Interpretation of statistical results - Upper Bavaria
Description of Monitoring System
Period of measurements 10/10 – 02/12
Monitoring system „detailed”
Electric energy consumption
Total electricity consumption [kWh]
Electric meter: Heat pump [kWh]
Electric meter: Ventilation system [kWh]
Electric meter: Direct current for heating element DHW-buffer
[kWh]
Electric meter: Direct current for heating element ventilation
[kWh]
Electric meter: Household electricity
[kWh]
Electric meter: Photovoltaic [kWh]
Thermal energy consumption
Heat meter: Solar thermal colle-ctor system
[kWh]
Heat meter: Domestic hot water circuit
[kWh]
Comfort/Indoor climate (1st and 2nd floor)
Indoor air temperature [°C]
Relative humidity [%]
CO2[ppm]
Fig. 34: Heating system House Prantl, Wolfratshausen
Outdoor climate (weather station)
Temperature [°C]
Relative humidity [%]
Global radiation [W/m²]
Monitoring results and interpreta-tion - House Prantl, Wolfratshausen
The examined building is located in a residenti-al area with mostly one- and two-family houses. The detached building has a rectangular shape with an A/V-ratio by 0,67. In 2004 it was built with wood from the Bavarian Upland and has an trea-ted floor area of 199,2 m².
Four persons are living in the building: Two adults and two children. A hot meal is usually served once a day. In the morning there is mostly only one person at home. Every inhabitant takes a shower once or twice a week and the children take a bath once a month. The family owns a cooker, a baking oven and a washing machine.
External climate
The first diagram below shows the measured monthly values for the external air temperature compared with those calculated in the PHPP. The measured temperature is higher than the calcu-lated almost over the entire period. This is mainly because the calculation is based on the weather data of Garmisch Patenkirchen, which is located about 130 meters higher than Wolfratshausen.
Analogous to the slight fall in temperature mea-sured in July, as previously explained, there is also a decrease in global radiation during sum-mer clearly visible (see figure 36).
collectors the house has an in-roof photovoltaic system with a total dimension of ca. 50 m².
Construction
The windows and glazing have a mean U-value of 0,73 W/(m²K), exterior walls 0,104 W/(m²K), roof 0,104 W/(m²K) and ceiling 0,125 W/(m²K). The air tightness is 0,40 h-1 accord-ing to PHPP.
Fig. 35: Comparison of monitored external air temperature and global radiation with standard weather data from PHPP

ENERBUILD: Final Result 5.4 Page 29 of 79User habits, impact on energy consumption in passive houses
Energy consumption (annual heating demand)
Energy Consumption
Energy performance (monitored) 35,2 kWh/(m²a)
Primary energy (monitored) 86,4 kWh/(m²a)
Energy performance (calc. with PHPP)
37,5 kWh/(m²a)
Energy performance (calc. with regional calculation tool)
101,3 kWh/(m²a)
Calculation tool for energy certification
PHPP
Certification(energy label)
In general, the largest part of energy consump-tion of the building is the household electricity (incl. Energy for the building services). During winter the heat pump also has a high proportion. Unfortunately, values for the winter are missing but the measured data indicates that the propor-tion of energy for heating and domestic hot wa-ter in this period can rise up to nearly 50%. Direct electric heating of the supply air is only required to compensate peak loads during winter. Direct electric heating of the buffer is needed, however, almost never.
Internal air comfort
The monthly average temperatures in the diffe-rent rooms are in an acceptable range between 21 °C and 25 °C. The temperature profile of the extract air shows the effectiveness of the ventila-tion system. The effectiveness of the ventilation system is, that in summer the hot air inside the rooms is blown outside, resulting in a lower inter-nal temperature. During winter the temperature of the extract air is lower than inside the rooms. The technical reason is the effective counter cur-rent heat exchanger in the compact unit.
Conclusions
The measured and calculated external air tem-perature and global radiation show that they mostly accord to the projected values of PHPP. The climate data used in the PHPP are well sui-ted for projecting energy efficient buildings. In the case of measured and calculated ambient air temperature it was noted a discrepancy. The monthly average values of ambient air tempera-ture in all rooms were higher than projected.
The monitored energy consumption was margi-nally lower than the projected. One reason the-refore is the measured external air temperature which is over the entire measurement period higher than projected. High temperature in the interior compensates this, but nevertheless in to-tal it leads to lower energy consumption.
Figure 38: Heating system House Prantl, Wolfratshausen
Fig. 37: Monthly energy consumption House Prantl, Wolfrats-
hausen
Fig. 36: Comparison of monitored external air temperature and global radiation with standard weather data from PHPP

Page 30 of 79 ENERBUILD: Final Result 5.4User habits, impact on energy consumption in passive houses
Measurement data acquisition Interpretation of statistical results - Upper Bavaria
Building details
Location Building type III
Category/building type Apartment building
Year of construction 2009
Energy performance* 22 kWh/(m²a)
Certification Next to passive house
MonitoringLevel I and II„detailed”
Tenants/owners Tenants m a.s.l. 511
Building size (TFA)** 682 m² HDD/CDD 3.875 HDD/a (15/20)
Number of apartments 11 Occupancy (total) Varies
*calculated with PHPP **referring to the energy performance above (PHPP)
Architecture
The apartment building is located in a deta-ched building area and terrace house area in the municipality Bruckmühl. The existing buil-ding of the 1960s was reconstructed in 2009. Within this reconstruction nearly the complete building services were renewed. The attic was broke down and an attic floor was built in timber construction. The new attic floor contains three additional apartments. All 11 apartments recei-ved a central ventilation system. The insulation cladding was built of prefabricated, ecological timber work elements which were placed in front of the existing face of the building to achieve a fast and smooth construction sequence. The building now contains three full storeys utilized as residence only. All of the storeys are heated during the winter season.
Building services
The heating demand is covered by a 9,2 kW wood pellet boiler. The heating system includes thermal buffer storage which provides space he-ating and hot domestic water. The main type of the buildings heat distribution is air borne and only if required heat is provided by means of panel-type radiators. In addition there are 20 m² of solar thermal collectors which also provide energy for heating the hot water to its set-point temperature of 55°C. For the distribution of wa-ter there is a circulation pump which is switched on 18 hours per day. The building has a balanced ventilation system with heat recovery. The air of the ventilation is also preheated with electricity. Each apartment is appointed with one ventilati-on appliance which is installed below the kitchen ceiling. It has a heat recovery of 84% according to PHPP.
Construction
The windows and glazing have a mean U-value of 0,77 W/(m²K), exterior walls of ground and first floor 0,13 W/(m²K), exterior wall (thick wood construction) attic floor 0,119 W/(m²K), roof 0,1 W/(m²K) and ceiling 0,28 W/(m²K). The air tight-ness is 0,60 h-1 according to PHPP.
Description of Monitoring System
Period of measurements 10/10 – 02/12
Monitoring system „detailed”
Comfort/Indoor climate (1st and 2nd floor)
Indoor air temperature [°C]
Relative humidity [%]
CO2[ppm]
Outdoor climate (weather station)
Temperature [°C]
Relative humidity [%]
Global radiation [W/m²]
Monitoring results and interpre-tation - House Bruckmühl, Bruck-mühl, Upper Bavaria
The apartment building is located in a detached building area and terrace house area in the mu-nicipality Bruckmühl. The existing building of the 1960s was reconstructed in 2009. Within this reconstruction nearly the complete building ser-
Passive House Bruckmühl

ENERBUILD: Final Result 5.4 Page 31 of 79User habits, impact on energy consumption in passive houses
vices were renewed. The attic was broke down and an attic floor was built in timber construc-tion. The new attic floor contains three additio-nal apartments. All dwellings received a central ventilation system. The insulation cladding was built of prefabricated, ecological timber work elements which were placed in front of the exi-sting face of the building to achieve a fast and smooth construction sequence. The building now contains three full storeys utilized as resi-dence only. All of the storeys are heated during the winter season.
The building has following dimensions:
• Heat transmitting envelope area (external di-mension): 1.377 m² (lt. PHPP)
• Total floor area (external dimension): 298 m²
• Residential floor area (internal dimension): 254 m²
• Total heated volume (external dimensions): 2966,7 m³
• S/V (surface/volume-factor): 1.377m²/ 2966 m³= 0,46 1/m
The building has 11 dwellings. 7 of them have two rooms, bath and kitchen. Three dwellings have three rooms and one dwelling has four rooms, bath and kitchen.
The two monitored dwellings are in the bottom and intermediate storey at the north west of the building. Each of them has three rooms and one bathroom excluding the kitchen.
Comparison of indoor air conditions of two different flats
The following graphs show a comparison bet-ween two different homes to identify the user influence on the internal climate.
The comparison of the indoor temperatures of the two dwellings shows a relatively large user in-fluence. In general inhabitant 2 has lower tempe-ratures. In addition to that, the second dwelling was not inhabited in January 2011 for 4 weeks. In the summer the user influence disappears nearly completely due to the lack of an active cooling system for the internal air.
The relative humidity in the two compared ba-throoms is very similar. In the other rooms, the temperature differences shown before are re-flected in the relative humidity.
The CO2 concentration in bedroom 1 tends to be higher and is more often over the 1.000 ppm criterion than in the second one. This is because inhabitant 1 is very sensitive to noise, so he turns off the ventilation system overnight. Nonethe-less, the air quality is also within an acceptable range most of the time.
Fig. 39 and 40: Comparison of indoor climate in two different
flats
Fig. 41 and 42: Comparison of CO2 concentration in
two different bedrooms of two different flats

Page 32 of 79 ENERBUILD: Final Result 5.4User habits, impact on energy consumption in passive houses
Summing up in the following the external climate of the region South Tyrol during the monitoring period compared with the standard climate is il-lustrated. Furthermore an Overview of measured thermal energy consumption of monitored buil-dings as well as of the measured indoor comfort is given:
External climate of the region South Tyrol
As illustrative climate for the region South Tyrol, weather data of the city Bolzano are shown in the following diagram (left side). Bolzano has 2.791 heating degree days in accordance to the Italian building code. Bolzano is one of the warmer mu-nicipalities of the relative Province (geographi-cally called South Tyrol). Maximum and minimum heating degree days of other municipalities ran-ge between 5.000 HDD and 2.600 HDD.
Measured data over the monitoring period 2011-2012 from the weather station of Bolzano show slight higher temperatures for almost all months (diagram right side). Only the month October and February were 0,7 K colder than the ave-rage. The calculated heating degree days for Bolzano of the heating period in winter 2011-12 amount to 2.488 HDD and confirm that the year 2011-12 was warmer than the average.
Evaluation of measured data – South Tyrol
In the region South Tyrol five passive houses were monitored in Level II. Two one-family houses were examined in detail with fixed installed mo-nitoring instruments, located in Caldaro (3.035 HDD) and Tesimo (3.456 HDD) with warmer cli-mate than the average climate of the region. The monitoring data was analysed for the win-ter period from October 2011 to April 2012. Two other buildings, another one-family house and a multi-family house with three apartments where monitored in detail by analysing data from the installed building management system (BMS) as well over the heating period 2011/2012. These two buildings are located in San Lorenzo (3967 HDD) and Selva di Gardena (5.072 HDD) with a colder climate than the average standard cli-mate of South Tyrol. The fifth monitored pas-sive house building is a multi-family house with eight apartments, built by the institute for social housing „IPES” in 2006. The monitoring cam-paign started in July 2006 and ended in sum-mer 2009. For the project ENERBUILD one year from the middle of April 2008 to the middle of April has been examined in detail. The building is located in Bronzolo (2.659 HDD) with a mild warm climate. The heating degree days of the five houses above were provided by the Cli-mate House Agency. According to the selection criteria for climate, as stated before under the chapter of „selection criteria for passive houses (categorization)”, the monitored passive houses should range within a typical climate for the partner region and avoid extreme exceptions. For the region South Tyrol this would mean a climate between 3.000 and 4.000 HDDs. In the region South Tyrol however two exceptions were made: the passive house Selva di Gardena with 5.072 was chosen, because there was the oppor-tunity to analyse data from the existing manage-ment system (BMS). In case of House Bronzolo, with 2.659 HDDs existing data was analysed for ENERBUILD with the advantage to analyse the performance of a multi-family house in a warmer climate.
Main purpose of monitoring in South Tyrol was to assess the energy performance as well as verifying the conditions of living comfort. On the one hand this meant to compare the design values with the real ones actually found and to check if the rea-son for a deviation is due to different outdoor cli-mate conditions or diverse building use (indoor temperatures, ventilation, shading, etc.) than projected. On the other hand it meant to report the presence of any deviations from the design and the possibility of optimization and remedies. In addition it also meant to perform the compa-rison with other passive houses monitored in the alpine space particularly regarding the comfort conditions during the summer period.
Measurement data acquisition Interpretation of statistical results
Fig. 43: Temperature, relative humidity and solar radiation measured in Bolzano during the year 2011-2012
Fig. 44: Comparison of measured temperature and global radiation with standard values.
EURAC - European Academy of BolzanoInstitute for Regional Development and Location ManagementViale Druso 1 39100 Bozen T:+39 0471 055 055www.eurac.edu

ENERBUILD: Final Result 5.4 Page 33 of 79User habits, impact on energy consumption in passive houses
Fig. 45: Comparison of measured thermal energy consump-tion and thermal energy demands as outputs from PHPP and XClima.
Overview of measured thermal energy con-sumption of monitored buildings
The illustrated thermal energy consumption of the figure below was normalized to external and internal climate. The diagram shows the comparison with the projected annual heating demand calculated with PHPP and the local en-ergy calculation software XClima, to be used for building certification. The measurements show for all buildings results closed to the calculation. In case of two monitored one-family houses the measured energy consumption for heating was even lower than the planned one. In the three other cases however the measured energy con-sumption is from about two to three times higher than the values calculated with XClima.
Overview of indoor comfort in winter and summer
Looking at the indoor comfort in winter the in-door measurements show that both one-family houses during the month December, January and February are within the comfort zone de-fined by ASHRAE (diagram left side). That me-ans that with typical clothing for wintertime the inhabitant felt very comfortable regarding the perception of indoor temperature in combina-tion with indoor relative humidity. In these two cases during three winter month the air humidity was never too low.
The monitoring of indoor climate in all eight apartments of the multi-family house Bronzolo shows a similar result: measured temperatures range in all eight apartments in all month most-ly in the winter comfort zone. In some hours in January however the indoor conditions of apart-ment 2 (purple) were out of the winter comfort zone: too low temperatures with about 18°C and at the same time too dry air, with a relative humi-dity around 25%. In case of apartment 6 (beige) in some rare situations the temperature is too low (but higher than in apartment 2) with about
19°C and the air is again too dry at the same time – here relative humidity values under 20% were measured.
For the evaluation of summer comfort the two one-family houses located in San Lorenzo and Selva di Gardena and therefore located in colder climate than the average climate of the region, where compared with the adaptive model of comfort (UNI EN 15251: 2008) regarding espe-cially the summer month August.
The adaptive model of comfort (see diagram below) is used for evaluating the indoor com-fort during summer time for buildings without air conditioning. The use of a mechanical ven-tilation system is the limit of applicability of the model.
In this adaptive model of comfort the occupant of a building is no longer simply intended as a passive subject, but as an active agent that in-teracts at all levels with the indoor environment she/he is surrounded by. The adaptive model of comfort proposes a correlation between the comfort temperature for the occupants of a buil-ding (To) and the outside air temperature (Te).
Fig. 46: Evaluation of thermal comfort in wintertime for two one-family houses from December 2011 to February 2012
Fig. 47: Evaluation of thermal comfort in wintertime for eight apartments in a multifamily building.

Page 34 of 79 ENERBUILD: Final Result 5.4User habits, impact on energy consumption in passive houses
The model is based on three measurements: in-door air temperature, surface temperature and outside air temperature. The diagram represents the acceptable temperatures during the summer season (red lines) and winter (blue lines). The ca-tegories I, II and III correspond to types of buil-dings with minimum and maximum acceptable air temperature (UNI EN 15251:2008).
The elaboration performed and reported in the graphs put in correlation a daily outdoor moving average temperature (weighted average inclu-ding seven days before the analysed one) and hourly indoor average temperature. In this way every x-point has 24 related y-points. The results show that both buildings range within the three categories of acceptable temperatures. Tempe-ratures in House Selva di Val Gardena (in the dia-gram below in red) are on an average lower than in House San Lorenzo (in orange), as it has also a colder outdoor climate.
Even the measurement in the multi-family house in Bronzolo, which is situated in a really warm climate compared to the mean average outdoor climate of the region, shows that in all eight apartments the indoor climate during July was comfortable according to the adaptive model of comfort.
Fig. 48: Evaluation of thermal comfort in summertime for two different one-family house during August 2010
Fig. 49: Evaluation of thermal comfort in summertime for eight apartments in a multifamily building.
Building details
Category/building type Building Type I
Typology of building One family house
Year of construction 2008/2009
Energy performance* 9,66 kWh/(m²a)
Certification CasaClima Oro
MonitoringLevel I and II „detailed”
Tenants/owners Building owner m a.s.l. 510 m
Building size (TFA)** 151,8 m² HDD/CDD 3.074 (12/20)
Number of apartments 1 Occupancy (total) 2 adults, 3 children
*calculated with regional calculation tool („CasaClima-Software”)**referring to the energy performance above (regional calculation)
Architecture
The One-family house is located in a rural area with mainly one-family buildings at the foot of the mountain range „Mendola” nearby the lake of Caldaro south of Bolzano. The old part of a barn from ca. 1915 was demolished and rebuilt during 2008/2009 for residential use. The ther-
mal envelope of the semidetached house con-tains two full storeys and one attic floor. The plant room is located in the semi-subterranean basement outside the thermal envelope. The building was built with passive house standard and certified with the local standard of energy consumption „CasaClima Oro”, which means a heating demand in relation to net area of 9.66
Measurement data acquisition Interpretation of statistical results - South Tyrol
House Caldaro, South Tyrol

ENERBUILD: Final Result 5.4 Page 35 of 79User habits, impact on energy consumption in passive houses
kWh/(m²a). As the building is attached to the existing building with its southwest façade it has less solar gains from this side. The roof ridge of the saddle roof is therefore southwest – nor-theast orientated.
Building services
The heating demand is covered by a compact unit with a geothermal heat pump (air-brine) ba-sed on a 120 running meter surface collector in the underground (-1,5 m) of the backyard. The brine circuit is used as energy source for heating and hot domestic water and also to keep the in-coming outdoor air free from freezing. The heat pump covers the following three functions: hot domestic water, space heating by means of sup-ply air (max. air quantity: 230 m³/h) and space he-ating by means of low temperature floor heating circuit (about 3 kW). The compact unit contains a balanced ventilation system with heat recovery. No cooling system as well as no solar technolo-gies is used.
Construction
The construction method is brick wall with a thermal insulation composite system – the ex-terior walls are built of 20 cm „Poroton” bricks with „EPS” insulation of 30 cm (U-value: 0,092 W/(m²K)). The ceiling above the basement con-sists of „EPS” insulation of 30 cm plus the re-inforced concrete floor of 30 cm plus the usual floor construction (U-value: 0,097 W/(m²K)). The wooden roof is built of wooden rafters of 10/30 cm (distance 1,20 m) plus 30 cm cellulose insu-lation in the space between and a wood fibre-board on the outside of 12,2 cm (U-value: 0,103 W/(m²K)). The triple glazing has a g-value of 0,52, the weighted mean Uw-value according to area is 0,76 W/(m²K). The measured air tightness was 0,2 h-1.
Description of Monitoring System
Period of measurements 10/11 – 04/12
Monitoring system „detailed”
Electric energy consumption
Total electricity consumption [kWh]
Power meter: Heat pump [W]
Power meter: Ventilation system [W]
Power meter: Circulation pump floor heating circuit
[W]
Power meter: Circulation pump brine circuit
[W]
Thermal energy consumption
Heat meter: floor heating circuit [kWh]
Heat meter: Geothermal collec-tor circuit
[kWh]
Heat meter: Hot domestic water circuit
[kWh]
Temperature: Brine circuit (after preheating)
[°C]
Ventilation system: Comfort and efficiency of heat recoveryAir temperature in the air chan-nels
[°C]
Air velocity in the channel [m/s]
Comfort/Indoor climate (1st and 2nd floor)Indoor air temperature [°C]
Relative humidity [%]
CO2 [ppm]
Surface temperature (external wall)
[°C]
Outdoor climate (weather station)
External Temperature [°C]
Relative humidity [%]
Global radiation [W/m²]
Monitoring results and interpreta-tion - House Caldaro, South Tyrol
The single family house was monitored in de-tail with fixed installed monitoring instruments within a long-term monitoring-campaign. The analysed period was the winter period from Oc-tober 2010 to April 2011; the energy consumpti-on was calculated for the heating period of the location Caldaro where it longs form the 10th of October to the 20th of April.
Fig. 50: Monitoring scheme of building equipment

Page 36 of 79 ENERBUILD: Final Result 5.4User habits, impact on energy consumption in passive houses
External climate
Caldaro is known for mild, sunny climate. Near the village is the Caldaro Lake, the warmest lake in the Alps. Caldaro lies on about 260m over sea-level and has 3.035 heating degree days (source: CasaClima Agency).
The measured external climate data showed that the winter was warmer than the standard winter with 2.540 HDD (12/20) from measured data in comparison to standard climate data with 3035 HDD (12/20) and to Meteonorm generated file for the specific location with 2.644 HDD (12/20).
The maximum measured temperatures arrived to 29°C at the end of April and minimum tempe-rature to -9°C the first days of February.
Energy consumption
Energy Consumption
Energy performance (monitored) 10,3 kWh/(m²a)
Primary energy (monitored) 29,9 kWh/(m²a)
Energy performance (calc. with PHPP)
14 kWh/(m²a)
Energy performance (calc. with regional calculation tool)
10 kWh/(m²a)
Calculation tool for energy certification
XClima
Certification(energy label)
CasaClima Oro
Thermal energy for heating was measured with 10,3 kWh/m²a (PHPP calculation 14kWh/m²a and CasaClima calculation 9,7 kWh/m²a). A norma-lization factor which takes into account the real heating degree days, calculated with measured external and internal air temperatures, was esta-blished. The result amounts to 10,1kWh/m²a be-
cause of higher indoor air temperatures, which ranges from 21,6°C to 24,0°C.
Thermal energy for domestic hot water ranges from 150 kWh to 190 kWh a month. This gives an average value of about 2.000 kWh/year and an average consumption per capita of 42kWh/person/month. During the heating period the overall energy consumption for heating was only slight higher (1.180kWh) than the domestic hot water consumption (1.120kWh). Over the year the hot water consumption takes up the large part of the thermal energy as it is often common for low energy and passive houses.
During the heating period 81 % of the electric energy was used for household and lighting and 19% for the building equipment. In absolute numbers this corresponds to ca. 5.450 kWh for household and lighting and to ca. 1.260 kWh for the building equipment. The heat pump is the biggest consumption among the appliances and reaches the maximum consumption in January with about 225 kWh/month, the other electric energy components of the plant consume about 37 kWh/month. A seasonal performance factor as relation of produced thermal energy and con-sumed electric energy was calculated with 1.7.
Fig. 51: Comparison of measured monthly average tempe-ratures and monthly sum of horizontal global radiation with Meteonorm climate data.
Fig. 52: Monthly Energy consumption for heating, domestic hot water, solar radiation and normalized heating degree days.
Fig. 53: Monthly electric energy consumptions household and building services.
Measurement data acquisition Interpretation of statistical results - South Tyrol

ENERBUILD: Final Result 5.4 Page 37 of 79User habits, impact on energy consumption in passive houses
Fig. 54: Monthly electric energy consumptions for different appliances.
Internal air comfort
The hygrothermal comfort was evaluated as good during the entire winter period. In the di-agram below data points are hourly average va-lues. Data points for operative temperature are average values of the air the temperature and one surface temperature of an internal wall for the ambient. Only a few measurements were outside of the winter comfort zone because of too high temperatures in October. The average higher room temperature is a choice of the in-habitants which tends to have temperatures around 22°C. Also the humidity was evaluated as very comfortable in the building by having most of the time relative humidity at 30-50%.
Data points for operative temperature are ave-rage values of the air the temperature and of one internal surface temperature of a wall in the living room.
Ventilation system
The air exchange though the ventilation system showed to be efficient and to ensure a high in-
door air quality. As measurements showed, high CO2 concentrations were avoided. In 88% of the wintertime, CO2 concentrations under 1.000 ppm persisted in the living room. In the bedroom the result was even better with 97% of the time un-der 1.000 ppm, which in the hygienic range of the Pettenkofer limit for continuous occupied spaces (ÖNORM H 6000-5).
The effectiveness of the heat recovery was eva-luated in average about 90% (in this average the post- heating up of the air by the heat pump is included). Some snapshots showed lower ef-fectiveness of the heat recovery when the heat pump did not contribute. In this cases low „Air In – temperatures” with minimum of 16°C were measured, but evaluated as unproblematic for the users comfort, as the air is immediately mixed with the room air.
Conclusions
The measured external climate data showed that the winter in Caldaro was warmer than the standard winter. A deviation from the reference heating degree days (CasaClima Agency) was calculated as 19% and from PHPP (Meteonorm generated climate file) as 4%.
Internal measured average air temperature was 22,4°C for the living room and 22,0°C for the be-droom during the heating period 2011-12. From these values it can be presumed that the ove-
Fig. 55: Temperature and absolute humidity of ambient air in winter 2011-2012 with Ashrae comfort zones for the summer and winter period.
Fig. 56: Measured temperatures in the ventilation pipes.
Fig. 57: CO2 concentrations during the heating period.

Page 38 of 79 ENERBUILD: Final Result 5.4User habits, impact on energy consumption in passive houses
rall average temperature of the heated volume of the building is higher than 20°C, which is the reference temperature of the national standard. Measured thermal energy consumption for he-ating (10 kWh/m²a) was lower than the calcula-ted space heating demand (PHPP 14kWh/m²a/ CasaClima tool 11 kWh/m²a). The result confirms not only a good planning of the building, but also a good construction work. On the other side it shows a correct managing of the passive house with environmental- conscious users, who are well informed about functioning of their pas-
sive house. During the considered winter period, 81% of the electric energy was used for dome-stic electricity and 19% for the building equip-ment. The ventilation system worked well with adequate air exchanges and air velocity, what assured low CO2 concentrations (90% of time <1.000ppm) and good heat recovery. The hygro-thermal comfort in wintertime was evaluated as very good. Temperatures with around 22°C and relative humidity in the range from 30-50% con-firm optimal comfort conditions.
Building details
Category/building type Building Type II
Typology of building One family house
Year of construction 2007
Energy performance* 16 kWh/(m²a)
Certification CasaClima A
MonitoringLevel I and II „detailed”
Tenants/owners Building owner m a.s.l. 635 m
Building size (TFA)** 194 m² HDD/CDD 3.456 (12/20)
Number of apartments 1 Occupancy (total) 2 adults, 2 children
*calculated with regional calculation tool („CasaClima-Software”)**referring to the energy performance above (regional calculation)
Architecture
The One-family house is situated in a rural area, outside the village Prissiano, on a plateau of about 650 m a. s. l. in the middle between Me-rano and Bolzano. It was built during 2006/2007. The thermal envelope contains three full storeys, the ground floor, first and second floor, whereas the basement is not part of the thermal envelo-pe. The building was built with passive house standard and certified with the local standard of energy consumption „KlimaHaus A+”, which means a heating demand in relation to gross net area of 16 kWh/(m²a) - (limit 30 kWh/(m²a)). The „plus” is assigned to buildings, which show a su-stainable construction method.
As the building is placed in front of a wooded mountain-range (direction SW), and the direc-tion of the roof ridge (saddle roof) is EW, it has less solar gains, especially in wintertime from the SW-side.
Building services
The heating demand is covered by a compact unit with a geothermal heat pump (air-brine)
based on a borehole heat exchanger (depth drilling) in the underground with a depth of 82 meter in the backyard. The brine circuit is used as energy source for heating and hot domestic water and also to keep the incoming outdoor air free from freezing. The heat pump covers the following three functions: hot domestic water, space heating by means of supply air (max. air quantity: 230 m³/h) and space heating by means of low temperature floor heating circuit (about 3 kW). The compact unit contains a balanced ven-tilation system with heat recovery.
Construction
The saddle roof is fitted on the three full storeys as an open ventilated „cold” roof construction. The thermal envelope (including external walls, basement ceiling and top floor ceiling) consists all-around of a wood construction with TJI be-ams and in between cellulose (thickness 40 cm), placed on a concrete basement. On the inner side the system is closed and stiffened with an OSB-board. In case of the external walls the sy-stem is closed and isolated on the outer side with a plastered wood fibreboard (U-value: 0,97
Measurement data acquisition Interpretation of statistical results - South Tyrol
Passive House Mair, Tesimo, South Tyrol

ENERBUILD: Final Result 5.4 Page 39 of 79User habits, impact on energy consumption in passive houses
W/(m²K)), in case of the top floor ceiling with another OSB-Board under a wooden casing, on the inner side an insulated installation layer of 50 mm (U-value: 0,096) – the basement ceiling has an U-value of 0,106 W/(m²K) with boarding and floating floor on the described wooden system. All windows are with a wooden frame and triple glazing (Ug-value: 0,52 W/(m²K); UW-value: 0,85 W/(m²K) – according to passive house certificate on the implemented window). All balconies have a thermal bridge free structure. South-East side: wooden construction (built on stilts), North-East side: steel construction (built on stilts: first floor – suspended: second floor).
Description of Monitoring System
Period of measurements 11/11 – 04/12
Monitoring system „detailed”
Electric energy consumption
Total electricity consumption [kWh]
Power meter: Heat pump [W]
Power meter: Ventilation system [W]
Power meter: Circulation pump floor heating circuit
[W]
Power meter: Circulation pump brine circuit
[W]
Thermal energy consumption
Heat meter: floor heating circuit [kWh]
Heat meter: Geothermal collec-tor circuit
[kWh]
Heat meter: Hot domestic water circuit
[kWh]
Temperature: Brine circuit (after preheating)
[°C]
Ventilation system: Comfort and efficiency of heat recoveryAir temperature in the air chan-nels
[°C]
Air velocity in the channel [m/s]
Comfort/Indoor climate (1st and 2nd floor)Indoor air temperature [°C]
Relative humidity [%]
CO2 [ppm]
Surface temperature (external wall)
[°C]
Outdoor climate (weather station)
External Temperature [°C]
Relative humidity [%]
Global radiation [W/m²]
Monitoring results and interpreta-tion - Passive House Mair, Tesimo
The single family house was monitored in de-tail with fixed installed monitoring instruments within a long-term monitoring-campaign. The analysed period was the winter period from Oc-tober 2010 to April 2011; the energy consumpti-on was calculated for the heating period of the location Tesimo where it longs form the 01th of October to the 30th of April.
External climate
Tesimo is situated 630 meters above sea level on a low mountain range and it is characterized by mild Mediterranean climate.
The measured external climate was evaluated as warmer than the standard winter of the village. The measured heating degree days confirm this assessment with 2.869 HDD (12/20) in compa-rison to standard climate data with 3.456 HDD (12/20) and to Meteonorm generated file for the location with 3.680 HDD (12/20).
The maximum measured temperatures arrived to 22,1°C in the end of April and to minimum temperature of -11,5°C during the first days of February. Measured global radiation showed to be lower than the standard value for this site, which can be caused by the obstruction from the hill on the south-west side of the building.
Energy consumption
Energy Consumption
Energy performance (monitored) 31,5 kWh/(m²a)
Primary energy (monitored) 29,6 kWh/(m²a)
Fig. 58: Comparison of measured monthly average temp and monthly sum of horizontal global radiation with Meteo-norm interpolated weather data of the location Tesimo
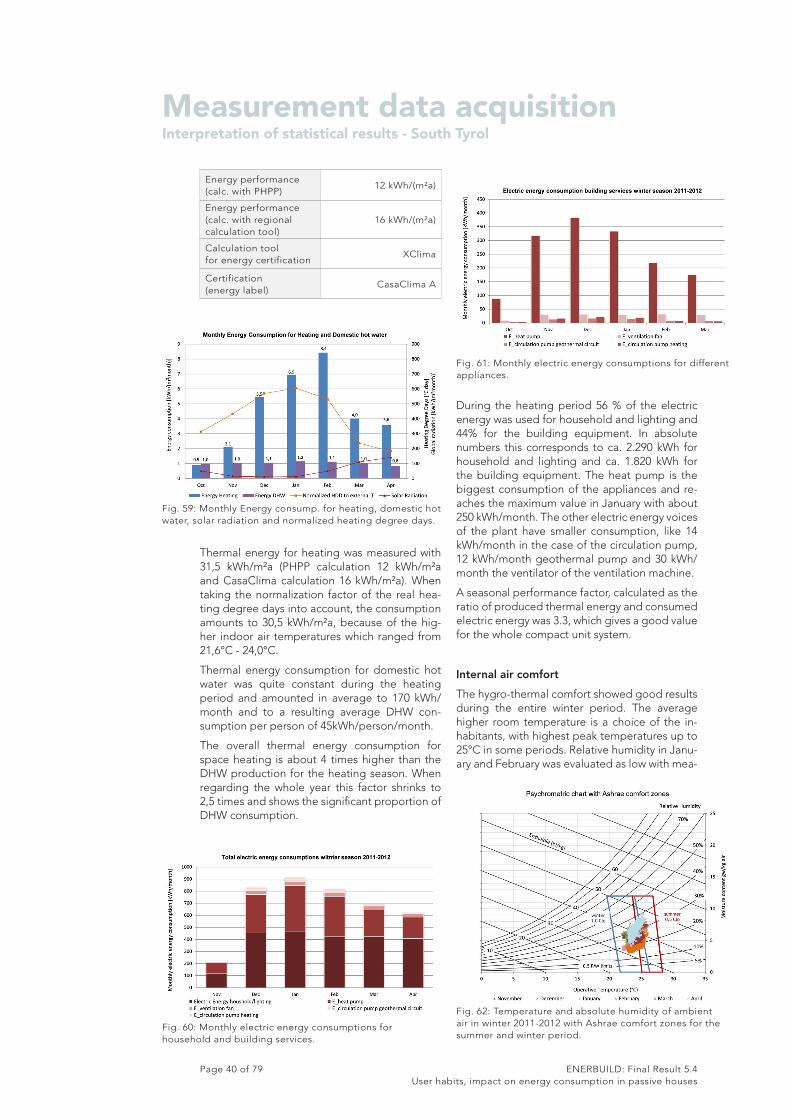
Page 40 of 79 ENERBUILD: Final Result 5.4User habits, impact on energy consumption in passive houses
Energy performance (calc. with PHPP)
12 kWh/(m²a)
Energy performance (calc. with regional calculation tool)
16 kWh/(m²a)
Calculation tool for energy certification
XClima
Certification(energy label)
CasaClima A
Thermal energy for heating was measured with 31,5 kWh/m²a (PHPP calculation 12 kWh/m²a and CasaClima calculation 16 kWh/m²a). When taking the normalization factor of the real hea-ting degree days into account, the consumption amounts to 30,5 kWh/m²a, because of the hig-her indoor air temperatures which ranged from 21,6°C - 24,0°C.
Thermal energy consumption for domestic hot water was quite constant during the heating period and amounted in average to 170 kWh/month and to a resulting average DHW con-sumption per person of 45kWh/person/month.
The overall thermal energy consumption for space heating is about 4 times higher than the DHW production for the heating season. When regarding the whole year this factor shrinks to 2,5 times and shows the significant proportion of DHW consumption.
During the heating period 56 % of the electric energy was used for household and lighting and 44% for the building equipment. In absolute numbers this corresponds to ca. 2.290 kWh for household and lighting and ca. 1.820 kWh for the building equipment. The heat pump is the biggest consumption of the appliances and re-aches the maximum value in January with about 250 kWh/month. The other electric energy voices of the plant have smaller consumption, like 14 kWh/month in the case of the circulation pump, 12 kWh/month geothermal pump and 30 kWh/month the ventilator of the ventilation machine.
A seasonal performance factor, calculated as the ratio of produced thermal energy and consumed electric energy was 3.3, which gives a good value for the whole compact unit system.
Internal air comfort
The hygro-thermal comfort showed good results during the entire winter period. The average higher room temperature is a choice of the in-habitants, with highest peak temperatures up to 25°C in some periods. Relative humidity in Janu-ary and February was evaluated as low with mea-
Fig. 59: Monthly Energy consump. for heating, domestic hot water, solar radiation and normalized heating degree days.
Fig. 60: Monthly electric energy consumptions for household and building services.
Fig. 61: Monthly electric energy consumptions for different appliances.
Fig. 62: Temperature and absolute humidity of ambient air in winter 2011-2012 with Ashrae comfort zones for the summer and winter period.
Measurement data acquisition Interpretation of statistical results - South Tyrol

ENERBUILD: Final Result 5.4 Page 41 of 79User habits, impact on energy consumption in passive houses
surements under 20%. In average it ranged from 20% to 34% during the considered winter period.
In the diagram below, hourly average values were used. The operative temperature was sim-plified considered as average values of the air temperature and one surface temperature of an internal wall of the room.
The ventilation system was evaluated in terms of temperature, effectiveness and CO2 concentrati-on, as well working. The air exchange was good, as high CO2 concentrations (over 1.000ppm) were in 90% of the functioning time avoided.
The effectiveness of the heat recovery was evalu-ated for some periods when the heat pump was not post-heating the incoming air. The values ranged from 37% to 80%. Temperature of supply air during these periods was quite low (minimum temperature around 14°C), but the temperature does not negative influence the users comfort, because the air is mixed with the circulating room air.
Conclusions
The measured external climate data showed that the winter 2011-2012 in Tesimo was warmer than the standard winter. A deviation from the stan-dard heating degree days (HDD) was calculated as 20% and from PHPP (Meteonorm generated climate file) as 28%.
Internal average air temperature was measured as 23°C-24°C in the living room and 21°C – 22°C in the bedroom during the heating period 2011-12. From these values it can be presumed that the overall average temperature of the heated volume of the building is higher than 20°C, which is the reference temperature of the natio-nal standard for energy calculation.
Thermal energy consumption for heating was measured as 31,5 kWh/m²a and was higher than the calculated space heating demand with PHPP (12 kWh/m²a) and with CasaClima tool (16 kWh/m²a). The normalization to external and internal temperature decreases the measured value only for ca. 1kWh to 30kWh/m²a. The reason for the higher consumption could be in part lower solar gains of the location which is caused by obstruc-tion of the building on the south-west side. On the other hand, the user behaviour with manual window opening, that could have caused higher ventilation losses as predicted in the calculation, with relative higher energy consumption for he-ating.
Electric energy consumption of the building amounts to 56% for domestic electricity and to 44% for building plant equipment during the winter period, while the difference of the two percentages increases when considering the whole year. The ventilation system worked well with adequate air exchanges and air velo-city, what assured low CO
2 concentrations (90% of time <1.000ppm). The comfort during win-tertime was evaluated as good. Temperature around 23°C and relative humidity in the range from 20-34% gave acceptable, even if not energy efficient, indoor conditions.
Fig. 63: Measured temperatures in the ventilation pipes.
Fig. 64: CO2 concentrations during the heating period.

Page 42 of 79 ENERBUILD: Final Result 5.4User habits, impact on energy consumption in passive houses
Building details
Category/building type Building Type II
Typology of building Multi-family house
Year of construction 2009
Energy performance* 9 kWh/(m²a)
Certification CasaClima Oro
Monitoring Level I and II „simple”
Tenants/owners Building Owner + tenants m a.s.l. 784 m
Building size (TFA)** 393 m² HDD/CDD 4.086 (12/20)
Number of apartments 3 Occupancy (total) 4 adults, 1 child
*calculated with regional calculation tool („CasaClima-Software”)**referring to the energy performance above (regional calculation)
Architecture
The building is part of a farmer house, located in Palù (Moos), a little hamlet southwestern of the municipality of San Lorenzo in „Val Pusteria” (the valley). The old part of the living space was demolished and rebuilt in 2009 with the passive house standard and certified with the local stan-dard of energy consumption „Casa Clima Oro”. The gable of the double pitch roof is West-East oriented, parallel to the west-east course of the valley. The thermal envelope of the building con-tains two full storeys and the attic floor. The cellar and the staircase are situated outside the ther-mal envelope. The building contains one apart-ment on the ground floor, another apartment on the ground and second floor with internal stair, and a third apartment on the top floor.
Building services
The building has two central controlled venti-lation systems with heat recovery installed in a central heating room in the cellar – one is for the apartment on ground and first floor and the other supplies the two other apartments toge-ther. The thermal energy for heating and hot domestic water is produced by a central pellet boiler and stored in buffer storage of 650 l. The apartments are heated by floor and wall heating.
Construction
The exterior walls with an U-value of 0,11 W/(m2K) are a wood frame construction with frame type columns in solid wood and in-between an insulation of wood fibreboards with a thickness of 20 cm, boarded on both sides with OSB-boards. On the outer side: insulation over the frame type columns in wood fibreboards (8 cm), which are plastered; on the inner side: installa-
tion layer with insulation in wood fibreboard (8 cm), inner casing with gypsum plaster board. The gable roof with an U-value of 0,11 W/(m2K) is constructed with rafters of solid wood and in-between insulation of wood fibreboards with a thickness of 18 cm. On the outer side the system is insulated in addition with panels in wood fibre-board of 20 cm. The roof construction is boarded on both sides with a casing of solid wood. The ceiling over the not heated cellar consists of a concrete floor of 20 cm, 12 cm thermal insulation lightweight concrete, 20 cm “Styrodur” under the floor pavement and parquet (U-value: 0,12 W/(m2K). All windows are with triple glazing (Uf = 1,00 W/(m2K); Ug = 0,70 W/(m2K)).
Description of Monitoring System
Period of measurements 05/10 – 05/12
Monitoring system „simple”
Thermal energy consumption
Manual readout of charging level of pellets store
[kg]
Water consumption
Manual readout of hot and cold domestic water (separately)
[m³]
Comfort/Indoor climate (of nearly all rooms)Indoor air temperature [°C]
Outdoor climate (weather station)
Temperature [°C]
Measurement data acquisition Interpretation of statistical results - South Tyrol
Passive House Kirchler, San Lorenzo

ENERBUILD: Final Result 5.4 Page 43 of 79User habits, impact on energy consumption in passive houses
Monitoring results and interpre-tation - House San Lorenzo, South Tyrol
The multy-family house with three apartments in San Lorenzo di Sebato was monitored by data, which were recorded by a building management system (BMS). The analysed period goes from March 2010 to Mai 2012. The energy consump-tion was calculated for the heating period 2010-11, which longs form the 18th of September to the 11th of Mai.
External climate
The settlement San Lorenzo di Sebato lies in the valley Val Pusteria where winters last a long time. Springtime begins in April, but until late spring snow is present. Despite of the fact that the Val Pusteria is surrounded by mountain scenery, in high summer the temperatures might some-times even reach the 30-degree mark. Summer evenings are rather mild. In December, often al-ready in November, winter knocks on the door and covers the mountains and the valleys with snow.
The external climate during the winter period 2011 – 2012 was colder than the standard win-ter of the municipality San Lorenzo. The tem-perature difference is about 2K for almost all month. Also other municipalities in Val Pusteria have registered slightly colder temperatures in the month January and February 2012 than the long-term averages show. This cold winter in Val Pusteria is in contrast with other municipalities in valleys on lower sea-level where milder winters than decennial averages were registered.
The cold winter is evident, when comparing measured heating degree days (4.363 HDD) with standard heating degree days (3.967 HDD).
Energy Consumption
Energy performance (monitored) 39,5 kWh/(m²a)
Primary energy com-pact unit (monitored) 5,5 kWh/(m²a)
Energy performance (calc. with XClima)
9 kWh/(m²a)
Calculation tool for energy certification
XClima
Certification(energy label)
CasaClima Oro
Thermal energy for heating and domestic hot water was calculated from the amount of kg pellet which were consumed during the heating season (ca. 3.960kg) and the consumed cubic meter of domestic hot water.
The thermal energy for domestic hot water ge-neration was calculated with the specific heat of water and the temperature difference of the fur-nished cold water and the set point temperature for DHW. In average a delta T of 50K was presu-med during the heating period, from September to May. With these assumptions the average consumption of hot water was calculated to 40 kWh/person/month.
The thermal energy for heating was obtained by subtracting the monthly DHW-consumption from the total thermal energy. From these values the specific energy for heating was calculated as well through the normalization to external and internal climate: the overall consumption amounts to 39,5 kWh/m²a, the normalization to external and internal climate gave a result of 34kWh/m²a (calculated heat demand CasaClima 9kWh/m²a).
Primary energy was calculated with the non-re-newable energy factor for pellets, which amounts to 0,14. The overall primary energy amounts to 2175 kWh for heating and 254 kWh for domestic hot water for the winter period 2011-2012.
Fig. 65: Comparison of measured monthly average tempe-ratures and monthly sum of horizontal global radiation with Meteonorm climate data.
Fig. 66: Monthly Energy consumption for heating, domestic hot water, solar radiation and normalized heating degree days.

Page 44 of 79 ENERBUILD: Final Result 5.4User habits, impact on energy consumption in passive houses
Internal air
Different spaces were heated up to different set point temperatures according to function and frequency of usage of the inhabitancy. Some spaces were not heated at all and only heated up indirectly through air exchange with other rooms as the Washroom and the Guestroom. For other spaces a set point temperatures of 21°C (Corridor/WC; Corridor 1th floor) was set. Highest temperatures were gathered for the ba-throom with 22°C and for the kitchen and living room with 23°C.
Some set point temperatures were changed and lowered during intermediate season and duri-ng summer time. From the 11th of June – 24th August the heating system was completely swit-ched off. Highest hourly temperature measure-ments were registered at around 28°C in July 2010.
The comfort evaluation (adaptive comfort EN 15251) of the living room for the three hottest month during summer time 2010 showed that most of time values in the highest comfort ca-tegory (I) were reached. Only one day in August with high indoor temperatures around 27°C and outdoor running mean temperatures around 15°C exceeded the boundary of the comfort category II. During the hottest day in August, temperatures arrived to 28°C, but figured in the
comfort zone II because of quite high external running mean air temperatures (approximately 17°C), which results in acceptable indoor tempe-rature comfort.
Values outside of the comfort zone were mea-sured only in one case, because of too low indoor room temperature in August around at 20°C with more than 23°C outdoor running mean tempera-ture. An explication of this circumstance can be a summer storm which produced a temperature drop and cooled down the space.
As operative indoor temperatures in the dia-gram were approximately hourly average tem-peratures used. Out
door running mean temperatures are calculated with average daily temperatures from the last se-ven days.
Conclusions
The external climate during the winter period 2011 – 2012 was colder than the standard win-ter of the municipality San Lorenzo di Sebato. Only a small deviation from the standard hea-ting degree days (HDD) as 9% and from PHPP (Meteonorm generated climate file) as 2%, was calculated.
The set point temperatures of the rooms of the three apartments vary a lot depending on the room function. Some rooms are indirectly hea-ted by other rooms and have low temperature set point temperatures about 5°C to keep the pipes frost-free. Other more intensively used rooms have high set points of 22°C and 23°C in winter. The average temperatures in apart-ment 1 was about 22,3°Cand around 19,3°C, in apartment 2 and 3. These high temperature differences can be interpreted as different re-quirements from different users and their daily routine (first apartment inhabited by family with small child, second and third apartment inhabi-ted by a single person). The heating degree-day normalized to external and internal climate gave a slight negative factor, because of the higher room temperature of all three apartments.
Fig. 67: Internal air temperatures of winter period 2010-2011
Fig. 69: Internal air temperatures and outdoor running mean temperature in summer 2010
Fig. 68: Internal air temperatures of intermediate seasons and of the summer period 2010
Measurement data acquisition Interpretation of statistical results - South Tyrol

ENERBUILD: Final Result 5.4 Page 45 of 79User habits, impact on energy consumption in passive houses
The energy consumption for heating amounts to 40kWh/m²a in comparison to 9kWh/m² space heating demand of the CasaClima calculation. The normalization to external and internal cli-mate gives a result of 34kWh/m²a. The reason for the higher energy consumption was partly
produced by user’s behaviour with higher ven-tilation losses.
The thermal comfort evaluation for the summer period demonstrated a very good working buil-ding. In most of the hours of the hottest months: June, July and August, the highest comfort level was reached (category I, EN 15251).
Building details
Category/building type Building Type II
Typology of building One-family house
Year of construction 2008
Energy performance* 13 kWh/(m²a)
Certification CasaClima A
Monitoring Level I and II „simple”
Tenants/owners Building Owner + tenants m a.s.l. 1.563 m
Building size (TFA)** 192,6 m² HDD/CDD 5.089 (12/20)
Number of apartments 1 Occupancy (total) 2 adults, 1 child
*calculated with regional calculation tool („CasaClima-Software”)**referring to the energy performance above (regional calculation)
Architecture
The one-family house built with a system of solid wood construction is located in Selva, a muni-cipality at the valley end of „Val Gardena” on a sea level of 1.563 m. The old building was demo-lished and rebuilt in 2008 with the passive house standard and certified with the local building en-ergy certification scheme as „CasaClima A”. The thermal envelope contains two full storeys: the ground floor and the top floor, while the base-ment is unheated. The gable of the pitched roof is north-south oriented – the south façade faces the valley bottom.
Building services
The heating demand is covered by a geothermal heat pump based on a borehole heat exchanger (depth drilling) in the underground with a depth of about 80 meters in the backyard. The brine circuit is used as energy source for space heating by means of low temperature floor and panel he-ating circuit, for the production of hot domestic water and also to keep the incoming outdoor air free from freezing. To cover the space heat de-mand especially on cold winter days additionally a tile stove is used, located on the wall between entrance hall and central living room. Moreover the energy demand for hot domestic water is
covered in parts by a solar thermal system with a net-surface of 4,2 m², installed on the cano-py over the garage. To avoid heat losses from non-controlled ventilation a central ventilation system (flow rate from 100m³/h to 250m³/h) with heat recovery is installed. Finally a PV plant with 5,88 kWp, installed on the west side of the gable roof, covers in parts the electric energy demand of the heat pump, the building services and do-mestic appliances.
Construction
All exterior walls are built with a solid wood construction of 17 cm and wood fibreboard on the outer side of 30 cm. On the ground floor and on the north façade the fibreboard is pla-stered, while on the resting parts of the façade it is covered with planking (U-value plastered parts: 0,121 W/(m²K); parts with planking: 0,119 W/(m²K)). The roof construction consists of con-tinuous insulation in fibreboards of 40 cm – the rafters are on the inner side of insulation and completely visible (above rafters: gypsum plaster board and OSB board). The roof has a thermal transmittance of 0,097 W/(m²K). The ceiling over the non-heated basement was constructed in re-inforced concrete of 42 cm, insulated with panels in XPS of 22 cm and a porous concrete of 8cm
Passive House Selva di Val Gardena

Page 46 of 79 ENERBUILD: Final Result 5.4User habits, impact on energy consumption in passive houses
The measured external climate data showed that the winter was warmer than the standard winter (5.072 HDD from standard and 3.846 HDD from measurement). Both generated weather data from Meteonorm (5.437 HDD (12/20)) and stan-dard weather data gave a quite far result compa-red to the measurement.
Climate data clearly shows that the measured temperatures for both 2010 and 2011 were hig-her than the standard external air temperatures.
Energy consumption (annual heating demand)
Energy Consumption
Energy performance (monitored) 20 kWh/(m²a)
Energy performance (calc. with PHPP)
15 kWh/(m²a)
Energy performance (calc. with XClima) (calc. with regional calculation tool)
13 kWh/(m²a)
Calculation tool for energy certification
XClima
Certification(energy label)
CasaClima A
The measured electric energy consumption amounted to 1467 kWh for the heat pump and to 733kWh for artificial lighting during the hea-ting period. Normalising these values to heated floor area, they become 5,9 kWh/m²a electric energy for the heat pump and to 2,95 kWh/m²a for lighting. An estimation for the thermal energy consumption for heating was done with following presumptions: average COP of the heat pump: 3.5; average monthly domestic hot water consumption of 125 kWh for 2 persons and month; domestic hot water production of solar panels (ca. 4m², south orientation, 40°inclinati-on): ca. 1.200kWh.
under the floor pavement and the wooden floor (U-value 0,137 W/(m²K)). The windows are with wooden frames and triple glazing (U-value of the implemented window according to passive house certificate: 0,85 W/(m²K)).
Description of Monitoring System
Period of measurements 11/09 – 05/12
Monitoring system Simple
Electric energy consumption
Electricity consumption for light [kWh]
Electricity consumption of heat pump
[kWh]
Comfort/Indoor climate (of nearly all rooms)Indoor air temperature [°C]
Outdoor climate (weather station)
Temperature [°C]
Wind velocity [m/s]
Illumination on south façade [klux]
Precipitation [l/s]
Monitoring results and interpreta-tion - Passive House Perathoner, Selva di Gardena
House Selva di Val Gardena is a single family house which was monitored in detail by analy-sing data from the installed building manage-ment system (BMS). The analysed period goes from January 2010 to December 2011. The ener-gy consumption was calculated for the heating period of the year 2010-11, which longs form the 25th of August to the 5th of June.
External climate
Spring in Valgardena valley is rather wintery. The temperatures start rising slowly and the warming sun-rays are getting more and more intense. The days are rather mild and temperatures fall under zero degrees at night. July and August, are the warmest months of the year. Temperatures might also reach 30 degrees C, while the evenings are rather refreshing. From beginning of November on, snow can cover the mountain tops. At the end of November, winter conquers the lands-cape and covers the valley and the mountains with snow. The sunrays are less intense and at night the temperatures fall decisively under zero.
Fig. 70: 20: Comparison of measured monthly average temperatures of the year 2010 and 2011 with Meteonorm weather data of the location in Selva di Val Gardena.
Measurement data acquisition Interpretation of statistical results - South Tyrol

ENERBUILD: Final Result 5.4 Page 47 of 79User habits, impact on energy consumption in passive houses
With this estimations the thermal energy con-sumption was calculated with 4960 kWh/a and ca. 26kWh/m²a. Not included in the thermal en-ergy consumption is the part from wood firing by the stove in the living room. By applying the normalization factor of 1,32 for the climate be-cause of the mild winter the result amounts to 32 kWh/m²a.
The comparison with the CasaClima calculation (13 kWh/m²a ) and the PHPP calculation (15kWh/m²a) revealed that the measurement was some higher.
Internal air comfort
The internal air temperatures were analysed in all over 6 rooms. Not all rooms were heated during the winter period. Some rooms have temperatures around 19°C and are mainly not used. Other rooms are heated up to 20°C like the kitchen or the WC, and other have higher set point temperatures than 20°C like the bathroom, which is heated up to 22°C. The living room is heated only by wood firing. In average the in-ternal air temperature was around 20°C which emerges also as an outcome from the normaliza-tion calculations, which gave as a result for both normalizations (normalization for external tem-perature and normalization for external and in-ternal temperature) the same factor. Inhabitants
chose to heat only permanently used rooms up to comfort temperatures of 21-22°C. Other se-condary rooms (guest room, not used children room) were temperate only by air exchange with heated rooms.
Operative indoor temperatures are hourly ave-rage temperatures of the living room. Outdoor running mean temperatures are calculated with average daily temperatures from the last seven days for each day. For the hottest month in July and August a very good comfort was measured.
Conclusions
The measured external climate data showed that the winter 2010-2011 was warmer than the standard winter of Selva di Val Gardena. Mete-onorm weather data and standard weather data gave a quite far result from the measurement. The deviation from the standard was calculated as 32% and the deviation from PHPP as 41%. Re-garding internal climate, only permanent used rooms were heated up to comfort temperatures of 21-22°C. Other secondary rooms (guest room, not used children room) are temperate only by air exchange with heated rooms. In average the internal air temperature was around 20°C which emerges also as un outcome from the normaliza-tion calculations.
The measured electric energy consumption of the heat pump was evaluated as low in compari-son to other locations with lower heating degree days, due to solar thermal energy production and electric energy production of the PV plant. The heat pump consumed in average twice elec-tric energy than the electric energy for lighting.
Calculated space heating demand (CasaClima 12kWh/m²a, PHPP 15kWh/m²a) and measured electric energy consumption of heat pump and relative estimations of thermal energy con-sumption (26kWh/m²a) give comparable results although the real consumption is even higher because of wood firing of the living room, which is not included in the calculation.
Fig. 71: Monthly Energy consumption heat pump and lighting.
Fig. 73: Monthly Energy consumption heat pump and lighting.
Fig. 72: Internal air temperatures of winter period 2010-2011

Page 48 of 79 ENERBUILD: Final Result 5.4User habits, impact on energy consumption in passive houses
Architecture
The social house Bronzolo is a multi-family house built for eight families. The single flats are placed around a central staircase with elevator shaft. The three five-room, three three-room and two two-room apartments have a total net dwelling area of 577 m². The building contains furthermo-re 14 garages. Since 2001 the institute for social housing „IPES” built new constructions volun-tarily with the energy standard of CasaClima B (max. 50 kWh/(m²a)), which is significantly lower than the standard demanded by law (max. 70 kWh/(m²a)). With the „social housing IPES” of Bronzolo, IPES in 2002 decided to realize a social housing in passive house standard with a heating demand lower than 15 kWh/(m²a).
Building services
The building has a central ventilation system with heat recovery (effectiveness 82%) installed in the plant room in the basement. The eight heating circuits of the apartments as well as the production of hot domestic water are supplied by a central pellet boiler (15 kW). The heating demand is covered mainly by heating up the supply air through a damper register (2,1 – 2,4 kW), placed in the entrance area of every apart-ment, plus additionally a traditional radiator in every bathroom. By means of the geothermal plant (80 m filled with water-glycol-mix), which is directly installed under the base plate of the building, the supply air can be on the one hand cooled down in summertime and on the other hand warmed up during wintertime. Additionally the geothermal circuit avoids the freezing of the outdoor air channel.
Construction
The building is a massive construction consisting of 25 cm thick exterior walls in brick insulated with a 28 cm thick thermal insulation composite system with an total U-value of 0,14 W/(m²K). To minimize the heat losses towards the basement floor and the ground, the floating floor of the ground floor lies on an insulation layer of 28 cm. This results in an U-value of 0,15 W/(m²K) for the basement ceiling. The windows have an alumi-num/wooden frame with triple glazing (heat ab-sorbing glass) with an total Uw-value of 0,86 W/(m²K). The roof consists of a „multibox-system” with 8/44 gluelam trusses and in between floc-culation in cellulose. The system is closed on the inner side with OSB-boards and on the ou-ter side with three-layer slab. The down-grade of the roof is constructed in timber battens co-vered with poling boards – here also the space between is filled with cellulose. The roof has an average total thickness of 60 cm (U-value of 0,08 W/(m²K)).
Description of Monitoring System
Period of measurements 07/08 – 07/09
Monitoring system „detailed II“
Electric energy consumption
Total electricity consumption (of the whole building)
[kWh]
Electricity consumption (every single apartment)
[kWh]
Thermal energy consumption
Heat meter: heating circuit (of the whole building)
[kWh]
Heat meter: heating circuit (every single apartment)
[kWh]
Building details
Category/building type Building type III
Typology of building Apartment building
Year of construction 2005/2006
Energy performance* 11 kWh/(m²a)
Certification CasaClima A+
MonitoringLevel I and II „detailed”
Tenants/owners Tenants m a.s.l. 238 m
Building size (TFA)** 664 m² HDD/CDD 2.659 (12/20)
Number of apartments 8 Occupancy (total) 25
*calculated with regional calculation tool („CasaClima-Software”)**referring to the energy performance above (regional calculation)
Measurement data acquisition Interpretation of statistical results - South Tyrol
Social Housing Bronzolo

ENERBUILD: Final Result 5.4 Page 49 of 79User habits, impact on energy consumption in passive houses
Heat meter: Geothermal collec-tor circuit
[kWh]
Heat meter: Hot domestic water circuit
[kWh]
Ventilation system: Comfort and efficiency of heat recoveryAir temperature in the air chan-nels
[°C]
Relative humidity in the air channels
[%]
Air velocity in 3 air channels [m/s]
Water consumption
Consumption of hot domestic water (in every single apartment)
[m³]
Comfort/Indoor climate (in every single apartment)Indoor air temperature [°C]
Relative humidity [%]
CO2[ppm]
Outdoor climate (weather station)
Temperature [°C]
Relative humidity [%]
Global radiation [W/m²]
Monitoring results and interpreta-tion - Social Housing Bronzolo The monitoring project, which had as its object the detection of the most important energy flows that affected the building, was developed by IPES (the institute for social housing) in col-laboration with EURAC. For each of the eight apartments the energy needs for heating and hot water, the demand for electricity, as well as the comfort of living in terms of local tempera-ture, humidity and CO2 content were registered. Furthermore, it has been measured the thermal and electric energy demand for the entire buil-ding, the availability of domestic hot water and
the efficiency of the pellet boiler and recovery of energy gained through the geothermal heat exchanger.
A meteorological station on the roof of the buil-ding recorded the temperature and humidity of the outside air, as well as the intensity of solar ra-diation, necessary parameters for the calculation of the energy needs and for the comparison with other buildings.
The monitoring campaign started in July 2006 and ended in summer 2009. For the data analy-sis carried out within the project ENERBUILD es-pecially the period from April 2008 to April 2009 was examined.
External climate
Bronzolo has a mild warm climate with many days of sun. The municipality lies on 223 to 263 m over sea-level and has 2659 heating degree days. The winter period lasts from the 19th of October to the 13th of April.
The comparison of measured climate data with the interpolated weather data from Meteonorm shows widely no big deviation: the measured temperature is either in line or slightly lower than the predicted one. The measured global radia-tion is also widely consistent with the standard values. There is one bigger difference in August, which is because of data were not logged in the period from 5th to 17th of August 2008.
Regarding the calculation of heating degree days the winter 2008 - 2009 was warmer than the standard winter. The measured heating degree days confirmed this evaluation with 2.377 HDD (12/20) in comparison to standard climate data with 2.659 HDD (12/20) (taken from XClima, the regional calculation tool) and to Meteonorm generated file for the location with 2.585 HDD (12/20).
One of the warmest days during summer was measured in June 2008, where temperatures rai-sed to a maximum of 35°C and even during the night the lowest temperature was still 20°C. One
Fig. 74: Scheme of monitoring system
Fig. 75: Scheme of monitoring system
X
XX XX
XX XX
X XX
XX
XX
X
X
Temperature
Humidity
CO2
Heat flow
Air flow
Electricity
DHW
Irradiation
X
X
X

Page 50 of 79 ENERBUILD: Final Result 5.4User habits, impact on energy consumption in passive houses
of the coldest days during winter was measured in December 2008, where temperatures fell to a minimum of -8°C and had a maximum of -1°C. This day however was not representative for the whole winter season as for example in the coldest winter month January the average tem-perature was 0,8° C.
Energy consumption (annual heating demand)
Energy Consumption
Energy performance (monitored) 37,09 kWh/(m²a)**
Primary energy* (mo-nitored) 581,32 kWh/(m²a)
Energy performance (calc. with PHPP)
21,10 kWh/(m²a)
Energy performance (calc. with XClima)(calc. with regional calculati-on tool)
11,00 kWh/(m²a)
Calculation tool for energy certification
XClima
Certification(energy label)
CasaClima A+
* includes all primary energy consumed by the building: primary energy for heating, domestic hot water, common electric energy and electric energy households/lighting Primary Energy factor for elec-tricity mix is taken from DIN V 4701-10/GEMIS 4.14. The primary energy factor used for pellets is therefo-re 0,14. The primary energy factor for electric energy is 2,70.** m² are referred to the treated floor area TFA, PHPP
Thermal energy for heating was measured as 43,64 kWh/m²a (PHPP calculation 21,10 kWh/m²a and CasaClima calculation 11,0 kWh/m²a). A normalization factor which takes into account the real heating degree days, calculated with measured external and internal air temperatures, was established. The result amounts to 37,09 kWh/m²a because of average indoor air tempe-ratures during the heating period ranged from 23,08°C - 23,74°C and are therewith much higher than the assumed standard temperature of 20°C used for energy calculation.
The figure below shows the distribution of ther-mal energy consumption of the whole building per square meter for heating and domestic hot water over the heating period from October to April together with the trend of the heating de-gree days (normalized to the measured external temperature) and of the measured solar radia-tion.
Thermal energy for domestic hot water ranges over the whole year from 1.981 kWh in July 2008 to 4.630 kWh in March 2009 a month. This re-sults in a monthly average consumption for do-
mestic hot water of 3.027,25 kWh and in a total consumption of 36.327 kWh per year. Total con-sumption of thermal energy for heating over the whole year was 25.182,00 kWh. Normalized to the heated floor area this stands for an annual thermal energy consumption for heating of 43,64 kWh/(m²a) and for domestic hot water of 62,95 kWh/(m²a). So over the year the consumption of energy for domestic hot water is nearly 1,5 times higher than the consumption of energy for he-ating.
The figure below shows the monthly energy con-sumption for heating over the heating period distributed by the eight apartments. The annual energy consumption for heating per m² varies between the different apartments from 31,89 kWh/(m²a) (apartment 7) to 56,59 kWh/(m²a) (apartment 6). A look on the orientations of the single apartments and on which floor they are located shows that the consumption does not necessarily depend on the different solar gains. For example apartment 4 with a comparatively high consumption of 51,14 kWh/(m²a) is mainly south oriented and would therefore have higher solar gains as for example apartment 3 and 5, which are on the same floor and mainly east and west oriented, but have a lower consumption of 44,49 kWh/(m²a) respectively 32,27 kWh/(m²a).
Fig. 76: Monthly Energy consumption for heating for the whole building, solar radiation and normalized heating degree days.
Fig. 77: Monthly Energy consumption for heating for apart-ment 1-8, solar radiation and normalized heating degree days, ordered by month
Measurement data acquisition Interpretation of statistical results - South Tyrol

ENERBUILD: Final Result 5.4 Page 51 of 79User habits, impact on energy consumption in passive houses
Also a comparison of energy consumption and net floor area shows no correlation.
A look at the mean indoor temperatures of the li-ving room shows no relative proportion between the indoor climate of the single apartments and its consumption. For example apartment 6 with the highest consumption has a mean indoor tem-perature of 22,98°C during the heating period, while apartment 7 with the lowest consumption has a mean indoor temperature of 23,87°C. This allows the conclusion that higher energy con-sumptions result either from higher temperature levels in rooms, where no temperature was mea-sured or most probably the higher consumption results from higher ventilation heat losses due to a higher frequency of window opening through the inhabitant.
Electric energy consumption
The electric energy consumption of the whole building normalized to the net floor area amounts to 212,60 kWh/(m²a), whereas electric energy consumption for household/lighting of the eight apartments amounts to 94,40%, consumption for building services (ventilation system included) is 5,40% and consumption for common lighting and elevator is about 0,10% each. A look at the electric energy consumption of each apartment shows, as for the case of thermal energy con-sumption, big differences: it ranges from 13,65 kWh/(m²a) to 42,67 kWh/(m²a), so the highest consumption is over three times higher than the lowest consumption. The average consumption of the apartments is 25,09 kWh/(m²a).
The figure below demonstrates the high diffe-rence of primary energy consumption between the big amount of electric energy and the com-paratively little amount of thermal energy for he-ating and domestic hot water. The normalization of energy consumption to the primary energy factor emphasis this fact. The primary energy factor for electricity mix was taken from DIN V 4701-10/GEMIS 4.14: for pellets it is therefore 0,14 and for electric energy it is 2,70.
Internal air comfort
For the evaluation of summer comfort, every apartment was evaluated with the adaptive mo-del of comfort (UNI EN 15251: 2008) regarding especially the summer months June, July and August.
The adaptive model of comfort is used for evalu-ating the indoor comfort during summer time for buildings without air conditioning. The model is explained more in detail under the overview of the region South Tyrol.
The diagram below shows apartment 3 which was chosen because there the highest mean indoor temperatures during the summer month occurred. The results show that also in this apart-ment the indoor climate ranges within the three categories of acceptable temperatures, even if the climate of the location Bronzolo is really warm compared to the mean average outdoor climate of the region.
Conclusions
The measured external climate data of winter 2008 - 2009 showed widely no big deviation to the standard winter: measured temperatures were either in line or slightly lower than the pre-dicted temperatures. However the monitored heating degree days (HDD) were 10,6% less than the standard heating degree days (HDD) taken from standard climate of XClima and 8,0 % less compared to the HDDs taken from PHPP (Mete-onorm generated climate file).
Internal air temperature in the eight apartments was measured in average with 23,08°C - 23,74°C in the living rooms during the heating period 2008-09. From these values it can be presumed that the overall average temperature of the he-ated volume of the building is higher than 20°C, which is the reference temperature of the natio-nal standard.
Thermal energy consumption for heating was measured with 43,64 kWh/m²a and was there-with higher than the calculated space heating
Fig. 78: Monthly primary energy consumption of the entire building
Fig. 79: Evaluation of thermal comfort in summertime for one apartment of the multi-family house Bronzolo during June, July and August 2010

Page 52 of 79 ENERBUILD: Final Result 5.4User habits, impact on energy consumption in passive houses
demand with PHPP (21,10 kWh/m²a) and with CasaClima (11,0 kWh/m²a). The normalization to external and internal temperature decreases the measured value only for 6,55 kWh to 37,09 kWh/m²a.
The monitoring of thermal energy consumptions showed that the energy consumption for dome-stic hot water took a comparatively big part of the total thermal energy consumption. Over the year the energy consumption for domestic hot water amounts nearly 1,5 times higher than the energy consumption for heating. This difference is in part caused by the fact that domestic hot water consumption depends on the number of inhabitants, while energy consumption for hea-ting is referred to the net floor area and in case of House Bronzolo the inhabitant/area ratio is comparatively high. It also shows that the per ca-pita thermal energy consumption for heating in an apartment building is relatively low compared to a single-family house.
Anyhow often regional energy certification sy-stems do not take into account energy consump-tion for domestic hot water. A consideration of thermal energy consumption for domestic hot water in the energy certificate would maybe lead to a higher effort to improve the efficiency of the production and distribution of domestic hot water as well as systems for saving domestic hot water or it would eventually also lead to an incre-ased use of solar thermal systems.
The same applies to electric energy consump-tion. Compared with the thermal energy con-sumption the consumption of electric energy is much higher. Also the height of electric energy demand is often not considered in regional en-ergy certification systems and a consideration would maybe also lead to the improvement of
efficiency of electricity consumers and distribu-tion systems as well as finding electric energy saving strategies.
Moreover through the monitoring of House Bronzolo it was possible to weight the influence of user behaviour: in case of thermal energy con-sumption for heating, the highest consumption of the single apartments was about 1,8 times higher than the lowest consumption, while in case of electric energy consumption the highest consumption was over three times higher than the lowest consumption. In case of thermal ener-gy consumption it was excluded that differences arose because of different solar gains during the winter month due to different orientations of the apartments. This allowed the conclusion that higher energy consumptions result either from higher temperature levels in rooms, where no temperature was measured or most probab-ly the higher consumption was caused by user behaviour with manual window opening that could have provoked higher ventilation losses as predicted in the calculation and effected higher energy consumption for heating.
This leads to the assumption that a good intro-duction of the inhabitant in the energy perfor-mance of his dwelling is necessary as well as the explanation of what effects user behaviour has on the energy consumption and energy costs.
Electric energy consumption of the building amounts to 94,4% to domestic electricity and to 5,6% to building equipment and common electricity consumers during the whole year. The ventilation system worked well with adequate air exchanges and air velocity, what insured low CO
2 concentrations (83,75% of time <1.000ppm). The comfort during summer- and wintertime was evaluated as good in all eight apartments.
Measurement data acquisition Interpretation of statistical results - South Tyrol

ENERBUILD: Final Result 5.4 Page 53 of 79User habits, impact on energy consumption in passive houses
Building details
Category/building type Building type I
Typology of building Single family house
Year of construction 2005
Energy performance* 10 kWh/(m²a)
Certification MINERGIE-P
Monitoring Simple system
Tenants/owners Owner m a.s.l. 528
Building size (TFA)** 310 m² HDD/CDD 3.200 HDD/a (12/20)
Number of apartments 1 Occupancy (total) 2 adults
*calculated with regional calculation tool (SIA 380/1)**referring to the energy performance above (regional calculation)
Measurement data acquisition Interpretation of statistical results
Evaluation of measured data – Central Switzerland
The region of Central Switzerland monitored one building with the Swiss label MINERGIE-P. The single family house has a massive construction. The measurements with the monitoring system simple took place between November 2010 and October 2011.
With some exceptions the most months were warmer and sunnier than the longtime mean va-
lue during the measurement period. The mo-nitored energy performance corresponds very well with the calculated one. The internal cli-mate ranges in a comfort zone. The owners are very anxious to optimize the energy efficient operation and therefore to reduce the energy consumption.
Architecture
The building with the certification number LU-004-P was built in the Minergie-P standard (highest energy label of Switzerland, equates to passive house) and was certified as the forth building in the Canton of Lucerne (LU). It is loca-ted in the suburb (smaller urban area with mainly detached and multi-family buildings) in Lucerne a city in Central Switzerland located at the lake of Lucerne.
Building services
The heating demand (calculated heating de-mand with PHPP: 14 kWh/(m²a)) is covered equally by thermal solar energy and wood firing. Around three quarter of the domestic hot water is generated by thermal solar energy the rest by wood firing. The ventilation system has a heat recovery.
Construction
The residential building is a detached house with a massive construction (concrete and brick construction). It was built in 2005. The five room house (plus kitchen and three bathrooms) has two heated floors (310 m²), a semi-subterranean
basement and a non-lined attic. The concrete-brick construction has an insulation of 355 mm in total. The windows have a triple glazing.
Description of Monitoring System
Period of measurements 10/10 – 02/12
Monitoring system „detailed”
Electric energy consumption
Total electricity consumption [kWh]
Thermal energy consumption
Energy for heating and domestic hot water (calculated value)
[kWh]
Comfort/Indoor climate (living room, bedroom)Indoor air temperature [°C]
Relative humidity [%]
CO2[ppm]
Surface temperature (external wall)
[°C]
Outdoor climate (weather station)
Temperature [°C]
Lucerne University of Applied Sciences and Arts on behalf of ZVDKTechnikumstrasse 21CH-6048 HorwT: +41 41 349 34 [email protected]
Passive House LU-004-P

Page 54 of 79 ENERBUILD: Final Result 5.4User habits, impact on energy consumption in passive houses
The measurements were taken with the mea-surement system „Simple”. The measurement period started on 1st November 2010 and ended on 31st October 2011.
For the external climate the data were taken from the weather station Lucerne*. For the internal cli-mate the air temperature, the relative humidity, the CO2 concentration and the surface tempe-rature were measured in the living room (ground floor) and in the bed room (1st basement floor). The meter was read every 10 minutes. The elec-tric energy consumption was collected weekly by the owners manually reading the electric meter. The Calculations for the thermal energy con-sumption resulting from heating and domestic hot water were made based on wood consump-tion.
Monitoring results and interpreta-tion - House LU-002-P, Lucerne
The monitoring of the MINEGIE-P House LU-002-P shows a good compliance between the measured data and the data of the certification documents related to energy consumption as well as the measured data and the owners’ sen-se of comfort.
Energy consumption (annual heating demand)
Energy Consumption
Energy performance (monitored) 12.92 kWh/(m²a)
Primary energy (moni-tored) 13.69 kWh/(m²a)
Energy performance (calc. with PHPP)
14 kWh/(m²a)
Energy performance (calc. with regional calculation tool)
10 kWh/(m²a)
Calculation tool for energy certification
SIA 380/1
Certification (energy label)
MINERGIE-P
During the measurement period the climate was in general warmer and more sunny than normal, except December and July were colder and in July there was also less sunshine exposure. Due to the fact that the outside temperatures in De-cember were up to -2°C colder than normal, the heat surplus of the other months during the he-ating period could be compensated a bit. The HDD value normalized to the measured exter-nal climate for the measured period was 2’868.9 HDD/a (12/20) compared to the mean value of
Lucerne of 3.254 HDD/a (12/20).
With regard to primary energy consumption, the primary energy factor for thermal energy (heating and domestic hot water) of 1,06 (Swiss primary energy factor for firewood*) and the pri-mary energy factor for electricity of 3,05 (Swiss primary energy factor for consumer mix*) were used. The heating period during the monitoring phase started on 21th November 2010 and en-ded on 5th March 2011. During the heating peri-
od 25 firings were necessary.
The total thermal energy consumption for hea-ting and domestic hot water during the heating period was 12,92 kWh/(m²a). The total primary thermal energy consumption during the heating period was 13,69 kWh/(m²a). During the other months domestic hot water was generated by thermal solar energy. Due to a very cold Decem-ber, thermal energy consumption in December was nearly double of that in November and February. The measured thermal energy corre-sponds very well with the calculated value of the certification documents.
The total electric energy consumption was 9,69 kWh/(m²a) and the total primary electric energy consumption was 29,57 kWh/(m²a). The month-
Fig. 80: Outdoor climate taken from weather station Lucerne
Fig. 81: Monthly primary energy consumption from begin-ning of November 2010 to end of October 2011*Primärenergiefaktoren von Energiesystemen, ESU-services, 2011
Measurement data acquisition Interpretation of statistical results - Central Switzerland

ENERBUILD: Final Result 5.4 Page 55 of 79User habits, impact on energy consumption in passive houses
ly primary electric energy varied between 1,79 kWh/m² in August and 3,29 kWh/m² in Decem-ber. During the winter months the electric en-ergy consumption was higher than during the summer months.
Internal air comfort
Due to problems with one measurement device, there are some data missing for the internal air temperature. Those data are interpolated. The two biggest data holes are between January, 28 and February 21 and between June, 16 and June, 29.
The figure below shows the comfort of ambi-ent 1, the living room on the ground floor. The minimal internal air temperature was 18,6°C measured during the winter period. The maxi-mum measured internal air temperature is 27°C measured during the summer period. During the winter period the internal air temperature with values up to 27°C is sometimes at the limits of the comfort zone. The results of the internal air temperature during the summer period show that the protection against summer overheating works. As shading elements for the windows in the summer time rolling shutters are used. The rolling shutters are controlled with SPS by the so-lar altitude. The windows are shaded in the mor-ning (SSE) and in the afternoon (NWN). If there is a longer absence the shading elements are partly closed (SPS controlled) and the ventilation left the same.
The relative humidity is always over 30% and mostly under 60% and therefor always in the
comfort zone.
Conclusions
External climate data: The mean value for the heating degree days of Lucerne is 3.254 HDD/a (12/20). The value normalized to measured ex-ternal climate was 2.868,9 HDD/a (12/20). The
normalized value for each month was lower than the mean value except in December, who-se normalized value of 653,13 HDD/a (12/20) was clearly higher than the mean value of 558,0 HDD/a (12/20). This corresponds to the com-parison of the measured external climate data and the monthly mean values of the norm.
Internal climate, thermal and hydrothermal comfort: Also the temperature in the living room was regulated to 21°C the whole day during the winter period while the measured internal air temperature varied between 18.6°C and 24.2°C. The minimum temperature during the winter pe-riod was slightly under 19°C in the living room as well as in the bed room. The maximum mea-sured temperature in both rooms was around 27°C (in summer). The owners rated the tem-perature in each season as neutral. They used rolling shutters controlled by SPS and curtains in addition to manually opening windows at night to regulate the temperature. The owners rated the relative air humidity in summer as neutral and in winter as slightly dry. The relative humidi-ty in the living room was never under 30% duri-ng the winter period and in the bed room never under 29%. In the living room the relative humi-dity was only over 60% (maximum 65%) for 150 h during the summer period. In the bed room the relative humidity increased to 72%.
Energy consumption: The measured thermal energy corresponds very well with the calculated value of the certification documents. The owners has completed the insulation of the hot water pi-pes by themselves. During the heating period the rolling shutters controlled by SPS were closed at night to reduce radiation loss. The fact that only two persons live in this 310 m² building put the low energy consumption into another perspective.
Ventilation system: The owners are very sa-tisfied with the ventilation system. Also the ventilation noise at night is absolutely no pro-blem. The owners only open windows at night to regulate the temperature in summer.
Results: Due to the effort of the owners to re-duce energy consumption to a minimum by optimizing the insulation of the hot water pipes and using rolling shutters, the measured results for energy consumption correspond very well with the calculated ones of the certification documents. That means that the value for the energy consumption of the certification for a MINERGIE-P building can be achieved provided the inhabitant demonstrates energy efficient behavior. The question is how high would the energy consumption be with other inhabitants? The building services should be designed so that the user behavior has no impact on energy consumption.
Fig. 82: Analysis of comfort with the psychrometric chart

Page 56 of 79 ENERBUILD: Final Result 5.4User habits, impact on energy consumption in passive houses
Overview of measured thermal energy con-sumption of monitored buildings
Regarding the typical energy consumption in the measured passive houses with compact units in North Tyrol it can be perceived that one third of the primary energy consumption is used for heating, one third for hot water and one third for electrical devices. For any further conclusi-ons however the monitoring method „simple” is not sophisticated enough.
Overview of indoor comfort
The two psychrometric charts of two passive houses in North Tyrol, shown in the figure below, illustrate the diversity of user behaviour. In gene-ral both inhabitants feel very fine with their inter-nal climate, but both differ widely: one has more or less the same climate in winter as in summer; the other has huge seasonal differences – the measured values are often outside the comfort zone, defined by Ashrae (see diagram). There-fore it has to be kept in mind that the comfort zone is an average expectation and users can differ from averages. Both users have excellent air quality.
Evaluation of measured data – North Tyrol
In North Tyrol six buildings have been included into the ENERBUILD Program. For one buil-ding no monitoring was carried out but only the documentation and questionnaire. From the five monitored buildings only four monitored buildings are documented here, as at the fifth building the monitoring period was too short. All buildings were single family houses, often with a granny flat, which is used as office. The buildings where built with massive construction as well as light weight construction as well as mixed construction.
The monitoring system was always carried out as „monitoring simple”, i.e. energy measuring relied on meter reading of the user, climate data were taken from the weather stations nearby, but indoor comfort parameters were measured in more detail.
The diagrams show a rather cold alpine climate with plenty of sun. The energy consumption is in most cases slightly higher than the calculated one. This is due to two facts: First, the indoor temperatures are almost always higher than the 20°C used for the calculation of the ener-gy demand. Second the energy consumption for heating was not measured directly but only calculated. Part of the calculation was some-times the assumption of household electricity demand or hot water demand and always the assumption of the coefficient of performance of the heat pump or the compact unit. The most striking result of the monitoring was the overall high level of air quality, where the Pettenkofer-limit was hardly ever reached. Without artificial humidification the higher indoor temperatures and the high ventilation rate, which is the basis of the high air quality, naturally lead to low hu-midity rates.
External climate of the region North Tyrol
The figure below shows the comparison of typi-cal North Tyrolean climate in terms of outdoor temperature and global radiation as it was mo-nitored from July 2010 to June 2011 and the pre-diction with PHPP. It can be seen, that the course of the global radiation measured and predicted is very similar above all during July until Febru-ary of the following year. Only in March till May 2011 the measured values are about 20 kWh/m² higher than the predicted ones. The level of temperatures monitored and expected shows even more synchronization – during the winter period 10/11 also the cold average tempera-tures were represented.
Fig. 83: Comparison with standard weather data from PHPP
Fig. 84: Monthly primary energy consumption
Measurement data acquisition Interpretation of statistical results
Standortagentur TirolIng.-Etzel-Straße 17 6020 InnsbruckT: +43 512 576262 [email protected]

ENERBUILD: Final Result 5.4 Page 57 of 79User habits, impact on energy consumption in passive houses
Fig. 85: Temperature and absolute humidity of ambient air in winter 2010-2011
there is a massive fire wall with interior insulation where as other parts are light weight construction
The extensive glazing on the south has an ex-ternal shading system and a U-value of 0,75 W/(m²K). The mean u-value of the opaque parts is 0,12 W/(m²K) and the air tightness (n50) is 0,45
Description of Monitoring System
Period of measurements 4/10 – 04/12
Monitoring system Simple
Electric energy consumption
Total electricity consumption [kWh]
Comfort/Indoor climate
Indoor air temperature [°C]
Relative humidity [%]
CO2[ppm]
Surface temperature (external wall)
[°C]
Architecture
The building was constructed in 2004 on a very small (275 m²) and steep hillside. It is lo-cated in Innsbruck, the capital of North Tirol. It is an extraordinary example of architecture using a small and difficult building site with slope and the necessity to construct a fire wall to an existing neighboring building but still achieving almost the passive house stan-dard, the impression of generous indoor space and architectural identity. It won the Austri-an state prize for architecture in 2006.
Building services
The heating demand (calculated heating de-mand with PHPP: 19 kWh/(m²a)) is covered by a Compact Unit (Aerex G2). This compact unit is also used for hot water generation.
Construction
The residential building is a single family house with a granny flat. The construction is mixed bet-ween light weight and massive, as to the west
Building details
Category/building type Building Type I
Typology of building One family house
Year of construction 2003
Energy performance* 19 kWh/(m²a)
Certification A+
MonitoringLevel I and II „simple”
Tenants/users Owner m a.s.l. 580 m
Building size** 208 m² HDD/CDD 3.986 HDD/a (12/20)
Number of apartments 2 Occupancy (total) 5
*calculated with PHPP **referring to the energy performance above (PHPP)
Passive House Gaigg

Page 58 of 79 ENERBUILD: Final Result 5.4User habits, impact on energy consumption in passive houses
Outdoor climate (weather station)
Temperature [°C]
Relative humidity [%]
Global radiation [W/m²]
Monitoring results and interpre-tation - House Gaigg, Innsbruck, North Tyrol (monitoring)
House Gaigg was monitored with the „simple method”, which means there were no additio-nal meters for the energy consumption installed. As there was only one electricity meter for household energy and the compact unit the dis-played energy consumption is more an estimate than a measurement. Whereas the indoor com-fort parameters were measured in more detail. The indoor temperatures are higher than 20°C and indoor air quality was very good although the house was full of guests whenever the mea-surements were controlled. During summer the temperatures are close to outdoor temperatures as windows tend to be open in summer.
External climate
The meteorological data were taken from the official weather station in Innsbruck (courtesy to the meteorological centre ZAMG). The Tempe-ratures in diagram show the typical variations for North Tyrol: Cold winter with average tempera-tures sometimes down to -10°C and warm but ra-rely hot summers, with temperatures up to 25°C. This alpine climate is also reflected in the shown solar radiation with low irradiation in winter and high irradiation in summer. The humidity has al-most no seasonal fluctuation.
Energy consumption (annual heating demand)
Energy Consumption
Energy performance (monitored) 33 kWh/(m²a)
Primary energy (monitored) 29 kWh/(m²a)
Energy performance (calc. with PHPP)
19 kWh/(m²a)
Energy performance (calc. with regional calculation tool)
15 kWh/(m²a)
Calculation tool for energy certification
OIB
Certification(energy label)
A+
The energy consumption in House Gaigg was recorded on a weekly basis by the inhabitants. More problematic than the manual recording by users is the usage of only one electric meter, that records the total energy consumption. The elec-tricity consumption for heating was estimated by the following procedure: The electricity con-sumption in the early summer month when still all users are present, but no heating is necessary, was averaged. This average was estimated as the usual consumption for hot water generation and electrical devices and subtracted from the energy consumption in the winter month. The underlying assumption of hot water and electri-city consumption being constant is justified on this level of exactness.
Even more problematic is that no thermal ener-gy was measured but only electricity. The given COP of the compact unit is measured in a labo-ratory under defined circumstances. But the net COP for annual usage is unknown. But this annu-al net COP is the factor the electricity has to be multiplied with, to determine the heat consump-tion of the house. In the figure below the given COP of 3 was used [3][4]. Although the heat consumption data were normalized with internal
Fig. 86: Temperature and solar radiation in winter 2010-2011
Fig. 87: Monthly Energy consumption for heating, solar radiation and normalized heating degree days
Measurement data acquisition Interpretation of statistical results - North Tyrol

ENERBUILD: Final Result 5.4 Page 59 of 79User habits, impact on energy consumption in passive houses
and external climate, i.e. the higher indoor tem-peratures are taken account of, the energy con-sumption seems to be higher than the calculated value, but as there are too many assumptions in-cluded, this result is not valid for a judgement of the thermal quality of House Gaigg.
[3] FAWA – Feldanalyse von Wärmepumpen-Anlagen; Tagungsband des Schweizer Bundesamtes für Energie (BFE) 2004[4] Fanninger Gerhard; IFF-Universität Klagenfurt: „Der Wärmepumpenmarkt in Österreich 2005„ März
2006
Internal air comfort
The diagram below shows the main comfort parameters, temperature, humidity and surface temperature in January. The surface tempera-ture has less fluctuation and is slightly higher. The latter is probably due measurement errors. Striking is the unusual high air temperature bet-ween 23°C and 25°C during the day and a very low humidity rate.
Conclusions
House Gaigg is an extraordinary example where under difficult circumstances (tiny place with a steep slope) a passive house with high architec-tural aspirations can be achieved. Even though the calculated heating demand was above the 15 kWh/m²a and the monitored one was even higher the compact unit delivers all heat that is needed and the user satisfaction is extraordinary high. That the energy consumption of 33 kWh/m²a is more than twice as high as the maximum has three reasons: Due to the limited space, the maximum value could not be reached, the uncertainty of the simple monitoring is very high and likely to exaggerate the heating consump-tion and last but not least the user behaviour indicates high internal temperatures well above 20°C.
The indoor air quality is very high even though the numerous guests increase the number of inhabitants. As also the temperatures in winter are higher than the calculated ones the relative humidity rate is sometimes low. But as the audit shows, this result is not reflected in the percep-tion of the users, which feel comfortable even during cold alpine winter days.
Fig. 88: Temperature, surface temperature and relative hu-midity measured in living room. The air quality is very high; this indicates a high ventilation rate that might be the main reason for the low humidity in January.
Fig. 89: CO2 measurements distributed by steps of 100ppm in the living room.
Building details
Category/building type Building Type I
Typology of building One family house
Year of construction 2007
Energy performance* 15 kWh/(m²a)
Certification A+
MonitoringLevel I and II „simple”
Tenants/users Owner m a.s.l. 869 m
Building size** 177 m² HDD/CDD 3.980 HDD/a (12/20)
Number of apartments 2 Occupancy (total) 4
*calculated with PHPP **referring to the energy performance above (PHPP)
Passive House Fügenschuh

Page 60 of 79 ENERBUILD: Final Result 5.4User habits, impact on energy consumption in passive houses
Architecture
The building was constructed in 2007 as a mas-sive one family passive house with a granny flat. It is located in Höfen, a small village close to Reutte in the most western part of North Tirol. It has 7 rooms including 2 bathrooms.
Building services
The heating demand (calculated heating de-mand with PHPP: 15 kWh/(m²a)) is covered by a air heat pump This heat pump is also used for hot water generation. The heat is distributed via floor heating. The ventilation system has a heat recovery system.
Construction
The residential building is a single family house with a massive construction (concrete and brick construction). Insulation is with XPS on the walls and stone wool on the roof.
The extensive glazing on the south has an ex-ternal shading system and a U-value of 0,74W/(m²K). The mean u-value of the opaque parts is 0,097 W/(m²K) and the air tightness (n50) is 0,24
Description of Monitoring System
Period of measurements 7/10 – 04/12
Monitoring system Simple
Electric energy consumption
Total electricity consumption night
[kWh]
Total electricity consumption day [kWh]
Electrical Consumption: Heat pump
[kWh]
Comfort/Indoor climate
Indoor air temperature [°C]
Relative humidity [%]
CO2[ppm]
Surface temperature (external wall)
[°C]
Outdoor climate (weather station)
Temperature [°C]
Relative humidity [%]
Global radiation [W/m²]
Monitoring results and interpretation - House Fügenschuh, Höfen, North Tyrol
House Fügenschuh was monitored with the „simple method”, which means there were no additional meters for the energy consumption installed. But there was already an additional electricity meter for the heat pump. As the COP of the heat pump had to be assumed the dis-played energy consumption is more an estima-tion than a measurement. The indoor comfort parameters were measured in more detail. The indoor temperatures are only slightly higher than 20°C and indoor air quality was very good in the living room, while in the sleeping room the Pet-tenkofer limit was reached several times..
External climate
The meteorological data were taken from the official weather station in Reutte (courtesy to the meteorological centre ZAMG). The House is situated in Höfen a village ca. 5 km south of Reutte. The temperatures show the same alpine pattern as in the case of House Gaigg (weather station Innsbruck): the HDD are almost identical, the extreme temperatures in winter are even lo-wer. But the measuring period was rather warm compared to the standard weather.
Energy consumption (annual heating demand)
The energy consumption in House Fügenschuh was also recorded on a weekly basis by the in-habitants. A separate meter for the heat pump was installed. Only the electricity consumption for hot water had to be estimated by averaging the early summer month, when still all users are present, but no heating is necessary. This ave-rage subtracted from the energy consumption in the winter month. The underlying assumption of hot water being constant is justified on this level of exactness. Also here the biggest pro-blem remains, that no heat is measured but only electricity. The annual net COP is the factor the
Fig. 90: Temperature and solar radiation in winter 2010-2011

ENERBUILD: Final Result 5.4 Page 61 of 79User habits, impact on energy consumption in passive houses
electricity has to be multiplied with, to deter-mine the heat consumption of hot water of the building. In the figure below the given COP of 3 [1,2] was used. Although the heat consumption data were normalized with internal and exter-nal climate, i.e. the higher indoor temperatures are taken account of, the energy consumption seems to be higher than the calculated value, but to determine the reason of the increased en-ergy consumption a more detailed monitoring, where the COP is measured would be needed.
Energy Consumption
Energy performance (monitored) 25 kWh/(m²a)
Primary energy (monitored) 21,6 kWh/(m²a)
Energy performance (calc. with PHPP)
15 kWh/(m²a)
Energy performance (calc. with regional calculation tool)
13 kWh/(m²a)
Calculation tool for energy certification
Energieaus weis Tirol
Certification(energy label)
A+
Internal air comfort
The figure below shows the main comfort pa-rameters, temperature, humidity and surface temperature in January. Compared to the indoor climate of House Gaigg the temperature is lo-wer and the humidity rate is higher. The lower temperatures are also reflected in a lower ener-gy consumption which is not visible as the data were normalised with the internal temperature.
The air quality shown in House Fügenschuh is also very high, but not as high as in House Gaigg. Higher air quality is due to a high venti-lation rate. As external humidity is low in winter, the high ventilation rate causes also low internal humidity. Therefore it is not astonishing, that in House Fügenschuh the humidity rate in winter is also higher. To find a good compromise between
good air quality and comfortable humidity rate in winter according to the needs of the inhabi-tants is very important for the HVAC-planning.
In House Fügenschuh the indoor temperature is only slightly above the calculated value of 20°C.
The indoor air quality is very high even though the numerous guests increase the number of inhabitants. As also the temperatures in winter are higher than the calculated ones the relative humidity rate is sometimes low. But as the audit shows, this result is not reflected in the percepti-on of the users that feel comfortable even during cold alpine winter days.
Conclusions
House Fügenschuh is an example, that passive houses can be planned economically by users. Even though the measured heating demand was above the calculated one, the consumption is rather low and the user satisfaction is extra-ordinary high. The reasons for the heating en-ergy consumption of 25 kWh/(m²a) should be examined more in detail as there is no differen-tiation between insufficiency of the house or the heat pump. The indoor air quality is very high even though the measurements in the sleeping room showed slightly increased CO2-levels. But as the audit shows, this result is not reflected in the perception of the users, which feel very com-fortable even during the whole year.
Fig. 91: Monthly Energy consumption for heating, solar radiation and normalized heating degree days
Fig. 92: Temperature, surface temperature and relative humidity measured in the living room.
Fig. 93: CO2 measurements distributed by steps of 100ppm in ambient 1.

Page 62 of 79 ENERBUILD: Final Result 5.4User habits, impact on energy consumption in passive houses
Building details
Category/building type Building Type II
Typology of building One family house
Year of construction 2007
Energy performance* 15 kWh/(m²a)
Certification A++
MonitoringLevel I and II „simple”
Tenants/users Owner m a.s.l. 643,5 m
Building size** 149,5 m² HDD/CDD 3.686 HDD/a (12/20)
Number of apartments 1 Occupancy (total) 4
*calculated with PHPP **referring to the energy performance above (PHPP)
Architecture
The One-family house is located in a rural area with only one-family buildings on a hill at the foot of the mountain range „Zahmer Kaiser”. It was built 2007. The building was built as passive house standard (15 kWh/(m²a)). The heating de-mand is covered by a solar panel and solid fuel stove. The solar panel with an area of 21 m² is integrated on the garage roof at the south side.
Building services
The heating demand (calculated heating de-mand with PHPP: 15 kWh/(m²a)) is covered by a wood stove and a solar thermal system . The sto-ve delivers only 30% of the generated heat into the air and 70% are delivered to a huge buffer system. This buffer system is used for floor he-ating and for hot water generation. The heat is distributed also via floor heating. The ventilation system has a heat recovery system.
Construction
The residential building is a light weight construc-tion, where walls are a sandwich construction 54cm, ceiling has polyurethane and floor 40cm of wood fibre.
The glazing has an U-value of 0,8W/(m²K). The mean u-value of the opaque parts is 0,095 W/(m²K) and the air tightness (n50) is 0,5
Description of Monitoring System
Period of measurements 7/11 – 04/12
Monitoring system Simple
Electric energy consumption
Total electricity consumption [kWh]
Electrical Consumption: Heat pump
[kWh]
Comfort/Indoor climate
Indoor air temperature [°C]
Relative humidity [%]
CO2[ppm]
Surface temperature (external wall)
[°C]
Outdoor climate (weather station)
Temperature [°C]
Relative humidity [%]
Global radiation [W/m²]
Monitoring results and interpre-tation - House Kitzbichler, Nieder-dorferberg, North Tyrol
House Kitzbichler was monitored with the „sim-ple method”. There was only one meter for household electricity and one for the solar en-ergy input and this one wasn’t recorded regu-larly, only the overall energy consumption could be estimated from the solar input and from the wood pile consumed during a year. Whereas the indoor comfort parameters were measured in more detail. The indoor temperatures were higher than 20°C and indoor air quality was very good.
Measurement data acquisition Interpretation of statistical results - North Tyrol
Passive House Kitzbichler

ENERBUILD: Final Result 5.4 Page 63 of 79User habits, impact on energy consumption in passive houses
Fig. 96: CO2 measurements distributed by steps of 100ppm
in ambient 1.
External climate
This house has no own weather station and data from the weather station in Kirchberg were ta-ken. The measuring period was warmer than the standard weather.
Energy consumption (annual heating demand)
Energy Consumption
Energy performance (monitored) 26 kWh/(m²a)
Primary energy (monitored) 5 kWh/(m²a)
Energy performance (calc. with PHPP)
15 kWh/(m²a)
There is no graphical demonstration of the ener-gy consumption, as there was no weekly meter reading. In House Kitzbichler, heat is provided by a large solar thermal system and wood fi-ring. The annual wood consumption was 2 m³ of mixed wood. This equals ca. 4.000 kWh.
The solar collectors delivered ca. 10.000 kWh into the buffer system. This solar input into the storages was measured only twice: At the be-ginning and at the end of the measuring period. Together this equals almost 80 kWh/ m³.
But this is just the renewable input into the buf-fer system which is naturally much higher than the energy consumption of the house. Counting only the non-renewable energy consumption the electricity consumption of pumps and fan should be measured.
The monthly electricity consumption was in ave-rage 325 kWh, which is very low, so this house seems from an economic and an ecologic point of view to have the most preferable installation.
Internal air comfort
The diagram with the monitored indoor climate shows the main comfort parameters, tempera-ture, humidity and surface temperature in January.
High spikes in temperature can be seen; these probably relate to the firing of the wood burner, the humidity rate is very low in this month.
The air quality shown is very high, similar as in house Gaigg the CO2-Concentration is very low and also the humidity rate is very low. This em-phasizes the necessity to find a good compro-mise between good air quality and comfortable humidity rate in winter.
Conclusions
The simple monitoring of the House Kitzbich-ler carried out in a period that was warmer than the standard climate shows a heating energy demand of 26kWh/m²a. If an efficiency of 70% of the wood burner is estimated this leads to 18 kWh/m²a useful energy demand, which is an increased heating demand compared to the cal-culated one. But the consumption is still very low and it is completely renewable.
The indoor air quality is very high and the humi-dity is sometimes low. But as the audit shows, this result is not reflected in the perception of the users, which feel very comfortable even duri-ng the whole year.
Fig. 94: Temperature and solar radiation in winter 2010-2011
Fig. 95: Temperature, surface temperature and relative humidity measured in the living room

Page 64 of 79 ENERBUILD: Final Result 5.4User habits, impact on energy consumption in passive houses
Architecture
The building was constructed in 2007 as a light weight low energy house. The one-family house is located in a rural area with mainly one-family buildings at the foot of the mountain range „Wil-der Kaiser”. But the village Söll is a tourism place which is visited every year by skiers all around Europe. It was built in 2007. The building does not have the passive house standard because the heating demand, calculated with PHPP is 20 kWh/ (m²a), whereas the one calculated with the energy certificate of Tirol is 15 kWh/ (m²a).
Building services
The heating demand (calculated heating de-mand with PHPP: 20 kWh/(m²a)) is covered by a compact unit. This compact unit is also used for hot water generation. The heat is distribut-ed also via floor heating. The ventilation system has not only a heat recovery system but also a ground heat exchanger.
Construction
The residential building is a light weight construction, where insulation material is mostly cellulose, but also perlite, mineral wool, and EPS are used. The glazing has an U-value of 0,82W/(m²K). The mean u-value of the opaque parts is 0,24 W/(m²K) and the air tightness (n50) is 0,52.
Description of Monitoring System
Period of measurements 7/11 – 04/12
Monitoring system Simple
Electric energy consumption
Total electricity consumption [kWh]
Electrical Consumption: Heat pump
[kWh]
Comfort/Indoor climate
Indoor air temperature [°C]
Relative humidity [%]
CO2[ppm]
Surface temperature (external wall)
[°C]
Outdoor climate (weather station)
Temperature [°C]
Relative humidity [%]
Global radiation [W/m²]
Monitoring results and interpreta-tion - House Krätschmer, Mühlleiten
House Krätschmer was monitored with the „simple method”, which means there were no additional meters for the energy consumption installed. As there was an additional electricity meter for the heat pump, but no differentiation between energy for heating and for hot water and also no measurement of the COP, the displa-yed energy consumption is more an estimation than a measurement. Whereas the indoor com-fort parameters were measured in more detail. The indoor temperatures are higher than 20°C and indoor air quality was very good.
Building details
Category/building type Building Type II
Typology of building One family house
Year of construction 2007
Energy performance* 20 kWh/(m²a)
Certification No certification
MonitoringLevel I and II„simple”
Tenants/users Owner m a.s.l. 490 m
Building size** 128,8 m² HDD/CDD 3.686 HDD/a (12/20)
Number of apartments 1 Occupancy (total) 4
*calculated with PHPP**referring to the energy performance above (PHPP)
Measurement data acquisition Interpretation of statistical results - North Tyrol
Passive House Krätschmer

ENERBUILD: Final Result 5.4 Page 65 of 79User habits, impact on energy consumption in passive houses
External climate
House Krätschmer has no own weather station. The weather station in Kirchberg (Tyrol), which delivered the data, is 12 km away and it is ope-rated by the central institution for meteorology and geodynamics (ZAMG). As the site is located in the lower valley of the Inn the temperatures are slightly higher. The measuring period was warmer than the standard climate.
Energy consumption (annual heating demand)
Energy Consumption
Energy performance (monitored) 28 kWh/(m²a)
Primary energy (monitored) 24 kWh/(m²a)
Energy performance (calc. with PHPP)
20 kWh/(m²a)
Energy performance (calc. with regional calculation tool)
15 kWh/(m²a)
Calculation tool for energy certification
Energieaus weis Tirol
Certification(energy label)
No certification
Like in House Gaigg and House Fügenschuh the energy consumption in house Krätschmer
was recorded in terms of a weekly manual meter reading by the inhabitants. Like in House Fügen-schuh a separate meter for the heat pump was installed, while electricity consumption for hot water had to be estimated by averaging the ear-ly summer month. This average subtracted from the energy consumption in the winter month. The biggest problem is that no heat is measured but only electricity. In the figure below the gi-ven COP of 3 [1,2] was used. Although the heat consumption data were normalized with internal and external climate, i.e. the higher indoor tem-peratures are taken account of, the energy con-sumption seems to be higher than the calculated value, but the 20% increase in normalized energy consumption compared to the calculation can also be due to a different COP.
Internal air comfort
The diagram of the internal climate shows the main comfort parameters, temperature, humidi-ty and surface temperature in January. The con-stant offset between air temperature and wall temperature is due to an offset of the air tem-perature meter, the humidity rate is very low in this month.
The air quality measured is very high, similar as in house Gaigg the CO2-Concentration is very low. Higher air quality is due to a high ventila-tion rate. As external humidity is low in winter,
Fig. 97: Temperature and solar radiation in winter 2011
Fig. 98: Monthly Energy consumption for heating, solar radiation and normalized heating degree days
Fig. 99: Temperature, surface temperature and relative humidity measured in the living room.
Fig. 100: CO2 measurements distributed by steps of 100ppm in ambient 1.

Page 66 of 79 ENERBUILD: Final Result 5.4User habits, impact on energy consumption in passive houses
the high ventilation rate causes also low internal humidity. Therefore it is not astonishing, that the humidity rate is very low. This emphasizes the necessity to find a good compromise between good air quality and comfortable humidity rate in winter.
Conclusions
The simple monitoring of House Krätschmer carried out in a period that was warmer than the standard climate shows an increased heating de-mand compared to the calculated one. But the
consumption of 28 kWh/(m²a) is rather low and the user satisfaction is extraordinary high. The reason why the heating energy consumption is 28 kWh/(m²a) should be analysed more in detail, as with simple monitoring, there is no differenti-ation between insufficiency of the house or the heat pump.
The indoor air quality is very high and the humi-dity is sometimes low. But as the audit shows, this result is not reflected in the perception of the users, which feel very comfortable even duri-ng the whole year.
Evaluation of measured data - Piemonte, Italy
Objectives and methods
Energy Consumption data have been required from building owner and Estate manager. All the buildings interested by the monitoring are owned by Social Housing Agency or by Building Cooperatives, who rent the flats to families or single people.
All the buildings are equipped with gas meter (provided by the net manager), for the monito-ring of natural gas consumption by direct lecture of the counter, and all the flats have counters for heat consumption, tap water volume consump-tion and domestic hot water volume consump-tion.
In Borgaro, where heat is provided by the district heating net, via a heat exchanger, a heat meter is installed on the primary circuit of the heat ex-changer.
All the buildings have centralized domestic hot water production, condensing boiler, climatic regulation for managing the boiler outlet tem-perature, solar thermal systems for domestic hot water production, piping and distribution system made with main piping system and zone valve and hydraulic collector for each flat, regulated by internal cronothermostatic system, managed by the user of the flat.
Measures that were done have two main objec-tives: evaluate the absolute entity of consump-tion and compare that measured data with the declared data during design phase (and request
for public funding from Regione Piemonte, re-lated to the energy and environmental perfor-mances).
During spring 2010 all the building owners or manager have been informed of the ENERBUILD project and they have been provided with a sim-ple table. They are requested to fulfill it with lec-tures of the counters, bills paid, energy delivered to the user, other data they suppose interesting for the analysis. The time sample is one month.
Data monitoring is referred to 111 apartments, for a total amount of more than 6300 m² hea-ted surface, divided in 5 buildings that are wide spread in the Regione Piemonte surface.
In the design documents, the Heat Consumpti-on for space heating (HCS) is evaluated, and the monitoring campaign is focused to determine this value, for the all heating season.
1. Data collected from buildings manager have not been presented in the requested format, and some problems appeared; sometimes it is unclear if the energy consumption re-ported is referred to:
2. The heat delivered to the user or the primary energy used
3. Only space heating purposes or space hea-ting and hot water production (DHW)
4. To the whole building, or to subparts of it,
Measurement data acquisition Interpretation of statistical results
Regione Piemonte Via Lagrange 24 10123 TorinoT: +39 011 432 38 07 [email protected]
Measurement data acquisition Interpretation of statistical results - North Tyrol

ENERBUILD: Final Result 5.4 Page 67 of 79User habits, impact on energy consumption in passive houses
especially in case of buildings in which the flats have been progressively occupied
5. To the entire heating period, or to partial pe-riods, or to heat quantity not exactly referred to heating periods
6. To internal (internal temperature) or external operating conditions similar to the ones as-sumed during design phase, or significantly different.
To obtain a useful data related to HCS, some hy-potheses and actions have been done:
Heat delivered or Primary Energy
Where it was impossible to determine by calcula-tion, the seasonal average efficiency of the boiler has been estimated in 0,80-0,85, for condensing boilers; 0,90-0,95 for district heating. Where cal-culated, the efficiency appeared lower than the estimated coefficient.
DHW energy use
It is necessary to separate the DHW heat con-sumption from the space heating consumption. It is possible to:
• Assume a number of users in each flat. This gives assumed heat consumption for hot wa-ter of 2 kWh/day, or 700 kWh/year (350 days/year of use).
• Derive the consumptions of energy for DHW from summer periods data (if available), duri-ng which the space heating is turned off.
• If a solar thermal plant is used for DHW pre-paration, and if no data are available concer-ning the heat delivered from the solar plant, a solar fraction (contribution of the solar plant to the total energy request) must be assu-med. It is possible to assume solar fraction 50-60% during the whole year, and 70-80% during summer month, and 20-30% during winter. This value is deducted from the heat consumed by the heat plant.
Partially heated building (not all flats used)
It can happen that a building is partially used, and only some flats are rented. This occupation factor can vary during the season.
• Unused flats have no DHW request
• If the plant regulation system allows single flat temperature regulation, in the unused flat will be operated at 10°C, for antifreeze security.
• The heat request of flat neat the unused ones will be higher than expected, due to thermal losses to flat at lower internal temperature.
• Heat consumption of the whole building will be the same of an equal building, in which the internal temperature is the average tem-perature of the all flats (heated and antifree-zing ones), reported to their area. The image shows the internal temperature of a heated flat (T I, nr) and the average temperature of the whole building, varying the number of used flats (,T.i), in the hypotheses of external average temperature 5°C, and internal tem-perature 20°C (Turin reference data).
For example, if the whole number of flat in a building is 16, and only 10 are used, the average internal temperature of non-heated flat will be 14,4°C, and the average internal temperature (heated and non-heated flats) will be 17,9°C. Due to the fact that the heat consumption is re-lated to the sum of the difference between the internal and the external temperature (Heating Degree Days, HDD), it is possible to estimate the influence of a lower internal temperature, com-pared to design data (20°C). In the area where the buildings are, HDD=2.600 (based on 20°C in-ternal temperature and 183 heating days). If the measured HDD are 2.216 (2.600-183*(20-17,9)= 2.216), the consumptions will be 15% lower than if all flat are heated to 20°C.
Data period different from heating period
If data are available from bills, it is necessary to investigate if these are correctly related to hea-ting periods and if they are estimated consump-tion or real ones.
In any case, if data are not available for all the heating period, it is possible to derive data for the missing period, using Degree days:
„p” is the period in which data are known.
Inside and outside Temperatures
It is important to know the inside and outside temperature, that can affect consumptions.
Outside temperature can be acquired by in situ monitoring, or by local meteo station. During the monitoring phase outside temperature were not available. Standard temperatures are supposed.
Inside temperature is supposed 20°C, even if some local measurement shows that occupants use higher temperature than 20°C. Each degree higher than 20°C, produce a raise of 7% in the consumption (183/2.600 = 7%).

Page 68 of 79 ENERBUILD: Final Result 5.4User habits, impact on energy consumption in passive houses
Summary of measures and comments
• Villadossola very difficult data analysis due to the partial and time variable occupation of the building. Local inspections showed in-correct use of the solar thermal system that is considered without energy contribution to DHW.
• Seasonal efficiency of the plant is calculated at 53% and primary energy consumption for space heating is 74 kWh/m², instead than 24 kWh/m² (design rate).
• Orbassano: Seasonal efficiency of the plant is calculated at 47% and primary energy con-sumption for space heating is 85 kWh/m², in-stead than 38 kWh/m² (design rate).
• Borgaro: primary energy consumption for space heating is 44 instead of 40 kWh/m² (de-sign rate).
• Moncalieri: primary energy consumption for space heating is 145 kWh/m² per via Romita 4 e 157 per via Romita 6, instead than 76 kWh/m² (design rate).
Measurement shows large differences between design expected consumptions and measured ones. Some hypotheses have been done:
• Thermal bridges underestimated during de-sign phase
• Differences between design and realisation
• Higher inside temperatures than designed
• Probable higher ventilation rates than desi-gned ones, due to holes in the building enve-lope, to avoid moisture problems
• Low efficiency in boiler, distribution, control systems, due to lack of commissioning and tuning of the plants.
The monitoring campaign shows that it will be useful to implement information activities for building manager and owners and technicians involved in the management and in the design phase.
Villadossola Orbassano Borgaro Moncalieri 4 Moncalieri 6
rep
ort
ed
meas
ure
d
calc
ula
ted
rep
ort
ed
meas
ure
d
calc
ula
ted
rep
ort
ed
meas
ure
d
calc
ula
ted
rep
ort
ed
meas
ure
d
calc
ula
ted
rep
ort
ed
meas
ure
d
calc
ula
ted
number of dwellings n 16 35 36 12 12
floor area m² 1.044 1.991 2.007 654 654
heated gross volume m³ 8.962 7.738 2.732 2.732
total gross consumption m³ GN 21.290
kWh 198.460
consumption for heating m³ GN 2.577 8.082 7.236 17.781 5.179 4.431 4.649
kWh 24.765 77.668 69.538 170.879 88.000 49.769 66.534 69.808
energy consumption kWh/m² 24 74 38 85,8 40,6 44 76 145 157
consumption for DHW m³ GN 5.523 2.134 458 3.509
kWh 53.076 20.503 4.401 33.718 110.460
m³ H2O 1.046 404 1.661
demand for heating kWh 22.288 32.694 69.600 83.600 56.153 75.757 60.754 81.965
kWh/m² 21,3 31 33 35 42 116 61 125
requirements for ACS kWh 16.402 67.437 104.937
fs solar DHW 0% 60% 50%
notes cald cond
cald cond TLR cald
condcald cond
year 2011
delivered to Heating kWh 69.600
provided for ACS kWh 32.694 16.338 26.975
total paid out kWh 49.032 96.575
primary energy consumed kWh 93.082 204.597
system performance 90% 53% 47%
yield distribution 0,95
Table 1: Data monitored and results of hypotheses and calculations
0 50 100 150 200
Moncalieri 6
Moncalieri 4
Borgaro
Orbassano
Villadossola
measured
reported
specific energy consumption, kWh/m2
Fig. 101: Comparison of energy consumption measured and stated of the monitored buildings.
Measurement data acquisition Interpretation of statistical results - Piemonte

ENERBUILD: Final Result 5.4 Page 69 of 79User habits, impact on energy consumption in passive houses
Architecture
The building is located in a peripheral area of the town of Orbassano, in the metropolitan area of Turin. It is a slab block and was built in the 2009. The thermal envelope contains thirty-five apartments for a total of 1.991,86 square meters. The building was built with the aim of achieving a low-energy standard. The energy performance achieved is the class A according to the pied-mont regional standard, which means a heating demand in relation to gross net area of 28 kWh/(m²a).
Building services
The construction method of the exterior walls is a concrete skeleton structure and cavity-wall in clay block brick with internal insulation in cel-lulose fibres of 15 cm (U-value: 0,17 W/(m²K)). The with brick tiles façade is ventilated with an air layer of 6 cm behind the brick tiles. The cei-ling over the box consists of ceramic tiles of 1 cm, concrete substrate of 6 cm, vapour barrier in aluminium foil of 0,2 cm, expanded clay and concrete slab of 10 cm, a polystyrene panel of 4 cm and slab predalles of 24 cm (U-value: 0,29 W/(m²K)). The roof is made of: internal plaster of 1 cm, brick and concrete slab of 24 cm, a polyethy-lene Sheet of 0,3 cm, insulation wood fibre panel of 15 cm, an air layer of 5 cm and a roofing panel composed of two Metal sheets connected by an insulating polyurethane layer 5,3 cm (U-value: 0,13 W/(m²K)).
Construction
The heating demand is covered by a central condensing boiler plant to natural gas of 185 kW power. The heat distribution in the building is water borne type while the heater units are ra-diators. It doesn´t exist a cooling system while a mechanical automatically controlled ventilation ensure air change of 0,3 1/h. The domestic hot water demand is covered by 61,35 square me-
ters of south oriented solar panels on the roof integrated by the central boiler plant to natural gas, there are three hot water tank, the size is 1000 liters each. The annual energy performance of the solar thermal plant is 12,27 kWh/m². The ventilation system is a balanced without heat re-covery and geothermal heat exchange, while the air of the ventilation is preheated and precooled. Technical data ventilation system: airflow ventila-tion: single-stream, air exchange: 0,30 (h-1), air flow: 1.664,77 (m³/h). The glazing has a g-value of 1,1 and a mean U-value of 1,35 W/(m²K). Note: data are extracted from design documents
Description of Monitoring System
Period of measurements 10/09 – 04/12
Monitoring system Simple
Thermal energy consumption
Heat meter: single flat internal distribution net
[kWh]
Comfort/Indoor climate
Indoor air temperature (spot measures)
[°C]
Surface temperature (external wall) (spot measures)
[°C]
Outdoor climate (from remote weather station)Temperature [°C]
Solar radiation [W/m²]
Due to the dimension of all buildings, a simple monitoring method has been used with instru-ments used for energy consumption monitoring already on site. This monitoring system provides long term measures, for a seasonal evaluation of the performances of building and plant system.
Building details
Category/building type Building type III
Typology of building Slab block
Year of construction 2009
Energy performance* 32,95 kWh/(m²a)
Certification A
MonitoringLevel I and II„simple”
Tenants/users Tenants m a.s.l. 273 m
Building size** 1.991,86 m² HDD/CDD 2.634 HDD
Number of apartments 35 Occupancy (total) 35 families
*calculated with regional calculation tool („CasaClima-Software”)
Social Housing Orbassano

Page 70 of 79 ENERBUILD: Final Result 5.4User habits, impact on energy consumption in passive houses
Architecture
The building is located in a peripheral area of Turin. It is a concrete skeleton structure and mas-sive weight wall realized with clay block brick and thermal insulation layer (Innumerable inter-connected pores aid thermal performance); fa-cade ventilation. The thermal envelope contains thirty-six apartments for a total of 2.006,7 square meters. The building was built with the aim of achieving a low-energy standard.
Building services
The heating demand is covered by heat exchan-ger for district heating of 150 kW power. The heat distribution in the building is water borne type while the rooms are heated through under floor radiant heating systems. The building has no cooling system and no mechanical automa-tically controlled ventilation. Technical data heat exchanger for district heating: Copper brazed plate heat exchanger 150 kW standard package with heat meter, control and safety devices. The domestic hot water demand is covered by n. 1 heat exchanger (70kW) for district heating.
Construction
The construction method of the exterior facades is a concrete skeleton structure and massive weight wall realized with clay block brick and thermal insulation layer (Innumerable intercon-nected pores aid thermal performance). The wall cladding brick of 3 cm is ventilated by an air layer of 5 cm behind it. The ceiling of the cellars con-sists of ceramic tiles on concrete substrate of 5 cm, an insulation polystyrene panel of 3 cm, the concrete slab of 8 cm, a slab reinforced concrete and brick of 25 cm, an insulation in wood-wool of 7 cm and external plaster of 1 cm (U-value: 0,287 W/(m²K)). The roof is made of concrete tiles of 2 cm ventilated with an air layer of 1 cm, con-crete substrate of 4 cm, another air layer of 10 cm, pvc sheet waterproofing of 0,3 cm, concrete
substrate of 7 cm and insulation in wood-wool of 18 cm on a slab reinforced concrete and brick of 24 cm and internal plaster of 1 cm (U-value: 0,186 W/(m²K)). The glazing has a g-value of 1,1 and a mean U-value of 1,4 W/(m²K).
Description of Monitoring System
Period of measurements 10/09 – 04/12
Monitoring system Simple
Thermal energy consumption
Heat meter: total energy from the net
[kWh]
Heat meter: single flat internal distribution net
[kWh]
Comfort/Indoor climate
Indoor air temperature (spot measures)
[°C]
Surface temperature (external wall) (spot measures)
[°C]
Outdoor climate (from remote weather station)Temperature [°C]
Solar radiation [W/m²]
Due to the dimension of the building, a simple monitoring method has been used with instru-ments used for energy consumption monitoring already on site:
• Gas counter from the net [kWh]
• Energy delivered to single flat [kWh]
• Fresh water volume to single flat [m³]
• Hot water volume to single flat [m³]
This monitoring system provides long term mea-sures, for a seasonal evaluation of the perfor-mances of building and plant system.
Building details
Category/building type Building type III
Typology of building Slap block
Year of construction 2009
Energy performance* 29,15 kWh/(m²a)
Certification No certification
MonitoringLevel I and II „simple”
Tenants/users Tenants m a.s.l. 227 m
Building size** 2.006,7 m² HDD/CDD 2.639
Number of apartments 36 Occupancy (total) 90
*calculated with regional calculation tool („CasaClima-Software”)
Measurement data acquisition Interpretation of statistical results - Piemonte
Social Housing Borgaro
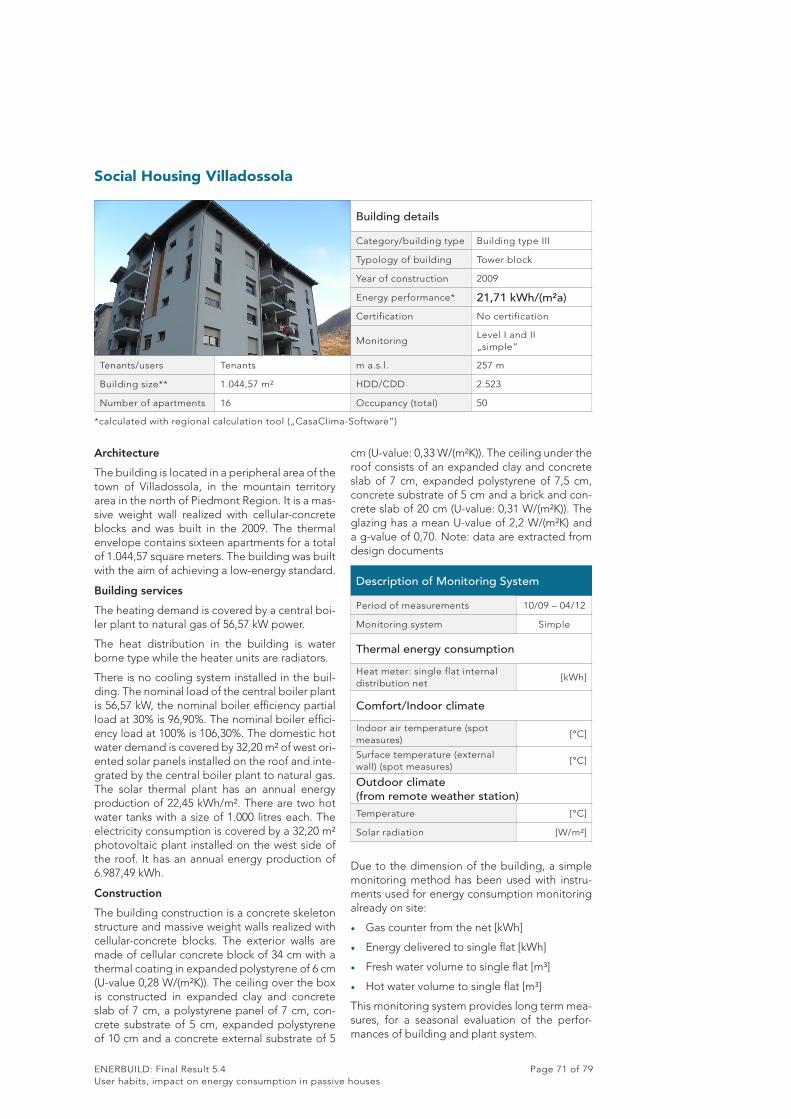
ENERBUILD: Final Result 5.4 Page 71 of 79User habits, impact on energy consumption in passive houses
Architecture
The building is located in a peripheral area of the town of Villadossola, in the mountain territory area in the north of Piedmont Region. It is a mas-sive weight wall realized with cellular-concrete blocks and was built in the 2009. The thermal envelope contains sixteen apartments for a total of 1.044,57 square meters. The building was built with the aim of achieving a low-energy standard.
Building services
The heating demand is covered by a central boi-ler plant to natural gas of 56,57 kW power.
The heat distribution in the building is water borne type while the heater units are radiators.
There is no cooling system installed in the buil-ding. The nominal load of the central boiler plant is 56,57 kW, the nominal boiler efficiency partial load at 30% is 96,90%. The nominal boiler effici-ency load at 100% is 106,30%. The domestic hot water demand is covered by 32,20 m² of west ori-ented solar panels installed on the roof and inte-grated by the central boiler plant to natural gas. The solar thermal plant has an annual energy production of 22,45 kWh/m². There are two hot water tanks with a size of 1.000 litres each. The electricity consumption is covered by a 32,20 m² photovoltaic plant installed on the west side of the roof. It has an annual energy production of 6.987,49 kWh.
Construction
The building construction is a concrete skeleton structure and massive weight walls realized with cellular-concrete blocks. The exterior walls are made of cellular concrete block of 34 cm with a thermal coating in expanded polystyrene of 6 cm (U-value 0,28 W/(m²K)). The ceiling over the box is constructed in expanded clay and concrete slab of 7 cm, a polystyrene panel of 7 cm, con-crete substrate of 5 cm, expanded polystyrene of 10 cm and a concrete external substrate of 5
cm (U-value: 0,33 W/(m²K)). The ceiling under the roof consists of an expanded clay and concrete slab of 7 cm, expanded polystyrene of 7,5 cm, concrete substrate of 5 cm and a brick and con-crete slab of 20 cm (U-value: 0,31 W/(m²K)). The glazing has a mean U-value of 2,2 W/(m²K) and a g-value of 0,70. Note: data are extracted from design documents
Description of Monitoring System
Period of measurements 10/09 – 04/12
Monitoring system Simple
Thermal energy consumption
Heat meter: single flat internal distribution net
[kWh]
Comfort/Indoor climate
Indoor air temperature (spot measures)
[°C]
Surface temperature (external wall) (spot measures)
[°C]
Outdoor climate (from remote weather station)Temperature [°C]
Solar radiation [W/m²]
Due to the dimension of the building, a simple monitoring method has been used with instru-ments used for energy consumption monitoring already on site:
• Gas counter from the net [kWh]
• Energy delivered to single flat [kWh]
• Fresh water volume to single flat [m³]
• Hot water volume to single flat [m³]
This monitoring system provides long term mea-sures, for a seasonal evaluation of the perfor-mances of building and plant system.
Building details
Category/building type Building type III
Typology of building Tower block
Year of construction 2009
Energy performance* 21,71 kWh/(m²a)
Certification No certification
MonitoringLevel I and II „simple”
Tenants/users Tenants m a.s.l. 257 m
Building size** 1.044,57 m² HDD/CDD 2.523
Number of apartments 16 Occupancy (total) 50
*calculated with regional calculation tool („CasaClima-Software”)
Social Housing Villadossola

Page 72 of 79 ENERBUILD: Final Result 5.4User habits, impact on energy consumption in passive houses
Evaluation of measured data - Vorarlberg
In Vorarlberg one multi-family building was mo-nitored from June 2010 to April 2012. Within this building, which contains twelve flats, six flats where monitored very detailed.
The monitoring system was a full automatic Ethernet based system, storing the data on hard discs. The data itself could be downloaded from the hard discs via internet. In the six flats data like temperature, humidity, air volume flow, domestic hot water energy consumption as well as space heat demand and electric energy consumption were measured.
Main interest was the user behaviour, especial-ly the way of using the mechanical ventilation together with window ventilation as well as the difference of using energy in general.
Summarized, the energy consumption as well as the internal comfort met the expected results. Surprising was the big difference between the different flats in the building.
In the following the summarized results of the region Vorarlberg are shown in 3 diagrams re-garding climate data, typical consumptions and internal comfort.
External climate of the region Vorarlberg
The following figure shows the external tempe-rature and solar radiation as hourly averages for the whole monitoring period. There were two pretty extreme weather conditions during mea-suring: a very hot summer in 2010 and a very cold winter in 2012.
Overview of measured energy consumption of monitored flats
The energy consumptions differ a lot from flat to flat, mainly influenced by user behaviour as the flats are completely comparable e.g. having ab-solutely the same size.
Overview of indoor comfort
During the whole measurement period the in-ternal temperature and relative humidity were, during most of the time, in a reasonable range.
Measurement data acquisition Interpretation of statistical results
Regionalentwicklung VorarlbergHof 196861 AlberschwendeT: +43 5579 [email protected]
Fig. 102: Temperature and solar radiation 2010-2012 show very hot summer and very cold winter
Fig. 103: Energy consumption of every 6 flats
Fig. 104: Indoor climate flat 8.

ENERBUILD: Final Result 5.4 Page 73 of 79User habits, impact on energy consumption in passive houses
Architecture
This new building is located in the outskirts of Lauterach, where predominantly multifami-ly houses are situated. The building has three floors; all of them are heated in winter. The enve-lope area is 1.312 m², the heated gross volume is 2480 m³ and the ratio A/V is 0,529. Three of the 12 apartments have 2 rooms + kitchen and bath, the rest have 3 rooms, kitchen and bath. All apartments are connected to an access balcony from where you enter them. That means that all corridors and staircase are not inside the buil-ding and not counting for the treated floor area.
Building services
Central wood pellet boiler with two-pipe distri-bution network. The heating water is delivered to sub-distribution-stations in every single flat. There, the temperature is mixed down to lower level and used for the floor heating in all rooms afterwards. The DHW is generated on-demand with a separate heat exchanger also located in the sub-distribution station. The DHW as well as the heating system are support by a 40 m² solar thermal collector field, delivering energy to the two hot water buffer tanks beside the pellet boi-ler. The ventilation system is a semi-centralized system having one central unit handling the main pressured drop and including the heat recovery. In every single flat there are small decentralized units with small fans that can be controlled by the user itself, adjusting the volume flow to their needs.
Construction
The building itself is a massive construction with concrete floor slap and brick walls. Air tightness is 0,45 1/h in average. The U-values of the wall and roof are 0,10 W/(m²K) and the one for the floor slap is 0,13 W/(m²K).
Description of Monitoring System
Period of measurements 10/09 – 04/12
Monitoring system Simple
General
Output heating system (therm. E) MWh
Heat energy delivered to the pas-sive house part (thermal energy)
MWh
Energy delivered by thermal solar system (thermal energy)
MWh
External temperature °C
Horizontal global solar radiation W/m²
Ventilation system
Outdoor air temperature °C
Outdoor air relative humidity %
Supply air temperature °C
Supply air relative humidity %
Supply air velocity m/s
Extract air temperature °C
Extract air relative humidity %
Extract air velocity m/s
Outdoor air temperature °C
Outdoor air relative humidity %
Flats (the following parameters are mea-sured in every of the six flats)Indoor air temperature °C
Indoor air relative humidity %
CO2-concentration ppm
Air velocity in supply air duct m/s
Energy consumption heating (thermal energy)
kWh
Energy consumption hot dome-stic water (thermal energy)
kWh
Cold water consumption (water meter)
m³
Electric energy consumption (electric energy)
kWh
Building details
Category/building type Building Type III
Typology of building Multi Family House
Year of construction 2008
Energy performance* 14 kWh/(m²a)
Certification Cert. Passive House
MonitoringLevel II „simple”
Tenants/users Tenants m a.s.l. 438 m
Building size** 686,91 m² TFA HDD/CDD 3.576 HDD/a (12/20)
Number of apartments 12 Occupancy (total) 21
*calculated with PHPP **referring to the energy performance above (regional calculation)
Passive House Gartenpark - Sandgasse

Page 74 of 79 ENERBUILD: Final Result 5.4User habits, impact on energy consumption in passive houses
Monitoring results and interpre-tation - House Gartenpark - Sand-gasse, Lauterach, Vorarlberg
Summing up, the measurement results show, that the building performance is as expected. The behaviour of the users can be improved like showing and explaining them how to use the ventilation system in the right way and how to open the windows energetically efficient.
External climate
In the figure below the day with the coldest average outdoor temperature during the mo-nitoring period is shown. The average tempera-ture was -12,39 °C. The weather data in PHPP is calculating with -6,6 °C for the heat load of the building. But even as it was the coldest period in the whole measurement duration, there were only three days in a row with temperatures lower than -10°C and eleven days with temperatures below the PHPP calculation temperature.
Location Lauterach
Norm HDD(12/20) of location 3.576 °C day
Norm HDD(12/20) of location
(PHPP)
3.166 °C day
HDD(12/20)normalized to
measured external climate
(2010/2011)
2.989 °C day
HDD(12/20)normalized to
measured external climate
(2011/2012)
2.956 °C day
Normalization factor for the external
temperature (average of both winters)
1,2
Normalization factor for the external
temperature PHPP (average of both
winters)
1,07
Energy consumption (annual heating demand)
Energy Consumption
Energy performance (monitored) 21,4 kWh/(m²a)
Energy performance (calc. with PHPP)
14 kWh/(m²a)
Calculation tool for en. Certification
PHPP
Certification(energy label)
Passive House
In the following table the measured and calcu-lated energy consumptions for space heat de-mand are shown. In the very first calculation the energy consumption was calculated for a design interior temperature of 20 °C. During the moni-toring we realized that the average interior tem-perature of the several flats was 21,5 °C so that we did the calculation again with this adapted higher temperature (red column). The remaining difference from theory to reality is mainly influ-enced by user behavior as e.g. opening duration of windows.
The primary energy consumption for electricity is the dominative part of all energy uses. As that fact is typical for (thermally) very high efficient buildings, one of the most important tasks for the future will be to improve the electric energy consumption of buildings (see also conclusions). The primary energy factors that were used are the once PHPP is using, like 0,2 for pellet boilers and 2,6 for electricity. In the figure below every-thing that is inside the flat like the decentralized part of the semi-central ventilation system as well as decentralized pumps are taken into ac-count. Of course also lighting, dishwasher and so one are included.
Fig. 105: Exemplary cold winter day
Fig. 106: Energy consumption monitored and calculated
Measurement data acquisition Interpretation of statistical results - Vorarlberg

ENERBUILD: Final Result 5.4 Page 75 of 79User habits, impact on energy consumption in passive houses
Ventilation system
In the next tables the air velocity in the supply air duct and the interior temperature of two dif-ferent flats are shown. Very interesting is to see that the air velocity –and that means also the vo-lume flow- was changed in the one flat by the tenant using the three operation levels of the ventilation unit (shown in the diagram on the left side). In the other flat there was no change of the volume flow by the user. That shows how diffe-rent the behaviors of different tenants are and how different they like to use or are able to use a „new”, unknown system like a ventilation unit which is not widely yet spread in Austria.
The other interesting point is that in both flats the interior temperatures were extremely low during the main winter period. Interior temperatures of 16 – 17 °C were monitored for several minutes during several days. This leads to the assump-tion that this is caused by very long opening durations of the windows. That would perfectly match with the higher energy consumption for the space heat demand.
Conclusions
External climate data: The deviation to mea-sured heat degree days (HDD) was 20% for OIB ÖNORM standard and 7% for PHPP / meteo-norm.
Internal climate: The internal temperatures were approx. 1-3 Kelvin higher (21-23°C) compared with the nominal calculation temperature in the official national standard as well as in the PHPP. Both methods are using 20°C as reference tem-perature what seems to be too cold for the most people.
Energy consumption: The energy consumptions of the flats differ a lot and they are highly con-nected with user behaviour. In average, the con-sumption of the building is pretty close to the calculated results, when the data is corrected in terms of internal temperature, climate data, air change rates, and so on. Concerning the ratio of the primary energy, electricity is the biggest part, especially when heating and DHW is done by biomass as it is at this building.
Ventilation system: The ventilation system wor-ked well, which can be seen at the CO
2-concen-tration, relative humidity and volume flows. Also the efficiency of the heat recovery was at the le-vel that was assumed.
Thermal and hydrothermal comfort: The buil-ding could deal with even quite extreme wea-ther conditions like very hot summer in 2010 and very cold winter in 2012. The CO2-level was unex-pected low, which leads to very good indoor air quality, but with the risk of too dry air in winter.
Fig. 108 and 109: Comparison of air velocity in supply air duct of two different flats
Fig. 107: Specific primary energy demand flat 8

Page 76 of 79 ENERBUILD: Final Result 5.4User habits, impact on energy consumption in passive houses
After the monitoring campaign and analysis of data of 33 passive houses within the alpine space the following conclusions, ordered by topics „External climate data”, „Internal climate data”, „Energy consumption”, „Ventilation system” and „Thermal and hydrothermal comfort” can be done.
External climateExternal climate influences the annual energy consumption of a building. For energy calcula-tions usually a reference or standard weather file for the location of the planned building is taken. It is generated from a database of weather data collected over many years. From this database for every location of the world an average of ac-tual weather data can be calculated by means of an interpolation model. In case of the calculati-on of energy demand for regional energy certi-fication usually a steady state simulation tool is used, which takes into account monthly average values for temperature and global radiation from the standard weather data.
Over the monitoring period five of six partner regions collected real data of the external cli-mate from a dedicated weather station directly on the roof of the monitored passive house or if this was not feasible from a weather station nearby. The measured data was than compared with temperatures and global radiation values from standard climate. Additionally the standard heating degree days (HDD) for the location were normalized through external temperature mea-sured values.
From the comparison of monitored weather data with the ones included in PHPP and generated with meteonorm 6.1, it was found that measured data have deviations in the range of 4 – 41%. Ex-cept of some rare cases the temperatures of all locations during the measurement period was consistently higher than the meteonorm ones and therefore the number of calculated hea-ting degree days in most cases was lower than such a standard. The comparison of monitored weather data with standard ones used in case of regional energy calculation tools brought simi-lar results: Vorarlberg carried out a comparison with weather data from the ÖNORM standard. The deviation to measured climate was 20% and therefore in this case the data of PHPP, genera-ted with meteonorm 6.1, was with 7% closer to the actual weather than the figures of the OIB ÖNORM standard. In South Tyrol the compari-son with standard weather climate used for the regional energy calculation software „XClima” showed deviations from 9 to 32%.
In principle it was evaluated, that is better to assume a slightly colder climate in the energy calculations. The calculated thermal heat loss
results than higher and the building can be plan-ned and executed in a safer way regarding the predicted energy consumption of the building, although expensive over-dimensioning of buil-ding equipment should be avoided.
Often for energy calculations of a building placed in a small town, the standard climate a bigger site nearby is considered, afterwards through a normalization the sea level difference can be taken in account. Generally, must be said however that weather conditions in the alpine re-gion can be very local, in terms of weather data can differ a lot from one location to another, because of topographical and geographical re-asons. Therefore it is generally difficult to make a standard prediction for the climate for a larger area within the mountainous region. Every micro-geographical context could have some peculiar climate conditions and the comparison with data taken from an on-site weather station with standard ones used for energy calculations can lead to some deviations. For energy calculations it is therefore recommendable to use reference weather file obtained through an interpolation process, from the largest possible number of lo-cal weather stations and updated this reference weather file as frequently as possible too.
Internal climateIn five of six regions in all passive houses the indoor climate was monitored, in most cases in two different zones, the living room and a be-droom. To compare the internal climate with the reference temperature of 20°C usually used for energy calculation tools, an average of the two rooms was calculated.
The measured internal temperatures were in ne-arly all passive houses – as expected - approx. 1-4 Kelvin higher (21-24°C) compared to the nominal calculation temperature in the official national standards or in regional energy calcu-lation methods as well as in PHPP. All methods are using 20°C as reference temperature what is too cold for the habits of most of the people. It is worth to think about to adapt this temperature in the future and to change it to 22°C which is much closer to reality or try to change the inhabitant’s behaviour if we want to trust in Fanger theory. These measures would also help to reduce trou-bles as many people compare the calculated demands one-by-one with their consumptions, which leads to the point that they are very often disappointed, because their consumptions are much higher than the calculated figures.
The trend of higher indoor air temperatures is actually contradictory to the assumption that in case of higher surface temperatures, as it is the case in passive houses, the air temperature might be lower, as higher surface temperatures
Result and Conclusions
Eurac research - European Academy of BolzanoInstitute for Renewable EnergyViale Druso 1 39100 Bozen T:+39 0471 055 055www.eurac.edu

ENERBUILD: Final Result 5.4 Page 77 of 79User habits, impact on energy consumption in passive houses
of a room and therefore less temperature diffe-rences between indoor air and surfaces, incre-ases the feeling of comfort.
Only in some rare cases, as in a three-apartment-house in some spaces lower indoor temperature than 20°C were measured, what had led to a lo-wer average temperatures of the building: The average temperatures in apartment 1 in this monitored passive house was about 22,3°C, in apartment 2 and 3 around 19,3°C. This high tem-perature differences can be interpreted as diffe-rent requirements from different users and their daily routine (first apartment inhabited by fami-ly with small child, second and third apartment inhabited by a single person). In another case not all rooms were heated. These rooms had temperatures around 19°C and were mainly not used. Other rooms were heated up to 20°C like the kitchen or the WC, and others had higher set point temperatures than 20°C. For example the bathroom was heated up to 22°C (reasonable for a bathroom considering the clothing level). The living room was heated only by wood firing. From these settings the attitude of the user to save energy is visible. On the average the inter-nal air temperature was around 20°C, which cor-responds to the standard indoor climate.
Generally, there is a trend of the „modern” house inhabitant to stay during the winter period in higher heated rooms (23-24°) with low clothing level or clothing not typical for the winter. This is obviously a decision of the inhabitants them-selves. Nevertheless, they should be informed and aware about the effect of higher indoor tem-peratures to their heating energy consumption.
Energy consumptionThermal energy consumption for heating and domestic hot water
In all 32 passive houses the actual energy con-sumption for heating was determined. Either measured directly with an energy meter or ob-tained from the quantity of consumed combusti-ble or by manual meter reading to compare the calculated demand (net energy in EU standard) and the measured consumption (delivered ener-gy in EU standard)
The measured energy consumption values were compared with the design values for heating energy demand from PHPP and in most of the regions also with design values from the regional energy calculation tool.
As mentioned above the external climate con-ditions as well as the mean indoor temperatures influence the annual thermal energy consumpti-on of a building. Therefore the measured values were afterwards normalized to the external and the internal climate conditions to make them
comparable with the design values as well as to weight the impact of internal and external climate on the thermal energy consumption for heating.
In most of the cases the measured energy con-sumption for heating was higher than the calcu-lated one in PHPP as well as the design value with regional energy calculation software. Howe-ver, on the average, the consumption of the buil-ding was pretty close to the calculated results, when the data was corrected in terms of internal temperature, outdoor climate data and air chan-ge rates etc.
Moreover, through the monitoring of different flats in several multi-family houses it was possi-ble to weight the influence of user behaviour by comparing the monitoring results of the various flats: in fact, the energy consumptions of the flats differed a lot and they were highly connected with user behaviour. In case of thermal energy consumption it was excluded that differences arose because of different solar gains during the winter month or due to different orientations of the apartments. This bring to the conclusion that higher energy consumptions result either from higher temperature levels in rooms, either from other „not conscious behaviours” (e.g. opening the windows and consequently increasing the ventilation losses) or low construction quality.
This leads to the assumption that a good in-troduction to the inhabitants about the energy performance of the system they have bought is necessary as well as the explanation of what effects user behaviour has on the energy con-sumption and energy costs. To inform, train and support the tenants or owners of buildings, will be one of the most efficient and cheapest measures to reduce the energy consumption of buildings in the future. The information could be spread during the yearly owners/tenants mee-ting in case of multi-family-houses or be a man-datory phase of the single family house delivery when the final user did not participate to the de-sign and construction process.
In some rare cases the thermal energy consump-tion was lower than the calculated one, even when taking the normalization for the real hea-ting degree days into account. These excellent results were due to the effective utilization of the building through conscious users, which are well informed about functioning of their passive house.
In one case for example it was the effort of the owner to reduce the energy consumption to a minimum by optimizing the insulation of the warm water circle and using the rolling shutters. The measured results for the energy consumpti-on corresponded in this case very well with the calculated ones of the certification documents. That means that is possible to reach the certified

Page 78 of 79 ENERBUILD: Final Result 5.4User habits, impact on energy consumption in passive houses
performance thanks to a proper and good user behavior.
Generally building services should be designed in a way, that they are understandable for the fi-nal users. The users should be aware of conse-quences of certain behaviors and modifications of the regulation as well as their effect on com-fort conditions and on the overall energy perfor-mance of the whole building.
In the region Piemonte measurements showed really large differences between design values and measured consumption. Part of the rea-son was also here, that the inside temperatures where higher than designed. Apart from that, some hypotheses about the cause, could be done after analysing the measurements:
• Thermal bridges were underestimated during the design phase
• Differences between executive design and actual construction
• Probably higher ventilation rates than desi-gned ones, due to holes in the building en-velope, which were made to avoid moisture problems
• Low efficiency of boiler, distribution and con-trol systems, due to the lack of commissio-ning and tuning of plants
This case shows, that it is not enough to give a certificate for the energy calculation, but that it is crucial to evaluate and control also the exe-cution phase of the construction to be sure that the realized construction correspond to the desi-gned one and it operates as foreseen. This is es-pecially important when investors, planners and handicraftsman are either not experts in the field of energy efficient constructions or they are not aware that they have to do a good work for the realization of a high energy efficient building .
Also it is fundamental to assure an adequate commissioning and tuning of the whole building and its systems and, as mentioned above, to in-troduce the inhabitants to the features and rela-tive performances of the building.
When energy consumption for heating decre-ases to a minimum as it is the case in passive houses the thermal energy consumption for do-mestic hot water gets more and more significant. The monitoring of thermal energy consumptions showed that the energy consumption for dome-stic hot water took a comparatively big part of the total thermal energy consumption, which is of course also due to the fact that domestic hot water is consumed all over the year, while the he-ating system runs only during the winter period.
Anyhow, often, regional energy certification sy-stems do not take into account energy consump-
tion for domestic hot water. A consideration of thermal energy consumption for domestic hot water in the energy certificate would maybe lead to a higher effort to improve the efficiency of the production and distribution of domestic hot water as well as systems for saving domestic hot water or it would eventually also lead to an incre-ased use of solar thermal systems.
Another aspect that is to mention, is that heating energy demand per square meter calculated as reference for energy certification not refers to the energy consumption per person. Through the monitoring of different building types with residential use high differences in per capita consumptions were seen.
Electric energy consumption
In five of six regions the electric energy consump-tion of the passive houses was monitored. Either directly as automatic read out of the electric en-ergy meter or by manual reading of the meter for electric energy. The monthly consumption for electric energy was multiplied by the primary en-ergy factor and compared with the consumption of thermal energy over the entire year.
The same as described before for thermal ener-gy consumption for domestic hot water applies to electric energy consumption. When energy consumption for heating decreases to a mini-mum as it is the case in passive houses the con-sumption of electric energy gets more and more meaningful.
The passive houses demonstrated the high dif-ference of primary energy consumption between the big amount of electric energy for household and lighting and the comparatively little amount of thermal energy. The normalization of energy consumption through the primary energy factor emphasised this fact particularly when heating and domestic hot water is produced by biomass.
Also the amount of electric energy demand is often not considered in regional energy certi-fication systems and an inclusion of this aspect would maybe also lead to the improvement of electricity end use and distribution efficiency as well as boost the development of novel electric energy saving strategies. In the future the reduc-tion of the electric energy consumption will be the most important task to take care about.
In three single-family-houses the compact unit (heat pump combined with ventilation system) was monitored in detail: The results impressively confirmed that electric energy for household ex-ceeded electric energy for building equipment. In one case 80% of the total electric energy was used for household, in the other cases 60% and 55% respectively.

ENERBUILD: Final Result 5.4 Page 79 of 79User habits, impact on energy consumption in passive houses
Ventilation
In three of six regions also the ventilation and heat recovery systems were monitored in detail in terms of temperature sensors in the four air channels, in case of preheating or geothermal heat exchanger another two temperature sen-sors (before and after) were installed as well as an additionally sensor for air velocity in the sup-ply air channel.
The data was evaluated in terms of temperature and air speed and its effect on comfort condi-tions, the effectiveness of heat recovery and the effectiveness of air exchange was determined by analyzing CO2 concentration levels.
Data analysis showed in most of the cases that the air exchange seemed to be efficient, becau-se high CO2 concentrations were avoided; rela-tive humidity and volume flows were mostly in the range of comfort. In some rare cases howe-ver the concentration increased to 1.600 ppm. To solve this problem the ventilation system could be controlled by a CO2 sensor. This would be particularly suitable for office – and school buil-dings.
Also the efficiency of heat recovery was at the nominal level. For future projects it is important to explain the right use of ventilations systems to the users in a better way, to allow them to un-derstand how to operate the system at its best.
Thermal and hydrothermal comfortIndoor comfort was monitored in terms of tem-perature (see also internal climate data) of at least two zones, plus surface temperature and relative humidity of indoor air. To get informati-on about the comfort in the passive houses the data were evaluated with different comfort mo-dels (with Fanger model EN ISO 7730; with psy-chrometric chart and Ashrae comfort zones and with adaptive model of comfort (UNI EN 15251: 2008)) that allow evaluating if the measured cli-mate ranges within the comfort zone or exceeds it.
Generally it can be said, that the temperatures as well as the humidity were in the acceptable „zone”, with no meaningful surprises. The buil-ding could face even quite extreme weather conditions like very hot summer in 2010 and very cold winter in 2012 - most of the time the „buil-ding climate” was in the comfort zone.
The measurement showed in many cases extra-ordinary low CO2 levels (see ventilation), that means the air quality was very good. This good air quality is due to a high ventilation rate. This high ventilation rate is not only one of the re-asons of the higher energy consumption, but leads also to low humidity rates in winter. On the other side some measurements in sleeping
rooms showed that sometimes the CO2 level is above the Pettenkofer level. The determination of the right ventilation rate or a development of systems with a more flexible ventilation rate seems to be one of the main tasks of the techni-cal development of passive houses.
User satisfaction and marketing of passive housesThe audits showed in general an extremely high satisfaction of the users. Not only the passive house builders, but also sceptical family mem-bers enjoyed the passive houses. Even when measurements of low humidity rates indicated a comfort problem, users never felt uncomfor-table. This higher user satisfaction in passive houses is also known from larger surveillance programmes in Austria. Therefore in the future the leading argument for passive houses seems probably not to be the energy saving or the en-vironmental aspect, but the indoor comfort and the high user satisfaction.
References Page 18: [1] Frei B., Reichmuth F., Huber H., Verglei-chende Auswertung schweizerischer Passivhäuser, Bundesamt für Energie, Bern, 2004; p 87. [2] S. Lenel et al.: Praxistest Minergie® – Erfah-rungen aus Planung, Realisierung und Nutzung von Minergie® Bauten, Verein Minergie®, Schlussbe-richt Juni 2004Page 58: [3] FAWA – Feldanalyse von Wärmepum-pen-Anlagen; Tagungsband des Schweizer Bundes-amtes für Energie (BFE) 2004[4] Fanninger Gerhard; IFF-Universität Klagenfurt: „Der Wärmepumpenmarkt in Österreich 2005„ März 2006
Bibliography1. M.Santamouris. Energy Performance of residenti-al buildings. A practical guide for energy rating and efficiency. s.l. : Earthscan Publishers, 2005.2. ANSI/ASHRAE_55:2004. Thermal Environmental Conditions for Human Occupancy. 3. ASHRAE_Standard_62:1989. Ventilation For Ac-ceptable Indoor Air Quality. 4. DIN_4108-3:2001-7. Wärmeschutz und Energie-Einsparung in Gebäuden; Teil 3: Klimabedingter Feuchteschutz; Anforderungen, Berechnungsverfah-ren und Hinweise für Planung und Ausführung. 4. EN_15251:2007. Indoor environmental input pa-rameters for design and assessment of energy per-formance of buildings addressing indoor air quality, thermal environment, lighting and acoustics. 2007.5. ISO_7730:2005. Ergonomics of the thermal envi-ronment -- Analytical determination and interpreta-tion of thermal comfort using calculation of the PMV and PPD indices and local thermal comfort criteria. 6. Passivhaus Institut. Anforderungen und Prüfver-fahren zur energetischen und schalltechnischen Beurteilung von Passivhaus-Lüftungsgeräten für die Zertifizierung als “Passivhaus geeignete Komponen-te“. Darmstadt : s.n., 2009.
You received this Information from:
ENERBUILD Project Partner:
Regionalentwicklung Vorarlberg http://www.leader-vlbg.at
TIS Techno Innovation South Tyrol http://www.tis.bz.it
Rhônalpénergie-Environnement http://www.raee.org
Regione Piemonte http://www.regione.piemonte.it
Fachhochschule Rosenheim http://www.fh-rosenheim.de
Posoški razvojni center http://www.prc.si
Energieagentur Obersteiermark http://www.eao.st
Standortagentur Tirol http://www.standort-tirol.at
Autonomous Province of Trento http://www.provincia.tn.it
Province of Alessandria http://www.provincia.alessandria.it
Accademia Europea Bolzano http://www.eurac.edu
NENA Network Enterprise Alps http://www.nena-network.eu
Zentralschweizer Volkswirtschaftsdirektorenkonferenz http://www.itz.ch