user guide - pearson qualifications | edexcel, btec, … guide any problems? please contact us. ( )...
TRANSCRIPT

User Guide
Any problems? Please contact us. (http://qualifications.pearson.com/en/support/contact-us.html)
Version 1.2 June 2015
Topic Page
Setting up or updating your account 2Logging in 2Choices after login 2
ResultsPlus Analysis 3 – 17Results for a student 3Student results overview 3Exam paper analysis 4Accessing examination documents 5Highlight reports 5Skills maps 6 – 7Exporting graphics 7Setting up a class or group 8 – 9Analysing a group’s performance 10Group grade analysis 11 Creating grade groups 11 Group paper analysis 12Group highlight reports 13 Comparing groups 14Cohort paper analysis 15Cohort grade reports 16Downloads 17
Mock Analysis Service 18 – 25Uploading ID details for mock exam candidates 18 – 19Finding past papers and mark schemes 20Entering student marks 20 – 21Analysing students’ mock exam results 22Assigning target grades 23 – 24Assessing progress towards the English Baccalaureate 24 – 25

ResultsPlus User Guide v1.2 June 2015 © Pearson Education Ltd 2015
Page 2
Setting up or updating your accountTo use the service, you need your own Edexcel Online (EOL) account with the ResultsPlus access enabled. If you don’thave an EOL account, or ResultsPlus access is not enabled, please ask your Examinations Officer to create or updateyour EOL profile so that you can access ResultsPlus.
If you are not able to arrange the set-up of an account through your Examinations Officer, please contact us (http://qualifications.pearson.com/en/support/contact-us.html). You will need to phone from your institution during normal school open hours, as we only set up new accounts using a secure call-back to the school.
Once we have set up your account, your username and password will be emailed to you.
If you cannot remember your password, you can request an email reminder from the ResultsPlus login page (http://qualifications.pearson.com/en/support/Services/ResultsPlus.html).
Logging inYou can log in to ResultsPlus at http://qualifications.pearson.com/en/support/Services/ResultsPlus.htmlType in your username and password and click Login.
The first time you use ResultsPlus, you will be asked to read and accept the terms and conditions of use, which include your responsibilities around the use of students’ data. It is important that you do not share your account details with anyone. Please direct any colleagues who require ResultsPlus access to this user guide.
Choices after loginAfter logging in, the home screen gives you four options:
Figure 2
� Click ResultsPlus Analysis to view reports on your students’ Edexcel exam results.
� Click Mock Analysis Service to use Edexcel’s past papers for mock exams and mock paper analysis.
� Click Create or edit a group if you wish to view collated results for classes or other groups ofstudents. Any groups you create apply to both ResultsPlus Analysis and Mock Analysis.
� Click ResultsPlus Direct (for students) administration to create and manage ResultsPlus Directaccounts. Option only available to Examinations Officers or staff with exam administration duties.
Figure 1

Page 3
ResultsPlus AnalysisWhen you select ResultsPlus Analysis you are presented with four options:
Figure 3
Results for a student Selecting Show me results for a student allows you to search for students within your centre.
Figure 4
1. Type in some or all of a student’s first name or last name and click Go or press the Return key.
2. You will be presented with a list of all students matching your search criteria.
3. Click View student results to see all Edexcel exam results for a student (as illustrated below in Figure 5).
Student results overviewResultsPlus brings together into one viewa student’s performance across all Edexcelexams. For each qualification and subjectyou can open and close folders in orderto see performance in individual papers.Figure 5 shows the GCE and the GCSEfolders expanded.
Where a grade has been awardedyou can see how close the studentwas to the grade boundaries.Hovering the cursor over this bar willreveal the student’s UMS score
To understand more about how yourstudent achieved this grade click onView paper analysis.
1
2
Figure 5
ResultsPlus User Guide v1.2 June 2015 © Pearson Education Ltd 2015
2
1

Page 4
Exam paper analysis Once you have selected the paper analysis you wish to view, you will have access to a wide range of information. Tabsallow you to navigate easily between:
� exam paper analysis
� exam documents (papers, mark schemes and principal examiners’ reports)
� highlight reports
� skills maps (which show how performance links to specific topics and skills).
Figure 6
To select different exam papers, click here.
For each question you can see the score achieved by this student and the maximum score. The total score isshown at the bottom of the column.
On most papers you will need to scroll down the page to see all scores.
The performance column helps you see at a glance how well the student performed on each question. The key atthe top right of the table shows what each colour signifies. For example, a greenbar shows that the student achieved more than 70% of the marks available.
You can sort any column to quickly identify strengths and weaknesses.
Edexcel averages help you compare your students’ performance with all Edexcelcandidates. Selecting Edit will allow you to compare average scores for studentswho achieved a particular grade, as shown in Figure 7.
Residuals help you see quickly where your students outperformed orunderperformed against Edexcel averages. If the student achieved a higher averagescore than the Edexcel average, the residual will appear green. Red indicates a scorelower than the Edexcel average. The size of the coloured bar indicates how far above or below the average yourstudents scored. You can view the percentage difference (positive or negative) by hovering the cursor over thecoloured bar.
For subjects with skills map reports, you can click through to see which curriculum topic or skill was tested in thatquestion, or simply hover over the skill tested icon.
1
2
3
4
5
6
7
8
Figure 7
12
2
3
4 6 7 85
ResultsPlus User Guide v1.2 June 2015 © Pearson Education Ltd 2015
Page 5
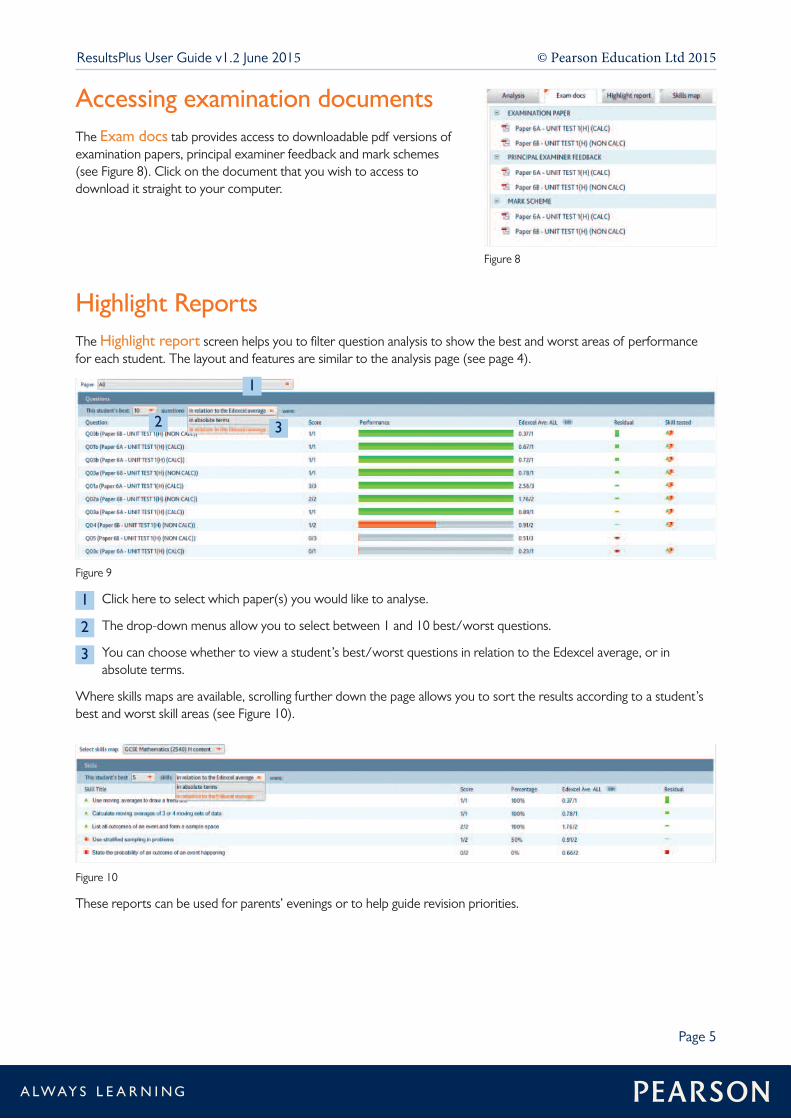
Accessing examination documentsThe Exam docs tab provides access to downloadable pdf versions ofexamination papers, principal examiner feedback and mark schemes(see Figure 8). Click on the document that you wish to access todownload it straight to your computer.
Figure 8
Figure 10
These reports can be used for parents’ evenings or to help guide revision priorities.
Highlight ReportsThe Highlight report screen helps you to filter question analysis to show the best and worst areas of performancefor each student. The layout and features are similar to the analysis page (see page 4).
Figure 9
. Click here to select which paper(s) you would like to analyse.
The drop-down menus allow you to select between 1 and 10 best/worst questions.
You can choose whether to view a student’s best/worst questions in relation to the Edexcel average, or inabsolute terms.
Where skills maps are available, scrolling further down the page allows you to sort the results according to a student’sbest and worst skill areas (see Figure 10).
1
2
3
1
2 3
ResultsPlus User Guide v1.2 June 2015 © Pearson Education Ltd 2015

Page 6
Skills mapsThe analysis for many Edexcel qualifications includes skills map reports which link students’ performance on exampapers to topics and skills from the specification. You can access skills map reports in two ways:
When viewing any analysis report, click on the Skills map tab.
When viewing any analysis report, click on the icon in the Skill tested column.
Figure 11
Skills maps allow you to see how your students performed on topic or skill areas.
Topics and skills are arranged in a tree-structure. You can click on headings to see more detail, or contract the viewto just see the main topics.
For each topic or skill, you can see how many marks your student scored and the maximum number of marksavailable.
Edexcel averages and residuals help you to see how your students have performed in relation to other candidates.
Some subjects have more than one type of skills map. Click on the skills map selector to change the view.
Coloured symbols to the left of each topic or skill help you see at a glance how well your students performed.The key at the top right of the screen shows what each colour signifies. For example, a red square indicates thatyour students achieved under 35% of the marks available on that topic or skill. A grey diamond represents skillsthat were not tested in this paper.
You can filter the skills map reports using the drop-down menu options here. For example you can view all skillsrather than just the skills that were tested (Figure 12).
1
2
3
4
4
5
6
7
Figure 12
Skills maps for a group or cohort are similar to reports for individual students, with the score being themean average of students in the group.
1
2
3
5
6
7
ResultsPlus User Guide v1.2 June 2015 © Pearson Education Ltd 2015

Page 7
Skills map export
Clicking on the Export icon in the top right-hand corner exports the data into a spreadsheet.
The export reports can be manipulated and shared with other data systems.
Printing a skills map
Clicking on the print icon produces the Print options screen (Figure 13).
Choose the range of skills that you would like to print, and then click OK.
Figure 13
Exporting graphicsAll gradeometer, grade bar and question-level performance graphics can be saved for use in your own reports.
Figure 14
1. Right click on the graphic that you wish to save.
2. Select Save graphic as bitmap from the menu which appears.
3. Select a location on your computer where you would like to save the graphic, and then click Save.
ResultsPlus User Guide v1.2 June 2015 © Pearson Education Ltd 2015

Figure 17
After entering search options, click Find students.
1. From the list of students, tick those that you want to include in your group and then click Add to group. Use the‘x’ delete button to remove any students from the group. Please note: there is a maximum number of students youcan include in a group, currently 100.
2. When your group is complete, type a name for the group and click Save. Page 8
Setting up a class or groupIn order to access reports for classes or groups you will need to first create these groups from the student namesassociated with your centre. Students can be grouped however you wish, from straightforward class groups tomore detailed groupings, such as Boys on FSM with target grade C. A student can appear in as many groups as youwant. As students take exams and mock exams, their results feed through automatically to group analysis.
To create a new group, first select Create or edit a group from the home screen.
Figure 15
Once on the Groups page, click Create new group
Figure 16
Use the filters and search options below to help you find students that you wish to include in your group.
� Searching By award/unit allows you to find students who were entered for a unit or paper in a particular examsession.
� Searching By year of birth finds students by searching for their year of birth.
� Searching By student search allows you to find students using some or all of their first name or last name.
� Searching By school year finds students according to the academic year within which their date of birth falls.
ResultsPlus User Guide v1.2 June 2015 © Pearson Education Ltd 2015

Page 9
Figure 18
Once selected, existing groups can be edited and/or copied and adapted using the Edit and Copy links.
Deleting a group
You will then be taken to the Groups page where a list of all your centre’s live groups can be found (Figure 18). As thislist grows with time, you can use the Group created by: filter, or sort buttons on each column of the Groups listing,to help find your group. Deactivating outdated groups helps you to manage the number of groups in the live groups list.At any time you can reactivate a group from the deactivated groups list.
Figure 19
On the Groups page, click on the Show only: Deactivated groups button.
Click the Delete button next to the group that you would like to delete. You will then be prompted to check ifyou would definitely like to delete the group, as deleted groups cannot be recovered. Click OK if you are happy toproceed, and the group will then disappear from the list.
1
2
1
2
ResultsPlus User Guide v1.2 June 2015 © Pearson Education Ltd 2015

Page 10
Analysing a group’s performance From the home menu, choose ResultsPlus Analysis. Selecting Show me results for a group will present you withtwo options.
Figure 20
Selecting Detailed group analysis allows you to choose a group and then see how that group performed acrossrelevant qualifications and subjects.
Find the group you wish to view from the list of all groups set up for your centre using the sort buttons at the top ofeach column or the Group created by: filter.
Figure 22
Use the Select a session: and Select a qualification: filters or the sort buttons at the top of each column tohelp narrow your search for particular units and papers.
Click View paper analysis or View grade analysis to proceed.
Figure 21
Click View group analysis to see a summary of all results for students in that group. 1
2
3
1
2 2
3 3
ResultsPlus User Guide v1.2 June 2015 © Pearson Education Ltd 2015

Page 11
Group grade analysisGrade reports show the grade distribution for a group of students in a subject for a chosen exam session.
Figure 23
The total number of students is given on the right.
Hovering on a grade bar shows the percentage of students achieving that grade.
Individual student grades are shown below, with a link to each student’s paper analysis.
Click here to change the colour scheme of the grade graphic.
4
5
6
7
45
6
7
Creating grade groupsFrom the grade analysis page, clicking on a section of the grade bar gives you the option to save all students whoachieved that particular grade in a group (see Figure 24).
Figure 24
Clicking on Save candidates as new group will automatically save the candidates under a default name based on thegrade, award code and session. This group will then be available to select from the Groups list.
ResultsPlus User Guide v1.2 June 2015 © Pearson Education Ltd 2015

Page 12
Group paper analysis
Figure 26
To select different exam papers, click here.
For each question you can see the average score achieved by students in this group and the maximum score.
On most papers you will need to scroll down the page to see all scores.
The performance column helps you see at a glance how your group did on each question. The key above the right-hand side of the table shows what each colour signifies. For example, the red bar shows the proportion ofstudents in your group who scored less than 35% of the marks available on a question. Hover over the bar to seehow many students were in each category.
You can sort any column to help identify strengths and weaknesses.
Edexcel averages enable comparison of your group’s performance with all Edexcel candidates. Click Edit to selectaverage scores for students who achieved a particular grade.
Residuals help you see quickly where your students outperformed or underperformed against Edexcel averages.See page 4 for further explanation of residuals.
For subjects with skills map reports, you can hover over links orclick through to see which curriculum topic or skill was tested inthat question. See page 6 for more information on skills maps.
You can print analysis for any number of students in the group.Click on the print icon to reveal the Print options screen.Clicking Print analysis for students in group will open apop-up, from which you can select which paper analysis to print(see Figure 27).
Figure 25
Tabs allow you to navigate easily between the overview of students in your group, paper analysis, examdocuments, highlight reports and skills maps.
Group analysis reports are similar to the student analysis reports (see page 4).
1
2
3
4
5
6
7
8
9
10
1
23
10
45
6 7
8
9
Figure 27
ResultsPlus User Guide v1.2 June 2015 © Pearson Education Ltd 2015

Page 13
Group highlight reportsGroup highlight reports are similar to the student highlight reports (see page 5). This tab allows you to quickly viewyour students’ best and worst questions and skills in each unit. You can print this collective data as a summary of howthe whole group performed. You can also print individual highlight reports for each student in the group from thisscreen. To do this, click on the printer icon in the top right corner of the screen.
From the print options menu (Figure 28), select Print highlight report for all students in group, and click OK.
Figure 29
Figure 28
The next screen will list all of the students in the group, and allow you to print a Highlight report for each individual(Figure 29).
ResultsPlus User Guide v1.2 June 2015 © Pearson Education Ltd 2015

Page 14
Comparing groupsFrom the Show me results for a group page, select Compare groups.
Figure 31
You can scroll down or minimise grade reports to give the view you need.
The total number of students is given on the right.
Hovering on a grade shows the percentage of those students achieving that grade, helping you to compare yourgroup’s performance with other groups or all Edexcel students.
Click View paper analysis to access reports on papers contributing to the award.
Figure 30
Compare groups allows you to select more than one group of students and compare their grade performance.
1. From the list of groups that appear, tick the groups you wish to compare and then click Choose subjects.
2. Select one or more awards and click Compare grades.
A set of grade reports appear. Each grade report shows the grade distribution for a group of students in one subjectduring one exam session.
1
2
3
4
1
1
23
4
ResultsPlus User Guide v1.2 June 2015 © Pearson Education Ltd 2015

Page 15
Cohort paper analysisFrom the home menu, choose ResultsPlus Analysis.
Selecting Whole cohort reports will present you with two options:
Figure 32
Cohort paper analysis allows you to analyse your whole cohort’s performance on a particular exam paper.
On selecting Cohort paper analysis, choose a qualification type and exam session from the drop-down menus. The list will display all awards and units with active entries at your centre.
Figure 33
When you have found the relevant exam paper, click View paper analysis.
Cohort paper analysis reports work in the same way as Group paper analysis reports (see page 12).
Figure 34
1
1
ResultsPlus User Guide v1.2 June 2015 © Pearson Education Ltd 2015

Page 16
Cohort grade reportsFrom the Whole cohort reportsmenu page, select Cohort grade reports and choose a qualification type andexam session from the drop-down lists available. Then tick the award(s) that you wish to view and click Comparegrades.
You will be presented with one or more grade performance reports. Each grade report shows the grade distributionfor a group of students in one subject during one exam session.
Figure 35
The total number of students is given on the right.
Hovering on a grade bar shows the percentage of students achieving that grade, helping you to compare yourgroup’s performance with other groups or all Edexcel students.
Click View paper analysis to access reports on papers contributing to the award.
You can compare your cohort’s performance with other exam sessions, or with types of centre, or by gender,using the radio button options at the bottom of the screen.
1
2
3
4
12
3
4
ResultsPlus User Guide v1.2 June 2015 © Pearson Education Ltd 2015

Page 17
Figure 37
Use the drop-down menu to select a qualification type.
Select the relevant examination session.
Clicking the plus sign next to the award title reveals the units in that award and each unit’s examination papers.
Click Download for the examination paper results that you wish to export. You will then be given the option tosave the CSV file to your computer.
Opening the file will reveal a spreadsheet showing the question-by-question breakdown of marks for every studentfrom your centre who sat that examination session (see Figure 38).
1
2
3
4
1 2
3
4
Figure 38
Figure 36
Select the Downloads option. This option lets you export a whole cohort’s results for any particular examination as aspreadsheet.
DownloadsFrom the home menu, choose ResultsPlus Analysis
ResultsPlus User Guide v1.2 June 2015 © Pearson Education Ltd 2015

Page 18
Mock Analysis ServiceIn order to upload a student’s mock exam scores, the student requires a ResultsPlus account. Any students who havebeen entered by your centre for real GCSE or GCE exams with Edexcel already have an ID in ResultsPlus. For thesestudents you can type in their scores straight away (see page 20 Entering student marks).
For students who have not yet taken an Edexcel exam, you need to follow the steps below.
Uploading ID details for mock exam candidates1. From the home menu, choose Mock Analysis Service. Then select Create new student accounts.
Figure 39
Figure 40
2. Click Download spreadsheet and save the file called MockLearnerTemplate.csv to your desktop.
3. Open this file (it will open in Microsoft Excel) and type in (or copy from another source) the first name, last name,date of birth and gender of each student that you wish to add.
� Check that the first names and last names are the right way round.
� Write the date of birth in the format dd/mm/yyyy. For example, the date of birth of a student born onMarch 1st 1998 would be entered as 01/03/1998.
� Use M or F for the gender.
4. From the file menu choose “Save as” and save the file to a suitable location using a memorable name. Make sure thatin the “Save as type” field you have chosen CSV (Comma delimited) (*.csv)
5. From the File upload area, click Browse… and find the location of your upload .csv file.
6. Click Upload.
If there are any problems with the file, you will be given hints on how to correct it. When the file is checked andapproved, you will see a summary of all the students’ details. If any of these students have an existing ResultsPlusaccount, they will be automatically removed from the list.
Your students’ details should now show up in any student search screens.
When a “mock student” is eventually entered for a high stakes examination, their mock ID will automatically link totheir high stakes ID, assuming that their first name, last name and date of birth details match.
This takes you to thefile upload area.
ResultsPlus User Guide v1.2 June 2015 © Pearson Education Ltd 2015

Page 19
Editing learner details
From the home menu, select Mock Analysis Service, then View mock results analysis, then Show me resultsfor a student.
Type a student’s name/part of a name into the search boxes. The search results will bring up the option to Editstudent details next to the names of any students that you have previously entered. Clicking on this option revealsthe Edit learner details panel (see figure 41), where you can enter amended learner details and then click Save.
Figure 41
Creating groups when importing mock exam candidates
After uploading your students’ details, you will automatically be navigated to the Upload summary page, where you canselect learners to be included in a new group.
Figure 42
The default is that all students are selected for inclusion in the new group, indicated by a tick in the Select column. Clickon these tick boxes in order to deselect students, or use the Select all button to select/deselect all students with asingle click.
Next, click Create Group.
You will then be taken to the Create or edit a group screen, where you can add more students to the group fromthose already entered into the system, give the group a name, and save the group (see page 8).
ResultsPlus User Guide v1.2 June 2015 © Pearson Education Ltd 2015

Page 20
Finding past papers and mark schemesFrom the home page, select Mock Analysis Service.
From the three options presented, select Find past papers and enter marks.
Figure 45
Click Enter marks.
Figure 44
1. Scroll down the list of subject awards and expand folders until you find the exam paper and mark scheme you arelooking for.
2. Click on the mark scheme or exam paper to open the file in another window, where you can print or save it.
3. If you are ready to upload student marks for mock papers, click the relevant Group or Student links (see thefollowing section on entering student marks).
Entering student marksNavigate to the relevant exam paper using the instructions above. You can upload results individually by clicking theStudent link or, if your students are already in the right group, click on the Group link (for information on creatinggroups, see page 8).
For individual students, type in some or all of their first name and last name and click Go.
Figure 43
Select a qualification and exam session from the drop-down lists at the top of the screen.
ResultsPlus User Guide v1.2 June 2015 © Pearson Education Ltd 2015

Page 21
For groups of students, find your group and click Enter marks.
Figure 47
You will be presented with a screen that shows the question numbers and available marks for the exam paperselected.
Figure 46
Find the student from the list of students in that group and click Enter marks.
Figure 48
1. First enter the date on which the mock was taken. Then type the scores into each of the boxes. You can move up ordown between boxes using TAB or the arrow keys.
2. Some papers have option questions. Leave options that were not attempted blank. If a student has attempted anoption question and scored zero marks, type a score of 0 in the box. After entering scores, check that the total maxscore is correct.
3. When you have finished entering scores for a student, click Save. You can correct any scores at a later date byfinding the paper and student’s scores, typing over the original entry and then clicking Save.
You can toggle quickly from one student to the next in a group by clicking Next student in group. This willautomatically save the results that were entered for the current student, and load the results page for the next student.The date of the mock exam is automatically completed.
ResultsPlus User Guide v1.2 June 2015 © Pearson Education Ltd 2015

Page 22
Analysing students’ mock exam resultsFrom the three options presented on the Mock Analysis Servicemenu page, select View mock results analysis.
Figure 49
Choose either Show me results for a student or Show me results for a group.
Figure 50
For an individual student use the search screen to find the student, then click View student results.
Mock analysis reporting works in a similar way to the main ResultsPlus service (see pages 3-17).
Figure 51
ResultsPlus User Guide v1.2 June 2015 © Pearson Education Ltd 2015

Page 23
Assigning target gradesClicking on the + icon next to GCSE allows you to view paper analysis and set and review target grades for each award.
Click View paper analysis to view detailed question-by-question analysis.
You can compare your students’ mock performance with the Edexcel averages for when the paper was sat “for real”.
Figure 52
Click on the Export icon in the top right hand corner to view and save the data in a spreadsheet.
Figure 53
Clicking Edit allows you to see average scores by students who achieved a particular grade. This informationcan be used to support your judgement in assigning a current estimated grade.
Figure 54
ResultsPlus User Guide v1.2 June 2015 © Pearson Education Ltd 2015

Page 24
Figure 55
To enter estimated grades and target grades, click Edit grades on the Student mock results overview screen. Use thedrop-down menu to select a target grade, and adjust the slider to set an estimated grade.
Assessing progress towards the English BaccalaureateMock analysis reporting enables you to build reports showing students’ progress towards the English Baccalaureate(Ebacc), based on their estimated grades. To view the Ebacc folder, you must first enter a student’s estimated grades(see Figure 55).
For each student, you will now see a new folder called EBACC which shows current estimated grades across alleligible subjects (see Figure 56).
Figure 56
Click Choose baccalaureate subjects to select which student award is to be included in each Ebacc subjectcategory (see Figure 57).
Figure 57
This button allows you to select whether you would like to include all Ebacc subjects in the Baccalaureateoverview, or only those subjects for which you currently have mock analysis data.
1
2
3
4
5
6
1
2
ResultsPlus User Guide v1.2 June 2015 © Pearson Education Ltd 2015

Figure 58
The Candidates column displays how many students from your group have data entered for each award.
The coloured bar in the Status column gives a quick visual indication of how many students are on target,borderline or off target to achieve a C grade or higher in each award. Hovering the cursor over each colouredsection reveals the exact number of students who hold that status.
Clicking here allows you to see the Ebacc overview status for each individual in the group, and gives you the optionto click through to each student’s personal Ebacc analysis.
Clicking here allows you to view the Ebacc analysis for each award.
Page 25
Each of the coloured bars refers to an Ebacc subject area, indicated by the letter attached to each bar (E = English,M = Mathematics, SS = Sciences, H = Humanities, L = Languages). A grey bar indicates that the data for thatsubject area is incomplete. An orange bar indicates that the student is on the C/D borderline for that subject area.A red bar indicates that the student is off target, and a green bar indicates that a student is on target, to achieve aC in that subject.
This icon allows you to view at a glance whether or not a student is on target to achieve a C grade in all Ebaccsubjects.
This column shows how close the student is to the grade boundaries for each individual contributing award.
The Status column indicates which Ebacc subjects are areas of strength or weakness.
Ebacc reports are also available for groups. From the Mock analysis options page, click Show me results for agroup. Find your group in the list and select View group analysis.
3
4
3
4
5
6
1
2
3
41 2
ResultsPlus User Guide v1.2 June 2015 © Pearson Education Ltd 2015