user guide - bom to excel revit app · 2018-01-01 · microsoft word - user guide - bom to excel...
TRANSCRIPT

2300 McDermott Road Su i te 200 -‐235 214.301.0000 Business Confident ia l ©HingePoint
P lano Texas 75025
User Guide: BOM to Excel – Revit App By HingePoint
Overview BOM schedules are typically setup in summary detail fashion. This Plugin allows users to setup BOM schedules by defining rules for Upper and Lower BOM schedules. Typically, the Upper section would contain summary values, and the Lower section would contain detail values. However, the user can now set up both sections per BOM schedule tab.
The BOM schedules use existing Revit schedules as their source of data. The schedules may be configured through the Plugins setup tab. When a Revit schedule is enabled as a BOM schedule, a tab will be added for the BOM schedule and the schedule will be added to the Excel report on the BOM tab.
Installation Please see our Installation Guides at:
http://www.hingepoint.com/products/bom-‐revit-‐app/help/
Launching the BOM to Excel App The BOM for Revit plugin is launched from Revit’s Add-‐Ins menu. To launch the plugin, click the BOM toolbar button.

2300 McDermott Road Su i te 200 -‐235 214.301.0000 Business Confident ia l ©HingePoint
P lano Texas 75025
Figure 1 Tool bar button
Setup After the Plugin is launched, you will see a screen similar to Figure 2. The setup tab is divided into four areas.
Figure 2
Revit Schedule Grid
The top left shows the Revit Schedules grid. The grid shows the Revit schedules that are defined in the drawing. Each row contains the name of the Revit schedule, and a checkbox that enables the Revit schedule to be a BOM schedule. The tab name is the name the Plugin will use to generate a new Plugin tab for the BOM schedule, and the name of the sheet added to the Excel report. The Tab Name defaults to the Revit Schedule Name. As changes are made to the fields

2300 McDermott Road Su i te 200 -‐235 214.301.0000 Business Confident ia l ©HingePoint
P lano Texas 75025
for the schedule, the Update Column will show a Save button. Click the button to save the settings to the Revit file. The Revit file must be saved in order for these setting to be remembered, the next time Revit is opened.
BOM Field Settings
The bottom left shows the Fields grid and the Upper and Lower schedule section name fields. The Fields grid lists the Revit fields that are defined for the selected Revit schedule. Revit formula fields can’t be used by generic BOM and therefore, will not be listed (this is a Revit limitation not an Plugin limitation). The Fields grid also specifies the setting for the generic BOM. We will cover the various settings in the next section. The Upper and Lower section name fields allow the user to name the BOM sections.
Right Side Example Grids
The right side grids show the results of the setting that are applied in the Fields grid.
Fields Setup The following setting can be applied to fields in the schedule. To change these values in the grid, click the appropriate cell.
• Heading Override o The user can specify a different name for the column than what is specified in
the Revit schedule. • Group By
o The BOM Plugin provides a grouping mechanism where like items in the schedule, can be grouped together and totals shown inline (or at the bottom of the group). See the Group By section below.
• Include In o Sometimes a field in the Revit schedule doesn’t add any value to the BOM
schedule. This setting allows the field to be either included or removed from both BOM sections or included in just one section schedule.
o If the field is removed from both Upper and Lower sections, the field is removed from both sections. If the field is included in only one section, then it will be included in both sections (but will only have values for the enabled section).
• Inline Sum o Inline Sums are enabled for numeric fields. o If there are groups defined, enabling the Inline Sum, causes the last group to
collapse to a single row. The Inline Sum then sums the field for all rows in the

2300 McDermott Road Su i te 200 -‐235 214.301.0000 Business Confident ia l ©HingePoint
P lano Texas 75025
group and shows the result in the cell. See the Group By section below for details.
• Include Subtotals o Enables Subtotals for grouped data. The subtotals are placed below the group.
Group By The Group By feature is a powerful Excel-‐like feature that allows drawing data to be grouped together. By enabling Subtotals and Inline Sums, items in the drawing can be easily grouped together and counted.
Using an example drawing, the next few screen shots will start with an un-‐configured BOM schedule, and demonstrate the steps to get totals.
The example drawing is a 3-‐story storage building containing rentable units. The goal of the BOM schedule is to get a summary of the Units Types by floor. The Upper schedule will show a Summary of the Units Types by Level using Subtotals and Inline Sums. The Lower schedule will show a detail of the Unit Types by Level but not using Inline Sums. This action will provide a Detail view into the groupings.
Figure 3 shows the Revit Schedule that will used to create the BOM schedule.
The Revit schedule has 6 fields defined.
• The Name of the Unit (in this case just the size of the unit). • Revit’s Count field. • Revit’s Area field. • The Unit Type (climate controlled or not). • Unit Access. • Level (what floor the unit is on).

2300 McDermott Road Su i te 200 -‐235 214.301.0000 Business Confident ia l ©HingePoint
P lano Texas 75025
Figure 3
Without any configuration, the Upper Lower sections show a schedule listing very similar to the one provided by Revit.
To create the Level group, click the Group By cell for the Level row and change it to Upper & Lower. Also, change the Inline Sum setting for the Area field to Upper. See Figure 4.

2300 McDermott Road Su i te 200 -‐235 214.301.0000 Business Confident ia l ©HingePoint
P lano Texas 75025
Figure 4
Now with just the Level field grouped and the Inline Sum set for the Area field. The Upper section shows an Inline Sum of the Area field, for each floor. With just this group specified, the Name and Unit Access fields show the first value that was found for those fields and don’t make sense. The Lower section shows all of the units grouped by Level.
Next the Unit Type grouping is added to the schedule and Subtotals are added for the Count and Area fields. See Figure 5.
Figure 5
With the Level and Unit Type fields grouped, the Upper schedule shows Unit Counts and Area totaled by Level and Unit Type. The Lower schedule shows all of the units grouped by Level, then Unit Type. Subtotals are placed below each group.
The final group that will be used for the BOM schedule is for the Name field. The Unit Access field is also excluded from the Upper schedule and the Name field is overridden to be Unit Size. The Upper and Lower Schedule Name are updated.
See figure 6.

2300 McDermott Road Su i te 200 -‐235 214.301.0000 Business Confident ia l ©HingePoint
P lano Texas 75025
Figure 6
Now the BOM schedule provides a count and total area for each Size of Unit, Unit Type and Level for the Storage Building.
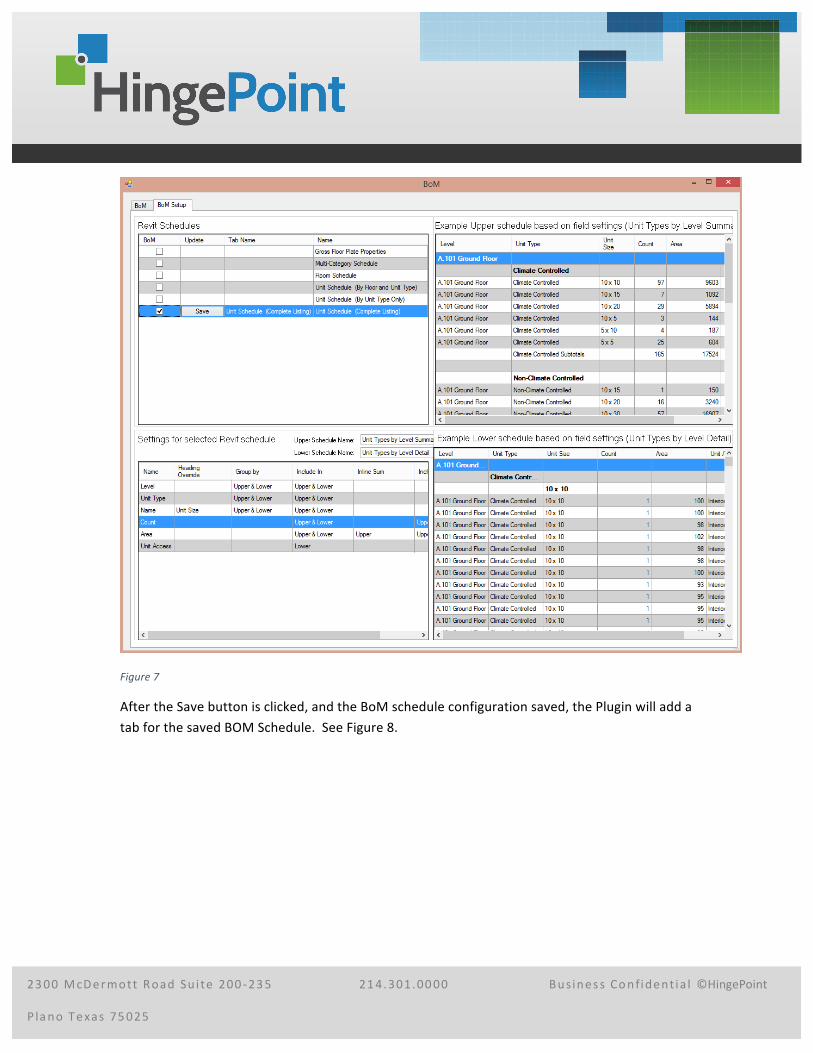
In order for the settings, for the BoM schedule, to be saved to the Drawing, the BOM checkbox in the Revit Schedules grid must be checked. After the checkbox is checked, the Tab Name will default to the Revit schedule Name and the save button is activated. See figure 7.
2300 McDermott Road Su i te 200 -‐235 214.301.0000 Business Confident ia l ©HingePoint
P lano Texas 75025
Figure 7
After the Save button is clicked, and the BoM schedule configuration saved, the Plugin will add a tab for the saved BOM Schedule. See Figure 8.

2300 McDermott Road Su i te 200 -‐235 214.301.0000 Business Confident ia l ©HingePoint
P lano Texas 75025
Figure 8
After the Save button is clicked, the BOM schedule configuration is saved to the drawing. To save the configuration to disk, the Revit file must be saved.
Excel Report The BOM tab will create an Excel document for the configured BOM schedules. Each BOM schedule will be on it’s own sheet. The Excel document is saved in the same folder as the Revit drawing. The Excel file will have the same name as the Revit drawing with “.BOM” added to the end of the file name. See Figure 9. The Tab will also show the time that the Excel file was created. You can open the Excel file by clicking on the Open BOM file link. The document is not automatically refreshed when BOM schedules change or if the Revit schedule data changes. To refresh the document, click the Refresh button.

2300 McDermott Road Su i te 200 -‐235 214.301.0000 Business Confident ia l ©HingePoint
P lano Texas 75025
See Figure 10 for a screen shot of the Excel document for the BOM schedule. The BOM’s Upper section will be at the top of the sheet with the Lower section below.
Figure 9

2300 McDermott Road Su i te 200 -‐235 214.301.0000 Business Confident ia l ©HingePoint
P lano Texas 75025
Figure 10

2300 McDermott Road Su i te 200 -‐235 214.301.0000 Business Confident ia l ©HingePoint
P lano Texas 75025
Next Steps
Thank you from the HingePoint team for trying our product. Please send us your feedback at: [email protected]
Still Need Help? Contact us for additional BOM Services
HingePoint can assist you team with the following:
1. Custom training sessions and workshops catered to your business and Revit data and the getting the best BOM Reports possible
2. Customizations of the Plugin directly for your business and requirements 3. Bulk discount orders if you are buying the App in bundles of 5, 25 or 100 licenses for
your offices and teams