useful life of transit buses and vans final report
TRANSCRIPT

Useful Life of Transit Buses and Vans Final Report
Project VA-26-7229
Federal Transit Administration
US Department of Transportation Federal Transit Administration
Federal Transit Administration
Useful Life of Transit Buses and Vans Report No FTA VA-26-7229-071
April 2007
Useful Life of Transit Buses and Vans Final Report
REPORT DOCUMENTATION PAGE Form Approved OMB No 0704-0188
Public reporting burden for this collection of information is estimated to average 1 hour per response including the time for reviewing instructions searching existing data sources gathering and maintaining the data needed and completing and reviewing the collection of information Send comments regarding this burden estimate or any other aspect of this collection of information including suggestions for reducing this burden to Washington Headquarters Services Directorate for Information Operations and Reports 1215 Jefferson Davis Highway Suite 1204 Arlington VA 22202-4302 and to the Office of Management and Budget Paperwork Reduction Project (0704-0188) Washington DC 20503 1 AGENCY USE ONLY (Leave blank) 2 REPORT DATE
April 2007 3 REPORT TYPE AND DATES COVERED
Final Report 4 TITLE AND SUBTITLE Useful Life of Transit Buses and Vans
5 FUNDING NUMBERS
6 AUTHOR(S) Richard Laver Donald Schneck Douglas Skorupski Stephen Brady Laura Cham
Booz Allen Hamilton
7 PERFORMING ORGANIZATION NAME(S) AND ADDRESS(ES) Booz Allen Hamilton Inc 8283 Greensboro Drive McLean Virginia 22102
8 PERFORMING ORGANIZATION REPORT NUMBER
FTA
9 SPONSORINGMONITORING AGENCY NAME(S) AND ADDRESS(ES) Federal Transit Administration US Department of Transportation Washington DC 20590
10 SPONSORING MONITORING AGENCY REPORT NUMBER
FTA-VA-26-7229-071
11 SUPPLEMENTARY NOTE Online at [httpwwwftadotgov]
12a DISTRIBUTIONAVAILABILITY STATEMENT Available From National Technical Information ServiceNTIS Springfield Virginia 22161 Phone (703) 605-6000 Fax (703) 605-6900 Email [ordersntisfedworldgov]
12b DISTRIBUTION CODE
13 ABSTRACT (Maximum 200 words) The Federal Transit Administration (FTA) sponsored this research to assess both the appropriateness of its existing minimum service-life policy for transit buses and vans and the need to change that policy The research evaluated the federal minimum service-life requirements based upon the actual experience of both transit operators and vehicle manufacturers The analyses in this research provide the transit industry and the FTA with a better understanding of (1) the current useful life of transit buses and vans (2) the appropriateness of FTArsquos minimum service-life policy and (3) the policyrsquos impact on transit vehicle life expectancies and vehicle retirement decisions at the agency level Actual ages of buses retired from service generally exceed FTA minimums Transit agencies interviewed cited availability of capital funds for bus replacement as the primary determinant of retirement age 14 SUBJECT TERMS Transit Bus Van Useful Life Engineering Analysis Economic Analysis FTA Bus and Van Minimum Service-Life Policy Transit Fleet Retirement Age
15 NUMBER OF PAGES 195
16 PRICE CODE
17 SECURITY CLASSIFICATION OF REPORT Unclassified
18 SECURITY CLASSIFICATION OF THIS PAGE Unclassified
19 SECURITY CLASSIFICATION OF ABSTRACT Unclassified
20 LIMITATION OF ABSTRACT
NSN 7540-01-280-5500 Standard Form 298 (Rev 2-89) Prescribed by ANSI Std 239-18298-102
Federal Transit Administration
Useful Life of Transit Buses and Vans Final Report
NOTICE
This document is disseminated under the sponsorship of the United States Department of Transportation in the interest of information exchange The United States Government assumes no liability for its contents or use thereof
The United States Government does not endorse products or manufacturers Trade or manufacturersrsquo names appear herein solely because they are considered essential to the objective of this report
Federal Transit Administration
Useful Life of Transit Buses and Vans Final Report
FOREWORD
The Federal Transit Administration (FTA) sponsored this research to assess both the appropriateness of its existing minimum service-life policy for transit buses and vans and the need to change that policy The research evaluated the federal minimum service-life requirements based upon the actual experience of both transit operators and vehicle manufacturers The analyses in this research provide the transit industry and the FTA with a better understanding of (1) the current useful life of transit buses and vans (2) the appropriateness of FTArsquos minimum service-life policy and (3) the policyrsquos impact on transit vehicle life expectancies and vehicle retirement decisions at the agency level Actual ages of buses retired from service generally exceed FTA minimums Transit agencies interviewed cited availability of capital funds for bus replacement as the primary determinant of retirement age
Author Acknowledgements
This report was authored by Richard Laver Donald Schneck Douglas Skorupski Stephen Brady Laura Cham and Jeff Rankin of Booz Allen Hamilton Valuable insight and direction was provided by Henry Nejako John Bell and Nancy Ody of the FTA In addition the authors would like to thank the staff of those transit operators and vehicle manufacturers who graciously provided their time and input to this study and without whom the study would not have been possible
Federal Transit Administration
Useful Life of Transit Buses and Vans Final Report Table of Contents
Table of Contents
EXECUTIVE SUMMARY IV
Study Goals and Objectives iv Approach v Key Findings vi Recommendations xiii
CHAPTER 1 INTRODUCTION 1
Background 1 Study Objectives 2 Reasons for Reviewing the Service-Life Policy 3 What is Useful Life 4 Project Approach 8
CHAPTER 2 FTA SERVICE-LIFE CATEGORIES 10
Service-Life Category Descriptions 10 Implications for the Current Service-Life Categories 19
CHAPTER 3 LEGISLATION AND PROCUREMENT 23
FTA Service-Life Circulars and Regulations 23 Procurement Methods and Guidelines 25 Conclusions Impact of Regulations and Procurement Practices 26
CHAPTER 4 AVERAGE RETIREMENT AGES 27
Analysis of Actual Fleet Retirement Ages Using NTD Vehicle Data 27 Assessment of Existing Bus Type Categories Based on NTD Analysis 35
CHAPTER 5 INDUSTRY OUTREACH 37
Transit Agency Participants 37 Agency Interview Guide Responses 38 Vehicle Manufacturer Response 51 Private Operators Response 56
CHAPTER 6 ENGINEERING ANALYSIS 60
Transit Agency Participants ndash Follow-Up Interviews 60 Useful Life of Transit Vehicle Chassis and Components 61 Vehicle Structure ndash A Second Look 70
Federal Transit Administration i
Useful Life of Transit Buses and Vans Final Report Table of Contents
Bus Durability and New Technologies 74 Life-Extending Practices 76 Vehicle Emissions 76 Vehicle Reliability 77 National Bus Condition Assessment 78
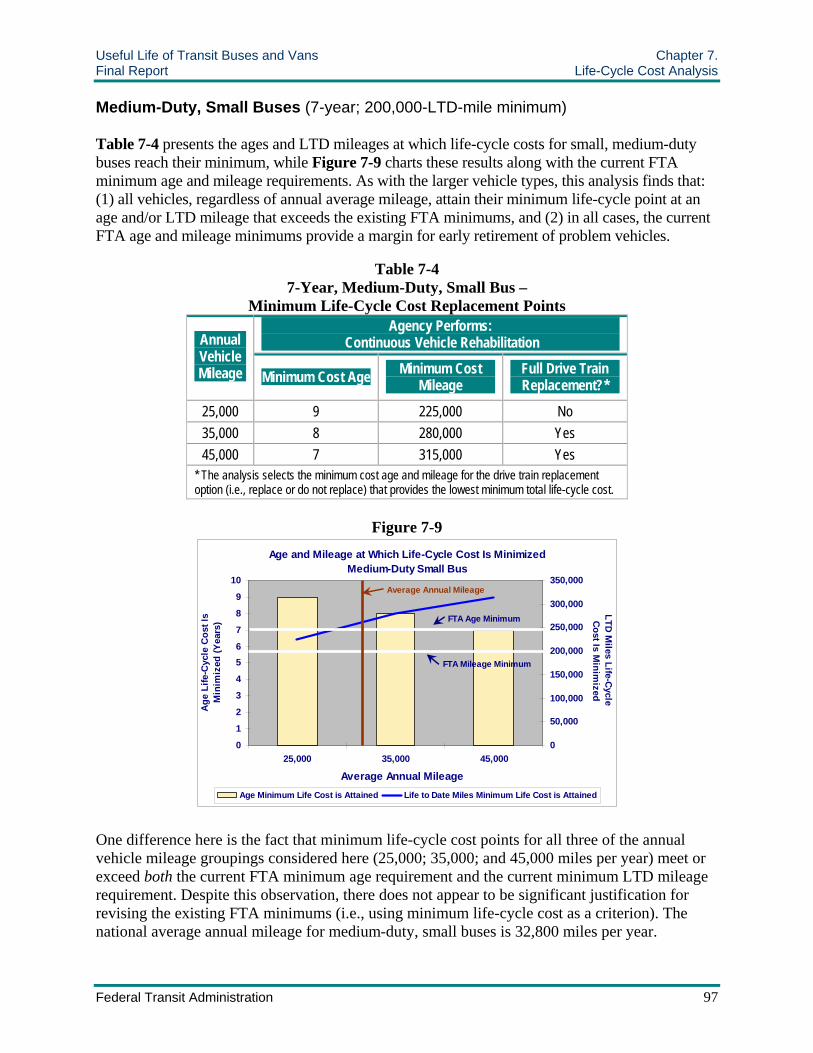
CHAPTER 7 LIFE-CYCLE COST ANALYSIS 86
Data Sources and Caveats 86 Key Determinants of Life-Cycle Costs 86 Life-Cycle Cost Analysis 89 Other Bus and Van Types 94 Life-Cycle Cost Analyses of Changes to FTArsquos Service-life Policy 100 Vehicle Physical Condition versus Minimum Cost Retirement Age 104 Vehicle Age Service Reliability and Ridership 106
CHAPTER 8 PRIOR BUS USEFUL-LIFE REVIEWS 110
Initial Policy Statement ndash FTA Circular 90301 110 1985 Inspector General Statement 110 1988 Useful Life of Transit Vehicles Study 110 1988 Transit Capital Investment to Reduce Operating Deficits ndash Alternative Bus Replacement Strategies Study 111 1995 Bus Industry Summit 111 1997 Useful Life of Heavy-Duty Transit Buses Study 112 Other Studies 113 Comparisons of Past Studies with This Report 114 Other Considerations 115
CHAPTER 9 KEY FINDINGS AND RECOMMENDATIONS 118
Key Findings 118 Recommendations 121
BIBLIOGRAPHY 124
APPENDIX A SUMMARY OF TRANSIT AGENCY SURVEY 128
APPENDIX B SUMMARY OF VEHICLE MANUFACTURER SURVEY 143
APPENDIX C ENGINEERING INTERVIEWS 147
APPENDIX D MINIMUM LIFE-CYCLE COST METHODOLOGY 153
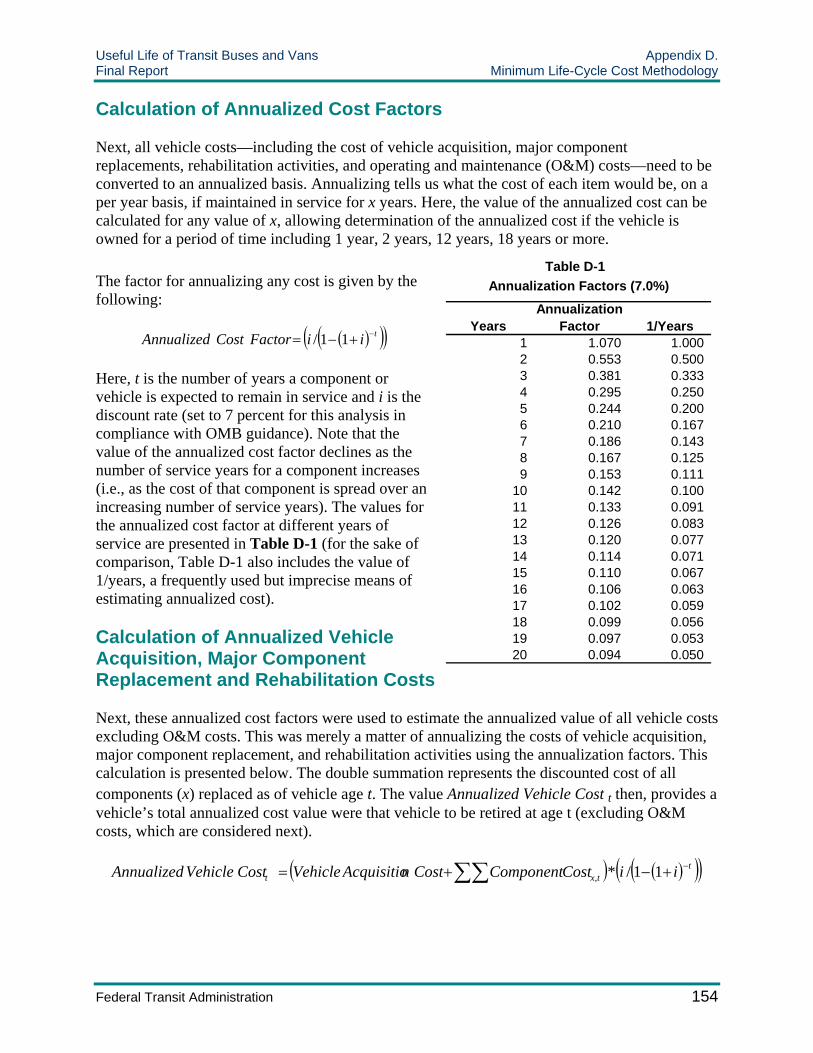
Conversion of Participant Life-Cycle Costs to Reflect Differences in Annual Mileage 153 Calculation of Annualized Cost Factors 154
Federal Transit Administration ii
Useful Life of Transit Buses and Vans Final Report Table of Contents
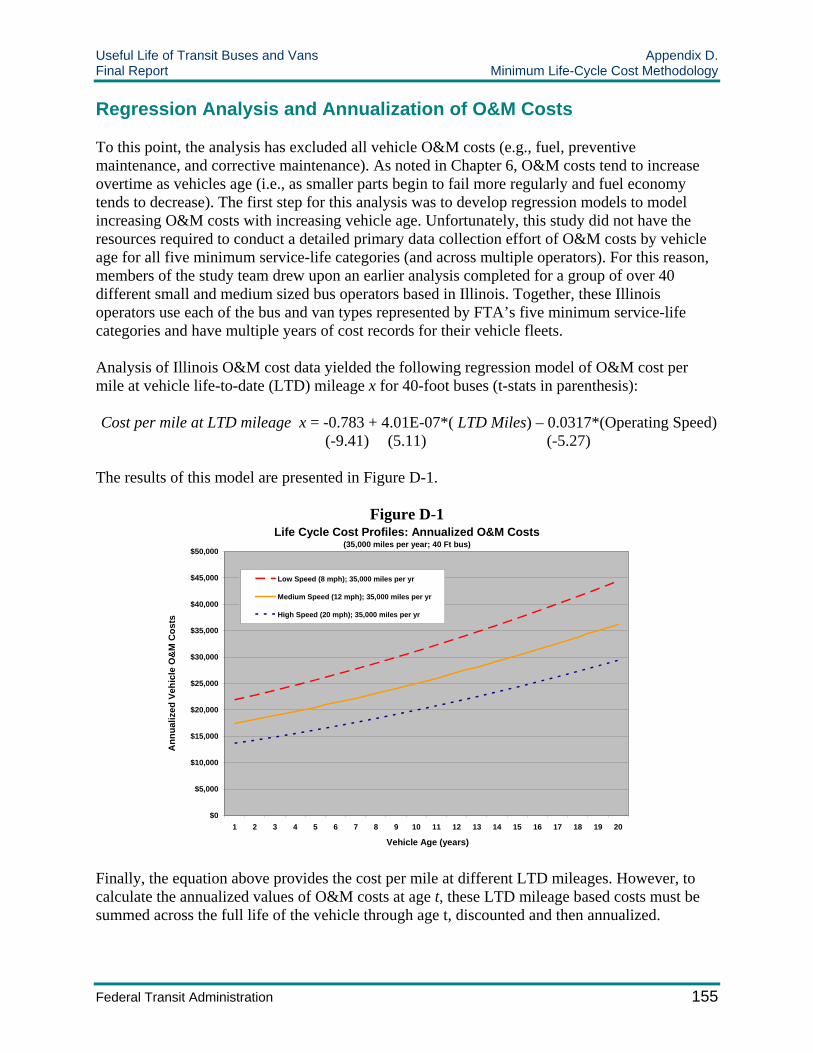
Calculation of Annualized Vehicle Acquisition Major Component Replacement and Rehabilitation Costs 154 Regression Analysis and Annualization of OampM Costs 155 Calculation of Total Annualized Costs 156
APPENDIX E HEAVY-DUTY VEHICLE LIFE-CYCLE COST ANALYSIS 157
Heavy Duty Vehicle Life-Cycle Cost Analysis 157 Summary Minimum Life-Cycle Cost Values and Ages 171
APPENDIX F AGENCY SUPPLIED LIFE-CYCLE COST DATA 174
METRICENGLISH CONVERSION FACTORS 181
Federal Transit Administration iii
Useful Life of Transit Buses and Vans Final Report Executive Summary
EXECUTIVE SUMMARY
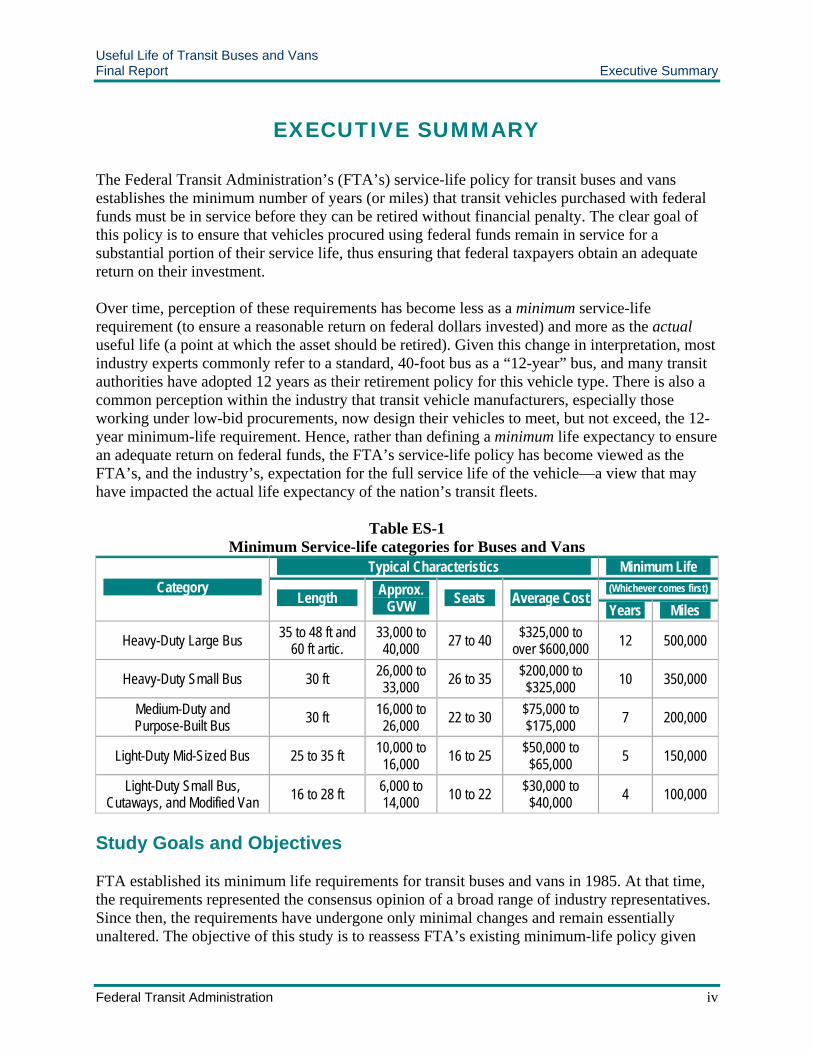
The Federal Transit Administrationrsquos (FTArsquos) service-life policy for transit buses and vans establishes the minimum number of years (or miles) that transit vehicles purchased with federal funds must be in service before they can be retired without financial penalty The clear goal of this policy is to ensure that vehicles procured using federal funds remain in service for a substantial portion of their service life thus ensuring that federal taxpayers obtain an adequate return on their investment
Over time perception of these requirements has become less as a minimum service-life requirement (to ensure a reasonable return on federal dollars invested) and more as the actual useful life (a point at which the asset should be retired) Given this change in interpretation most industry experts commonly refer to a standard 40-foot bus as a ldquo12-yearrdquo bus and many transit authorities have adopted 12 years as their retirement policy for this vehicle type There is also a common perception within the industry that transit vehicle manufacturers especially those working under low-bid procurements now design their vehicles to meet but not exceed the 12shyyear minimum-life requirement Hence rather than defining a minimum life expectancy to ensure an adequate return on federal funds the FTArsquos service-life policy has become viewed as the FTArsquos and the industryrsquos expectation for the full service life of the vehiclemdasha view that may have impacted the actual life expectancy of the nationrsquos transit fleets
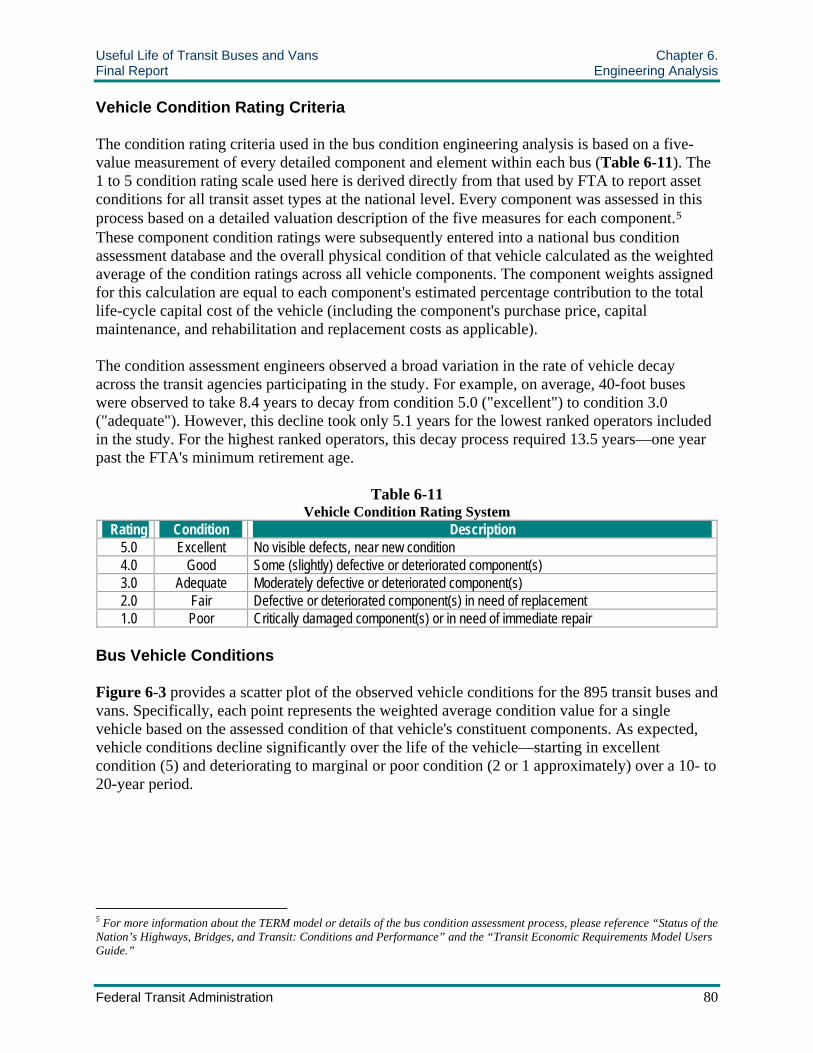
Table ES-1 Minimum Service-life categories for Buses and Vans
Category Typical Characteristics Minimum Life
Length ApproxGVW Seats Average Cost
(Whichever comes first)
Years Miles
Heavy-Duty Large Bus 35 to 48 ft and 60 ft artic
33000 to 40000 27 to 40 $325000 to
over $600000 12 500000
Heavy-Duty Small Bus 30 ft 26000 to 33000 26 to 35 $200000 to
$325000 10 350000
Medium-Duty and Purpose-Built Bus 30 ft 16000 to
26000 22 to 30 $75000 to $175000 7 200000
Light-Duty Mid-Sized Bus 25 to 35 ft 10000 to 16000 16 to 25 $50000 to
$65000 5 150000
Light-Duty Small Bus Cutaways and Modified Van 16 to 28 ft 6000 to
14000 10 to 22 $30000 to $40000 4 100000
Study Goals and Objectives
FTA established its minimum life requirements for transit buses and vans in 1985 At that time the requirements represented the consensus opinion of a broad range of industry representatives Since then the requirements have undergone only minimal changes and remain essentially unaltered The objective of this study is to reassess FTArsquos existing minimum-life policy given
Federal Transit Administration iv
Useful Life of Transit Buses and Vans Final Report Executive Summary
the actual experiences of both transit operators and vehicle manufacturers Key questions to be addressed by this review include
bull What are the actual ages (and mileages) at which operators are retiring their transit buses and vans and how do those ages compare to the FTA minimums
bull Do the current minimum age and mileage requirements meet the needs of all agency types
bull How do FTArsquos current retirement minimums affect the purchase and retirement decisions of the nationrsquos operators
bull How have changes in vehicle designs (eg low floor) and technologies (eg alternative fuels) affected the expected vehicle life
bull Should FTA consider changing the current minimums given the experience of the nationrsquos transit operators and manufacturers
This study seeks to provide answers to each of these questions with the ultimate objective of assessing both the appropriateness of FTArsquos existing minimum service life policy for transit buses and vans and any potential need to change that policy
Approach
To meet the needs of the study the study team completed the following eight independent analyses Each of these analyses aimed to provide a different perspective on (1) the current useful life of transit buses and vans (2) the appropriateness of FTArsquos minimum life policy and (3) the policyrsquos impact on transit vehicle life expectancies and vehicle retirement decisions at the agency level
bull Review of FTArsquos Current Service-life Categories The study reviewed the definitions and the characteristics of the vehicles found in each of the five existing service-life categories The objectives were to determine the appropriateness of the categories based on the similarities and dissimilarities of the vehicle types found in each category and to conduct a market analysis for each category (ie annual vehicle sales and transitrsquos share of those sales)
bull Review of Procurement Regulations with Potential Service-life Implications The study reviewed federal legislation and circulars to identify federal requirements potentially affecting either the useful life or vehicle retirement decisions of the nationrsquos operators of transit buses and vans This review included FTArsquos bus testing regulations the Americans with Disabilities Act (ADA) Buy America requirements the Standard Bus Procurement Guidelines and the Clean Air Act and its Amendments
bull Analysis of Actual Retirement Ages The study used National Transit Database (NTD) data to determine the actual ages at which US agencies are currently retiring each of the transit bus and van types This analysis was then used to compare the average retirement ages with the minimum FTA age requirements for each vehicle category to determine how these minimums may be impacting local operatorrsquos vehicle retirement decisions
bull Industry Outreach The study team conducted two sets of interviews with bus fleet managers vehicle engineers and procurement personnel from a sample of the nationrsquos large medium and small-sized bus and van operators The first set of interviews documented
Federal Transit Administration v
Useful Life of Transit Buses and Vans Final Report Executive Summary
industry concerns with the existing service-life policy and elicited suggestions on how or if that policy should be changed A second set of follow-up interviews focused on engineering specific issues such as the impact of new vehicle designs on expected vehicle life
bull Market Analysis Most transit bus and van components and many of the vehicles themselves are derived from the general truck and automotive market Market analysis provides a perspective on transitrsquos role and position within the broader truck and automotive market with emphasis on where transit has the ability to influence component and overall vehicle life expectancy
bull Engineering Analysis The engineering analysis examines the life expectancy of individual vehicle components and of the vehicle as a whole (ie the factors that determine overall vehicle useful life) This analysis then considers the appropriateness of the minimum life requirements for each vehicle category given the useful-life characteristics of each vehiclersquos component parts
bull Economic Analysis This analysis identifies that point in the life cycle of each bus and van type at which total life-cycle costs are minimized This point provides a financially logical age (mileage) at which to retire that vehicle The identified minimum cost replacement ages are then placed in context with the results of the engineering analysis The combination of these two perspectives helps illustrate factors that drive granteesrsquo vehicle retirement decisions
bull Review of Prior Useful-Life Studies The study reviewed prior useful-life studies completed by FTA and the American Public Transportation Association (APTA) with the objective of working to obtain more current answers to the same questions and to compare and contrast the findings of this study with those of prior efforts
Key Findings
Each of the eight independent analyses yielded insights into the useful life of transit buses and vans and FTArsquos minimum service-life policy Key findings from each of the various analyses performed for this study are outlined below
Review of FTArsquos Current Service-Life Categories
The review of FTArsquos minimum service-life requirements yielded the following key findings
bull Transit bus and van fleets are dominated by 12-year and 4-year vehicles Of the roughly 91000 transit buses and vans currently in service at US transit operators more than 70000 (about 78 percent) are 12-year vehicles about 16500 (18 percent) are 4-year vehicles and the remaining 5 percent are divided between the 10-year 7-year and 5-year vehicle categories
bull The current service-life category groupings are appropriate A key study objective was to assess the appropriateness of the existing service-life categories (ie whether these categories ldquomake senserdquo) The study found that the categories represent logical groupings of vehicles having broadly similar characteristics in terms of construction methods size weight passenger capacities cost manufacturers and customer bases (see Table ES-1 above) A possible exception here is with 4-year and 5-year vehicles built using cutaway chassis where
Federal Transit Administration vi
Useful Life of Transit Buses and Vans Final Report Executive Summary
there is a significant degree of overlap between the two age categories in terms of construction type sizes and manufacturers However the similarities are not adequate grounds for combining the two into a single ldquo4-to-5-yearrdquo vehicle category
bull The transit industry has little ability to alter bus and van useful-life characteristics cost-effectively Nearly half of the vehicle components for 12-year buses and most components for all other vehicle categories (including the vehicles themselves) are obtained from either the heavy-truck or automotive markets Given its small share of these markets (typically less than one percent) the transit industry has little ability to influence component useful-life characteristics in a cost-effective manner A key exception here is the structure of 12-year buses To the extent that 12-year bus structures are designed specifically for transit use the transit industry has some leverage to influence this componentrsquos design and durability characteristics (However given the manufacturersrsquo small annual order sizes and tight local agency capital budgets funding such innovation is challenging in practice) For most other components and vehicle types (eg minivans and cutaway chassis) the transit industry cannot significantly alter the useful-life characteristics without incurring the cost of customizing mass-produced items to meet transit-specific needs
Review of Procurement Regulations with Potential Useful-Life Implications
While many federal regulations (eg Buy America Bus Testing ADA Environmental Protection Agency) and industry procurement practices (third-party contracting) are believed to have potential useful-life implications these implications are generally considered to be minor relative to the issues of annual mileage new vehicle designs changing life-cycle economics and other drivers of useful life A key exception here is the low-bid procurement process which can yield vehicles with lower quality structures leading to reduced longevity To protect against this outcome agencies need to establish firm structural component requirements during the pre-bid stage to ensure the minimum-life requirements are attained
Analysis of Actual Retirement Ages
The study used NTD data to determine how recent actual retirement ages for transit buses and vans compare with the FTArsquos current minimum service requirements for transit buses and vans and whether these requirements affect the vehicle retirement decisions of the nationrsquos transit operators Table ES-2 summarizes this analysis
Table ES-2 Minimum versus Average Retirement Age by Vehicle Category
Vehicle Category Minimum Retirement
Age Average Retirement
Age (Years) Share of Active Vehicles That Are
One or more years past the retirement minimum
Three or more years past the retirement minimum
12-Year Bus 151 19 9 10-Year Bus 7 4 7-Year Bus 82 12 3
5-Year BusVan 59 23 5 4-Year Van 56 29 10
Average retirement age estimates for this vehicle category suffers from small sample issues
Federal Transit Administration vii
Useful Life of Transit Buses and Vans Final Report Executive Summary
The analysis yielded the following key findings
bull Most buses and vans are retired well after minimum service-age requirement is satisfied With one exception Table ES-2 shows that on average transit buses and vans are retired between one to three years after their minimum service-life requirement has been satisfied The exception is the 10-year bus category where small sample issues prevented determination of a reliable average retirement age value (hence it remains unclear how far past the minimum service-life requirement this vehicle type is typically retired) In addition Table ES-2 demonstrates that a significant proportion of buses and vans remain in service at least one year past the retirement minimum (eg 20 percent of heavy-duty 12-year buses) with many still in service three or more years past the minimum requirement (eg one in 10 ldquo12-yearrdquo buses in active service are age 15 or older)
bull Minimum service age does not constrain agenciesrsquo vehicle retirement decisions Based on this and other analyses conducted using NTD data it is clear that relatively few transit buses and vans are retired right at the minimum service age requirement Thus the current retirement minimums are not constraining the vehicle retirement decisions of the vast majority of the nationrsquos bus and van operators (a finding confirmed in the agency interviews described below) Given this observation it is also clear that any reduction to the current minimum-age requirements (eg from 12 to 10 years for a ldquo12-year busrdquo) would not result in any significant increase in the rates of retirement for the five service-life categories
Industry Outreach
The included interviews of representatives of local transit operators vehicle manufacturers and private bus fleet operators to assess their current experiences with bus and van useful life as well as FTArsquos minimum service-life requirements Questions covered areas such as vehicle replacement decisions alternatives to the current FTA policies maintenance practices and the impacts on service quality The following are key findings from this industry outreach process
bull Most agencies have vehicle service-life policies All nine of the agencies completing the detailed interviews reported having either a service-life policy or a planned retirement age for heavy-duty 12-year buses For four of the agencies the planned retirement age exceeds the FTA minimum of 12 years (with the Los Angeles County Metropolitan Transportation Authority at 13 years the Washington Metropolitan Area Transit Authority and Jefferson Transit at 15 years and the Toronto Transit Commission at 18 years)
bull Actual retirement ages generally exceed both FTA minimums and agency service-life policies The actual timing of vehicle retirement for all nine agencies typically occurs between one to four years after the FTA minimum has been reached (but can occur as late as vehicle age 20) Moreover for most agencies the recent actual retirement ages also exceed the planned or policy retirement ages Given these observations it is clear that FTArsquos current minimum service-life requirement for heavy-duty buses does not actively constrain the agenciesrsquo retirement decisions (as retirements occur after the minimum retirement age has been reached) None of the agencies reported having to take advantage of FTArsquos ldquolike-kind exchangerdquo provision permitting early retirement of specific vehicles
bull Capital funding availability is the primary determinant of retirement age Limited capital funding was cited as the primary reason that the timing of actual vehicle retirements
Federal Transit Administration viii
Useful Life of Transit Buses and Vans Final Report Executive Summary
has exceeded the plannedpolicy retirement age (and FTA service minimums) by all but one of the responding agencies Because of this the average fleet age is more likely to be impacted by the increased availability of federal funding than by any relaxation in the minimum service-life requirements Other decision factors included service reliability vehicle condition vehicle maintenance physical and local environmental conditions (salt intrusion) procurement process (low bid or negotiated) and duty cycle (mainly operating speed)
bull Only large agencies operating in ldquosevererdquo urban environments perform scheduled mid-life overhauls Only the larger urbanized agencies interviewed (Massachusetts Bay Transportation Authority New York City Transit Toronto Transit Commission and Washington Metropolitan Area Transit Authority) perform comprehensive ldquomid-liferdquo overhauls of their heavy-duty cycle vehicles stating that these overhauls are required to obtain service lives of 12 years or more given the tough service environments in which they operate In contrast none of the other agencies interviewed (including Los Angeles County Metropolitan Transportation Authority and Houston Metro) regularly complete a mid-life overhaul with most suggesting it is not cost effective for them
bull Most agencies have needed to retire vehicles early Most of the agencies have had to retire vehicles prior to their scheduled or desired retirement age The causes of these early retirements range from unexpected declines in vehicle condition high maintenance costs equipment upgrades or damage beyond repair Most agencies would support the introduction of a policy variance for particularly troublesome procurements but were equally concerned about how FTA could control the review and approval process
bull Most agencies have not been impacted by FTArsquos service-life requirements Most interviewed agencies stated that their vehicle retirement decisions are not significantly impacted by FTArsquos service-life minimums (the decisions are constrained more by capital funding availability) The agencies did suggest that more category options may be advantageous in the future to reflect differences in expected vehicle life as new vehicle designs and technologies are introduced (eg for bus rapid transit)
bull Extending the service-life requirements would hurt many agencies Conversely most (if not all) of the agencies reported that they would be negatively impacted if current FTA service-life minimums were extended These negative impacts include a decrease in service quality (eg higher failures rate vehicle aesthetic and reliability) an increase in maintenance costs (between 10 to 50 percent higher) and less leeway to retire ldquoproblemrdquo vehicles
bull Agencies support development of a ldquolemon lawrdquo and a technology demonstration option Interview respondents supported development of a ldquolemon lawrdquo and a technology demonstration option The lemon law concept would permit early retirement of problem vehicles without penalty to the agency All respondents agreed that this provision would need to clearly specify the conditions under which vehicles could be retired early andor define a clear FTA process for evaluating whether a vehicle is in fact a ldquolemonrdquo Under the technology demonstration concept a grantee could request a similar release from the service-life policy for FTA-approved tests of new vehicle technologies that would allow the agency to discontinue operation of the vehicle if the technology proved too problematic FTA could
Federal Transit Administration ix
Useful Life of Transit Buses and Vans Final Report Executive Summary
approve this on a selective basis through documentation of the demonstration results and industry dissemination
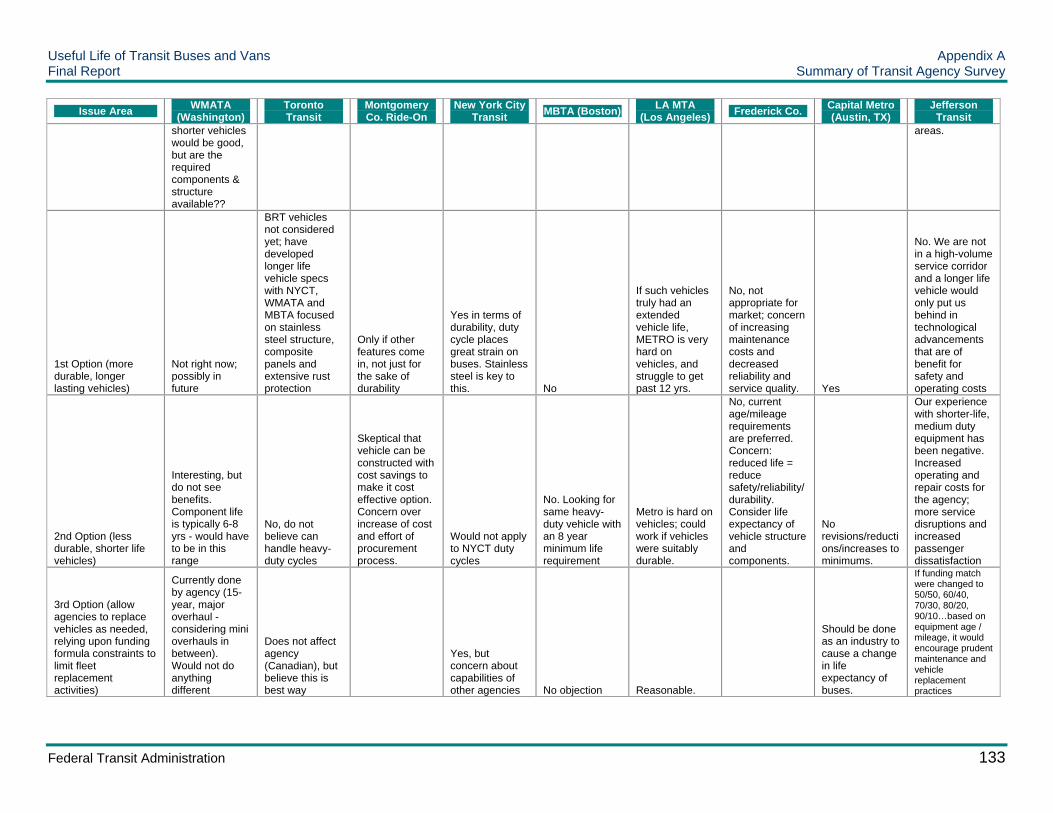
bull Most agencies are not interested in more or less durable heavy-duty vehicles Interview respondents were asked to consider their agencyrsquos interest in heavy-duty vehicles with longer shorter or other service-life characteristics They responded as follows
ndash More Durable (Longer Life) Heavy-Duty Vehicles Most agencies indicated that they were not interested in a more durable vehicle (ie with a more expensive heavier weight longer life expectancy structure) This is due to concerns over the cost effectiveness weight and rider comfort for this option Some agencies stated a more durable vehicle type might be considered if its components were equally durable
ndash Less Durable (Shorter Life) Heavy-Duty Vehicles All nine agencies expressed significant concerns with a less durable vehicle (ie with a cheaper lighter weight lower life expectancy structure) Concerns involved the vehiclersquos anticipated inability to survive the required duty cycles relationship with the expected life of components and decreased quality and the increase in procurement efforts
ndash Agency-Determined Retirement Age None of the agencies objected to the alternative option of allowing agencies to use their own judgment in determining vehicle retirement ages (ie drop all minimum life requirements and rely on funding constraints to ensure vehicles are retained for reasonable service lives) Based on the current actual retirement ages of the nine agencies few agency vehicles would be retired before the current FTArsquos current minimums (due to funding constraints)
Engineering Analysis
The engineering analysis provides further evaluation of bus useful life from a vehicle engineering perspective The following are key findings
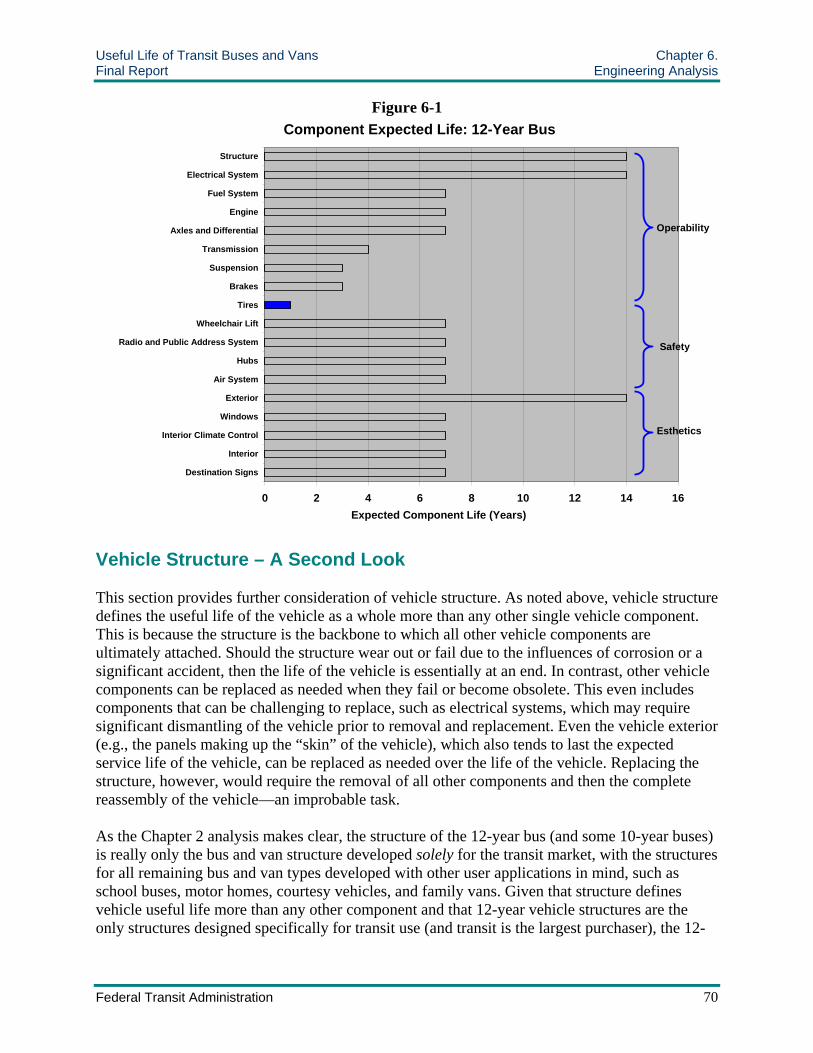
bull Useful life is ultimately determined by the life of the vehicle structure Relatively few vehicle components typically last the full ldquoservice liferdquo of the vehicle For 12-year vehicles this includes the structure exterior and electrical system (see Figure ES-1) Vehicle structure as a whole defines the useful life of the vehicle more than any other single vehicle component The reason being that the structure is the backbone to which all other vehicle components are ultimately attached If the structure wears out or fails due to corrosion or a collision then the life of the vehicle is essentially at an end
bull Service environment is a key determinant of structure useful life In addition to vehicle age and service miles many interview participants clearly indicated that service environment is a key determinate of structure (and hence vehicle) useful life Vehicle structures that endure high passenger loads or operate in more severe service environments (eg rough urban roads) wear out faster Because of this several agencies expressed a desire for FTA to revise the service-life requirements definition to include service environment severity along with service years and miles (eg 12 years or 500000 miles) This desire was also identified in prior reviews of bus service life including the 1995 Bus Industry Summit
Federal Transit Administration x
Useful Life of Transit Buses and Vans Final Report Executive Summary
Figure ES-1 Component Expected Life 12-Year Bus
Structure
Electrical System
Suspension
Fuel System
Engine
Axles and Differential
Wheels and Tires
Transmission
Brakes
Wheelchair Lift
Radio and Public Address System
Hubs
Fare Collection Device
Air System
Body
Windows
Interior Climate Control
Interior
Destination Signs
Operability
Safety
Esthetics
0 2 4 6 8 10 12 14 16 Expected Component Life (Years)
bull ldquoStick busrdquo and low-floor vehicles may have a shorter useful life Interview participants suggested that stick bus (structures constructed using hundreds of welded tubes) and low-floor designs (which use stick construction) may have a shorter useful life as compared to traditional designs With the stick bus the thousands of welds that hold the structure together are more subject to corrosion and fatiguemdashan issue that manufacturers have largely addressed using corrosion-resistant coatings stainless steel and design strengthening Interview participants stated that it is too early to determine whether the low-floor design will impact vehicle longevity but noted that this design is more susceptible to road-side damage and salt spray (as the floor structure is closer to the ground)
bull New propulsion systems and electronics technologies may also impact useful life While engines for compressed natural gas and hybrid electric buses are expected to have similar useful lives compared to diesel these two engine types weigh more than diesel engines which may have an impact on structural wear (this has yet to be determined in practice) Similarly the rapid proliferation of new electronics technologies on buses (such as automatic vehicle location automatic passenger counters (APCs) on-board cameras and voice annunciation) may have implications for useful life as the presence of so many systems increases the likelihood of reliability issues Again the actual impact on useful life has yet to be determined in practice
Economic Analysis
For all vehicle categories the economic analysis identified the age at which total life-cycle costs including all capital operating and maintenance costs are minimized (reflecting the impact of differences in mileage) This analysis identifies a financially optimal retirement point for the vehicle Table ES-3 summarizes the results of this analysis
Federal Transit Administration xi
Useful Life of Transit Buses and Vans Final Report Executive Summary
Table ES-3 Minimum Life-Cycle Cost Replacement Ages and Mileages by Service-Life Category
Vehicle Type Category Annual Vehicle Mileage
Minimum Cost Age
Minimum Cost Mileage
Heavy-Duty Large Bus 12-Years 500000 Miles
25000 35000
17 14
425000 490000
45000 12 540000 Heavy-Duty Small Bus 10-Years 350000 Miles
25000 35000
12 11
300000 385000
45000 11 495000 Medium-Duty Small Bus 7-Years 200000 Miles
25000 35000 45000
9 8 7
225000 280000 315000
Light-Duty Midsize BusVan 5-Years 150000 Miles
20000 30000
7 6
140000 180000
40000 5 200000 Light-Duty Small BusVan 20000 6 120000 4-Years 100000 Miles 30000 5 150000
40000 4 160000 Note Shaded cells indicate where minimum cost point exceeds FTA age or mileage minimums
The following are key findings
bull The minimum cost retirement points all occur at or after the FTA minimum service life Table ES-3 suggests that from a cost-effective perspective FTArsquos current service-life minimums including both the minimum years and miles requirements represent reasonable choices For each service-life category the minimum cost point is attained at either an age or mileage that exceeds one or both of the FTA minimums for these measures In all cases the difference between one or both of the current FTA minimum requirements and the minimum cost age or mileage also provide some margin for the earlier retirement of vehicles with reliability problems This suggests that current age and mileage service-life minimums represent financially sound minimum-life choices
bull Reducing heavy-duty vehicles service life from 12 to 10 years would only have a minimal impact on vehicle sales At most 10 percent of all retirements for heavy-duty buses occur right at vehicle age 12 translating to an average of roughly 200 to 300 annual retirements potentially constrained by FTArsquos minimum-life requirements Assuming vehicles retiring at the current 12-year minimum shifted to a new 10-year minimum the long-term average annual replacement rates for these operators would increase from 200 to 300 vehicles to 240 to 360 vehicles annually or 40 to 60 additional vehicles per year Given that deliveries of new buses average roughly 3000 per year and the industryrsquos estimated total vehicle production capacity of 7500 to 10000 vehicles the addition of 40 to 60 new vehicles is far from significant Hence reducing useful life for heavy-duty vehicles by two years is unlikely to yield a significant boost to the small domestic bus market
bull Reducing heavy-duty service life from 12 to 10 years would have a minimal impact on ridership and service reliability Given that so few vehicle retirements are currently
Federal Transit Administration xii
Useful Life of Transit Buses and Vans Final Report Executive Summary
constrained by FTArsquos current service-life policy any reduction is unlikely to drive significant improvements in ridership levels or service reliability Note however that the relationship between vehicle condition and ridership is not well understood and FTA may wish to sponsor studies to better evaluate this issue
Recommendations
Based on the findings above it is recommended that FTA consider the following
bull Maintain the current service-life minimums Few buses and vans are currently retired right at FTArsquos current service-life minimums Rather the vast majority of these vehicles are retained in service for at least one year (4- and 5- years vehicles) and as many as three or more years (eg for 12-year vehicles) after the minimum service requirements have been met indicating that these vehicles have some service life remaining beyond the minimums Moreover the current service-life age andor mileage minimums for all vehicle types occur before the minimum life-cycle cost points for these vehicles are reached Hence the current service-life minimums clearly meet the joint objectives of (1) ensuring that buses and vans purchased using federal dollars remain in service for most of their useful life (2) of providing agencies some flexibility in determining when their vehicles will be retired and (3) of helping to minimize life-cycle costs In this sense the current service-life minimums really are just that the minimum ages at which vehicles can be retiredmdashnot a recommended retirement age or a measure of actual expected useful life The current minimum service-life requirements should be maintained
bull Maintain the current service-life categories Similarly the segmentation of transit bus and van types into the current five service-life categories reflects actual similarities in vehicle structures designs components costs origin markets manufacturers and end users These current categories should be maintained
bull Review the service-life minimums and service-life categories regularly The analysis of recent changes in vehicle designs the adoption of new technologies and the introduction of new vehicle types (eg stainless-steel bus rapid transit vehicles) highlight the fact that the service-life characteristics of transit buses and vans are subject to change For this reason FTA should review the minimum life requirements and service-life categories on a regular basis (eg every 5 to at most every 10 years)
bull Adoption of a ldquolemon lawrdquo This law would define circumstances under which ldquoproblemrdquo vehicles could be retired early without financial penalty
bull Adoption of a technology demonstration option Similar to the ldquolemon lawrdquo this option would define circumstances under which agencies could retire vehicles purchased to test new technologies (with FTArsquos prior agreement) earlymdashwithout financial penalty The intention would be to encourage test and adoption of new but potentially unreliable technologies expected to benefit the entire transit industry
bull Restrict the service-life categories in which vehicles are tested In recent years some manufacturers have successfully lobbied to have their vehicles tested in a more durable category than would appear warranted by their vehiclersquos general characteristics (eg testing a bus with 10-year characteristics as a ldquo12-yearrdquo bus) This has resulted in service reliability
Federal Transit Administration xiii
Useful Life of Transit Buses and Vans Final Report Executive Summary
issues and in some instances early retirement for the purchasing agencies when the tested vehicles were not found to have the expected durability Thus FTA may wish to more tightly control the categories in which vehicles are eligible to test based on some combination of characteristics (eg gross vehicle weight and seating capacity) but with the potential for special waivers to test in a different category so as not to stifle innovation (Manufacturers should be required to provide reasonable justification as to why their vehicles should be tested in the higher durability category)
bull Modify the NTD reporting requirements to better document actual vehicle retirement age and each vehiclersquos assigned service-life category The analysis used in this study to determine actual vehicle retirement ages relied on cross comparisons of NTD data from multiple reporting years FTA should modify NTD to track the actual age of vehicle retirements thus significantly improving FTArsquos ability to track and monitor any trends in vehicle retirement ages Similarly NTDrsquos vehicle documentation should also include the service-life category to which each vehicle has been assigned (again to facilitate monitoring of the retirement ages for each service-life category)
bull Conduct a study to evaluate the sensitivity of bus ridership to changes in vehicle age and condition A key objective of this study was to consider how bus ridership might change (increase) in response to a reduction in the average age of the nationrsquos bus fleets (eg with the introduction of a new shorter-lived heavy-duty transit vehicle) However while review of the existing literature provides numerous references to the sensitivity of ridership to changes in fares and service frequency no literature references were identified that provide a quantitative link between ridership and fleet age or condition In the absence of solid empirical data linking ridership and fleet age any analysis of this relationship can only be based on conjecture and limited anecdotal evidence For this reason the study team recommends that FTA conduct a study to evaluate the sensitivity of bus ridership to changes in vehicle age and condition Given the availability of good-quality route-level ridership data (from electronic fare boxes and APCs) this study could easily be conducted using a sample of US transit operators using before and after comparisons of which older sub-fleets have been replaced by new (or newer) vehicles
Federal Transit Administration xiv
Useful Life of Transit Buses and Vans Chapter 1 Final Report Introduction
CHAPTER 1 INTRODUCTION
Background
Transit agencies purchasing transit buses and vans using federal capital funds are required to keep these vehicles in service for a minimum period of time (years) andor number of miles prior to that vehiclersquos retirement to ensure effective use of federally funded assets This minimum service-life requirement differs based on bus and van size and other characteristics and is specified in FTA Circular 90301B The requirements currently recognize five different service-life categories (see Table 1-1)
Table 1-1 Minimum Service-Life Categories for Buses and Vans
Category Minimum Life
(Whichever comes first)
Years Miles Heavy-Duty Large Bus 12 500000
Heavy-Duty Small Bus 10 350000 Medium-Duty and Purpose-Built Bus 7 200000
Light-Duty Mid-Sized Bus 5 150000 Light-Duty Small Bus Cutaways and Modified Van 4 100000
The relative abundance of vehicles within these different categories varies significantly (see Figure 1-1) As might be expected 12-year buses account for more than three-quarters of all US transit buses and vans while 4-year vehicles account for nearly one-fifth of vehicles The remaining vehicle types including 10- 7- and 5-year vehicles collectively account for less than 5 percent (one in 20 vehicles) of the nationrsquos transit bus and van fleet The limited number of vehicles and relatively shallow depth of the market for 10- 7- and 5-year vehicles (roughly 4000 vehicles out of a total of more than 90000 transit buses and vans nationwide) make it difficult to effectively assess the actual useful-life characteristics of these less popular vehicle types In contrast agency and industry data sources have relatively good quality data on the useful-life experiences of the 12- and 4-year vehicle types
Since its inception several issues have been raised regarding FTArsquos minimum service-life policy These include the vehicle category definitions the use of vehicle age or miles (or hours) as the basis for defining service life and the potential for extended life cycles through life-extending overhauls More generally the question arises as to whether the current minimum life ages and mileages are appropriate given the experiences of the nationrsquos operators of transit buses and vans
Federal Transit Administration 1
Useful Life of Transit Buses and Vans Chapter 1 Final Report Introduction
Figure 1-1
Minimum Life Categories Shares of Nations Total Bus and Van Fleet
12 Year Buses
10 Year Buses and Vans
5 Year Buses and Vans 7 Year Buses
4 Year Van 18
and Vans 78
and Vans 11 2
Study Objectives
The aim of this study is to reassess FTArsquos existing minimum service-life policy (including both the actual minimum age and mileage requirements and the service-life categories into which bus and van vehicles are placed) based on the experiences vehicle retirement practices and life-cycle cost characteristics of the nationrsquos transit operators and vehicle manufacturers Key questions to be addressed by this review include the following
bull What are the actual ages (mileages or service hours) at which operators are retiring their transit buses and vans and how do those ages compare to the FTA minimums
bull Do the current minimum age and mileage requirements meet the needs of all agency types
bull How do FTArsquos current retirement minimums affect the purchase and retirement decisions of the nationrsquos operators
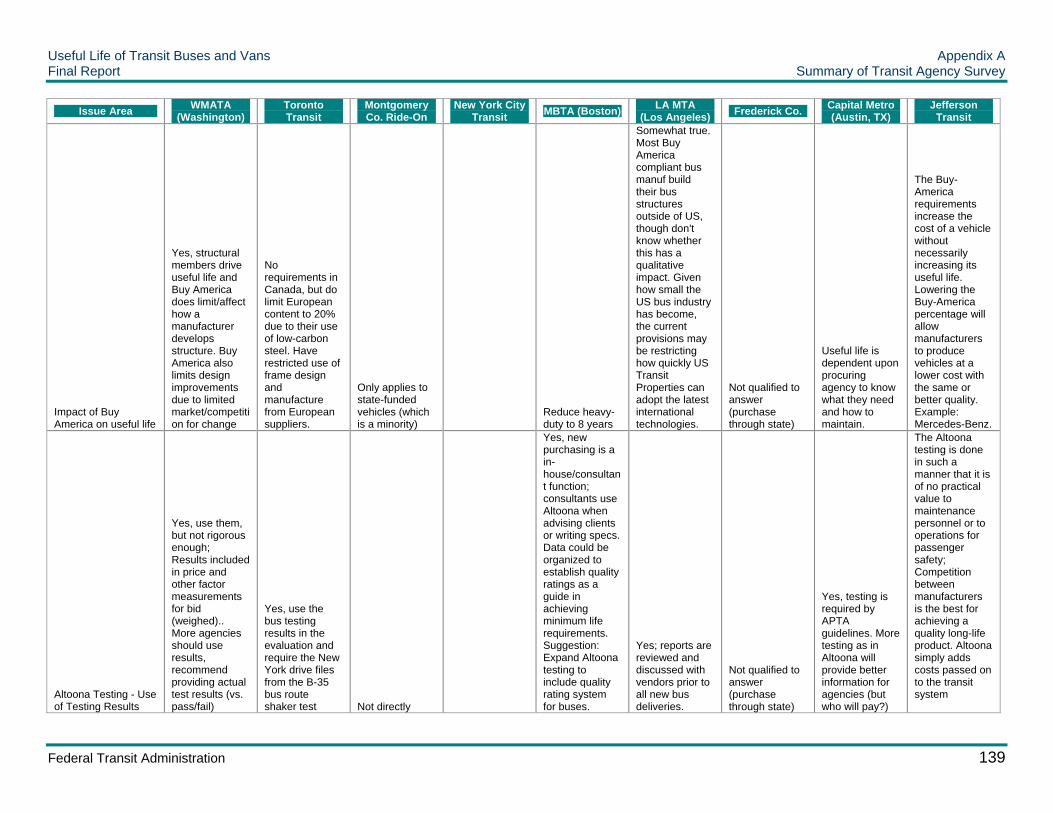
bull How has other federal legislation such as ldquoBuy Americardquo impacted vehicle bus and van useful life if at all
bull Should FTA consider changing the current minimums given the experience of the nationrsquos transit operators and manufacturers Alternatively how would an increase or decrease in the current minimum life requirements affect the fleet investment decisions of the nationrsquos transit operators
bull Are operators interested in procuring vehicles with shorter life expectancies than are permitted by the current policy (eg a cheaper and shorter life expectancy 40-foot bus)
bull How have changes in vehicle designs (eg low floor) and technologies (eg alternative fuels) affected the expected vehicle life
bull How do vehicle procurement policies impact expected vehicle life
Federal Transit Administration 2
Useful Life of Transit Buses and Vans Chapter 1 Final Report Introduction
This study seeks to provide answers to each of these questions with the ultimate objective of assessing both the appropriateness of FTArsquos existing minimum service-life policy for transit buses and vans and any potential need to change that policy
Reasons for Reviewing the Service-Life Policy
More than 20 years have passed since the adoption of FTArsquos minimum service-life guidelines Since that time the industry has undergone several significant changes many with potential implications for vehicle useful life Among these are the following
bull Operator Experience and Changing Economics The current minimum service-life requirements were developed based on the industryrsquos understanding of useful life as of 1985 With two decades of experience operating under these requirements operators have developed their own impressions and opinions as to how these requirements align with actual useful-life experience Moreover even if it is assumed that there have been no changes to the buses themselves (which of course there have been) changes to capital and operating costs as well as to vehicle utilization (passenger loads and duty cycles) will have yielded changes to both the economic and physical determinants of vehicle useful life
bull Impact of the Policy Itself It has been suggested that the presence of FTArsquos vehicle service-life policy has itself impacted actual useful-life expectations For example the combination of the low-bid and minimum life requirements may have yielded buses designed specifically to meet but not exceed the minimum life requirement (eg thus reducing the total expected useful life of a 40-foot bus from 14 to 16 years to say 12 years) Alternatively many manufacturers have lobbied to have their vehicles moved to a higher minimum age category (eg 10-year buses re-categorized to 12-years) as a means of expanding the potential market for their product There is now some evidence that this practice may have yielded buses that are capable of meeting the higher category bus testing requirements and yet not capable of meeting the service-life minimums once in service
bull New Vehicle Designs and Materials The past 20 years have seen the introduction of many new vehicle designs including increasing use of differing vehicle lengths (from 60 foot articulated to 30 foot sizes for 12-year buses and a similar range of sizes for 10-year 7-year and 5-year vehicles) low floor buses and ldquostickrdquo buses using a network of welded tubes in place of more traditional structures Each of these design variations especially those with changes of structural significance has implications for expected vehicle life
bull Alternative Fuels Operators have also increasingly adopted the use of alternative fuels vehicles including compressed natural gas (CNG) duel-fuel gas hybrid and potentially fuel cell vehicles Some of these are coming to the end of their first full life cycle thus providing an opportunity to assess their impact on vehicle useful life
bull New Technologies The past 5- to 10-year period has seen a significant increase in the number of new technologies installed on transit buses These include automatic vehicle location (AVL) automatic passenger counters (APCs) voice annunciation on-board cameras multiplexers and potentially collision avoidance systems Assuming many or all of these systems are expected to function before a vehicle can be released for revenue service each day the sheer proliferation of the technologies and the increasing likelihood that any
Federal Transit Administration 3
Useful Life of Transit Buses and Vans Chapter 1 Final Report Introduction
one of them will fail as the vehicle ages has significant implications for vehicle useful life From another perspective the increasing desirability of having the latest suite of technologies on each fleet vehicle can also drive down the useful life of transit vehicles with life here being determined more by technological obsolescence than by asset wear
bull Changes to the Domestic Manufacturing Market The combined influences of wide production variances Buy America provisions and the exit of several suppliers has significantly affected the long-term structure and viability of the domestic bus market The changes have yielded uncertainty regarding the future of exiting manufacturers and also impacted the availability of replacement parts for (and hence maintainability of) older fleet vehicles
bull Legislation In addition to Buy America provisions bus suppliers and purchasers are subject to a variety of additional federal requirements that may impact vehicle useful life Among these are the Bus Testing ADA and EPA emissions requirements
bull Procurement Strategies While transit operators continue to use a variety of vehicle procurement strategies the use of low-bid procurements in particular may have a negative impact on vehicle useful life Moreover as discussed elsewhere in this study the relatively small size of individual agency procurements (and the small size of the transit market in relation to the broader truck and automotive market) gives transit operators and the industry as a whole little ability to directly impact the useful-life characteristics of many bus and van types or their components
bull Desire to Increase Ridership Service Quality FTArsquos policy objective of increasing ridership might be served by accelerating the removal of older vehicles from service (thus improving the quality of service) As noted above such an accelerated replacement cycle could similarly quicken the adoption of new technologies further enhancing the rate of service improvement
Each of these considerations supports a reassessment of FTArsquos current minimum service-life requirements This study duly reviews each of these considerations
What is Useful Life
Before reviewing the study analyses and results it is helpful to first establish a working definition of useful lifemdasha concept that has different meanings to different users Useful life is typically defined as that age (ie number of years) after which an asset is no longer ldquofit for userdquo in the sense that it has become worn not fully operational unreliable andor does not otherwise deliver transit service of acceptable quality For mechanical assets such as transit vehicles the total utilization of that asset (eg life to date vehicle miles or hours) is equally important to age when establishing a minimum useful life Useful life based on asset utilization depends on the asset type its design specifications and the service it performs For transit buses and vans it is clear that total vehicle miles is in most instances a better measure of asset ware than vehicle age (with the latter frequently functioning as a rough proxy for the former) An empirical analysis of the relationship between useful life expectancy in years and vehicle life-to-date mileage for US transit buses is demonstrated in Chapter 7 (and repeated again later in the report using financial
Federal Transit Administration 4
Useful Life of Transit Buses and Vans Chapter 1 Final Report Introduction
analysis) These analyses underscore the importance of maintaining a combined age- and mileage-based FTA service-life policy
Engineering-Based Bus Conditions
For transit buses it is not sufficient to be merely ldquooperationalrdquo Rather transit patrons expect a vehicle that is reliable safe and offers reasonably comfortable travel The problem lies in identifying a specific point in the assetrsquos life (age or service miles) at which service quality safety or reliability is no longer acceptable In reality the decline in condition of a transit vehicle is a slow continuous process (excepting the impact of major overhauls) with no obvious point of retirement What is acceptable to one transit patron may not be to another
Figure 1-2 highlights both the absence of an obvious retirement age based on physical condition alone as well as the effect of vehicle use on vehicle condition In support of model development for the Transit Economic Requirements Model (TERM) FTA has conducted detailed physical condition inspections of more than 900 transit bus and van vehicles at more than 40 different transit agencies nationwide (each inspection is represented by a point in Figure 1-2) The sloping lines in Figure 1-2 represent vehicle decay curves developed using this data for the 12-year and 4-year service-life categories Here overall vehicle physical condition is measured on a scale of 5 (excellent) through 1 (poor) The trend lines capture the rate of vehicle decay
The inspections revealed both a slow decline in vehicle physical condition (and related service quality and reliability) with age and (for each age) a wide variation in condition driven primarily by differences in vehicle mileage and maintenance practices (captured here by the spread of vehicle condition observation points) but no obvious age or condition value for vehicle retirement Hence while these conditionage relationships are extremely valuable in understanding and predicting the rate of physical decay for transit vehicles they cannot be used to identify a specific desired retirement age or condition As a point of reference most transit operators replace their vehicles somewhere between condition 20 to 25 on this chart
Cost-Based Useful Life Analysis
In contrast to this condition-based approach vehicle cost analysis can be used to identify a specific vehicle retirement age (or service miles) at which average annual life-cycle costs for each vehicle type are minimized For example the ldquominimum life-cycle costrdquo approach employed in this report (see Chapter 7) compares the decline in purchase cost per service mile over the life of a vehicle with the corresponding increase in operating and maintenance costs (as well as periodic engine transmission and other rehabilitation activities) The period in time at which the sum of these annualized capital and operating costs is minimized represents the financially optimal point for vehicle retirement Unlike the engineering-based condition assessment this method identifies a specific optimal point in the asset life cycle for vehicle retirement However while the engineering-based assessment does not provide a specific useful-life age it does recognize declining service quality with age (which financial considerations alone do not) Table 1-2 outlines the tradeoff between these two approaches
Federal Transit Administration 5
Useful Life of Transit Buses and Vans Chapter 1 Final Report Introduction
Figure 1-2 Ph
ysic
al C
ondi
tion
Bus and Van Physical Condition Versus Age 50
Full Bus (12 yr)
Small Bus (7-10 yr)
Vans (4 yr)
Decay Curve - 12-Year Bus
Decay Curve - 4-Year Van
Excellent
45
40 Good
35
30 Adequate
25
Substandard 20
15
Poor 10
0 1 2 3 4 5 6 7 8 9 10 11 12 13 14 15 16 17 18 19 20 21
Vehicle Age (Years)
Table 1-2 Engineering Versus Economic Approaches to Identifying Useful Life
Approach Measures Service Quality
Identifies a Specific Useful-Life Value
Engineering Condition Based Yes No Economic Minimum Cost Replacement No Yes
Minimum Optimal Expected and Average Useful Life
Finally this study frequently makes the distinction between four different concepts of useful-life including optimal useful life expected (or planned) useful life minimum useful life and the current average retirement ages for US transit buses Table 1-3 presents these concepts and their definitions Understanding the differences in these definitions is important to understanding the analyses in the succeeding chapters of the report and also has importance to any potential changes to FTArsquos current service-life minimums These concepts are also illustrated graphically in Figure 1-3
The distinctions between the definitions in Table 1-3 are more than semantic Many within the transit industry equate FTArsquos 12-year minimum with the expected or desired useful life of a large transit bus (indeed many of the agencies participating in this study have set their agencyrsquos expected useful life values equal to the FTA minimum) This rather then viewing the 12-year minimum as a point at which some useful-life remains From the viewpoint of establishing policy it is recommended that FTA continue to establish its service-life minimum requirements such that some useful life does remain and yet the majority of useful life has been consumed Under these circumstances the expected average and optimal useful life values for each transit bus and van type should each occur after the service-life minimum (as is currently the case based on the results of this study) Maintaining this policy will ensure that (1)
Federal Transit Administration 6
t
Useful Life of Transit Buses and Vans Chapter 1 Final Report Introduction
tax payers derive good value from funds invested in transit buses (2) agencies with higher than average vehicle wear rate characteristics (ie their expected and optimal useful lives are lower than the average) will have some leeway for earlier retirement and (3) agencies with a ldquoproblemrdquo vehicle model will also have some leeway for earlier retirement (Chapter 5 considers provisions for more highly problematic vehicle models)
Table 1-3 Vehicle Useful Life Concepts
Useful Life Concept Definition Example Based on ldquo12-Yearrdquo Bus
Expected or Planned Useful Life The age at which transit operators plan to retire their transit vehicles
For many agencies this point is driven by policy and or funding
The age at which agencies ldquoexpectrdquo under the assumption that these availability and occurs at age 12 to or ldquoplanrdquo to retire their vehicles assets will be completely worn 15 Average Useful Life
The age at which agencies ldquodordquo retire their vehicles
The average age at which US transit operators ldquoactuallyrdquo retire their transit vehicles
Based on analysis of NTD data presented below the average retirement age is 151 years
Optimal Useful Life
The age at which agencies ldquoshouldrdquo retire their vehicles
The financially optimal point for vehicle retirement (ie the point at which life-cycle costs are minimized)
Based on the analysis in Chapter 7 this occurs between 12 to 14 years depending on annual mileage and other factors
Minimum Useful Life
The minimum age at which agencies are ldquoallowedrdquo to retire their federally funded vehicles without penalty
The minimum agemileage to retire a vehicle This point assumes that most vehicles still have additional years of useful and cost-effective service but that most of the assetrsquos value has been consumed
Currently set at 12 years
Figure 1-3 Minimum Life-Cycle Cost Curve
TToottaall
OOwwnneerr--sshhiipp
CCoossttss
AAvveerraaggee LLiiffee
EExxppeecctteedd LLiiffee
MMiinniimmuumm LLiiffee
CCoossttss LLoowweesstt CCoosstt
AAggee MMiilleess oorr HHoouurrss
AAnnnnuuaalliizzeedd CCaappiittaall
RReeppllaacceemmeenntt UUsseeffuull LLiiffee RRaannggee
MMaaiinntteennaannccee CC t
Federal Transit Administration 7
Useful Life of Transit Buses and Vans Chapter 1 Final Report Introduction
Finally the upcoming chapters of this report investigate and assess each of these differing useful life measures based on the survey responses vehicle retirement activities and life-cycle costs of US transit operators Specifically Chapter 4 documents average useful life of all transit bus and van categories based on actual vehicle retirements as obtained from FTArsquos National Transit Database (NTD) Next Chapter 5 documents the expected useful life of the nationrsquos transit buses based on agency responses to a survey conducted for this study Finally Chapter 7 estimates the optimal useful life based on a minimum life-cycle cost analysis of each bus and van type The study then compares and contrasts the assessed values for each of these differing measures of useful life with FTArsquos current service-life minimums to assess the appropriateness of those minimums and any potential need to change them
What About Vehicle Hours
Finally FTArsquos minimum service-life policy is currently defined in terms of both vehicle age and vehicle miles But what about vehicle hours As noted above vehicle miles generally provide a better measure of vehicle ware as compared to vehicle age However the number of hours of service can vary significantly between vehicles with the same life-to-date mileage Consider the contrasting cases of vehicles operated in slower moving central business district routes versus vehicles operated for higher-speed longer-distance commuter bus service A vehicle operated at a relatively slow operating speeds will have many more service hours (and likely poorer physical condition) than a similar vehicles with the same life-to-date miles but operated at higher speeds This suggests that vehicle hours should be included along with age and mileage as a minimum useful-life measure
The problem with adopting vehicle hours as a measure of useful life is the fact that unlike vehicle age and mileage which can be measured (with mileage based on hub meter readings) operators do not currently maintain records of life-to-date vehicle hours and have no existing means of doing so Hence to be used as a measure of minimum useful life these values would need to be estimated somehow most likely based on an agencies average operating speed The impact of average operating speeds (and by extension vehicle hours) on vehicle retirement age is considered in the life-cycle cost analysis discussed in Chapter 8
Project Approach
To meet the needs of the study the study team completed the following six independent analyses Each of these analyses aimed to provide a different perspective on (1) the current useful life of transit buses and vans (2) the appropriateness of FTArsquos minimum life policy and (3) the policyrsquos impact on transit vehicle life expectancies and vehicle retirement decisions at the agency level
bull Review of FTA Service-Life Categories The study provides descriptions of the types of vehicles found in each of FTArsquos five service-life categories This includes descriptions of the vehicle physical characteristics purchase costs common service applications primary manufacturers and annual units sold The analysis also considers the source markets for transit components including transit-specific and those components obtained from the
Federal Transit Administration 8
Useful Life of Transit Buses and Vans Chapter 1 Final Report Introduction
broader heavy-truck and automotive markets The market analysis is intended to provide perspective on transitrsquos role and position within the broader truck and automotive market with emphasis on where transit has the ability (or inability) to influence component and overall vehicle life expectancy
bull Review of Useful-Life Related Bus Procurement Regulations The study reviews federal legislation and circulars to identify federal requirements potentially impacting either the useful life or vehicle retirement decisions of the nationrsquos operators of transit buses and vans This review includes FTArsquos bus testing regulations the Americans with Disabilities Act (ADA) Buy America requirements the Standard Bus Procurement Guidelines and the Clean Air Act and its Amendments
bull Review of Actual Retirement Ages NTD data were used to determine the actual ages at which US agencies are currently retiring vehicles within each of FTArsquos service-life categories This analysis was then used to compare the average retirement ages with the minimum FTA age requirements for each of these vehicle types to determine how the current minimum retirement ages may be impacting local operatorrsquos vehicle retirement decisions
bull Industry Outreach The study team conducted two sets of interviews with bus fleet managers vehicle engineers maintenance staff and procurement personnel from a sample of the nationrsquos large medium and small-sized bus and van operators The first set of interviews were designed to document the industryrsquos concerns with FTArsquos current service-life policy to obtain agency perspective on how that policy impacts agency procurement decisions retirement decisions or the expected life of agency vehicles and to elicit suggestions on how or if that policy should be changed These interviews were also used to further document vehicle retirement ages (both agency policy as well as the actual retirement ages) and to obtain bus and van life-cycle cost data The second set of interviews consisted of follow-up questions to the original interviewsmdashwith greater focus on specific engineering issues such as the impact of new vehicle designs and technologies on expected vehicle life
bull Engineering Analysis The engineering analysis examines the life expectancy of transit buses and vans within each of the existing vehicle categories all from an engineering perspective (ie based on ability to maintain service reliability and safety) This analysis is completed both from the perspective of individual vehicle components and from that of the vehicle as a whole (ie the factors that determine overall vehicle useful life) The analysis then considers the appropriateness of the minimum life requirements for each vehicle category given the useful-life characteristics of each vehiclersquos component parts
bull Economic Analysis This analysis identifies that point in the life cycle of each bus and van type at which total life-cycle costs are minimized This point provides a financially logical age (or mileage) at which to retire that vehicle The identified minimum cost replacement ages are then placed in context with the results of the engineering analysis The combination of these two perspectives helps illustrate factors that drive granteesrsquo vehicle retirement decisions
Once again each of these analyses provides perspective on how the current FTA minimum life requirements compare with useful life as determined from actual vehicle retirement ages agency assessments of useful life and life-cycle cost analyses In turn these perspectives provide a vantage point from which to assess the merits of FTArsquos current retirement minimums
Federal Transit Administration 9
Useful Life of Transit Buses and Vans Chapter 2 Final Report FTA Service-Life Categories
CHAPTER 2 FTA SERVICE-LIFE CATEGORIES
This chapter provides a detailed review of each of the five service-life vehicle categories currently used by FTA The purposes of this chapter are threefold First the chapter provides the reader with a solid understanding of the characteristics of each of the five vehicle types This includes both the general physical differences between vehicles in the differing category types as well as differences in cost This background is critical for an effective understanding of the findings in the sections and chapters to follow
Second the detailed descriptions of each vehicle type and the components used in their manufacture also serve to emphasize the commonalities among vehicles in the same category and differences between vehicles in different categories Stated differently this review of the five categories and the vehicles in those categories demonstrate that FTA is well served by the five existing minimum service-life categories The exceptions are the 4-year and 5-year categories which have significant similarities to each other in terms of both general characteristics as well as the names of the manufacturers serving those markets
Third this chapter provides a market assessment for both vehicles and their components of all five FTA bus and van categories A primary objective here is to highlight the small size of the market for transit buses and vans relative to the auto and heavy-truck market from which most transit bus vehicle components and some bus and van vehicle types are derived Given this small market share the transit industry has little ability to impact the useful life of most transit vehicle types and components in a cost-effective manner For this reason the useful-life characteristics of transit buses and vans are largely determined by the wider truck and auto market and any significant attempts to increase or decrease the useful life of transit specific vehicles are also likely to have a negative impact on vehicle cost
This chapter is organized as follows bull Service-Life Category Descriptions
ndash Physical Description of Each Vehicle Type ndash Market Analysis of Vehicle Chassis and Components by Category
bull Implications for the Current Service-Life Categories
Service-Life Category Descriptions
Large Heavy-Duty Buses (12 Years 500000 Miles)
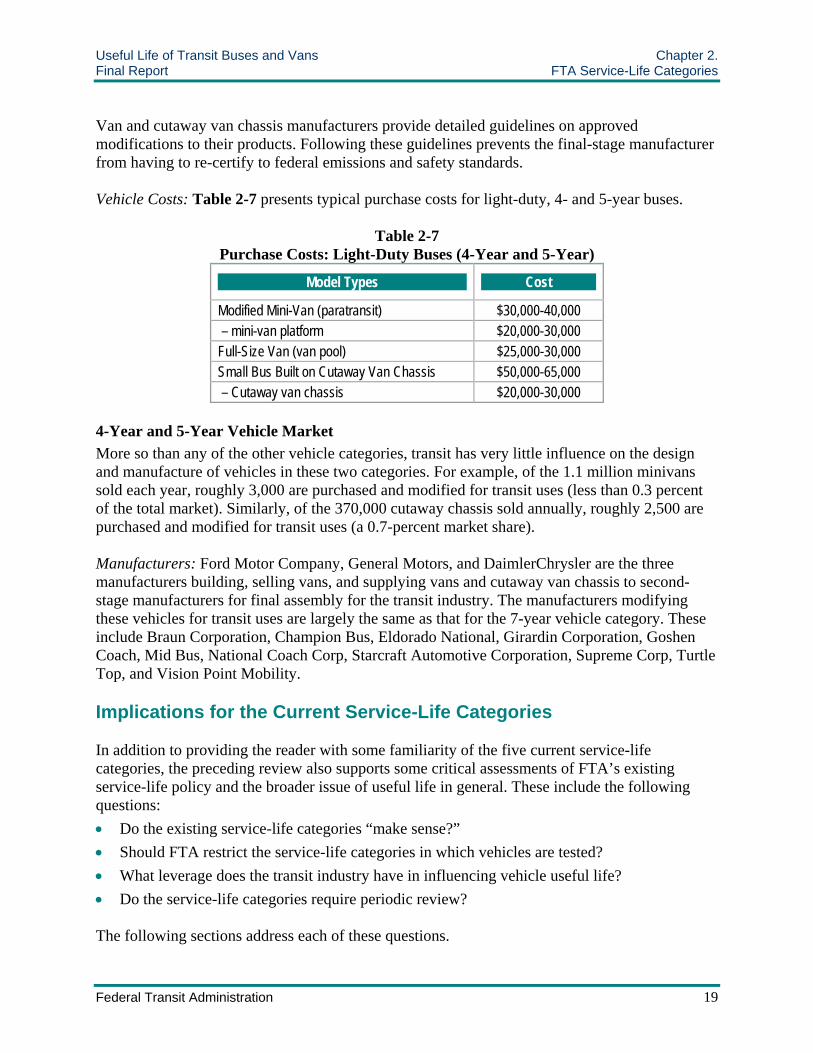
Approximately three in four rubber-tired transit vehicles are 12-year buses making this vehicle type the transit industryrsquos primary workhorse With a standard length of 40 feet (with variants ranging from 30 to 60 feet) a gross vehicle weight of roughly 33000 to 40000 pounds and an average seating capacity for about 40 passengers the 12-year bus is also the largest heaviest and biggest capacity rubber-tired vehicle serving the transit market
Federal Transit Administration 10
Useful Life of Transit Buses and Vans Chapter 2 Final Report FTA Service-Life Categories
Construction Vehicles in the 12-year category are typically built on integrated structure chassis unit body monocoque or semi-monocoque chassis Heavy duty chassis of the high-floor unit body type are built with substantial amounts of metal in under-structural bulkheads and sidewalls located at points of concentrated stress such as the front and rear suspension attach points passenger door openings and the engine cradle The size and thickness of these bulkheads and sidewalls results in a strong structure with a good margin for corrosion-related structural degradation and are a key factor in the overall longevity of this vehicle type
A less expensive type of construction is an integrated chassis composed of multiple tubing elements sometimes referred to as a ldquostick builtrdquo chassis These stick-built structures consist of an integrated floor roof and sidewall structure of Low-Floor Stick Chassis metal tubes welded together on which the major components are attached Low-floor buses typically use this type of construction as there is very little space under the floor for large structural elements The relatively small size of the structural elements of the low-floor bus provides less structure to bear the suspension and engine loads and reduces the tolerance of the structure to the effects of corrosionmdasha factor which may lead to shorted vehicle life expectancies for this vehicle type (this issue is discussed further in Chapter 6) Both traditional and stick-built structures are covered with outer panels composed of either stainless steel aluminum or composite materials
12-Year Vehicle Types High and Low Floor Vehicles Prior to the mid-1990s all 12-year buses were exclusively ldquohighshyfloorrdquo vehicles However in response to the ADA the industry developed low-floor buses that use ramps kneeling mechanisms or steps just a few inches above the curb or level with the curb for ease of entry Low-floor buses are available in every size of heavy-duty bus from short lengths to 60-foot articulated vehicles While the cost and most physical characteristics of high- and low-floor vehicles are similar some NABI Articulated Low-Floor Bus operators suspect that low-floor vehicles may have a lower expected life as compared to the traditional high-floor vehicle Chapter 6 Engineering Analysis addresses this possibility
Vehicle Lengths 12-year buses come in a variety of sizes ranging from 30 feet to 60 feet (articulated) buses Shorter 30- to 35-foot
Composite Monocoque Structure
Federal Transit Administration 11
Useful Life of Transit Buses and Vans Chapter 2 Final Report FTA Service-Life Categories
models are used on lower ridership routes andor on streets with limited maneuverability In contrast 60-foot articulated buses are used on high ridership corridors Articulated buses are available in both high- and low-floor configurations
Propulsion System Options Twelve-year vehicles are available with a wide variety of propulsion system options including diesel gas CNG electric and hybrid systems
Vehicle Costs Table 2-1 presents typical purchase costs for large heavy-duty 12-year buses
Table 2-1 Purchase Costs Large Heavy-Duty Buses (12-Year)
Model Type Cost
High-floor 40 foot $350000 Low-floor 40 foot $350000 40-foot Hybrid $500000 60-foot articulated $500000 Bus rapid transit $500000-$1M
12-Year Vehicle Market Unlike all other bus and van types the ldquo12-yearrdquo bus is manufactured almost exclusively for the transit market by a small number of specialized manufacturers Hence while this vehicle includes numerous components obtained from the heavy-truck market the chassis body and many key components of this vehicle type are manufactured specifically with the needs of the transit market in mind Of the roughly 3000 heavy-duty 12-year transit buses sold each year approximately 95 percent or more of these vehicles are destined for use in the transit market Most of the remaining vehicles are sold for applications similar to transit including shuttle buses at airport parking lots and at some national parks
While 12-year vehicles are manufactured specifically for transit and similar applications a large proportion of these vehiclesrsquo components including the engine transmission axels brakes suspension air compressors and power steering are derived from the significantly larger heavy-truck market In fact the total value of components derived from the heavy-truck market account for roughly 40 percent of the value of a new 40-foot bus In a sense transit bus manufacturers ldquoborrowrdquo these components from the much larger heavy-truck market (roughly 300000 heavy trucks are sold annually versus 3000 twelve-year buses) leading to significantly cheaper component prices than would be possible if they were manufactured solely for the 12-year vehicle market On the down side these components are designed with the heavy-truck market in mindmdashand not the specific needs of transit users Hence transit has little ability to influence the useful-life characteristics of these components in a cost-effective manner (ie as any transit ldquocustomizedrdquo components would be developed for a transit market that is one percent of the size of the truck market for which those components are currently manufactured)
In contrast the chassis body and several other components including the doors wheelchair lifts axles on low-floor buses destination signs and HVAC are manufactured solely for the transit
Federal Transit Administration 12
Useful Life of Transit Buses and Vans Chapter 2 Final Report FTA Service-Life Categories
market Table 2-2 summarizes the shares of 12-year vehicles and related vehicle components destined for the transit market
Manufacturers Vehicles in this category are built by a relatively small number of manufacturers that specialize in this vehicle type These include Gillig Millennium Transit North American Bus Industries (NABI) New Flyer Nova Bus and Orion
Table 2-2 Market Analysis 12-Year Bus Vehicles and Components
Vehicle Components Primary Market
Annual Units Sold
12-Year Vehicle Share of Market
Share of Vehicle Purchase Cost
Total Vehicle 12-Year Bus Transit 3000 95 or more NA Vehicle Components Chassis body doors wheelchair lifts low floor axles destination signs HVAC
Transit 3000 95 or more 60
Engine transmission axles brakes suspension air compressors and power steering
Heavy Truck 300000 1 40
Small Heavy-Duty Buses (10 Years 350000 Miles)
The 10-year service-life category represents the second-most durable buses used in transit Vehicles in the category average roughly 30 to 40 feet in length (with most in the 30-foot range) have gross vehicle weights of approximately 26000 to 33000 pounds and have seating capacity for between 26 to 35 passengers Vehicles in this category account for roughly one percent of the nationrsquos bus and van fleet
Construction This class of vehicles was initially served by body-on-frame manufacturers using construction methods similar to school buses These manufacturers build their vehicles using medium heavy-duty rear engine ldquostrippedrdquo chassis also used for both school buses and motor homes Many of these buses are built using stripped chassis manufactured by medium- and heavy-duty truck manufacturers (eg International Freightliner and GM) although some 10-year vehicle manufacturers produce their own chassis The 10-year transit vehicle manufacturer (eg Blue Bird Optima and Thomas Built) then adds a body and other components to complete construction of the 10-year bus
More recently small bus manufacturers have been adapting European designs for the North American bus market The European designs have narrower widths (some as narrow as 96 inches) than typical North American bus designs and are promoted as more maneuverable in tight urban and suburban operating areas The adapted European designs also incorporate aluminum integral structure unit body monocoque or semi-monocoque structures which is a
Federal Transit Administration 13
Useful Life of Transit Buses and Vans Chapter 2 Final Report FTA Service-Life Categories
departure from the typical steel or stainless steel in more traditional North American designs The vehicles are available in both low floor and high floor
Champion Heavy-Duty Small Bus Eldorado Heavy-Duty Small Bus
Vehicle Costs Table 2-3 presents typical purchase costs for small heavy duty 10-year buses
Table 2-3 Purchase Costs Small Heavy Duty Buses (10-Year)
Model Type Cost
Body on Frame (30-40 feet) $200000 - $250000 Integral Chassis (30-40 feet) $250000 - $325000
10-Year Vehicle Market Transit buses account for only a very small proportion of the body-on-frame vehicle market from which the 10-year bus is derived More accurately of the roughly 60000 vehicles manufactured using body-on-frame construction each year only 200 to 300 are finished as 10-year transit buses (ie the body is a passenger compartment intended for transit or similar applications) The vast majority are finished as school buses or motor homes (in fact many buses sold in the 10shyyear category are just modified school buses) Hence for most 10-year transit buses the primary transit-specific components are the body (including the interior) destination signs and fare collection equipment The majority of the vehiclersquos major components including the chassis engine transmission axles brakes and steering are derived from either the broader school bus or motor home market of the still larger heavy-truck market Table 2-4 presents a summary market analysis of the 10-year vehicles and their components
Manufacturers Vehicles in this category are built by a relatively small number of firms that generally specialize in the manufacture of school buses motor homes and small transit vehicles These include Blue Bird Corporation Optima Bus Supreme Corporation and Thomas Built buses
Federal Transit Administration 14
Useful Life of Transit Buses and Vans Chapter 2 Final Report FTA Service-Life Categories
Table 2-4 Market Analysis 10-Year Bus Vehicles and Components
Vehicle Components Primary Market Annual Units Sold
10-Year Vehicle Share of Market
Share of Vehicle Purchase Cost
Total Vehicle 10-Year Bus Transit 200 to 300 95 or more NA Vehicle Components Body doors destination signs Transit 200 to 300 95 or more 35 Chassis wheelchair lifts HVAC School bus and
motor home 60000 Less than 1 25
Engine transmission axles brakes suspension air compressors and power steering
Heavy-Truck 300000 Less than 1 40
Medium-Duty and Purpose-Built Buses (7 Years 200000 Miles) Medium-Duty Cab Chassis
The 7-year service-life category represents the mid-level in terms of bus durability and size Vehicles in the category average roughly 25 to 35 feet in length (with most in the 30-foot range) have gross vehicle weights of approximately 16000 to 26000 pounds and have seating capacity for between 22 to 30 passengers Vehicles in the 7-year category account for just over two percent of the nationrsquos bus and van fleet
The majority of buses in this category are purpose built using either a front-engine cab chassis or a stripped chassis both of which are manufactured by medium- and heavy-duty truck manufacturers (eg International Freightliner and Workhorse) A ldquofinal stagerdquo transit vehicle manufacturer (eg Champion Eldorado National and Goshen Coach) then adds a body and other components to complete construction of the 7-year bus
Purpose-Built Front-Engine Cab
Medium-Duty Cab Chassis Bus Cab chassis is a term the trucking industry uses to describe a chassis equipped with a complete operator cab The chassis has a conventional layout with an engine and transmission at the front and the chassis is available in varying wheelbases and lengths The cab chassis and chassis are sent incomplete to final stage manufacturers who mount custom bodies to the chassis rails These chassis are popular and used for school buses delivery trucks transit Medium-Duty Stripped Chassis and shuttle buses and recreational vehicles
Medium-Duty Stripped Chassis Stripped chassis are similar to cab chassis except that the chassis is supplied without a sheet metal cab The chassis is provided by the final stage manufacturer (eg a transit vehicle manufacturer) with an operatorrsquos platform that includes the instrument cluster and
Federal Transit Administration 15
Useful Life of Transit Buses and Vans Chapter 2 Final Report FTA Service-Life Categories
switch gear control pedals operator heating and air conditioning and an operatorrsquos seat The final stage manufacturer then builds a single body to place on top of the chassis that houses both the passenger section and operator station The stripped chassis enables a bus manufacturer to design a body configuration closer to that of an urban transit bus The front engine layout however dictates the locations of the entrance door to be behind the front axle and operator station Typically the body is equipped with a single door Front-engine chassis are popular because they are produced in large numbers for the trucking industry and hence are relatively affordable However the front-engine configuration compromises ride quality because of its heavily forward-biased weight distribution
Vehicle Costs Table 2-5 presents typical purchase costs for medium-duty 7-year buses
Table 2-5 Purchase Costs Medium-Duty Buses (7-Year)
Model Types Cost
Bus built on cab chassis $75000 Bus built on stripped chassis $100000 Trolleybus built on stripped chassis $175000
7-Year Vehicle Market As with the 10-year vehicle type vehicles in the 7-year category account for only a very small proportion of the medium-duty truck market from which they are derived Of the roughly 50000 vehicles manufactured by the medium-duty truck market each year only about 300 are finished as 7-year transit buses (ie the body is a passenger compartment intended for transit or similar applications) The remaining vehicles of this general type are completed for a broad array of different uses including airport and hotel courtesy vehicles ambulances moving vans medium-size trucks and motor homes Here again for most 7-year transit buses the primary transit specific components are the body (including the interior) doors destination signs and fare collection equipment The remaining major components including the chassis engine transmission axles and brakes are once again derived from a broader ldquonon-transitrdquo market Table 2-6 presents a summary market analysis of the 10-year vehicles and their components
Manufacturers The number of manufacturers that have developed transit vehicles in this category is larger than the 10-year and 12-year vehicle types These include Cable Car Classics Champion Bus Eldorado National Glaval Bus Goshen Coach Molly Corporation Starcraft Automotive Corporation Startrans Supreme Corp and Trolley Enterprises
Federal Transit Administration 16
Useful Life of Transit Buses and Vans Chapter 2 Final Report FTA Service-Life Categories
Table 2-6 Market Analysis 7-Year Bus Vehicles and Components
Vehicle Components Primary Markets Annual Units Sold
10-Year Vehicle Share of Market
Share of Vehicle Purchase Cost
Total Vehicle 7-Year Bus Transit 300 90 or more Na Vehicle Components Body doors destination signs wheelchair lifts Transit 300 90 or more 30
Chassis engine transmission axels brakes suspension air compressors and power steering HVAC
Medium-Duty Truck Market 50000 Less than 1 70
Light-Duty Vehicles (5 Years 150000 Miles and 4 Years 100000 Miles)
The 4- and 5-year service-life categories Automotive Minivan with Second-Stage Access Ramp represent the smallest buses used in transit and are typically built on cutaway van chassis or modified vans approximately 16 to 28 feet in length as characterized by FTA The majority of buses in this category are modified minivans modified and unmodified full-size passenger vans and specially built buses using cutaway chassis produced by automobile manufacturers In contrast to the 12- 10- and 7-year categories (which are more clearly defined from one another) the 4- and 5-year vehicle categories have a significant amount of overlap with each other in terms of both the vehicle characteristics and the manufacturers that serve these categories For this reason these two categories are presented together in this section Together the two categories account for more than 20 percent of all transit buses and vans (the vast majority of which are 4-year vehicles) Automotive Minivan with Second-Stage
Raised Roof and RampModified Minivans (4-year vehicle) The automotive minivan is a popular choice in serving vanpools and paratransit operations for transit authorities These minivans are the same vehicles popular with large families because of their efficient use of space low floor and sliding doors For use in the transit industry minivans are often modified by second-stage manufacturers and equipped with wheelchair ramps and raised roofs Installing a wheelchair ramp requires major modifications to provide sufficient height clearance for the wheelchair and its occupant
Modifications typically involve cutting and removing the floor structure between the front and rear axles and welding a custom floor constructed from rectangular tubes that is lower by as
Federal Transit Administration 17
Useful Life of Transit Buses and Vans Chapter 2 Final Report FTA Service-Life Categories
much as six inches from the existing structure The modified floor necessitates rerouting of the exhaust system brake lines and electrical harnesses While lowering the floor is an extensive modification it enables the use of a ramp rather than a wheelchair lift Another approach to integrating a wheelchair ramp into a minivan is to raise the roof and add a raised top This modification increases the height of the opening enabling the wheelchair and its passenger to enter the van without restriction In performing this modification critical structure such as the point where the pillars and the roof structure come together are retained Other than these noted access enhancements these vans are used as they are sold to the general market with no further modifications
Full-Size Passenger Vans (4-year vehicle) With Full-Size Van Modifications the advent of the minivan full-size vans have become less popular with large families but remain popular in commercial applications and in serving vanpool and paratransit operations for transit authorities Since 1996 all full-size vans use body-on-frame construction meaning that the body is a separate component and physically mounts to the frame with bolts and rubber isolating bushings similar to the method used for trucks Modifications to full-size vans are limited to raised roofs and the installed wheelchair lifts These types of modifications are typically supported by the van manufacturer
Buses Built on Cutaway Van Chassis (4- or 5-year vehicle) Cutaway Van Chassis Cutaway chassis is a term the vehicle industry uses to describe a full-size van with the section of the body behind the B-pillar or the area aft of the front passenger seats removed These chassis are manufactured primarily by the domestic auto manufacturers including Ford GM and DaimlerChrysler Final-stage manufacturers take these cab chassis mount specialty-built bodies to the frame rails and integrate them with the remaining front cab section In doing so final-stage manufacturers provide custom-made bodies that better meet the requirements of their customers or targeted industry (eg transit) For transit bodies are constructed from a variety of materials including steel aluminum and fiberglass
Example Passenger Body Note here that the distinction between the 4- and 5-year vehicles is not well defined A general rule in making the distinction between them is that the 5-year vehicles generally feature higher capacity truck axles with dual rear wheels (versus single for the 4-year vehicle) higher capacity springs and other suspension components a somewhat heavier-duty frame and frequently a slightly wider body These differences support high passenger capacities and some additional durability as compared to the 4-year models
Federal Transit Administration 18
Useful Life of Transit Buses and Vans Chapter 2 Final Report FTA Service-Life Categories
Van and cutaway van chassis manufacturers provide detailed guidelines on approved modifications to their products Following these guidelines prevents the final-stage manufacturer from having to re-certify to federal emissions and safety standards
Vehicle Costs Table 2-7 presents typical purchase costs for light-duty 4- and 5-year buses
Table 2-7 Purchase Costs Light-Duty Buses (4-Year and 5-Year)
Model Types Cost
Modified Mini-Van (paratransit) $30000-40000 ndash mini-van platform $20000-30000 Full-Size Van (van pool) $25000-30000 Small Bus Built on Cutaway Van Chassis $50000-65000 ndash Cutaway van chassis $20000-30000
4-Year and 5-Year Vehicle Market More so than any of the other vehicle categories transit has very little influence on the design and manufacture of vehicles in these two categories For example of the 11 million minivans sold each year roughly 3000 are purchased and modified for transit uses (less than 03 percent of the total market) Similarly of the 370000 cutaway chassis sold annually roughly 2500 are purchased and modified for transit uses (a 07-percent market share)
Manufacturers Ford Motor Company General Motors and DaimlerChrysler are the three manufacturers building selling vans and supplying vans and cutaway van chassis to second-stage manufacturers for final assembly for the transit industry The manufacturers modifying these vehicles for transit uses are largely the same as that for the 7-year vehicle category These include Braun Corporation Champion Bus Eldorado National Girardin Corporation Goshen Coach Mid Bus National Coach Corp Starcraft Automotive Corporation Supreme Corp Turtle Top and Vision Point Mobility
Implications for the Current Service-Life Categories
In addition to providing the reader with some familiarity of the five current service-life categories the preceding review also supports some critical assessments of FTArsquos existing service-life policy and the broader issue of useful life in general These include the following questions bull Do the existing service-life categories ldquomake senserdquo bull Should FTA restrict the service-life categories in which vehicles are tested bull What leverage does the transit industry have in influencing vehicle useful life bull Do the service-life categories require periodic review
The following sections address each of these questions
Federal Transit Administration 19
Useful Life of Transit Buses and Vans Chapter 2 Final Report FTA Service-Life Categories
Do the existing service-life categories ldquomake senserdquo
A key objective of this study was to review and assess the appropriateness of the five existing service-life categoriesmdashnot just from the viewpoint of the useful-life values themselves (eg 12- 10- and 7-years) but also examining whether the groupings of vehicles in these categories ldquomake senserdquo Based on the review above it is clear that the five existing service-life categories do represent logical groupings of vehicles having broadly similar characteristics in terms of construction methods size weight passenger capacities cost and manufacturers (the following chapters address the actual useful-life similarities of vehicles in these five categories) Table 2-8 provides support for this view
Table 2-8 Comparison of Vehicle Types in FTArsquos Five Service-life categories
Category Typical Characteristics Minimum Life
Length ApproxGVW Seats Average Cost
(Whichever comes first)
Years Miles
Heavy-Duty Large Bus 35 to 48 ft and 60 ft artic
33000 to 40000 27 to 40 $325000 to
over $600000 12 500000
Heavy-Duty Small Bus 30 ft 26000 to 33000 26 to 35 $200000 to
$325000 10 350000
Medium-Duty and Purpose-Built Bus 30 ft 16000 to
26000 22 to 30 $75000 to $175000 7 200000
Light-Duty Mid-Sized Bus 20 to 30 ft 10000 to 16000 16 to 25 $50000 to
$65000 5 150000
Light-Duty Small Bus Cutaways and Modified Van 16 to 28 ft 6000 to
14000 8 to 22 $30000 to $40000 4 100000
As noted in the text above the key exceptions to this observation are the 4-year and 5-year vehicles built using cutaway chassis Here there is a significant degree of overlap between the 4- and 5-year vehicle categories in terms of construction type sizes vehicle weights costs and manufacturers It should also be noted that the useful life attributes of these two vehicle types were not found to be significantly different in the review of actual vehicle retirement ages presented in the next chapter However despite these similarities the review in this chapter and the analysis in succeeding chapters do not provide adequate grounds for combining these two into a single 4- or 5-year vehicle category
Should FTA restrict the service-life categories in which vehicles are tested
The preceding section suggests that FTA is well served by the five existing minimum service-life categories However this suggestion is subject to the important caveat that the bus testing program ldquoratesrdquo vehicles in the categories best suited to those vehiclersquos characteristics In recent years some manufacturers have successfully lobbied in a more durable category than would appear warranted by their vehiclersquos general characteristics (eg testing a bus with 10-year characteristics as a 12-year bus) This has resulted in service reliability issues and in some
Federal Transit Administration 20
Useful Life of Transit Buses and Vans Chapter 2 Final Report FTA Service-Life Categories
instances early retirement for the purchasing agencies when the tested vehicles were not found to have the expected durability
The next chapter further discusses the overall requirements of the bus testing program and its relationships to useful life The issue here is that while the category definitions appear sound based on this review of vehicle types the most significant limitation in the current five-category system may lie in permitting vehicles to be tested in a higher service-life category than the one that best suits the characteristics of their vehicle Given this consideration FTA may wish to more tightly control in which categories vehicles are eligible to test based on some combination of characteristics (eg gross vehicle weight seating capacity other) but with the potential for special waivers to test in a different category so as not to stifle innovation (Manufacturers should be required to provide reasonable justification as to why their vehicles should be tested in the higher durability category)
What leverage does the transit industry have in influencing vehicle useful life
The analysis above identified the origin markets for the chassis body and other components for each of the five vehicle categories A key objective of this analysis was to demonstrate that nearly half of the vehicle components for 12-year buses and a significant majority of the components for all other vehicle categories (including chassis engines and transmissions) are obtained from the heavy-truck and automotive markets Given that transit represents a very small proportion of these markets (generally less than one percent) the transit industry has little ability to influence the characteristics of these components including their useful life in a cost-effective manner
A key exception here is the structure of 12-year buses As discussed in Chapter 6 the useful life of a 12-year vehicle is determined primarily by the durability of its structure (as most major components are replaced or rebuilt over the life of the structure) To the extent that 12-year bus structures are designed and manufactured solely for transit use the transit industry has better ability to influence this componentrsquos design and durability characteristics (Although given the manufacturersrsquo small annual order sizes and local agenciesrsquo tight capital budgets funding such innovation is challenging in practice)
With most other components and nearly all other service-life categories this is not the case Hence for example the transit industry cannot significantly alter the useful life characteristics of minivans or buses built on cutaway chassis without incurring the cost of further customizing these mass-produced items to meet transit-specific needs In short for component types and vehicle types derived largely from mass-produced markets the industry is likely better served by adopting useful life expectations to the existing characteristics of these assets rather than attempting to further modify them to better suit transit
Do the service-life categories require periodic review
Finally the useful life and other characteristics of transit buses and vans do change over time with changes in technologies vehicle designs new propulsion technologies new materials etc Given this ongoing change the current five-category system may no longer effectively capture
Federal Transit Administration 21
Useful Life of Transit Buses and Vans Chapter 2 Final Report FTA Service-Life Categories
the useful life or other characteristics of the nationrsquos bus fleets (eg consider the possibility of more durable BRT vehicles with useful life characteristics closer to rail vehicles) Thus FTA should consider conducting periodic reviews of the service-life categories every 5 to 10 years
Federal Transit Administration 22
Useful Life of Transit Buses and Vans Chapter 3 Final Report Legislation and Procurement
CHAPTER 3 LEGISLATION AND PROCUREMENT
This chapter provides a review of legislative requirements other than the minimum service-life requirements themselves with emphasis on their potential useful-life implications This includes FTArsquos bus testing regulations and ADA Buy America and Clean Air Act requirements In addition the chapter considers the impacts of procurement methods and guidelines on useful life expectations Finally this chapter reviews prior FTA and industry studies on both the establishment and the consequences of FTArsquos existing minimum service-life policy
FTA Service-Life Circulars and Regulations
This section highlights the federal regulations that are relevant to the useful life of buses and vans (with the exception of the minimum life requirements themselves) While many of these regulations are found to have potential useful life implications the implications generally are considered minor relative to the issues of annual mileage new vehicle designs changing life-cycle economics and other drivers of useful life as considered elsewhere in this report
Buy America Regulation
Buy America requires that rolling stock (ie vans buses and rail cars) procured with federal funding must contain at a minimum 60-percent domestic content by cost and that final assembly takes place in the Unites States These requirements are designed to protect and ensure the longshyterm viability of the domestic bus and van market
This legislation is also suspected of having a negative impact on vehicle life expectancy Since bus manufacturers rely on the cost of major components (eg engine transmission and axles) to meet domestic content requirements the Buy America regulation in effect limits the amount of money a bus manufacturer can spend on the (foreign built) structure of the vehicle which tends to drive the vehiclersquos useful service life
For example North American Bus Industries (NABI) recently pulled the ldquoCompoBusrdquo from the US market This bus used an expensive and durable composite material for the vehiclersquos structure which performed extremely well at FTArsquos Altoona testing facility Unfortunately for NABI the higher cost of the structure prevented it from complying with the Buy America regulation and from staying price competitive in the US low-bid bus procurement market Manufacturing this composite structure in the Unites States was not considered an option given higher domestic production costs The resulting bus structure cost exceeded the comparable cost level of the standard steel structure cost making the CompoBus uncompetitive in a low-bid procurement environment
Bus Testing Regulation
The Bus Testing Regulation requires new bus and van models to be tested at FTArsquos Altoona Pennsylvania test facility before they can be purchased using federal funds The purpose of the
Federal Transit Administration 23
Useful Life of Transit Buses and Vans Chapter 3 Final Report Legislation and Procurement
testing is to provide vehicle performance information that grantees can use to help inform their purchase or lease decisions for new vehicles These tests do not assign pass or fail standards nor do they assign an overall vehicle performance grade Rather the testing process is only designed to report test results to the manufacturer and potential grantees The Altoona program consists of seven automotive tests including maintainability reliability safety performance structural integrity fuel economy and noise
Importantly the busrsquos performance on the structural integrity test is believed to correlate closely with the busrsquos structural performance in revenue-generating service This accelerated testing simulates up to 25 percent of the mileage accumulated by transit buses in revenue service Most bus manufacturers design their structures to minimize the failures that occur during testing Even the better manufacturers find themselves altering their designs based on testing results The impact of this testing on actual vehicle useful-life remains unclear It is certainly the case that manufacturers may beef up their structures to ensure that they pass the 25-percent accumulated mileage test On the other hand by designing their structures to minimize the specific types of failures that occur during testing manufacturers may not be fully addressing the long-term structural requirements to meet FTArsquos minimum life requirements
The Bus Testing Program may also have other useful life implications The tests performed by the program vary depending on the FTArsquos service-life categories with the tests becoming more stringent for vehicles with higher service-life minimums (eg testing is more stringent for a 12shyyear bus than for a 10-year bus and so on) Over time many manufacturers have lobbied to have their vehicles tested in a higher service-life category than might otherwise be expected given the characteristics of their vehicle (eg based on gross vehicle weight passenger capacity or length) Given the absence of a passfail or vehicle grading scale this allows a manufacturer to advertise that their vehicle has been tested as a ldquo12-yearrdquo bus when its design characteristics are really more similar to those of a typical 10-year vehicle While this vehicle may easily pass the 25-percent accumulated mileage test for a 12-year vehicle the structure may not withstand a full 12 years of hard revenue service In this case the Bus Testing Program may not impact useful life so much as potentially allow vehicles to be incorrectly classified
Americans with Disabilities Act (ADA)
The ADA requires that transit buses and vans are accessible to persons with disabilities Initially this requirement was fulfilled with lifts but more recently low-floor buses have become the preferred approach to fulfill the ADA requirements With the popularity of heavy-duty low-floor buses issues surrounding compliance with regulations such as maintaining wheelchair lifts are losing relevance on 12-year vehicles However buses in the lower service-life categories (eg 4- 5- 7- and 10-year) that are built on top of truck or school bus-based frame rail chasses continue to necessitate the use of wheelchair lifts This adds costs that have some effect on the economic measure of useful life A more important effect of this regulation is that low-floor buses may not have the same long-term structural integrity as more traditional bus designs This suspicion (voiced by some study interviewees) cannot be fully confirmed until more vehicles with this relatively new bus design approach and pass their useful life standards
Federal Transit Administration 24
Useful Life of Transit Buses and Vans Chapter 3 Final Report Legislation and Procurement
Environmental Protection Agency (EPA) California Air Research Board (CARB) and Clean Air Act
The EPA CARB and Clean Air Act Amendments affect the permissible emissions levels for buses and vans In general these regulations have little or no impact on the physical life expectancy of transit buses This is because emissions regulations only have implications for vehicle drive trains (ie engine and transmission) and these vehicle components generally have life expectancies much less than that of the vehicle structure (eg 250000 and 300000 miles for the engine and more than 5000000 for the structure) However to the extent that environmental regulations drive the costs of replacement engines and transmissions they can affect vehicle life-cycle economics (both nonrecurring capital costs and recurring operating and maintenance costs) and thus impact the ldquooptimalrdquo timing of vehicle replacement
Major changes to the emission regulations are occurring in calendar years 2007 and 2010 The 2007 emission standards will dictate the use of exhaust after-treatment technology such as diesel particulate filters (DPFs) Most of the 2007 diesel engines will also incorporate cooled exhaust gas recalculating (EGR) technology These technologies are available and impacts on service-life options are not expected
Procurement Methods and Guidelines
This section considers the impacts of procurement guidelines and different procurement methods on the life expectancy of transit buses and vans
Standard Bus Procurement Guidelines
In the mid-1970s FTA sponsored the development of standard bus procurement guidelines This document is commonly referred to as the ldquoWhite Bookrdquo (in reference to the color of its cover) Since then the American Public Transportation Association (APTA) has sponsored updates of the bus procurement guidelines and expanded them to cover new technologies such as low floors CNG and articulated buses The guidelines heavily influence the design and durability of heavy-duty transit buses The guidelines address all areas of the vehicle including component design performance materials corrosion protection structural integrity and warranties By establishing useful and well-followed industry standards this reference has indirectly helped to maintain bus and van useful life characteristics
A group of the larger transit agencies in the Northeast has developed a more extensive set of bus specifications to append to the APTA ldquoWhite Bookrdquo These specifications have been developed to procure buses that can operate more reliably in the more difficult duty cycle and operating environment of these urbanized areas The revised requirements are focused on more stringent structural integrity and corrosion prevention specifications These are the most important constraints to fulfilling the FTA minimum service-life policy in these operating environments and even extending these buses to as long as 15 years of service Examples include
bull The Washington Metropolitan Area Transit Authority (WMATA) uses these extended specifications to procure buses that can better fulfill the 15-year life objective established by its board policy
Federal Transit Administration 25
Useful Life of Transit Buses and Vans Chapter 3 Final Report Legislation and Procurement
bull New York City Transit (NYCT) the main initiator of the more extensive bus specifications was looking for a bus design that could achieve the 12-year service-life objective with reliable service in a slow-speed stopstart urban duty cycle in New York City
bull The Toronto Transit Commission (TTC) was part of this research and is now trying to extend its bus useful life to 18 years or longer to help address constraints on bus replacement funding
All three of these examples present different paths to the same prioritymdasha structurally stronger bus to provide a longer andor more durable service life in tough urban operating environments
Third-Party Contracting Requirements
The methods transit authorities use to procure buses have potential impacts on their useful life In particular use of the low-bid procurement method without establishing some critical pre-bid requirements can result in the purchase of a lower quality bus with a below-average life expectancy This is the result of fierce price competition (and cost reductions) to ensure a contract win Within a pre-bid environment the firm establishment of structural component requirements during the specifications stage is of particular importance to ensuring the minimum life requirements are attained All other bus components can be replaced as long as the main structure can continue service
Conclusions Impact of Regulations and Procurement Practices
In conclusion while many federal regulations and industry procurement practices are believed to have potential useful life implications these implications are generally considered minor relative to the issues of annual mileage new vehicle designs changing life-cycle economics and other drivers of useful life The key exception here is the low-bid procurement process which may yield vehicles with lower quality structures leading to reduced vehicle longevity To protect against this outcome agencies need to establish firm structural component requirements during the pre-bid stage to ensure the minimum life requirements are attained
Federal Transit Administration 26
Useful Life of Transit Buses and Vans Chapter 4 Final Report Average Retirement Ages
CHAPTER 4 AVERAGE RETIREMENT AGES
This chapter uses NTD data to identity the actual retirement ages for vehicles from each of the five existing bus and van service-life categories The analysis is then used to evaluate how closely these average retirement ages correspond to the FTA minimums for each category To a certain extent the observed difference between the observed distribution of actual retirement ages as compared to FTArsquos retirement minimums provides a measure of actual vehicle durability relative to the minimum retirement points However for many operators the difference between the FTA minimum and actual agency retirement age is also a reflection of agency funding limitations (ie some agencies would retire their vehicles sooner if sufficient funding were available)
Analysis of Actual Fleet Retirement Ages Using NTD Vehicle Data
All US transit operators receiving FTA Section 5307 Formula Funds are required to include a comprehensive listing of their transit bus and van fleet holdings as part of their annual NTD submissions These vehicle listings document the number of active vehicles age (date built) current year mileage life-to-date mileage make model fuel type length and passenger capacity of each sub-fleet operated by the reporting agencies (including vehicles operated directly by the agency as well as those operated by contract providers) Unlike the study survey data described in the next chapter (which only covers a small sample of the nationrsquos bus and van operators) NTD provides good quality empirical data on the actual retirement practices of virtually all US bus and van operators1
Conspicuously missing from this data (from the viewpoint of this study) is documentation of the service-life category to which each sub-fleet vehicle has been assigned (ie 12-year 10-year 7shyyear 5-year and 4-year) a limitation FTA may wish to address in future revisions to the NTD reporting requirements To a limited extent these useful life assignments can be inferred based on the vehicle size and carrying capacity data found in NTD In addition the make and model data recorded in NTD can also be compared to that found in FTArsquos bus testing records to help supply the proper assignments (although NTDrsquos make and model data are not always populated or use the same designations as the bus testing records) Both of these approaches have been used by this study to help document actual vehicle retirement practices for each minimum service-life category
Analysis of NTD Bus and Van Data
This study used NTD transit bus and van vehicle data to assess the extent to which agencies operate vehicles beyond FTArsquos minimum service-life requirements and the extent to which the minimum vehicle age acts as a constraint on the fleet retirement decisions of the nationrsquos transit
1 As of 2006 rural transit operators receiving FTA Section 5311 funds are also required to report on their bus and van vehicle holdings These data are not expected to be published until later in 2007 With the exceptions of Urban 5309 operators (who own more than 95 percent of the nationrsquos bus fleets) and Rural 5311 operators no other operator types are required to report to NTD
Federal Transit Administration 27
Useful Life of Transit Buses and Vans Chapter 4 Final Report Average Retirement Ages
operators This analysis provides the measure of average vehicle useful life identified in Table 1shy3 in Chapter 1
In conducting this analysis this study used the bus size classification employed by NTD prior to 2002 (at which time the pre-existing three-tiered bus size categorization based on seating capacity was consolidated into a single ldquoMotorbusrdquo category) This bus size classification provided a useful means to help segment bus vehicles into the five vehicle type categorizations as recognized by FTArsquos service-life policy In addition the vehicle model names manufacturer names and vehicle specifications as reported to NTD were thoroughly reviewed to ensure that all bus and van models were placed in the correct minimum service-life categories (using each vehicle modelrsquos Altoona bus test assignment) Vehicles that could not be definitively placed within one of these five categories were not included in this analysis The resulting data sample covers all years from 1995 through 2001 and included more than 500 transit operators
While NTD records the date built make and model of each agencyrsquos sub-fleets it does not record the actual retirement of these vehicles Therefore as a means of identifying when individual agency sub-fleets were retired the records for each sub-fleet were tracked from year to year (ie across multiple years of NTD submissions) This analysis then identified the point in time at which individual bus sub-fleets ldquodisappearedrdquo from the NTD record (ie the age at which sub-fleets were retired from service) These data were then aggregated across all operators and time periods to estimate the average actual retirement ages for each vehicle type Use of multiple years of NTD vehicle data was crucial to an accurate determination of these retirement ages However even with seven years of NTD data and over 500 different transit operators the sample sizes for the 10- 7- and 5-year bus categories remain relatively small Hence the analytic results for these bus types are less certain in comparison to the considerably more popular 4- and 12-year vehicle types
This analysis was used to identify the following for each vehicle category
bull Actual Retirement Ages Specifically the distribution of actual retirement ages and the average retirement age for each vehicle type (comparing two consecutive years of data to determine which vehicles were retired from one year to the next)
bull Percentage of Fleet Vehicles Exceeding the FTA Minimum and Later Age Values Given the problematic nature of comparing vehicle records across multiple years of NTD submissions the analysis also looked at the percent of active fleet that ndash Exceed the service-life minimum by one or more years ndash Exceed the service-life minimum by two or more years ndash Exceed the service-life minimum by three or more years and so onhellip
This analysis is very helpful in assessing the distribution of fleet vehicle exceeding the minimum retirement ages
bull Impact of the Minimum Service Requirement The impact that the minimum service requirement has on the actual distribution of retirement ages
Federal Transit Administration 28
Useful Life of Transit Buses and Vans Chapter 4 Final Report Average Retirement Ages
Analysis of 12-Year500000-Mile Vehicles
As noted earlier 12-year category vehicles account for more than three in four of the nationrsquos 90000 transit buses and vans
Figure 4-1 Retirement Age Distribution of 12-NTD data on vehicles in the 12shyyear500000-mile vehiclesyear500000-mile category show
that retirements peak at ages 14 through 17 and the average retirement age for vehicles in this category is 151 years (see Figure 4-1) Hence the vast majority of these buses are retired well beyond the 12-year and 500000shymile minimum For example more than three-quarters of retirements occur at age 14 or later In contrast only 6 percent of vehicles are retired at age 12 and only 7 percent at age 13 These results clearly indicate that the 12-year minimum itself is not a binding constraint for most transit operators since they operate buses well beyond this age
Figure 4-1 also suggests that some vehicles are retired prior to the 12-year minimum Many of these retirements consist of vehicles that have reached the 500000 minimum mileage prior to the 12-year minimum age (the chart shows the vehicle life-to-date mileage as of the year prior to vehicle retirement) However there are also a number of ldquofalserdquo retirements depicted in this chart that capture NTD data entry errors (or changes in reported vehicle names from one year to the next) and perhaps some vehicle trading between agencies Vehicle retirements prior to age nine were excluded from the calculation of average retirement age
While the analysis in Figure 4-1 is helpful in evaluating the distribution of retirement ages it has little to say about the impact of vehicle utilization on useful life In contrast Figure 4-2 presents the proportion of active 12-year buses that are older than 12 14 16 and 18 years respectively (on the horizontal axis) These proportions are further segmented by average annual sub-fleet mileages including groupings of vehicles with between 20000 and 30000 annual miles 30000 and 40000 annual miles and so on (with the 30000 to 40000 group further segmented between those agencies that do and do not perform comprehensive mid-life overhauls)2 As expected the proportion of vehicles exceeding each age group threshold declines as the age threshold increases Moreover while roughly one-third of all vehicles for operators with between 20000 and 30000 annual miles per vehicle remain in service after the 12-year minimum is passed a surprising 12 percent (roughly one in eight) of vehicles for operators with between 40000 and 60000 miles remains in service past age 12 (representing a range of between 480000 and 720000 life-to-date miles) Hence even the highest mileage operators some with vehicles well
2 Note that most US transit operators do not perform a comprehensive mid-life vehicle overall for their 12-year buses Moreover those agencies that do perform such overhauls have average annual sub-fleet mileages of between 30000 to 40000 miles
Minimum Replacement Life = 12
0
200
400
600
800
1000
1200
1400
1 2 3 4 5 6 7 8 9 10 11 12 13 14 15 16 17 18 19 20 21 22 23 24 25 Retirement Age
Num
ber o
f Bus
es
Mileage Unknown Mileage gt= 500000 Mileage lt 500000
Federal Transit Administration 29
Useful Life of Transit Buses and Vans Chapter 4 Final Report Average Retirement Ages
beyond the 500000-mile minimum still maintain their vehicles in service past the 12-year age minimum
Figure 4-2 Share of Active 12 Year Buses Exceeding Specific Age Levels
For Operators With Differing Annual Fleet Milage 40
Average Annual Miles per Fleet Vehicle 35
Shar
e of
Fle
et V
ehic
les
30
25
20
15
10
5
0
20000 to 30000
30000 to 40000 (Major Rehab)
30000 to 40000 (No Major Rehab)
40000 to 50000
50000 to 60000
Older Than 12 Years Older Than 14 Years Older Than 16 Years Older Than 18 Years
Age Group
While the proportion of fleet vehicles remaining in service declines for all annual mileage groups Figure 4-2 shows that the proportions in service remain fairly high past the 12- 14- and 16-year age thresholds for vehicles that do versus those agencies that do not perform a major mid-life overall These findings demonstrate the effectiveness (if not the cost effectiveness) of these rehabilitations in extending vehicle life
Finally Figure 4-3 repeats the analysis from Figure 4-2 but this time segmenting 12-year vehicles between the articulated (60-foot) standard 40-foot and 35-foot vehicle types3 This chart demonstrates that while the proportion of vehicles in service past 12 years tends to decrease with increasing vehicle length a significant proportion of the active vehicles for each of these vehicle types remain in service after 12 years (including one in four 35-foot vehicles one in five 40-foot vehicles and one in six articulated vehicles)
In summary this analysis suggests that the current 12-year requirement provides a reasonable retirement age minimum for large heavy-duty vehicle types This is because the majority of these vehicles are retired in the 6-year period following the service-life minimum with the average retirement age occurring roughly three years past the minimum (providing a cushion for the early retirement of poor reliability vehicles) Similarly the fact that most of the vehicle retirements for this group are concentrated in a 5- to 6-year period following the retirement minimum implies that the vehicles have roughly common useful characteristics providing some
3 Note As of 2005 NTD does not report many 30-foot buses with ages of 12 years or more
Federal Transit Administration 30
Useful Life of Transit Buses and Vans Chapter 4 Final Report Average Retirement Ages
validation to the current grouping of these vehicles within the same service-life category Finally regardless of annual vehicle mileage or vehicle length a significant share of the nationrsquos heavy-duty vehicles remains in service after the 12-year minimum and many with more than 14 years of service
Figure 4-3 Share of Active 12 Year Buses Exceeding Specific Age Levels
Articulated 40 Foot and 35 Foot Vehicles 30
25
Shar
e of
Fle
et V
ehic
les 20
15
10
5
0
Articulated
40 Foot
35 Foot
Older Than 12 Years Older Than 14 Years Older Than 16 Years Older Than 18 Years
Age Group
Analysis of 10-Year350000-Mile Vehicles
Figure 4-4 Retirement Age Distribution The number of 10-year vehicles of 10-year350000-Mile Vehiclesreported to NTD is far smaller than the
number of 12-year vehiclesmdashthese vehicles account for little more than one percent of the nationrsquos transit buses and vans (roughly 1000 active vehicles) Consequently the analysis of average retirement age for this category suffers from small sample issues (Figure 4-4) This data suggests an average retirement age of approximately 84 years which is obviously less than the minimum retirement age Hence the quality of the analysis for this vehicle category is clearly problematic (the study had
Minimum Replacement Life = 10
0
10
20
30
40
50
60
1 2 3 4 5 6 7 8 9 10 11 12 13 14 15 16 17 18
Retirement Age
Num
ber o
f Bus
es
Mileage Unknown Mileage gt= 350000 Mileage lt 350000
difficulty in effectively identifying this vehicle type based on the data reported to NTD) and requires a better data source to properly evaluate an actual average retirement ages
Federal Transit Administration 31
Useful Life of Transit Buses and Vans Chapter 4 Final Report Average Retirement Ages
Figure 4-5 Share of Active Vehicles Exceeding Specific Age Levels
For 4 5 7 and 10-Year Buses and Vans 35
4 Year
5 Year 30
Shar
e of
Fle
et V
ehic
les 25
20
15
10
5
7 Year
10 Year
0 Greater Than Min Greater Than Min Greater Than Min Greater Than Min Retirement Age Retirement Age + 1 Retirement Age + 2 Retirement Age + 3
Age Group
NTD could be used however to document the proportion of 10-year vehicles currently in service that exceed the 10-year minimum in age (see Figure 4-5) This analysis suggests that only 7 percent (or roughly one in 15) of these vehicles remains in service past the 10-year service-life minimum It is also clear from Figure 4-5 that the 10-year vehicle Figure 4-6 Retirement Age Distribution of type has the lowest proportion of active 7-year200000-mile Vehicles vehicles exceeding the service-life minimum of the five existing service-life categories This may suggest the need to reduce the minimum life requirement for this vehicle type by one or more years
Analysis of 7-Year200000-Mile Vehicles
As with the 10-year vehicle category the number of vehicles in the 7-year category is relatively small accounting for just over 2 percent of the nationrsquos active bus and van fleets (under 2000 vehicles) However the data quality for
Minimum Replacement Life = 7
0
10
20
30
40
50
60
70
80
1 2 3 4 5 6 7 8 9 10 11 12 13 14 15 16 17 Retirement Age
Num
ber o
f Bus
es
Mileage Unknown Mileage gt= 200000 Mileage lt 200000
this sample is believed to be superior to that for the 10-year category based on the review of the
Federal Transit Administration 32
Useful Life of Transit Buses and Vans Chapter 4 Final Report Average Retirement Ages
NTD records and points to an average retirement age of approximately 82 years with retirements spiking at 10 years (Figure 4-6) This figure suggests that seven years is an appropriate minimum retirement age for these vehicles as many operators are clearly able to keep vehicles past this age and are retiring their vehicles within roughly a three- to four-year period after the minimum requirement is satisfied Figure 4-5 also supports this finding with 12 percent (roughly one in eight) of the nationrsquos active ldquo7-yearrdquo vehicles having a current age of 8 years or more
Analysis of 5-Year150000-Mile Vehicles
Vehicles in the 5-year age category also Figure 4-7 Retirement Age Distribution of account for only a small proportion of the 5-year150000-mile Vehiclesnationrsquos bus and van fleet (about 14 percent of the total or about 1500 active vehicles) For this vehicle type the average retirement age was estimated to be 59 years (Figure 4-7) Most vehicles are maintained in operation up to and beyond the five-year minimum although the age of retirements peaks right at five years with a significant number at four years (presumably for vehicles that attain the required mileage before they are retired) As with the analysis for 10- and 7-year categories the 5-year vehicle analysis using NTD suffers from small
Minimum Replacement Life = 5
0
20
40
60
80
100
120
140
160
180
200
1 2 3 4 5 6 7 8 9 10
Retirement Age
Num
ber o
f Bus
es Mileage Unknown
Mileage gt= 150000 Mileage lt 150000
sample issues and this approach should be revisited at a future point in time using an improved NTD dataset
Analysis of 4-Year100000-Mile Figure 4-8 Retirement Age Distribution of Vehicles 4-year100000-mile vehicles
Four-year vehicles account for close to Minimum Replacement Life = 4 one-fifth of the nationrsquos total bus and van fleet or roughly 15000 active vehicles 1600
The NTD data indicate that most vehicles 1400
in the 4-year and 100000-mile category are retired between four and seven years of age The majority of vehicles are being retired past 4 years with the average retirement age around 56 years This N
umbe
r of B
uses
1200
1000
800
600
400
suggests that the four-year minimum 200
service age for this vehicle category is 0
appropriate for the characteristics of this vehicle type (Figure 4-8) The fact that most retirements occur after the
Mileage Unknown Mileage gt= 100000 Mileage lt 100000
1 2 3 4 5 6 7 8 9 10 11 12
Retirement Age
Federal Transit Administration 33
Useful Life of Transit Buses and Vans Chapter 4 Final Report Average Retirement Ages
minimum retirement age suggests that the current minimum is not binding for most operators (a desirable characteristic for a retirement minimum)
Similarly Figure 4-9 presents the proportion of active 4-year vehicles exceeding the 4-year minimum age and other age thresholds for operators with differing annual mileages per feel vehicle As with the similar chart presented above for the 12-year vehicle category even those operators with very high annual mileage per fleet vehicle have more than one in 10 vehicles exceeding the minimum age requirement On average roughly one in three active 4-year vehicles is age five or older
Figure 4-9 Share of Active 4 Year Vans Exceeding Specific Age Levels
For Operators With Differing Annual Fleet Milage 45
Shar
e of
Fle
et V
ehic
les
40
35
30
25
20
15
10
5
10000 to 20000
20000 to 30000
30000 to 40000
40000 to 50000
50000 to 60000
60000 to 70000
0 Greater Than Age 4 Greater Than Age 5 Greater Than Age 6 Greater Than Age 7
Age Group
Summary
Table 4-1 summarizes the results of the preceding analysis This analysis of NTD bus vehicle data demonstrates that the average retirement age for most bus and van types occurs after the minimum age requirement is met This finding supports continued use of the existing policy as it provides age minimums that are clearly less than (but within one to three years of) the average actual retirement age This analysis also suggests that vehicles retired prior to the current age minimum have satisfied the current mileage minimums Finally a significant number of vehicles are operated well beyond the minimum age requirement suggesting that well-maintained vehicles can be retained in service well past the expected vehicle useful life
The fact that most vehicles are retired one to three years after the minimum age requirement has been attained is not in and of itself proof that the ldquotruerdquo useful life values of these vehicle types is greater than the minimum life requirement In some and perhaps many cases the actual
Federal Transit Administration 34
Useful Life of Transit Buses and Vans Chapter 4 Final Report Average Retirement Ages
retirement age exceeds the minimum requirement due to funding constraints (ie many operators would replace their vehicles earlier given additional funding capacity) and not optimal or preferred retirement age considerations However that fact that so many vehicles are regularly operated well beyond the service-life minimum requirements clearly indicates that most vehicles types do have some useful service-life remaining well past the current FTA minimums
Table 4-1 Minimum Versus Average Retirement Age by Vehicle Category
Vehicle Category Minimum Retirement Age
Average Retirement Age (Years)
Share of Active Vehicles That Are One or more years past the retirement minimum
Three or more years past the retirement minimum
12-Year Bus 151 19 9 10-Year Bus 84 7 4 7-Year Bus 82 12 3
5-Year Bus Van 59 23 5 4-Year Van 56 29 10
Average retirement age estimates for this vehicle category suffer from small sample issues
The fact that vehicles in service past the service-life minimums continue to deliver valuable service is demonstrated in Figure 4-10 (12-year buses) and Figure 4-11 (4-year vans) Both of these charts present the average annual mileage by vehicle age for vehicles in low average and high-mileage fleets Both charts demonstrate that while annual service mileage tends to decline with vehicle age vehicles well past the minimum retirement age continue to see significant service miles Hence far from being delegated to support or special service vehicles vehicles exceeding the minimum retirement age continue to deliver a significant proportion of the nationrsquos transit services
Assessment of Existing Bus Type Categories Based on NTD Analysis
FTArsquos current bus category definitions were designed to be widely encompassing and include virtually any new rubber-tired vehicle intended for transit service and purchased with FTA funds In terms of actual vehicle characteristics (eg length passenger capacity GVW) the existing service-life categories show considerable variation in vehicle characteristics both between and within each category (eg 12-year buses range in length from 30 to 60 feet) The question then concerns how sensible these categories are based on the observed useful life experience of each category type
Based on the preceding analysis the 12-year vehicle type demonstrates the greatest consistency in vehicle retirement ages followed next by the 4-year vehicle category (refer to the relatively smooth shape of the retirement age distributions in Figures 4-1 and 4-8 above) These orderly distributions around a mean replacement age are indicative of commonality of their overall useful life characteristics In contrast the distribution of retirement ages for the 10- 7- and 5shyyear vehicle types is more disorganized (see Figures 4-4 4-6 and 4-7) While some of this disorganization is a function of the relatively small purchase quantities for these less popular vehicle categories it may also reflect greater dissimilarities in the designs of these vehicle types (given their smaller purchase quantities there is probably less industry impetus and opportunity
Federal Transit Administration 35
Useful Life of Transit Buses and Vans Chapter 4 Final Report Average Retirement Ages
for vehicle type standardization) Hence based on this analysis of NTD data the 12- and 4-year categories appear to ldquomake senserdquo while the logic of the 10- 7- and 5-year categories may benefit from further review
Figure 4-10 Annual Vehicle Mileage By Vehicle Age for Fleets With
Differing Mileage Levels 12-Year Vehicles
Ann
ual V
ehic
le M
ileag
e A
nnua
l Veh
icle
Mile
age
80000
70000
60000
50000
40000
30000
20000
10000
0
Low Mileage Fleets (lt20000 annual miles per vehicle)
Average Mileage Fleets (35000 annual miles per vehicle)
High Mileage Fleets (50000 annual miles per vehicle)
Very High Mileage Fleets (65000 annual miles per vehicle)
1 2 3 4 5 6 7 8 9 10 11 12 13 14 15 16 17 18 Vehicle Age (Years)
Figure 4-11 Annual Vehicle Mileage By Vehicle Age for Fleets With
Differing Mileage Levels 4-Year Vehicles 80000
70000
60000
50000
40000
30000
20000
10000
0
Low Mileage Fleets (lt20000 annual miles per vehicle)
Average Mileage Fleets (35000 annual miles per vehicle)
High Mileage Fleets (50000 annual miles per vehicle)
1 2 3 4 5 6 7 8 9 Vehicle Age (Years)
Federal Transit Administration 36
Useful Life of Transit Buses and Vans Chapter 5 Final Report Industry Outreach
CHAPTER 5 INDUSTRY OUTREACH
This chapter presents the results of the first set of industry outreach interviews for this study (the results of the second set of interviews are presented in the next chapter) This first outreach effort consisted of a set of detailed interviews with a sample of transit agencies vehicle manufacturers transit industry suppliers and private operators The purpose of the interviews was to evaluate how FTArsquos existing minimum service-life requirements impact agency and manufacturer decisions regarding vehicle design procurement and retirement The interviews were also designed to elicit industry responses to a range of potential changes to the existing service-life requirements and to obtain industry representativesrsquo suggestions on how the current requirements might best be modified Finally the first set of industry outreach interviews provided valuable vehicle life-cycle cost data including the cost and expected useful lives of all major vehicle components (data required to support the life-cycle cost analysis in Chapter 7) Upon completion of these initial interviews a second set of follow-up interviews was conducted to further investigate several issues identified in the original interviews This second set of interviews focused on bus engineering concerns and the results of these issues are considered in the next chapter
Transit Agency Participants
The research team developed an interview guide to assess the current experience of transit agencies with the FTA service-life requirements Questions covered areas such as vehicle replacement decisions alternatives to the current FTA policies maintenance practices and the impacts on service quality Responses to the transit agency interview guide were received from the nine transit agencies identified in Table 5-1
The responding agencies include a mix of operator types such as urban suburban and rural operators and represents operators with fleet sizes ranging from less than 40 to over 4000 vehicles Seven of the nine agencies have purchased some or all of their fleet vehicles using FTA funds and hence have fleet vehicles that are subject to FTArsquos minimum service-life requirements Three of the agencies that have purchased some but not all of their vehicles using federal funds (Montgomery County Ride-On Frederick County TransIT and Jefferson Transit) are subject to state-imposed minimum life requirements that are at least as stringent as FTArsquos) NYCT was included in the sample because of both its large size and its decision to use non-FTA funding sources as a means of having more control over vehicle testing Toronto was included because of the absence of an active federal bus funding program in Canada (or service-life requirements) and the consequent need to regularly maintain heavy duty vehicles up to and past age 18
Staff Interviewed
The staff interviewed for this study were all members of senior and mid-level management holding fleet management and fleet maintenance responsibilities These respondents included representatives of one or more of the following types of positions within their organizations bull Bus Operations Manager
Federal Transit Administration 37
Useful Life of Transit Buses and Vans Chapter 5 Final Report Industry Outreach
bull Chief Mechanical Officer bull General Manager (smaller agencies only) bull Superintendent of Engineering bull Equipment Maintenance Manager bull Director of Vehicle Maintenance
Table 5-1 Agencies Responding to Detailed Interview Guide
Operator Type Fleet Size (2005 NTD)
Vehicles Purchased Using FTA Funds
Los Angeles County Metropolitan Transportation Authority (Metro) Los Angeles CA
Major Urban 2815 Buses Most
Massachusetts Bay Transportation Authority (MBTA) Boston MA
Major Urban 1311 Buses 235 Vans
Yes
New York City Transit New York NY Major Urban 630 Articulated Buses 4024 Buses
655 Vans
No
Toronto Transit Commission (TTC) Toronto Canada
Major Urban 1508 Buses No
Washington Metropolitan Area Transit Authority (WMATA) Washington DC
Major Urban 1467 Buses 378 Vans
Yes
Capital Metro Austin TX Medium Urban 434 Buses 187 Vans
Yes
Ride-On - Montgomery County MD Suburban 341 Buses Some
TransIT Services of Frederick County Frederick MD
Small Urban Rural
55 Buses 8 Vans
Some
Jefferson Transit Jefferson County WA Rural 20 Buses 17 Vans
Most
It is important to note here that most staff interviewed had considerable familiarity with the useful life of heavy-duty transit buses (ie the 12- and 10-year FTA bus categories) but generally did not have a firsthand understanding of the 4- 5- and 7-year vehicle types This is in part due to the relative scarcity of the 5- and 7- year vehicle types and to the fact that these smaller vehicle types are typically operated and maintained by contract operators The exceptions here are Frederick County TransIT and Jefferson County Transit which both provided valuable insight on the smaller vehicle types
Agency Interview Guide Responses
This section presents the received responses to the study interview guide by the nine responding agencies Not all of the agencies responded to every question therefore the number of responding agencies is indicated for every question Appendix A provides a complete summary of all responses to the interview guide
Federal Transit Administration 38
Useful Life of Transit Buses and Vans Chapter 5 Final Report Industry Outreach
Agency Useful-Life Experience
This section focuses on the sample agenciesrsquo current vehicle retirement policies including their expected and scheduled replacement age by vehicle type and other criteria driving retirement such as duty cycle funding constraints or maintenance issues
Table 5-2 summarizes the planned and agency policy retirement ages for heavy-duty vehicles for each of the sample agencies Table 5-2 also shows the range of actual retirement ages for recently retired fleet vehicles and a brief listing of some primary drivers of these recent retirement decisions
Table 5-2 Planned and Recent Actual Retirement Ages Heavy Duty Vehicles
Agency PlannedPolicyRetirement Age
(Heavy-DutyVehicles)
State Retirement
Policy (if any) Actual Retirement
Experience Issues With Recently Retired
Vehicles
WMATA 15 years (imposed by WMATA Board)
No 15 to 16 years High maintenance costs reliability
TTC 18 years at 40000-45000 annual miles
No 18 Years High maintenance costs
Montgomery County
12 years Yes same as FTA for larger vehicles
Close to scheduled TMCs retired at 15 years Gilligs retired at 12 years
Any delays due to procurement requests or testingapproval TMCs retired due to high maintenance costs Gilligs retired because of no lift poor quality and high maintenance
New York City Transit
12 years Yes 7 years (for all bus types and sizes)
13-15 years had to retire Grummans before FTA minimum
Overage due to lack of funding availability Early retirement of Grummans due to heavy duty cycle
MBTA 12 years No Recent retirements at 16-19 years
Limited funding
Los Angeles Metro
13 years or 500000 miles
No Within 2 to 3 years of planned
Retirement beyond scheduled due to budget and legal consent degree obligations Early retirement due to fire andor beyond repair
Frederick 12 years Yes same as FTA for larger vehicles
Within 1-2 years of planned
Delay due to procurement requests
Federal Transit Administration 39
Useful Life of Transit Buses and Vans Chapter 5 Final Report Industry Outreach
Agency PlannedPolicyRetirement Age
(Heavy-DutyVehicles)
State Retirement
Policy (if any) Actual Retirement
Experience Issues With Recently Retired
Vehicles
Austin 12 years Not stated Within 1-2 years of planned TMC CNG buses recently retired 6 months early ndash FTA approved
Outdated CNG equipment
Jefferson Transit
15 years Yes similar to FTA
15 to over 20 years Physical condition duty-cycle maintenance requirements
There are two key observations to be noted in Table 5-2 First all nine of the agencies reported having a policy on the useful life of heavy-duty buses and four of these nine agencies have planned retirement ages that exceed the FTA minimum of 12 years (with Los Angeles Metro at 13 years WMATA and Jefferson Transit at 15 years and TTC at 18 years) Second the actual vehicle retirement for all nine agencies typically occurs between one to four years after the FTA minimum has been reached (but can occur as late as vehicle age 20) Moreover for seven of the nine agencies the actual retirement age also typically exceeds the (less stringent) planned or policy retirement age Given these observations it is clear that FTArsquos current minimum service-life requirement for heavy-duty buses is not actively constraining the agenciesrsquo retirement decisions (as retirements occur after the minimum retirement age has been reached) Limited capital funding was cited as the primary reason why the timing of actual vehicle retirements has exceeded the plannedpolicy retirement age by all but one of the responding agencies The lone agency Frederick stated that funding is not an issue although the state rarely provides as many vehicles andor funds as the agency has requested
When asked to report on the primary problems associated with recently retired vehicles the agencies cited issues relating to vehicle maintenance deteriorated physical condition and component and structural wear related to heavy duty-cycles FTArsquos minimum service life requirements were only cited by three of the nine agencies (Boston Los Angeles and Austin) and each of these agencies typically maintains its vehicles two or more years past the current FTA minimum New York ranked FTA requirements as the lowest priority as it does not purchase vehicles with federal funds
It is also important to note here that all but one of the agencies has had to retire vehicles prior to their planned retirement age and in one case prior to the FTA minimum (Austin retired a problem CNG vehicle prior to 12 years with FTA approval) The causes of earlier-than-planned retirements included problem vehicles with abnormally high maintenance costs a desire for equipment upgrades and damage beyond repair Boston is the only agency that did not report early retirement of its vehicles This is despite a tough operating environment and the frequent need to keep vehicles well beyond planned 12-year retirement age MBTA staff also stated their desire for an 8-year replacement cycle to eliminate the need for a mid-life overhaul and to maximize use of the latest bus industry technologies None of the agencies reported having to take advantage of FTArsquos ldquolike-kind exchangerdquo provision which permits early retirement of
Federal Transit Administration 40
Useful Life of Transit Buses and Vans Chapter 5 Final Report Industry Outreach
specific vehicles and assignment of the unamortized FTA interest in them to replacement vehicles
Mid-Life Overhaul Practices
Table 5-3 summarizes responses to the current practices for comprehensive ldquomid-liferdquo overhauls of vehicles This overhaul is applied to all of the agenciesrsquo larger (40-foot) heavy-duty cycle vehicles with the strategy of maintaining vehicles to meet or pass their scheduled retirement age Overhauls are typically timed with the expected life of major components (eg drive train rebuilds) while service on minor components is on an as-needed basis New York reported that mid-life overhauls are planned though not typically performed on all vehicles In this case the vehicles are rehabbed on an as-needed basis or on an individual campaign basis following a preventive maintenance strategy Washington DC states that it is looking into additional smaller overhauls at 3 9 and 12 years for other component replacements and upgrades On the other hand Toronto indicated that it is considering revising its current 6- and 12-year overhaul program to a program with a 9- to 10-year major overhaul and smaller component overhauls at other years due to the decline in provincial funding
Table 5-3 Mid-Life Overhaul Practices Heavy-Duty Vehicles
Mid-Life Overhaul
Number of Respondents Agencies
Approximate Cost perVehicle ($2006)
Additional Years
Expected Components
Yes 4 Washington Toronto New York
$110000 3 years Engine transmissions AC brakes and other major components
Yes 1 Boston $175000 6 years
Sometimes 1 Los Angeles Limited due to lack of manpower and funds
Not stated
No 4 Frederick Montgomery Jefferson
Not considered cost effective
It is important to note that the sample presented here is heavily biased in favor of those agencies that do perform mid-life overhauls (with four of the nine respondent agencies performing such overhauls on a regular basis) Based on a prior FTA condition assessment of 43 US transit bus fleets the practice of completing major mid-life overhauls is relatively rare with only seven of the assessed operators regularly performing a major rehabilitation (four of which are also included in the sample for this study) In contrast those agencies that do not perform a scheduled mid-life overhaul typically complete many of the same rehab activities over the life of the bus but on an as-needed basis (as opposed to a single coordinated effort) It is important to note that those agencies undertaking major mid-life rehab activities represent many of the largest in the nation and hence are of critical importance to this study
Federal Transit Administration 41
Useful Life of Transit Buses and Vans Chapter 5 Final Report Industry Outreach
Impact of FTArsquos Minimum Service-Life Requirements
Although some agencies have occasionally had to either retire a vehicle prior to the FTArsquos minimum age or lighten the duty of vehicles to reach these minimums the overall sense is that agencies are not directly impacted by the current FTA requirements This is because the agencies have a state or agency-imposed minimum retirement age which is more stringent than the FTA minimums andor are impacted by the availability of capital funding which forces them to keep vehicles longer than desired
When asked how the agency has been impacted by FTArsquos current minimum retirement ages all but one of the agencies reported no impact due to having other state or agency-imposed minimums (Washington Montgomery Frederick Jefferson) or not purchasing vehicles with FTA funds (Toronto and New York and for some vehicles Los Angeles Montgomery Frederick and Jefferson) Austin reported not being negatively impacted by FTA guidelines although it has had to retire some buses six months early due to outdated equipment which FTA approved Boston reported being impacted by FTA minimums due to the need for a mid-life overhaul to reach the current 12-year heavy-duty minimum
Although New York reported no current impact from FTArsquos policy it has had to retire a group of vehicles prior to the FTA minimum retirement age which consequently led to a change in its vehicle funding policy These vehicles were purchased with federal funds and thus the agency had to reimburse 80 percent of the purchase price which was taken from other projects This early retirement forced a delay in future bus procurements and was the reason behind the current policy to purchase all vehicles with state and local funds
In the absence of the FTA 12-year minimum retirement age Boston would consider retiring vehicles earlier at eight years to eliminate the need and large capital expense of a six-year midshylife overhaul and keep up with the latest vehicle technologies Toronto and Los Angeles reported interest in retiring vehicles earlier than their own self-imposed policies require although in practice this would not be possible due to funding constraints
Regarding the appropriateness of the current FTA policy four of the agencies (Montgomery Frederick Austin and Jefferson) indicated that the retirement minimums are suitable and did not recommend any adjustments or revisions It should be noted that these agencies did not report any major problems with vehicles and have retired vehicles close to their planned retirement age Specific recommendations to the current FTA minimum retirement ages were given by five of the nine agencies Table 5-4 summarizes these recommendations The main recommendations reported by various agencies are to include rehabilitation costs or extended warranties as reimbursable costs and to give the agency more options or discretion on retirement ages
Federal Transit Administration 42
Useful Life of Transit Buses and Vans Chapter 5 Final Report Industry Outreach
Table 5-4 Recommendations on Current FTA Policy
Agency Recommendations Washington ndash WMATA bull Include options for agencies
bull Include rehab costs and extended warranties as reimbursable costs (up to some of original costs)
Toronto bull Shorter service-life options are not feasible (due to heavy-duty and procurement methods)
bull Increase to 12 15 18 20 and 24 years at agencyrsquos option bull Include rehab costs in federal funding
New York bull Provide options bull Mileage looks high based on annual average bull Include rebuild costs as reimbursable expense (to improve maintenance) bull Include stipulations on FTA funds for rebuild bull Use bus testing for bus prequalification bull Consider shaker-table in bus testing bull Identify higher-level options in ldquoWhite Bookrdquo specs
Boston bull Reduce agemileage from 12 years500000 miles to 8 years300000 miles Los Angeles bull Age is acceptable however allow more discretion on vehicles not performing at
optimum level
Vehicle Service-Life Categories
To review the current FTA service-life categories the survey asked agencies for their opinion on alternative vehicle classes based on durability and procurement value These alternatives are summarized as follows
bull More durable (more expensive) vehicles for high-volume service with longer FTA minimum ages and mileage requirements
bull Less durable (less expensive) vehicles with shorter FTA minimum retirement ages and mileage requirements
bull Use of the agencyrsquos own engineering and economic analysis to determine best retirement age and rely on existing funding constraints to ensure a reasonable length of service life
bull Mix of durability and minimum agemileage at the procurement level (procurement options)
Appendix A presents each agencyrsquos specific responses to each of these options The following is a summary of those responses
More Durable Vehicles Six of the nine responding agencies stated they were not interested in a more durable vehicle (only two agencies expressed a clear interest in this possibility) This generally negative response reflected concerns relating to cost effectiveness weight rider comfort and the slower adoption of new technologies Some agencies state that a more durable vehicle type might be considered if its components were equally durable especially with the
Federal Transit Administration 43
Useful Life of Transit Buses and Vans Chapter 5 Final Report Industry Outreach
strain from heavy-duty cyclesmdashand thus would not increase maintenance needs or decrease quality
Less Durable Vehicles Interest in less durable less expensive vehicles was even lower with all nine agencies expressing significant concerns Some agencies stated these vehicles would not be appropriate for their duty cycles and others expressed concern over the relationship with the expected life of components a decrease in quality and the increase in procurement efforts An MBTA participant reiterated their interest in reducing the current FTA minimum for heavy-duty buses from 12 to 8 years
Agency Determined Retirement Age None of the agencies clearly objected to the alternative option of allowing agencies to use their own judgment in determining vehicle retirement ages (ie drop all minimum life requirements and rely on funding constraints to ensure vehicles are retained for reasonable service lives) Based on the current actual retirement ages of the nine responding agencies few agency vehicles would be retired before FTArsquos current minimums (as is already the case for funding reasons) One concern with this option as expressed by an NYCT participant is the capability of some agencies to accurately determine the best vehicle retirement age
Mix of Procurement Options As a starting point for discussion the interview participants were provided with the list of procurement options presented in Table 5-5 and were then asked to consider these options or provide similar ideas The concept of providing a mix of procurement options was generally negative with only three of the nine operators clearly interested in this possibility Concerns included skepticism over the ability of vehicle manufacturers to develop cost-effective vehicles with the longer life spans and the slower adoption of new technologies with long-lived vehicles Respondents were also concerned with the capacity of rehab vendors to meet increased demand and how rehab would be monitored and approved by FTA There were also concerns as to how the smaller medium and even some larger sized operators would implement this option given that the vast majority of these operators do not currently perform (or have the capacity to perform) mid-life rehabilitations In addition operators with low average annual vehicle mileages often do not have the need to perform a mid-life overhaul given their relatively low rate of vehicle deterioration
Allowing Earlier Retirement of the Existing Vehicle Types The agencies also provided their opinions on permitting earlier retirement of the existing FTA vehicle types Positive impacts stated include reductions in fuel and maintenance costs reductions in emissions (newer vehicles) increased customer satisfaction from newer technologies and reductions in average fleet age It was also suggested that few agencies would be able to take advantage of such a reduction in service-life requirements due to funding constraints
Extending Retirement of the Existing Vehicle Types On the other hand most of the agencies cited negative impacts from extending the current FTA minimum service life These negative impacts include a decrease in quality of service (higher rate of failures aesthetic of vehicles reliability) and an increase in maintenance costs (between 10- to 50-percent higher) However the agencies did not predict significant increase or decrease in emissions and energy efficiency
Federal Transit Administration 44
Useful Life of Transit Buses and Vans Chapter 5 Final Report Industry Outreach
Table 5-5 Potential Transit Bus and Van Procurement Options
Category Length Approx
GVW Seated
Passengers Minimum Life Rehabilitation
Years Miles Years Comp Heavy-Duty Articulated Bus
55 - 70 ft
38000 - 48 - 60 12 500000 6 30 15 650000 610 50 18 750000 6 10 15 75
Heavy-Duty Large Bus 35 - 48 ft
33000 - 40000
27 - 40 10 450000 5 20 12 500000 6 30 15 650000 610 50 18 750000 6 10 15 75
Heavy-Duty Small Bus 20 - 30 ft
26000 - 33000
20 - 35 8 300000 4 10 10 350000 5 20 12 400000 6 30
Medium-Duty and Purpose-Built Bus
20 - 30 ft
16000 - 26000
22 - 30 7 200000 5 20 9 250000 6 30
Light-Duty Mid-Sized Bus 20 - 35 ft
10000 - 16000
16 - 25 5 100000 4 10 7 150000 5 20
Light-Duty Small Bus Cutaways and Modified
16 - 28 ft
6000 - 14000
8 - 20 4 100000 na 0 6 125000 4 10
The rehabilitation columns define the potential years of the rehab to account for components that cannot achieve the extended life and the likely of components that will need to be replaced during those rehabilitations
Vehicle Components
The survey also asked respondent agencies about the life expectancy of individual bus and van components and how these expectancies affect the decision to retire andor rebuild vehicles Unfortunately only three of the agencies responding to the survey provided detailed information on the life expectancy and costs of the requested list of vehicle components (see Appendix E) Given the small agency response rate this data was appended with manufacturer responses and other industry data to help guide the life-cycle cost analysis in Chapter 7
Cyclical Nature of Component Replacements However the data reported by those few agencies do clearly show that the expected life of major body components such as the structure and panels aligns closely with each agencyrsquos scheduled vehicle retirement age Similarly engine and transmissions have an expected life of approximately half or one-third of this retirement age which is roughly in line with the responses on mid-life and other scheduled overhauls When viewed in total the timing and cost of major vehicle component replacements are such that component replacement costs peak in cycles throughout the life of the vehicle with minor cost peaks occurring roughly every three years and major peaks every six years4 (The six-year peak corresponds closely to the drive train rebuild see Figure 7-6 in Chapter 7) As discussed in more detail in Chapter 7 these cost cycles help to define the logical retirement points throughout a vehiclersquos life Specifically an operator will only perform a major life-extending rehabilitation if the operator intends to operate the vehicle for an additional three to six years Otherwise the decision to undertake the life-extending rehab is not cost effective
4 The actual timing depends on average fleet mileages maintenance practices duty-cycles and other factors
Federal Transit Administration 45
Useful Life of Transit Buses and Vans Chapter 5 Final Report Industry Outreach
Component Determinants of Vehicle Useful Life When asked to consider which components drive or define the useful life of the vehicle as a whole several of the agencies identified the condition of structural members including the impact of corrosion as the key driver of total vehicle useful life Two agencies (Frederick and Montgomery) stated that specific or individual components are not the direct drivers on vehicle retirement decisions but the general conditions of the vehicle (maintainability reliability of components etc) Boston reported its retirement decisions are age-based and not component-based and also stated that components are not expected to last beyond 12 years
Besides structural members other components listed as important to the vehicle replacement decision include the electrical system suspension exterior and floors Conversely among the components listed as having no impact on retirement decisions include doors brakes windows and wheel chair lifts
Other Issues Impacting Useful Life
Survey respondents were also asked to consider issues suspected of having indirect impact on the useful life of buses and vans such as procurement policies and other federal regulations
Procurement Processes The agencies were asked to report the procurement process typically used and any effects this process has on the expected useful life of vehicles Most of the agencies reported using a best value request-for-proposal process based on price and other factors These agencies feel this process is better than low-bid as higher quality products are expected or can be negotiated
The transit agencies interviewed universally agreed that using a low-bid procurement approach negatively affected the bus useful life To mitigate this some agencies have taken a much more rigorous approach to specifying bus structure life requiring finite element analysis of the structure shaker table tests or strain gage testing in the agencyrsquos operating environment However even those agencies that did not detail bus structure requirements acknowledged that it was important to state minimum bus life requirements in their specification Agencies reported that low-bid procurements resulted in buses that were lower in quality and designed to just fulfill the minimum bus specifications used in that procurement In the interviews one agency noted that manufacturers have only two options to reduce their pricemdashone is to use lower costlower quality components and the other is lower paidless skilled labor in vehicle assembly With all of the North American bus manufacturers struggling financially agencies feel that manufacturers have adopted both approaches
All agencies agreed that the bus structure is the key determinant of bus life The other bus components and systems can be replaced as long as the main structure can continue in service Negotiated procurements instead of low bid can benefit an agency and get additional features such as stainless steel that are advantageous in extending the life of the structure However those agencies that are using a best-value negotiated procurement approach are not doing so primarily to extend bus useful life The main motivations for a negotiated procurement are to get the best mix of desirable features and highest reliability for the agency to reduce operating costs
Federal Transit Administration 46
Useful Life of Transit Buses and Vans Chapter 5 Final Report Industry Outreach
Buy America Regulations Agencies were also asked if Buy America regulations have affected the quality andor useful service life of vehicles Two of the agencies who responded to this question stated that these requirements do in fact have an impact specifically on how the limited market impedes the implementation of the latest design features or technologies Boston reported that the reduction of minimum life of heavy-duty vehicles to eight years would assist in fulfilling this provision differently while Austin reported that useful life is dependent on the procurement process of the agency WMATA staff also noted that this regulation can limitaffect how a manufacturer develops structure (the largest component manufactured abroad and hence budget constrained to meet the Buy America requirements) Given that structure is typically the largest component ultimately defining the total useful life of the vehicle a less expensive (lower quality) structure will result in a lower life expectancy vehicle This regulation does not directly affect three of the agencies (Toronto Frederick and Montgomery) while responses were not received from the remaining agency (New York)
Bus Testing Program Another indirect factor that may potentially affect the purchasing and retiring of vehicles is the Bus Testing Program conducted at Altoona PA Five of the respondent agencies reported using the bus testing results in the procurement process to establish performance requirements This included reviewing the testing results in writing specifications evaluating bids and discussing purchases with vendors However these agencies recommended that the actual test results would provide the agencies with more information to evaluate vehicles in the procurement process One respondent was fairly critical of the value of the testing program itself suggesting that competition between vendors is a more effective (and less expensive) means of ensuring product quality and longevity
ldquoWhite Bookrdquo Procurement Guidelines The survey also asked respondents about the influence of the ldquoWhite Bookrdquo procurement guidelines on vehicle durability and expected service life Five of the agencies agreed that the procurement guidelines should be adapted to include alternative service-life options to reflect differences in vehicle designs One agency noted the importance of recognizing the difference in the strain applied to urban heavy duty-cycle vehicles as compared to other service environments (10-year urban vs 15-year suburban) while another agency reported using more arduous specifications in its procurement than those in the guidelines The agencies were also asked whether they would consider the use of design specifications for a 10shyyear and a 15-year vehicle if retirement at those ages were allowed by FTA policy Table 5-6 summarizes the responses to these questions
Table 5-6 illustrates a split in whether agencies would consider the change in design specifications As expected those agencies that would find the 10-year bus design specification a positive change (Boston and Los Angeles) also have expressed difficulty in maintaining vehicles past the current 12-year minimum and support the shortening of minimum service life These two agencies are characterized as heavy metropolitan areas and as such tend to be more severe on vehicles In contrast agencies that would consider the 15-year and not the 10-year design specifications (Washington and Toronto which also have tough urban operating environments) already have policies in place to retire vehicles at that age and beyond
Federal Transit Administration 47
Useful Life of Transit Buses and Vans Chapter 5 Final Report Industry Outreach
Table 5-6 Design Specifications of 10- and 15-year bus
Vehicle Category Number of Agencies Notes
Would you consider the use of design specifications for a 10-year bus Yes 2 If the bus components remained at 12-years
Do not necessarily agree funding should be tied with age No 2 Board policy does not allow lower minimum age
Maybe 1 No answer provided 4
Would you consider the use of design specifications for a 15-year bus Yes 3 Already used by agency
Work on specifications for longer-life bus needed No 3 Too long would not hold up in urban environment
No answer provided 3
The respondentsrsquo lack of experience with lighter-duty vehicles limited the review of whether agencies would consider different service-life options for medium and light-duty buses and vans Only two agencies responded to this survey question Austin stated that the market for light-duty vehicles is as it should be while Boston would like to see a change in service-life options for smaller vehicles Jefferson County one of the few respondents with a good understanding of light-duty vehicle characteristics already uses more stringent retirement ages for the smaller vehicle types including a target retirement age of 9 for ldquo7-yearrdquo vehicles a target retirement age of 8 for ldquo5-yearrdquo vehicles and a target retirement age of 5 for ldquo4-yearrdquo vehicles
Used Bus Disposal Under current regulations operators are required to compensate the federal government if a transit bus is retired and sold prior to meeting the FTA retirement minimum After that point in time the operator can retire the vehicle and sell it either as a used vehicle or for scrap value If the book value of a bus being sold is more than $5000 then FTA requires the agency to reimburse them (in practice the amount of the reimbursement is subtracted from the agencies next available FTA funding certification for the purchase of new buses)
Most agencies reported selling their used vehicles in bulk for their salvage value with the sale price based on the quantity and the condition of the vehicles sold and with scrap value ranging from roughly $3000 to just $50 per bus If the bus is in good shape upon retirement agency maintenance staff will typically scavenge the functioning parts and the bus will be left in poor condition to be sold for less than $500 In some cases the retired vehicles are sold either to other transit operators or to non-transit entities Agencies indicated that these sale prices are typically in the low thousands Regardless of how the vehicles are disposed the funds obtained from bus sales or salvage represent only a small fraction of the original purchase price and the funds received from these sales are generally deposited in the agencyrsquos general fund (and hence not used specifically for the purchase of new vehicles) Agencies reported that given the low dollar amounts involved sale and salvage value funds do not play any role in agenciesrsquo vehicle retirement decisions
Federal Transit Administration 48
Useful Life of Transit Buses and Vans Chapter 5 Final Report Industry Outreach
Other Procurement Issues
The last section of the survey asked respondents to reiterate any difficulties in the procurement of vehicles and in maintaining them past their minimum service life As previously reported most agencies have had to retire vehicles prior to their scheduled retirement age These vehicles were reported to have high maintenance costs and the most common way to deal with them was to lighten their duty cycle while two of the agencies reported retiring vehicles due to outdated components
Interest in a ldquoLemon Lawrdquo Respondents were asked whether they would be interested in the creation of ldquolemon lawrdquo providing agencies with an opportunity to retire problem vehicles prior to meeting the service-life minimums without financial penalty The question did not specify how that option would be structured or what standards would be applied in identifying a ldquolemonrdquo vehicle With the exception of New York who did not respond to this question all of the agencies agreed that a potential ldquoLemon Lawrdquo consideration within the FTA service-life policy is a very desirable option However the agencies expressed concern over the enforcement of such options the performance measures used to justify early retirement (the suggestion was that these should be established based on a vehiclersquos performance industry-wide not within a single agency) and the quality aspects from the manufacturersrsquo and suppliersrsquo side Table 5-7 summarizes the individual agenciesrsquo responses
Table 5-7 Responses to Exceptions to FTA Guidelines
Agency Consideration and Potential Constraints to ldquoLemon Lawrdquo
FTA Demonstration Program or Waiver Aspect
Washington Good though difficult to enforce Should be industry-wide finding of poor performance (not just agency with poor procurement) Agency to decide optimum retirement Ensure funding of remaining years is rolled
Good help industry move forward and introduce new technologies
Toronto Yes as corrosion and structural problems made it difficult to maintain vehicles to 12 years
Procurement of lease of prototypes of buses from different manufacturers to test before selection
Montgomery Good idea (No response given) Boston Yes with constraint that manufacturers ensure integrity
and durability (maintain quality with minimal maintenance) No interest in program
Los Angeles Yes if necessary Option should not be used if normal warranty period is complete andor operating cost is substantially different from rest of agencyrsquos fleet
Yes
Frederick Yes with conditions of applicability defined Suggest option only to limited and serious conditions
Not applicable as a smaller agency with limited staff and capabilities
Austin Yes if dealt with bus supplier Yes Jefferson Yes good idea Not helpful for smaller agencies
Federal Transit Administration 49
Useful Life of Transit Buses and Vans Chapter 5 Final Report Industry Outreach
Useful Life Waiver for New Technology Demonstration Programs Table 5-7 also summarizes the agenciesrsquo responses regarding interest in and proposals of an FTA demonstration program or waiver aspect to test alternatives concerning service-life requirements The objective would be for FTA to help encourage agencies to test and adopt new technology vehicles with the guarantee that the agency can retire test vehicles before the service-life minimums have been met if the technology proves problematic
Summary Agency Outreach
It is important to note that a survey of nine agencies is not a statistically representative sample however the surveyed agencies provide valuable insight on the effects of and recommendations to the current FTA service-life policy Due to the limited sample size the initial findings presented in this section can be strengthened with further investigation
Of the nine agencies responding to the survey seven have a policy on minimum retirement life not imposed by FTA This policy is imposed by either the state or the agency itself and is typically more stringent than the current FTA minimum of 12 years for heavy-duty larger buses Moreover all of the respondent agencies are retiring their vehicles one to five years past the FTA retirement minimums and one to three years past their own agency-imposed (typically more stringent) retirement minimums Retirements past the planned retirement age have mainly been driven by the limited availability of capital funding while early retirements have been caused by high maintenance costs or equipment update It is important to note that these high maintenance needs are primarily linked to agencies with heavy to severe duty cycles in large metropolitan areas such as Boston New York and Los Angeles
Agencies recognize the importance of maintenance and overhauls specifically mid-life in order to reach and keep vehicles past their scheduled retirement age However the timing and extent of these maintenance needs are also limited by the availability of capital funding Moreover major mid-life life-extending overhauls are only performed by a relatively small number of the nationrsquos largest transit operators
Given these observations it is clear that the current FTA retirement minimums are not constraining the retirement decisions of most transit operators Indeed the retirement ages for the majority of the vehicle retirements documented by this study would not be altered by modest changes (eg plusmn one year) to the current FTA minimums In fact several retirement decisions may not be impacted by the removal of the FTA minimums Key exceptions here are New York and Boston New York actually changed its policy to not purchase vehicles with federal funds after having to retire vehicles early and reimburse FTA part of the purchase price Boston would prefer an eight-year minimum retirement to maintain higher quality and avoid the major capital expense of a mid-life overhaul With these exceptions the greatest impact of the current retirement minimums occurs when operators find themselves with problem vehicles struggling to meet the FTA minimums In these instances agencies are forced to absorb the cost of maintaining the vehicles place these vehicles on reduced service requirements andor seek FTA approval for early retirement
Federal Transit Administration 50
Useful Life of Transit Buses and Vans Chapter 5 Final Report Industry Outreach
Despite these observations many of the agencies recommended several changes to the current FTA policy such as the potential inclusion of rehabilitation costs as a reimbursable cost and the provision of flexibilityoptions to agencies in vehicle retirement Agencies also expressed interest in the potential introduction of a ldquoLemon Lawrdquo allowing early retirement of problem vehicles without financial penalty Interest in lowering the minimum retirement age was only considered desirable by some agencies as long as the quality of the vehicle is unchanged (ie not reduced to a less durable less expensive vehicle) The benefits of this change would include the reduction in maintenance costs and the ability to implement and keep up with the latest vehicle technologies On the other hand extending the minimum retirement age was not considered desirable to agencies expressing concerns over the expected decrease in quality of service to passengers and the increase in maintenance costs
Vehicle Manufacturer Response
The research team developed an interview guide to assess the current experience of vehicle manufacturers with the FTA service-life requirements Questions covered areas such as the effects of FTA requirements and regulations customer (transit operator) useful life expectations and life expectancy of vehicle components While a total of nine different North American vehicle manufacturers were contacted for this study only three manufacturers provided responses and completed the interview guide Table 5-8 lists these three vehicle manufacturers and the title of the key contact for their organization
Table 5-8 List of Vehicle Manufacturer Respondents
Bus Manufacturer Contact Title Interview Guide
Response Received and Completed
Orion Director of Engineering Yes Optima Bus Corp Marketing and Sales Manager Yes Millenium Transit President Yes
This section synthesizes the responses received in a narrative or tabular format Not all of the vehicle manufacturers responded to every question A complete summary of all vehicle manufacturer responses to the interview guide is provided in Appendix B
General Vehicle Useful-Life Expectations
The three vehicle manufacturers that responded to the interview guide surveyed currently manufacture different models of heavy-duty vehicles with lengths of 30 to 40 feet and capacities ranging from 23 to 47 passengers Although one of the manufacturers did not provide a detailed listing of its vehicle offerings all of the manufacturers are in the heavy-duty 12-year minimum vehicle market Both of the manufacturers reporting details of their current models stated a minimum life of 12 years although Orion reports its vehicles have a life expectancy of 18 years while Optima reports its vehicles have a life expectancy of 12 years All three manufacturers market their vehicles based on FTA service-life categories
Federal Transit Administration 51
Useful Life of Transit Buses and Vans Chapter 5 Final Report Industry Outreach
The manufacturers sell vehicles that are not subject to the Bus Testing Regulation such as Orionrsquos Sprinter van which is typically purchased by smaller agencies with local money The other two manufacturers did not detail specific vehicle models but Millennium reported that buses sold in Canada (although the same bus) are not subject to these regulations and Optima has been granted a waiver for additional testing on one of its current models
With regard to expected service life characteristics requested by their customers Orion Bus Industries is the only manufacturer to report specific requirement characteristicsmdashCanadian operators look for 18-year service life vehicles with longer warranty periods and extensive resistance to corrosion for those operators in the Eastern part of Canada where vehicles are affected by the high-salt environment The other two manufacturers stated simply that agencies are looking for durable vehicles that will last and exceed the minimum retirement ages However these manufacturers report that the vehicle retirement age is largely dependent on each individual agencyrsquos annual mileage operating environment (severity) agency maintenance practices and quality of service standards
This opinion regarding the impacts of operating environment and duty cycle on the conditionlife of vehicles is also reflected in the manufacturersrsquo responses to recommending a mid-life overhaul Two of the manufacturers reported that they could not recommend specific mid-life overhauls because the vehiclersquos conditions and the need for a mid-life overhaul depend on each operatorrsquos specific annual mileage environmentduty-cycle and maintenance practices The other manufacturer reported neither recommending nor participating in fleet rehabilitations as these activities offer no benefits to their business Among the components listed as typically needing replacement are the engine transmissions suspensions and axle Optima is the only manufacturer that reported providing a recommended component maintenancereplacement schedule which is included in this report as Appendix D This manufacturer also reported that the approximate cost of replacement of those four components listed above is $18000 per vehicle
FTA Minimum Service-Life Requirements
All of the manufacturers stated that they are impacted by the FTArsquos current minimum retirement ages and that the 12-year minimum age is a benchmark in this heavy-duty market Design specifications are driven by the demand of vehicles that will last up to and beyond this 12shyyear500000-mile benchmark such as the use of stainless steel or aluminum instead of mild steel to meet the corrosion requirements (as reported by Millennium) The manufacturers also structure their marketing strategies around this minimum retirement age (ie clearly stating the minimum life standard their vehicles have been tested to meet) which they believe affects the overall demand for their vehicles the relationship with their customers and the sales of vehicle parts One manufacturer specifically stated that a change in the 12-year minimum would directly impact its demand for vehicles and its competing markets (heavy-duty vs light-duty market)
The argument that reductions in FTArsquos minimum life requirements would directly result in accelerated vehicle sales and hence a significantly deeper more sustainable bus market should be tempered by the understanding that very few operators retire their vehicles right at the service-life minimums due to funding limitations (as shown in Chapter 4 and the preceding section of
Federal Transit Administration 52
Useful Life of Transit Buses and Vans Chapter 5 Final Report Industry Outreach
this chapter) To be clear a reduction in the FTA minimums would yield some additional sales at the margin but the increases would not be significant as most operators do not retire their vehicles until two or more years after the 12-year minimum has been reached In contrast increases to the service-life minimums by two or more years would likely result in a perceptible decrease to annual vehicle sales (see Figure 4-1)
The primary vehicle component listed by all of the manufacturers as being impacted by the FTA requirements is the structure andor chassis which is expected to last the 12 years without major failures as it cannot be rebuilt or replaced Other components listed include the engine body axles suspension and transmission However these were not considered significant to the life of the structurechassis in determining vehicle useful life
As previously noted the only market of customers requesting vehicles with expected life values different than FTA minimums is the Canadian market where vehicles are specified for 18-year service life Orion also reported that some of its customers ask for a 15-year design life for the chassis or other components such as CNG tanks with a service life of 15 to 20 years
The survey also asked manufacturers about recommendations or changes to the current FTA minimum ages None of the manufacturers provided or recommended specific changes and in fact Millennium reiterated that any changes to these minimums would have negative impacts to its current market However two of the manufacturers (Orion and Optima) stated that the FTA minimum retirement ages are arbitrary because they are driven by the FTA Altoona Bus Testing classifications and manufacturers are able to choose the category under which to test their bus Thus there is the potential of buses claiming a false durability of 12 years Recommendations in this area would include revising regulations to a less arbitrary more objective intense testing and providing more detailed reports of the testing results (passfail failure types etc)
Vehicle Life Classification
Another section of the survey reviewed the current FTA classifications by vehicle type and intended duty cycle as they relate to the FTA minimum retirement ages and examined the potential of other alternatives With regard to the appropriateness of the current FTA classifications Orion stated that this classification conflicts with EPA definitions and that the categories are not definite enough (weight classes are too loose) Optima reiterated that the minimum retirement ages are based on the FTA Altoona Bus Testing requirements which make vehicle classification arbitrary as manufacturers choose the category to test under and vehicles receive this classification regardless of length of time to complete or how it holds up In Optimarsquos opinion manufacturers can test buses at the highest possible classification to give them a marketing edge in spite of the testing results on quality or durability In short the manufacturers generally had few concerns with the current categories but some manufacturers had significant concerns with how those categories are applied in practice particularly in relation to the bus testing program
Vehicle manufacturers were also asked their opinion on potential longer-life and shorter-life vehicle options Table 5-9 summarizes their responses Two of the three manufacturers (Millennium and Optima) do not believe a longer-life more durable vehicle can be manufactured
Federal Transit Administration 53
Useful Life of Transit Buses and Vans Chapter 5 Final Report Industry Outreach
because more durable components cannot be produced If such a vehicle were manufactured it would be heavier (increased GVW) more expensive and likely less economical (fuel efficiency purchase price) The option of a less durable less expensive vehicle also received differing interest although the main characteristic and challenge to manufacturing this type of vehicle would be the decrease in component quality (ie having to rely on lower-cost components) One manufacturer expressed concerns about the feasibility of manufacturing a safe shorter life vehicle option that was ldquocost-neutralrdquo (as compared to existing 12-year models) The concern being that the required reductions in structural cost to make the vehicle cost competitive may also lead to structural issues Optima stated that another vehicle option for FTA to consider is the new hybrid electric vehicle with diesel or gasoline engines powering electric motors
Table 5-9 Opinions on Alternative Set of Vehicle Life Spans
Vehicle Life Orion Millennium Optima Longer-life more durable vehicle
Interest characteristics of
vehicle
Yes ndash would have to be more resistant to corrosion and heavier
No ndash already build most durable buses out there
No ndash components would not survive longer life duty cycle also important in affecting retirement
Challenges Encouraging modular design Rebuild cycles would affect supply of parts
Supporting technologies for long periods of times
Cannot increase life expectancy of components Higher price vehicles
Shorter-life less durable vehicles Interest
characteristics of vehicle
Yes (cater to different needs of transit operators) ndash lighter weight lower-cost components
No ndash eliminating options low-cost components
Not part of market niche
Challenges Establishing market Getting cost reductions from components not structure
Not part of market niche
Vehicle Components
This section of the survey summarized the manufacturersrsquo experience with individual components and their relationship to the expected service life of vehicles All of the manufacturers agreed that the life expectancy and maintainability of vehicle components affect the service life and vehicle retirement decision with the main component being the structure andor chassis As previously reported manufacturers expect these components to endure without major failures in order for vehicles to reach the FTA minimum retirement ages Millennium also listed the engine transmission and axles as vehicle components that also impact service life On the other hand vehicle components not affecting service life included seats radios fare boxes glasswindows and other destination announcement systems However two of the manufacturers listed that the life expectancy of engines and brakes are driven by other markets besides the bus industry
Federal Transit Administration 54
Useful Life of Transit Buses and Vans Chapter 5 Final Report Industry Outreach
Table 5-10 summarizes the design challenges to vehicle components reported by the manufacturers in the construction of vehicles with increased life expectancy and of vehicles with decreased life expectancy
As expected the responses from this section are in line with those reported in previous sections of the survey on the overall life expectancy of vehicles The FTA minimums impact the design specifications of vehicles especially the structure andor chassis which is a primary driver of retirement decisions because it cannot be economically rebuilt or replaced The manufacturing of longer-life vehicles is limited by the life expectancy of components as they are currently not built to last longer or have replacementmaintenance schedules in line with the expected life of the vehicle Conversely manufacturing shorter-life vehicles would involve lower-cost lighter-duty components (such as those in the truck and automotive industry)
Table 5-10 Component Challenges to Vehicle Options
Component Challenges Orion Millennium Optima
Longer-life vehicle No challenges ndash 18-year bus already built
Warranty on engines and batteries remains unchanged
Obsolescence of parts Affected components chassis engines transmissions electronic systems HVAC systems and others
Shorter-life vehicle Take out cost with reduced service life smaller engines lighter axles
Lighter-duty components mild steel structure
Downgrade of design need for change in industry mindset for lower-life vehicles
Summary Vehicle Manufacturers
It is important to note that the three vehicle manufacturers surveyed are not a statistically representative sample however they do provide valuable insight on the effects of and recommendations to the current FTA policy on useful life of buses and vans Due to the limited sample size the findings presented in this section could be strengthened with further investigation
The general observation is that vehicle manufacturers have built their manufacturing practices and marketing strategies around the current FTA minimum retirement ages specifically the use of the 12-year minimum retirement age as a benchmark in the heavy-duty vehicle market
These manufacturers tend to design vehicles with a structurechassis expected to last and exceed the 12-year minimum without major failures and with the expectation that other components such as the engine transmission and axle follow good maintenance practices to reach these minimum retirement ages The manufacturers also recognize that the needs of operators differ (18-year minimum in Canada higher corrosion rate etc) and that the operating environment and duty cycle play an important role in the vehiclersquos retirement age
Federal Transit Administration 55
Useful Life of Transit Buses and Vans Chapter 5 Final Report Industry Outreach
Changes to the current FTA minimums and classifications are closely tied to the life expectancy of vehicle components Longer-life vehicles would require more durable components which at this time are not available by component manufacturers and shorter-life vehicles would entail the use of lower-cost perhaps lower-quality components with lower durability expectations
Private Operators Response
The research team developed an interview guide to assess the current experience of private operators with vehicle retirement ages and the FTA service-life guidelines Questions covered areas such as factors in retirement decisions experience with customers (transit operators) and life expectancy of vehicle components Table 5-11 provides the list of private operators and the title of the key staff contacted
Paul Revere Transportation Company provides charters sedan service and shuttle service throughout the New England area Notably it currently has contracts with
bull Massachusetts Port Authority (MassPORT) to operate the Boston Logan Airport shuttle buses which provide service through the airport (terminals satellite parking and public transportation stations)
bull Massachusetts Bay Transportation Authority (MBTA) as the private bus carrier of Route 712 and 713 in the Winthrop area
bull Medical Academic and Scientific Community Organization Inc providing shuttle service between several medical and scientific-research-related locations throughout the Boston area
Table 5-11 List of Private Operators Contacted and Respondents
Private Operator Contact Title Response to
Interview Guide Received and
Completed
Paul Revere Transportation Company LLC
Director of Operations Director of Maintenance Yes
Abersquos Transportation Operations Manager Yes Hertz Rent-a-Car Director Operationrsquos Technology Yes
Abersquos Transportation provides charter limousine and sedan service and shuttle buses throughout the Washington metropolitan area including airport transportation sightseeing tours and company contracts (service to and from office locations and Metro stations) Hertz provides several rental services including rental-car services at airport locations where it operates vans and shuttle buses between terminals and at locations on the outskirts of the airport
This section synthesizes the responses received in a narrative or tabular format Not all of the private operators responded to every question
Federal Transit Administration 56
Useful Life of Transit Buses and Vans Chapter 5 Final Report Industry Outreach
Fleet Characteristics
The three private operators surveyed operate a variety of vehicle types in terms of manufacturer size and capacity and duty cycle As a sample set Abersquos Transportation operates Ford cutaways Paul Revere operates a number of Neoplan CNGs Neoplan Diesels and MCII Diesels and Hertz operates different sizes of Gillig low-floor clean-burning diesels
All operators stated performing regular maintenance on their fleets Table 5-12 summarizes specific maintenance tasks provided by operators
Table 5-12 Regular Maintenance Schedule
Private Operator Maintenance Notes Paul Revere Transportation Company LLC
bull Heavy-duty buses are inspected after 12000 miles
bull Light-duty buses are inspected at 3000 to 4000 miles
bull Exterior and applied panels replaced as necessary (typically 4 to 5 years)
Maintain minimummaximum spare parts in stock based on experience
Abersquos Transportation bull Oil change every 3000 miles (manufacturerrsquos recommendation)
bull Front brake pads changed every 10000 rear brake pads changed every 17000 miles (longer for larger 7-year vehicles)
bull Front tires changed every 10000 miles rear tires changed every 12000 miles
bull Transmission fluids changed every 50000 miles
bull Ford 60 - Warranty of 36000 miles on transmission 100000 miles on engine
bull International 3500 ndash Warranty of 150000 miles on transmission and engine
bull Inspection on all vehicles when washed (1 to 2 timesweek)
Hertz Rent-a-Car Preventive maintenance performed regularly ndash initially according to manufacturerrsquos recommendation but now adjusted based on historical data
Comprehensive maintenance program Maintenance performed by in-house mechanics
Vehicle Retirement
The private operators were asked to provide information on the expected useful life of their vehicles as well as the drivers behind the retirement decision In general the operators stated an expected vehicle life based on the manufacturerrsquos recommendation with the options to extend it through transfers to lower-frequency routes or rehabilitation programs
Paul Revere Transportation provided the following detailed information on the scheduled life and rehabilitation of most of its fleet vehicles
bull 40-foot Neoplan CNG Scheduled life of 12 years with an engine rehabilitation at 75 years
bull Medium-duty Passenger Vans Scheduled life of 115000 miles (approximately four to five years)
Federal Transit Administration 57
Useful Life of Transit Buses and Vans Chapter 5 Final Report Industry Outreach
bull 35-foot RTS Diesel Scheduled life of five to six years
bull MCII Diesel Scheduled life of 700000 miles
Paul Revere Transportation also stated that structural rehabilitation andor bodywork on its 40shyfoot Neoplan CNGs would be performed if the vehicle has a minimum of 12 years and is planned for use after end of contract for other tasks This operator also stated inspection work is performed on its passenger vans every 5000 miles due to the large impact from weather
Abersquos Transportation noted that its smaller cutaways are typically operated on main routes for three years although it would transfer these vehicles to low-frequency routes after the three-year mark if their conditions remained acceptable The goal is to keep the larger cutaways for six years although the vehicles continue operations for an additional year if they remain in excellent conditions The vehicles do not undergo any overhauls and are traded in after retirement
Hertz indicated an expected useful life of 12 years based on the bus manufacturersrsquo design to the federal regulation Hertz also stated performing one overhaul on the transmission andor motor in order to extend the vehiclesrsquo life beyond design life The cost of this overhaul is approximately $20000 to $30000
All of the operators stated vehicle maintenance requirements as one of the main factors behind the decision to retire vehicles Table 5-13 summarizes the other factors in retiring vehicles reported by each operator
Table 5-13 Retirement Factors
Private Operator Key Factors in Retirement Paul Revere Transportation Company LLC
bull Age of vehicle ndash Contracts with customers are often aligned with expected useful life (contract length equal to full or half of the expected life)
bull Physical condition and quality of service bull Duty cycle bull Vehicle maintenance requirements
Abersquos Transportation bull Increase in required maintenance cost bull Physical condition of vehicles (customer comfort)
Hertz Rent-a-Car bull Perform a return-on-investment analysis of life-cycle costs to trade-off rising maintenance costs as vehicles get older and the purchasing options of new vehicles
bull Operating conditions (frequency)
Purchase Considerations
The private operators were also asked to provide information on their vehicle procurement process and vehicle purchasing decisions As expected none of the three operators surveyed use a low-bid process and they are mainly focused on customer service and reliability All of the operators stated they are willing to pay more for the best technology available for example luxury models better fuel economy computer-aided dispatch or vehicle location electronics
Federal Transit Administration 58
Useful Life of Transit Buses and Vans Chapter 5 Final Report Industry Outreach
Paul Revere Transportation is the only operator surveyed that provides service under a contract with a transit agency As such this operator stated that it considers meeting FTA specifications and testing requirements for reliability when purchasing vehicles Paul Revere also based the length of its contract with these agencies on the expected life of the vehicles For example one of its current contracts with MASCO is for six years for which it operates a 12-year bus In this case the firm will not include the purchase of new vehicles in its expected re-bid
Summary Private Operators
It is important to note that the three private operators surveyed are not a statistically representative sample Due to the limited sample size the initial findings presented in this section can be strengthened with further investigation
Overall the private operators are not affected by the FTA service-life policy and evaluate the useful life of a vehicle based on the manufacturerrsquos recommendation vehicle physical condition and maintenance requirements These private operators also apply regular maintenance practices on their vehicles with rehabilitations andor overhauls of the larger-size vehicles planned at near the vehiclersquos mid-life age
The main factor for retiring vehicles for these operators is the increased cost in required maintenance and the level of service to customer (comfort and reliability) None of the operators use a low-bid procurement process when purchasing vehicles They consider the higher costs to purchase vehicles with the latest technologies in fuel use emissions andor vehicle location to provide a higher level of customer service
Federal Transit Administration 59
Useful Life of Transit Buses and Vans Chapter 6 Final Report Engineering Analysis
CHAPTER 6 ENGINEERING ANALYSIS
This chapter provides further evaluation of bus useful life from a bus engineering perspective To a large extent this section represents a continuation of the agency outreach analysis from the previous chapter as it is primarily based on the results of both the original agency interviews (see Appendix A) as well as the findings from the second round of agency interviews this time more closely focused on vehicle engineering-related issues (see Appendix C) A key objective of this section is to highlight the fact that bus useful life is largely determined by the useful life of the vehicle structure The chapter is also intended to provide an assessment of how transit agencies expect differences in service environment and vehicle characteristics (such as new vehicle designs propulsion systems and advanced technologies) to impact vehicle useful life In most cases transit agency interview participants have reported that while they have reason to expect some new technologies and vehicle designs may have minor impacts on expected useful life most of these new designs and technologies have not been utilized for a sufficient period of time to observe any material impact on actual service life
Transit Agency Participants ndash Follow-Up Interviews
Much of the analysis in this section of the report is supported by both the results of the initial agency interviews (as considered in the previous chapter) as well as the results of follow-up interviews completed with a slightly different sample of transit operators (to ensure broader representation for the study) but also with some of the same operators as in the initial sample (because of their familiarity with topics of specific interest such as CNG buses) The specific sample of seven transit operators included in the follow-up interviews is presented in Table 6-1 In contrast to the initial interviews which included agency staff with differing backgrounds (eg bus operations directors general managers and vehicle engineering staff) the follow-up interviews were directed specifically towards agency bus engineering staff The intention of these follow-up interviews was to obtain a more in-depth perspective on engineering issues with useful life implications (eg the adoption of new technologies)
Table 6-1 Agencies Responding to Detailed Interview Guide Operator Type Fleet Size
(2005 NTD) Harris County Metro Houston TX Major Urban 1400 Buses 229 Vans LA MTA Los Angeles CA Major Urban 2815 Buses MUNI San Francisco CA Major Urban 894 Buses WMATA Washington DC Major Urban 1467 Buses 378 Vans CATS Charlotte NC Medium Urban 321 Buses 170 Vans Lane Transit District Medium Urban 147 Buses 92 Vans Golden Gate Transit San Francisco CA Suburban 321 Buses 46 Vans
Federal Transit Administration 60
Useful Life of Transit Buses and Vans Chapter 6 Final Report Engineering Analysis
Useful Life of Transit Vehicle Chassis and Components
This section reviews the useful life characteristics of bus and van structures and components Rather than single unified objects buses and vans represent assemblies of numerous components Hence the useful life properties of the vehicle as a whole are likewise determined by the components from which the vehicle is constructed This last statement is true from two differing perspectives First the life-cycle cost characteristics of transit vehicles are determined by the life-cycle costs of the components from which the vehicle is constructed As shown in the next chapter the overlap of these componentsrsquo life cycles (some of which last the full life of the vehicle and others which are replaced one or more times over the life of the vehicle) can be used to determine the financially optimal point of retirement Second from an engineering perspective vehicle useful life is ultimately determined by those components with the longest overall life and primarily the chassis and structure to which all other components are attached
The following sub-sections consider the useful life characteristics of the primary components of bus and van types within each of the five FTA service-life categories
StructureChassis
Four- and Five-Year Vehicles Small buses are built on van and cutaway van chassis mass-produced by light-duty automotive manufacturers The chassis are made from two C-channel frame rails attached by a series of steel cross-members The chassis supports all major components including the suspension axle brakes wheels tires engine transmission fuel system and electrical system Van bodies and cabs are mounted to the frame rails with bolts and rubber isolators The vanchassis are designed to last the full service life of the vehicle (ie 4 or 5 years) and are not overhauled The cost of the vanchassis ranges between $20000 and $30000
Seven-Year Vehicles Vehicles within the 7-year service-life category include buses and trolleybus built on cab and stripped chassis The chassis are mass-produced by heavy truck manufacturers The chassis are made from two C-channel frame rails attached by a series of steel cross-members The chassis supports all major components including the suspension axle brakes wheels tires engine transmission fuel system and electrical system Passenger bodies and cabs are mounted to the frame rails with bolts and rubber isolators The chassis are designed to last the full 7-year service life and are not overhauled The cost of the vanchassis ranges between $30000 and $40000
Ten- and Twelve-Year Buses Heavy-duty small and large buses are built on custom designed or stripped chassis The chassis designs include integral structure chassis unit body monocoque or semi-monocoque chassis and some body-on-frame construction types depending on the manufacturer The chassis are made of mild or stainless steel and aluminum alloy from welded tube sections andor stamped structural panels The chassis supports all major components including the suspension axle brakes wheels
Federal Transit Administration 61
Useful Life of Transit Buses and Vans Chapter 6 Final Report Engineering Analysis
and tires engine and transmission fuel system HVAC and electrical system The chassis of a body-on-frame design (10-year buses) are not overhauled but may be repaired during the life of the vehicle The custom designed chassis are designed to last the full 12-year service life and are overhauledrepaired as necessary The cost of a typical midlife overhaul of the heavy-duty custom chassis ranges from $7000 to $14000
Table 6-2 StructureChassis Characteristics
Component 4- and 5-Year Vans and Buses 7-Year Bus 10-Year Bus 12-Year Bus
Structure Chassis
Type Van and van cutaway
Cab and stripped chassis
Body on frame construction
Integrated structure chassis unit body monocoque or
semi-monocoque chassis
Useful Life At least 4 to 5 years At least 7 years or 200000 miles
At least 10 years or 350000 miles
At least 12 years or 500000 miles
Rehabilitated No No No Yes Many agencies do not perform a scheduled rehab but will repair as needed
Body
Four- Five- and Seven-Year Vehicles The 4- and 5-year small bus bodies are mounted to cutaway van chassis and designed and built by a second-stage manufacturer The 7-year medium-duty bodies are mounted to a cab and stripped chassis and are also designed and built by a second-stage manufacturer A second-stage manufacturer is a manufacturer that receives an incomplete rolling chassis or van and adds necessary components that complete the vehicle and ready it for its intended market The bodies built for small and medium-duty buses are designed specifically for the transit and shuttle bus markets and feature transit style windows destination sign wheelchair lift and a separate passenger compartment air conditioning system The bodies are constructed from steel tubes and use either fiberglass or metal for the exterior skin The 4- and 5-year small bus bodies are attached to the cutaway van chassis and integrated with the driverrsquos cab The 7-year medium duty bodies are attached to the cab and stripped chassis and integrated with the operatorrsquos cab The cab houses the dashboard driver interfaces and driverrsquos seats The bodies for each of these vehicle categories are designed to last the full service life of the vehicle (ie 4 5 and 7 years respectively)
Ten- and Twelve Year Vehicles The bodies of 10-year heavy-duty small transit buses are built by two methodsmdasheither as an integral part of the chassis structure or as a separate body mounted on a chassis The bodies of heavy-duty 12-year transit buses are an integral part of the chassis structure The bodies of both vehicle categories are constructed from steel tubes or panels and use either fiberglass or metal for its exterior skin which may or may not be a stressed structural element of the design (ie add structural support to the vehicle) As the body of the heavy-duty buses is typically an integral part of the chassis it is designed to last the full service life of the vehicle with repairs and overhauls as necessary The cost of a typical midlife overhaul of the body is $14000
Federal Transit Administration 62
Useful Life of Transit Buses and Vans Chapter 6 Final Report Engineering Analysis
Table 6-3 Body Characteristics
Component 4- and 5-Year Vans and Buses 7-Year Bus 10-Year Bus 12-Year Bus
Body
Type Mounted to cutaway van chassis
Attached to the cab and stripped chassis
Either integrated with chassis or separate and
bolted to the chassis Integral part of the
chassis
Useful Life At least 4 to 5 years At least 7 years 200000 miles
At least 10 years 350000 miles
At least 12 years 500000 miles
Rehabilitated No As needed Yes Yes Many agencies do not perform a scheduled rehab but will repair as needed
Interior
Four- Five- and Seven-Year Vehicles The interior of 4- and 5-year small bus bodies and 7-year medium-duty bus bodies use plywood for the floors covered with a rubber flooring material Interior walls and headliner are covered with lightweight paneling which is finished off with vinyl or carpeting Small and medium-duty buses use fabric-covered seats that mount to the floor structure Transit authorities typically do not refurbish the interior of small or medium-duty buses but replace worn components on an as-needed basis
Ten- and Twelve-Year Vehicles The interiors of 10- and 12-year heavy-duty transit buses use plywood for the floors covered with a rubber flooring material Interior walls and headliner are covered with lightweight paneling which is finished with vinyl or carpeting Heavy-duty transit buses use fabric-covered solid plastic or stainless steel seats that mount to the sidewalls andor floor structure Transit authorities typically do not refurbish the interior of 10-year heavy-duty buses but replace worn components on an as-needed basis For 12-year vehicles operators typically spend roughly $13000 over the life of the vehicle on interior replacements (either as a comprehensive overhaul or on an as-needed basis)
Table 6-4 Interior Characteristics
Component 4- and 5-Year Vans and Buses 7-Year Bus 10-Year Bus 12-Year Bus
Interior
Type Plywood flooring w
carpeting light weight vinyl paneling
fabric seats
Plywood flooring w rubber covering light weight vinyl paneling
fabric seats
Plywood flooring w rubber covering light weight vinyl paneling fabric or solid plastic
seats
Plywood flooring w rubber covering light weight vinyl paneling fabric or solid plastic
seats Useful Life At least 4 to 5 years At least 7 years 7 to 10 years 7 to 10 years Rehabilitated As needed As needed As needed Yes
Many agencies do not perform a scheduled rehab but will repair as needed
Federal Transit Administration 63
Useful Life of Transit Buses and Vans Chapter 6 Final Report Engineering Analysis
Interior Climate Control
Typical heavy-duty 10- and 12-year vehicles and many 7-year vehicles have heating ventilation and air conditioning (HVAC) units that are mounted on the rear of the bus or the roof The units range in size from 80000 to 115000 btu HVAC system are typically repaired or replaced as needed during the life of the 10-year vehicles HVAC system are typically overhauled during midlife rehabilitations of 12-year heavy-duty transit buses while systems for 7- and 10-year vehicles typically last the service life of the vehicle The cost for overhauling the HVAC units including interior vents and panels is approximately $10000 In contrast most 4- and many 5shyyear vehicles have heating and cooling systems that are integrated with the body (as in private vehicles) and last the full service life of the vehicle
Table 6-5 Climate Control Characteristics
Component 4- and 5-Year Vans and Buses 7-Year Bus 10-Year Bus 12-Year Bus
Interior Type Body integrated Roof Mounted Roof Mounted Roof Mounted Useful Life Life of Vehicle Life of Vehicle 6 to 7 years 6 to 7 years Rehabilitated No No Sometimes Yes
Many agencies do not perform a scheduled rehab but will repair as needed
Electrical Systems
Many heavy-duty 10- and 12-year transit vehicle manufacturers use Programmable Logic Control (PLC) technologies which allow for multiplexing Multiplexing systems use a single wire databus for communication among major components in a bus The use of a single wire reduces the number of dedicated wires and relays and therefore reduces the overall weight and complexity of the vehiclersquos electrical system and wiring harnesses Heavy-duty transit vehicle electrical systems typically offer extensive diagnostic capability The use of the PLC provides for easier diagnosis of sub-systems using software on laptop PCs The electrical system is repaired as necessary over the life of a 10-year vehicle In contrast electrical systems for 12-year vehicles are frequently overhauled at midlife Typically a midlife overhaul of the electrical system costs $4000 on a 12-year vehicle In contrast most 4- 5- and 7-year vehicles have wiring harness electrical systems (as found in private vehicles) and last the full service life of the vehicle
Table 6-6 Electrical System Characteristics
Component 4- and 5-Year Vans and Buses 7-Year Bus 10-Year Bus 12-Year Bus
Electrical System Type Wiring harness Wiring harness Multiplexing system Multiplexing system Useful Life Life of Vehicle Life of Vehicle Life of Vehicle Life of Vehicle Rehabilitated As needed As needed As needed Yes
Many agencies do not perform a scheduled rehab but will repair as needed
Federal Transit Administration 64
Useful Life of Transit Buses and Vans Chapter 6 Final Report Engineering Analysis
Propulsion System
Four- and Five-Year Vehicles There are two types of internal combustion engines for full-size vans and cutaway van chassismdashspark ignition (gasoline) and compression ignition (diesel) The gasoline engines are designed and manufactured by the van and chassis manufacturer The engines typically have 6 8 or 10 cylinders ranging in displacement from 46 liters to 80 liters The engines are similar to those offered in full-size pickup trucks and sport utility vehicles (SUVs) Gasoline engines in this operating environment have a service life of 125000 to 175000 miles Diesel engines are options on these vehicles at a $4000 premium The diesel engines provide superior durability and fuel economy and with a service life of 250000 to 300000 miles typically outlast the vehicle
The transmissions are designed and built in-house by the vanchassis manufacturer The transmissions in operation today have both four and five speeds which includes overdrive Transmissions are sized to accommodate the input torque of the engine Transmission can be expected to last 75000 to 100000 miles in transit service The transmissions are similar to those used in full-size pickup trucks and SUVs
In this service-life category performing a mid-life rehabilitation on the bus is uncommon However engines and transmissions are overhauled on an as-needed basis Cost for overhauling an engine and transmission is $4000 and $2000 respectively
Seven-Year Vehicles Medium-duty buses are powered solely by diesel engines The engines can be designed and built by the chassis manufacturer or purchased from a dedicated diesel engine manufacturer such as Cummins or Caterpillar The engines typically have 6 cylinders and 60 to 70 liters of displacement and the cylinders are arranged in an inline configuration Inline configuration is naturally balanced and provides minimal vibration Diesel engines in this class typically last the busrsquos life with a service life of 200000 to 300000 miles For medium-duty buses Allison transmission is the dominate transmission provider The chassis volumes are not sufficient to warrant chassis manufacturers to design their own transmission Heavy-duty transmission vendors from Europe have yet to challenge Allison in this bus service-life category In the category performing a mid-life rehabilitation on the bus is uncommon However engines and transmissions are overhauled on an as-needed basis
Ten-Year Vehicles Nearly all of the internal combustion engines used in heavy-duty small transit buses are compression ignition (diesel) although there are some CNG and diesel hybrid powertrains in service The engines typically have four six or occasionally eight cylinders ranging in displacement from 60 liters to 80 liters in capacity The engines are similar to those offered in class 7 tractors and straight trucks and heavy duty pick-up trucks Diesel engines in this operating environment have a service life of approximately 200000 to 300000 miles The diesel engines are supplied to the chassis manufacturer by a diesel engine manufacturer according to the customerrsquos specifications The major diesel engine suppliers to the heavy-duty small transit industry include Cummins and International CNG versions can increase the cost of a transit bus by $50000 Diesel engines can last the entire service life of the vehicles or may be replaced during the service life (depending on the service characteristics of the operator)
Federal Transit Administration 65
Useful Life of Transit Buses and Vans Chapter 6 Final Report Engineering Analysis
The major supplier of heavy-duty small transit bus transmissions is Allison The transmissions in operation today have both four and five speeds Transmissions are sized to accommodate the input torque of the engine Transmission can be expected to last to 150000 miles in transit service and hence will likely require an overhaul during the life of the vehicle
Table 6-7 Propulsion System Characteristics
Component 4- and 5-Year Vans and Buses 7-Year Bus 10-Year Bus 12-Year Bus Propulsion System Engine
Type Gasoline and diesel engines Diesel engines Diesel with some CNG and hybrid
Diesel with some CNG and hybrid
Useful Life Gas 125000 to 175000 miles Diesel200000 to 300000 miles
200000 to 300000 miles
200000 to 300000 miles
200000 to 300000 miles
Rehabilitated Rare As needed Yes Yes Propulsion System Transmission Type Automatic Manual Automatic Automatic Automatic
Useful Life 75000 to 100000 miles
100000 to 150000 miles 150000 miles 150000 miles
Rehabilitated As needed As needed Yes Yes Many agencies do not perform a scheduled rehab but will repair as needed
Twelve-Year Vehicles Nearly all of the internal combustion engines used in heavy-duty transit buses are compression ignition (diesel) although there are CNG and diesel hybrid powertrains in service The engines have four six or occasionally eight cylinders ranging in displacement from 80 liters to 140 liters The engines are similar to those offered in class 8 tractors and straight trucks The diesel engines are supplied to the chassis manufacturer by a diesel engine manufacturer according to the customerrsquos specifications CNG versions can increase the cost of a transit bus by $60000 and hybrid powertrains can add $150000 to the price of the vehicle Diesel engines have a service life of 250000 to 300000 miles and are typically overhauled or replaced on the vehicle
The transmissions are purchased by the chassis manufacturer according to the customerrsquos specifications The transmissions in operation today have both four and five speeds Transmissions are sized to accommodate the input torque of the engine Transmissions can be expected to last to 150000 miles in transit service
In this service-life category performing a mid-life rehabilitation on the bus is common and typically includes the powertrain However engines and transmissions are also overhauled on an as-needed basis Cost for overhauling an engine and transmission is approximately $35000 including engine compartment accessories such as mounts and emission control devices
Federal Transit Administration 66
Useful Life of Transit Buses and Vans Chapter 6 Final Report Engineering Analysis
Axles and Differentials
Four- Five- and Seven-Year Vehicles The axles and differentials used on small buses are exclusively built for the vanchassis manufacture by Tier 1 suppliers The axles are designed to accommodate the load rating of the vehicle Most rear axles for this vehicle weight class use a floating design in which the load on the axle is carried by the axle housing and not the axle shafts The differential provides the final gear reduction and transmits power from the powertrain to the wheels Properly maintained axles and differentials will perform for many years without major maintenance Transit service is hard on axles and differentials and it is not uncommon to have to replace the bearings on the axle shafts or the differential itself This type of maintenance is not scheduled and is performed on an as-needed basis Overhauling a rear axle can cost upward to $1500
Depending on vehiclersquos loading rating the front axle and suspension uses either a solid axle design with coil leaf or torsion bar mechanical springs or an independent suspension with either a coil or torsion bar mechanical spring Independent suspensions provide superior ride comfort but have more bushings associated with them requiring periodic replacement Front-axle and suspension systems are inspected regularly with repairs performed on an as-needed basis
Ten- and Twelve-Year Vehicles Ten- and twelve-year heavy-duty buses use axles and differentials from the trucking industry although there are transit bus specific axles used especially in low-floor applications where the front axle by necessity must be a low profile design Rear axles of low-floor designs can also be of a low profile design but this is only required in a full low-floor type of design compared with the more common partial low-floor design Heavy-duty small transit buses use two axles and are rated for a GVW of 26000 to 33000 pounds with the front typically rated at 10000 and the rear at 20000 pounds Large heavy-duty transit buses use two axles (3 for an articulated bus) and are rated for a GVW of 36000 to 40000 pounds The maximum axle weight allowed is typically 18000 front and 22000 rear depending on the state As delivered large heavy-duty transit bus front axles are rated for 13000 pounds and rear axles are typically rated for 26000 pounds Rear axles for this vehicle weight class use a fully floating design in which the suspension loads on the axle are carried by the axle housing and not the axle shafts Here again it is not uncommon to have to replace the bearings on the axle shafts or the differential itself and this type of maintenance is not scheduled it is performed on an as-needed basis and can be expected at least once during the vehicle life Rear suspensions are most commonly air springs or occasionally solid leaf springs
The front axle and suspension is generally a solid axle design with coil springs air springs or occasionally an independent suspension with air springs Independent suspensions provide superior ride comfort but have more bushings associated with them requiring periodic replacement Front axle and suspension systems are inspected regularly with repairs performed on an as-needed basis Overhauling heavy-duty axles can cost $9000 and suspensions roughly $4600 per rebuild
Federal Transit Administration 67
Useful Life of Transit Buses and Vans Chapter 6 Final Report Engineering Analysis
Table 6-8 Axles and Differentials Characteristics
Component 4- and 5-Year Vans and Buses 7-Year Bus 10-Year Bus 12-Year Bus
Type Floating rear solid or torsion front w leaf
suspension
Floating rear solid front w leaf suspension
Floating rear solid front w coil springs air
springs
Floating rear solid front w coil springs air
springs Useful Life Life of Vehicle Life of Vehicle 6 to 7 years 6 to 7 years Rehabilitated As needed As needed As needed As needed
Many agencies do not perform a scheduled rehab but will repair as needed
Brakes
Four- Five- and Seven-Year Vehicles Four- and five-year small buses are equipped with hydraulic brake systems featuring drum brakes on the rear and disc brakes on the front axles Medium-duty 7-year buses are typically equipped with hydraulic brake systems with either drum or disc foundation brakes Higher-capacity vehicles are equipped with pneumatic brake systems because of limitation on the boiling point of hydraulic fluid In transit service brakes are inspected on scheduled intervals based on either vehicle mileage or time Brake life is dependent on the duty cycle and can range between 15000 and 30000 miles Rebuilding the brakes can cost upwards of $400 per axle
Table 6-9 Brakes Characteristics
Component 4- and 5-Year Vans and Buses 7-Year Bus 10-Year Bus 12-Year Bus
Brakes
Type Hydraulic drum rear brakes and disc front
brakes
Pneumatic drum rear brakes and disc
front brakes
Pneumatic drum rear brakes and disc front
brakes
Pneumatic drum rear brakes and disc front
brakes
Useful Life 15000 and 30000 miles
15000 and 30000 miles
15000 and 30000 miles
15000 and 30000 miles
Rehabilitated Yes Yes Yes Yes
Ten- and Twelve-Year Vehicles Ten- and twelve-year heavy-duty transit buses are equipped with air brake systems featuring drum or disc brakes on the front and rear axles Heavy-duty vehicles are equipped with pneumatic brake systems because of limitation on the boiling point of hydraulic fluid In transit service brakes are inspected on scheduled intervals based on either vehicle mileage or time Brake life is dependent on the duty cycle and can range between 15000 and 30000 miles Rebuilding the brake system can cost $5000 including actuators linings and drums
Wheelchair Lifts
Conventional high-floor buses use wheelchair lifts to meet ADA requirements Low-floor designs also use some form of boarding aid for wheelchair passengers such as an air-driven boarding ramp and kneeling system The ramps are located on the inside of the bus at the front entrance door and are operated by the driver These boarding aids use interlocks that prevent the
Federal Transit Administration 68
Useful Life of Transit Buses and Vans Chapter 6 Final Report Engineering Analysis
bus from moving with a deployed wheelchair lift or ramp These systems are repaired as required during the life of the vehicle Typical overhaul cost for wheelchair lifts at midlife of a 12-year vehicle ranges from $12000 to $20000 with ramps costing relatively less depending on the complexity of the mechanism
Table 6-10 Wheelchair Lifts and Ramps Characteristics
Component 4- and 5-Year Vans and Buses 7-Year Bus 10-Year Bus 12-Year Bus
Type Lifts and Ramps Lifts Lifts Lifts Useful Life Life of Vehicle 6 to 7 years 6 to 7 years 6 to 7 years Rehabilitated As needed As needed As needed As needed
Summary
Figure 6-1 summarizes the results of this sub-section Specifically the figure presents the expected service lives of all major component groupings for a 12-year bus Here component groupings have been placed into three categories acting as rough prioritizations of vehicle replacement and rehabilitation importance These include (1) replacements required to keep vehicles fully operable (2) replacements to ensure vehicle operation remains safe and (3) replacementrehabilitation activities to maintainimprove vehicle esthetics (or general quality of service) Note here that relatively few vehicle components typically last the full ldquoservice liferdquo of the vehicle For 12-year vehicles this includes the structure (the component to which most other components are attached) exterior (panels or ldquoskinrdquo) and the electrical system This summary presentation helps to emphasize the fact that the vehicle structure the skeleton to which all other components are attached is the single most important vehicle component that defines the overall useful life of the entire vehicle Given this importance the next sub-section will further review the vehicle frame
Federal Transit Administration 69
Useful Life of Transit Buses and Vans Chapter 6 Final Report Engineering Analysis
Figure 6-1 Component Expected Life 12-Year Bus
Structure
Electrical System
Fuel System
Engine
Axles and Differential
Transmission
Suspension
Brakes
Tires
Wheelchair Lift
Radio and Public Address System
Hubs
Air System
Exterior
Windows
Interior Climate Control
Interior
Destination Signs
16 Expected Component Life (Years)
Vehicle Structure ndash A Second Look
This section provides further consideration of vehicle structure As noted above vehicle structure defines the useful life of the vehicle as a whole more than any other single vehicle component This is because the structure is the backbone to which all other vehicle components are ultimately attached Should the structure wear out or fail due to the influences of corrosion or a significant accident then the life of the vehicle is essentially at an end In contrast other vehicle components can be replaced as needed when they fail or become obsolete This even includes components that can be challenging to replace such as electrical systems which may require significant dismantling of the vehicle prior to removal and replacement Even the vehicle exterior (eg the panels making up the ldquoskinrdquo of the vehicle) which also tends to last the expected service life of the vehicle can be replaced as needed over the life of the vehicle Replacing the structure however would require the removal of all other components and then the complete reassembly of the vehiclemdashan improbable task
As the Chapter 2 analysis makes clear the structure of the 12-year bus (and some 10-year buses) is really only the bus and van structure developed solely for the transit market with the structures for all remaining bus and van types developed with other user applications in mind such as school buses motor homes courtesy vehicles and family vans Given that structure defines vehicle useful life more than any other component and that 12-year vehicle structures are the only structures designed specifically for transit use (and transit is the largest purchaser) the 12shy
Operability
Safety
Esthetics
0 2 4 6 8 10 12 14
Federal Transit Administration 70
Useful Life of Transit Buses and Vans Chapter 6 Final Report Engineering Analysis
year structure is the single component where FTA and the transit industry are in the best position to alter both component life and vehicle useful life simultaneously
The following sub-sections consider the useful life of vehicle structure from two different perspectives The first is the impact of service environment which is a primary determinant of structure service life and a factor that many transit operators would like to include along with service years and miles in assessing FTArsquos minimum service-life requirements The second is consideration of how different structure designs impact the useful life of transit buses For the most part the discussion in the section is limited to 12-year buses
Service Environment
All of the agencies interviewed for this study including those participating in both the initial and follow-up reviews acknowledged that service environment is one of the most significant factors that impacts the useful life of the bus structure This was recognized by agencies whether they considered their own service environment as less the same as or more severe than the national average
Agencies who noted that their service environment was the same as or less severe than the average did comment that buses that see high passenger load rates and are subjected to more severe service wear out faster This is intuitive and most agencies can proactively address this by rotating their buses so that the vehicles get equal exposure to the high service routes in order to balance overall fleet life However this is not always possible One agency noted that they exclusively used 60-foot articulated buses on specific high demand routes These buses experienced much higher wear and required more maintenance This agency attributed the higher maintenance requirement to the more demanding service environment served by the 60-foot bus rather than to the complexity of the articulated vehicle
The variability in service environment and its impact on bus useful life implies that a standard replacement age may not be appropriate for all transit agencies A bus structure built to survive the standard 12 years in an average North American city will not last 12 years in a harsher New York City or Boston environment Conversely a bus structure built to survive 12 years in either of these northeastern cities will be over-designed for the average US transit agency The bus structure will survive in excess of 12 years but it is a heavier and stronger structure The additional weight of the structure results in lower passenger capacity higher fuel consumption and greater wear on suspension and braking components Many of the agencies interviewed (including TTC NYCT and MBTA) have strengthened their specifications to include structural validation requirements in order to ensure they are purchasing buses that will survive for their desired (eg 12 year or longer) useful life within tough operating environments
TTC and NYCT working with Bodycote (formerly Ortech) developed an evaluation process to pre-qualify bus structures using a shaker table test The shaker table can be used to simulate the bus in the agencyrsquos actual operating environment The shaker table consists of four hydraulic posts that attach to the busrsquos wheel ends The hydraulic posts input loads into the busrsquos structure based on accelerometer data collected from actual routes The dynamic test can simulate 500000
Federal Transit Administration 71
Useful Life of Transit Buses and Vans Chapter 6 Final Report Engineering Analysis
miles of actual operation in a matter of weeks The actual stresses and failures that a bus structure would experience in service can be found over the course of the test
Using a similar methodology the stresses imparted into the bus structure can be measured in service and used to calculate ldquodamage factorsrdquo for the structure Instead of testing a completed bus on a shaker table this method can be used to predict useful life This approach has been applied by the MBTA on all of their recent bus procurements Each bus design was outfitted with a few dozen to a couple of hundred strain gauges and road tested in both loaded and unloaded conditions The strainstress data gathered from these tests was then extrapolated over the required 500000-mile useful life of the bus By comparing this information with known fatigue curves for standard welded joint classes the expected life of the bus structure can be determined In addition any locations that may have a lower than required life can be identified and redesigned prior to full bus structure production
Based on the interviews with transit agencies it is clear that service environment has a significant impact on bus structure useful life However because of the wide range in service environments throughout the country agencies with the most severe service environments have found it necessary to emphasize bus structure validation as part of their evaluation process If all agencies are required to get 12 years of useful life from their buses this will result in the average agency purchasing a vehicle that is over-designed for their needs at a higher cost with operating penalties of increased weight andor reduced passenger capacity
Severity and Minimum Service-life requirements Finally the question then arises as to whether the service environment should be includedmdash along with minimum service years (eg 12 years) and service miles (eg 500000 miles)mdashin the definition of FTArsquos expected minimum service-life requirements In other words should agencies operating in severe service environments be subject to less restrictive minimum service-life requirements as compared to those in less severe environments (eg 10 years versus 12 years for a large heavy-duty bus) While many of the interview respondents support the lesser restriction it is not clear how this service environment adjustment would be implemented in practice For example how would service environment severity be measured and where does the boundary between severe and not severe lie Presumably this would require some type of index incorporating measures of average passenger loadings street ldquoroughnessrdquo road salt utilization and perhaps local topography (ie for presence of steep grades) Alternatively agencies could lobby for a severity rating that FTA would then need to agree to
At the same time FTA would also need to conduct some analyses to determine how the minimum age and mileage requirements should best be altered to reflect these differences For example for large heavy-duty buses should the service-life requirements be 10 years for high-severity environments 12 years for average severity environments and 14 years for low-severity environments or some other set of ages
Another option would be to maintain the current 12-year and 500000-mile requirements and then somehow adjust funding levels to reflect the needs for a stronger structure for more severe operating environments To a limited extent this is already the case as (1) formula funding is already tied to ridership (thus accounting for rider impacts if not street roughness impacts) and
Federal Transit Administration 72
Useful Life of Transit Buses and Vans Chapter 6 Final Report Engineering Analysis
(2) FTA funds 80 percent of the vehicle cost including 80 percent of the higher cost for vehicles with stronger structures
In summary while it is very clear that service environment severity is a primary determinant of vehicle useful life it is not as clear how this factor could be represented in FTArsquos minimum service-life requirements While it is possible in theory to develop measures to capture and reflect differences in service environment severity (eg an index of service severity) selection development and reporting of these measures would require some research and would still require identification of a clear (but arbitrary) cut-off point between the severe and less severe environment types
Construction Type
The method in which transit buses are designed and constructed has an impact on their useful life The most popular method of construction used today for 12-year service life buses is an integral body and chassis constructed from square tubing This construction method uses hundreds of varying sizes of square tubes that are welded together to form the sidewalls roof and floor structures The sections are brought together and welded creating an integral bus body and chassis There are thousands of welds in a completed bus structure and the welds are subject to fatigue Buses that use this construction method are commonly referred to in the industry as ldquostickrdquo buses European bus designs heavily influenced this construction method New Flyer Orion NABI and Neoplan all employ this type of construction
The advantage of this construction method is that very little tooling and few machines if any are used in fabricationmdashthus minimizing expenses related to introducing a new bus design Disadvantages include the fact that the buses are very labor intensive to build and early versions suffered from structural design deficiencies corrosion problems and general quality control issuesmdashleading in turn to useful life issues Many transit authorities stayed with the proven General Motors RTS design last manufactured by NovaBus and Flxiblersquos Model 870 both of which were high-floor designs With the advent of low-floor buses however even the most loyal RTS operators were forced to procure stick busesmdashthe more effective design for vehicles of this type Most manufacturers have addressed the issues previously associated with stick buses by treating the tubes with corrosion-resistant coatings employing stainless steel improving quality control and strengthening the design such that newer designs are expected to have better useful life expectancies as compared to earlier models
Low-Floor Designs
Low-floor buses entered the market in the early to mid-1990s These buses feature a dropped front axle that enabled the floor to be lower and thereby eliminated the need for entry steps They also eliminated the need for wheelchair lifts which were problematic to maintain In the US market the low-floor bus standardized around a configuration featuring a low floor that ran from the front of the bus to just aft of the rear door After which two steps are required to reach the rear platform The raised rear platform provides sufficient space under the floor for a conventional rear axle and powertrain
Federal Transit Administration 73
Useful Life of Transit Buses and Vans Chapter 6 Final Report Engineering Analysis
Most of the 40-foot transit buses sold today are of the low-floor design Interview participants stated that it is too early to tell whether the low-floor design will impact vehicle longevity but did note that this design is more susceptible to roadside damage and salt spray (because the floor structure is closer to the ground) Furthermore the front suspension travel is reduced due to space limitation which may result in greater loads imparted into the bus structure with possible long-term service life ramifications Some interview participants felt that the service life of low-floor buses would be less than that of high-floor buses although they are capable of meeting minimum service-life requirements Others responded that the service life should be similar
Articulated Bus Designs
Articulated buses were introduced in the US market in the 1980s by European manufacturers Two configurations were sold In one configuration commonly referred to in the industry as a ldquopusherrdquo the engine resides in the rear of the second module or ldquotrailerrdquo similar to a conventional 40-foot bus The other design referred to as a ldquopullerrdquo houses the engine below the floor of the forward module or ldquotractorrdquo The added complexity of articulated buses increased their maintenance costs which can reduce their useful service life Only a few large transit authorities operate articulated buses in significant numbers Transit authority responses did indicate issues with articulated buses but these issues were primarily vendor-specific and not necessarily typical of this vehicle type
The advent of bus rapid transit (BRT) has renewed interest in articulated buses These latest designs feature low floors stylistic front ends pusher powertrain layouts and in some cases doors on both sides of the vehicle It is premature to comment on the durability of the latest generation of articulated buses however features such as doors on either side would be expected to challenge the structural integrity of the bus and could negatively affect its useful life
Bus Durability and New Technologies
Promoting research into advanced designs and technologies has always been an FTA interest and a transit industry strength In the 1990s FTA performed research on battery electric hybrid electric alternative fueled fuel cell and composite material buses This research has led to some useful-life impacts on the grantees For example the composite structures can certainly provide a minimum 12-year life and likely more These may be of interest to agencies looking for longer-life vehicles However the cost of the composite buses has limited their competitiveness within the low-bid procurement process
The following subsections consider the useful life implications of two types of new vehicle technologiesmdashalternative fuel and new electronics technologies
Alternative Fuels and Hybrid Propulsion Systems
The use of new fuels and propulsion systems in transit has historically affected the reliability and (in some cases) useful life of transit buses Early compressed and liquefied natural gas engines for example were sensitive to fuel quality and the energy content of the fuel because their mechanical fuel injection systems were not sophisticated enough to adjust for these differences
Federal Transit Administration 74
Useful Life of Transit Buses and Vans Chapter 6 Final Report Engineering Analysis
and often led to engine damage Newer electronically controlled engines have solved issues associated with changes in fuel content
Natural gas engines operate with a lower compression ratio The lower ratio results in smaller forces on the pistons pistons rod crankshaft and crankshaft bearings theoretically extending the life of the lower half of the engine The high combustion temperatures associated with spark-ignited engines negatively affect the upper half of the engine Taken together CNG engine should have similar life to that of diesels which is approximately 300000 miles
Survey responses from transit authorities found modern CNG engines to be durable and reliable Some transit authorities commented on the increased maintenance requirements due to the added components such as the spark plugs and ignition systems Transit authoritiesrsquo current concern with CNG buses is their higher curb weights CNG buses weigh approximately 3000 lbs more than their diesel counterpart The added weight is associated with the high-pressure cylinder storage tanks that make up the fuel storage system Some transit authorities expressed concern that the added weight negatively affects the useful life of transit bus structures Hence while the engine life of CNG vehicles may be comparable to that of traditional diesel engines the higher CNG engine weight may have negative useful life impacts on vehicle structures The agency respondents stated that this has yet to be proven
Diesel hybrid electric propulsion systems are the latest technology employed on transit buses Hybrid propulsion systems feature a diesel engine generator electric traction motor power electronics and batteries The batteries are capable of storing energy from regenerative braking and using it later to propel the bus NYCT was the first transit authority to purchase diesel hybrid electric buses in 1998 Since that time the technology has developed additional suppliers have entered the market and the technology has gained widespread acceptance Diesel hybrid electric buses have proven successful in terms of reliability and maintainability and the regenerative braking feature has significantly reduced brake maintenance
Diesel hybrid electric propulsion systems have two issues that may impact bus useful life The first issue is the life expectancy of the batteries There are currently two battery types being used on transit busesmdashlead-acid and nickel metal hydrides Neither is capable of meeting the minimum life expectancy of a transit bus both will need to be replaced one or more times throughout the vehicle life cycle Transit authorities will have to decide whether it makes economic sense to install new batteries at a significant expense into an older bus or retire and buy new The second issue deals with weight The weight of the batteries and associated components is approximately 1500 pounds While not as significant as the weight with CNG buses the additional weight increases roof loads onto the structure and may impact useful life Here again the actual impact on vehicle useful life will not be known until these buses begin to reach their mid and later service years
New Electronics Technologies
Over the past decade transit operators have added an ever-increasing number of new electronics technologies to their bus vehicles including automatic vehicle location automatic passenger counters on-board cameras vehicle diagnostics adaptive signal timing and communication
Federal Transit Administration 75
Useful Life of Transit Buses and Vans Chapter 6 Final Report Engineering Analysis
control voice annunciation and others In many instances agencies will not allow their buses to pullout for daily revenue service unless these systems are fully functioning (in some cases for liability concerns) However as each new technology is added to the bus and as more of these technologies are deemed critical to service operations the probability of one ore more technologies failing steadily increases leading to a potential need for increased spare ratios Of greater concern to agencies is the fact that the likelihood of these technologies failing is expected to increase further as vehicles age leading to potentially serious fleet reliability issues for aging fleets (or an increased need for vehicle electronics overhauls after mid life) Once more the ultimate impact on vehicle useful life will not be known until these technologies have been in service for many more years
Life-Extending Practices
Life-extending practices employed by transit authorities include the use of corrosion-resistant materials preventative maintenance programs and mid-life overhaul programs Many transit authorities specify corrosion-resistant materials when procuring buses These include the use of protected carbon steel and stainless steel The interior of the tubes are treated with an interior rust inhibitor while the undercarriage is also treated with an undercoating Corrosion-resistant metals rust inhibitors and undercoating are imperative to ensuring a long useful life
Similarly preventative maintenance programs are key to ensuring minimum life requirements are satisfied Operating buses with worn or bad suspension bushing for example increases the loads imparted into the busrsquos structure and ultimately shortens the useful life of the bus Typical preventative maintenance programs might include a 3000-mile minor mechanical and 12000shymile major mechanical and inspection
In addition to preventative maintenance programs some of the nationrsquos largest transit authorities perform mid-life overhauls after roughly seven years of service The overhaul programs are extensive and result in the rebuilding or replacing of a majority of components on the bus The work can be performed in-house or by an outside contractor Transit authorities that engage in mid-life overhaul program typically extend the service life to 15 years
Vehicle Emissions
An additional consideration with respect to bus and van useful life and FTArsquos minimum service-life requirements is vehicle emissions of nitrogen oxides (NOx) and particulate matter (PM) First although it is difficult to obtain empirical data on the matter it is generally believed that vehicle engines emissions gradually worsen over the life of the vehicle as the condition of the engine continually declines (even with rebuilds) Second and more importantly emissions levels for new heavy-duty transit buses have been decreasing steadily over time as newer cleaner burning engines are developed (see Figure 6-2) Either way it is clear that any reduction in actual vehicle service life (ie earlier fleet retirements) can help accelerate the replacement of older vehicles (and engines) with newer vehicles with cleaner burning engines yielding a clean air benefit to society However as has been noted many times throughout this report FTArsquos current minimum life requirement is not binding for most transit operatorsmdashand hence any relaxation of that requirement would not yield an appreciable reduction in transit fleet particulate
Federal Transit Administration 76
Pre-19
87
1987
-1990
1991
-93
1994
-95
1996
-98
1999
-02 20
03
2004
-06 20
07
2008
+
Useful Life of Transit Buses and Vans Chapter 6 Final Report Engineering Analysis
emissions (See Financial Impact of Earlier or Later Bus Retirement in the next chapter which estimates the small number of vehicles likely to be retired earlier with a reduction in FTArsquos minimum service-life requirements) Moreover it has not been shown that the benefits of this emissions reduction would offset the increased capital cost for accelerated vehicle replacement Finally even if more agencies were responsive to a reduction in FTArsquos minimum service-life requirements the emissions benefit from accelerated retirement would be short-lived As shown in Figure 6-2 new engines are now nearing zero-emissions levels for NOx and PM Once all of the older ldquodirtierrdquo vehicles are retired the benefit of accelerated retirement disappears
Figure 6-2
Heavy Duty Transit Buses NOx and PM Emissions by Model Year
0
5
10
15
20
25
NO
x (g
mi)
000 005 010 015 020 025 030 035 040 045
PM (g
mi) NOx
PM
Source California Air Resources Board Urban Diesel Transit Bus Emissions Inventory
Vehicle Reliability
The impact of age on a busrsquos useful life varied by transit agency and was primarily influenced by the agencyrsquos maintenance practices and service environment While all agencies reported that buses became less reliable with age it was noted that the extent of unreliability and deterioration could be controlled andor mitigated by improved maintenance In general agencies that followed a rigorous preventative maintenance regime reported that they saw minimal deterioration of the bus over the 12-year expected life Agencies that performed primarily corrective maintenance reported that older buses became less and less reliable and more and more expensive to maintain
Federal Transit Administration 77
Useful Life of Transit Buses and Vans Chapter 6 Final Report Engineering Analysis
National Bus Condition Assessment
From 1999 to 2002 FTArsquos Office of Budget and Policy completed a series of physical condition inspections for a large sample of US transit buses This study evaluated the physical condition of close to 900 transit buses and vans at more than 40 different transit properties The purpose of these inspections was to develop bus vehicle decay curves to simulate the nationrsquos current and future bus replacement needs within FTArsquos TERM
The bus physical condition data collected for this effort provide valuable information on (1) the expected physical condition of US transit buses throughout the vehicle life cycle and (2) a clear understanding of how the physical condition of transit buses of the same age varies across bus models and transit properties The results of this condition assessment provide a valuable means to understand both the consequences of the existing minimum service-life requirements (eg the expected physical condition of a 40-foot transit bus at age 12) as well as the consequences of changing that policy (eg how increasing or decreasing the minimum retirement age would impact the physical condition of the nationrsquos bus transit fleets) This section provides an overview of FTArsquos bus condition assessment program and its findings as they relate to FTArsquos minimum life requirements
National Bus Condition Assessment ndash Overview
The national bus condition assessment evaluated the current physical condition of 895 transit buses and vans located at 77 facilities from 43 different US transit properties In practice each assessment consisted of a detailed on-site evaluation of the current physical condition of several vehicles of each sub-fleet located at each sample agency maintenance facility For bus vehicles the assessment included a detailed inspection of the vehicles interior exterior chassis and understructure and engine compartment This visual inspection data was then combined with agency maintenance hours road call fluid analysis (eg oil sample) and other data to yield a comprehensive evaluation of each vehicles overall physical condition
The primary goal of the national bus condition assessment was to provide FTA with this snap shot of the current physical condition of the nations bus fleet and related maintenance assets This national condition evaluation is significant as it provides a critical measure of the quality and safety of transit service currently provided to the nations bus riders At the same time by revealing the distribution of physical conditions of the nations bus fleets (eg across vehicle ages) the assessment also provides a realistic basis for evaluating the nations immediate vehicle and facility replacement needs This analysis of the FTA service-life policy used this bus condition assessment to help establish an engineering basis to the minimum useful-life service measures of age and miles
A secondary project goal for the national bus assessment was to develop improved asset decay curves of bus vehicles and bus facilities for FTAs TERM TERM itself is designed to predict current physical conditions and long-term capital needs for the US transit industry Given these capabilities TERM is also the primary analytical tool used by FTA to prepare its condition and needs estimates for the biennial US DOT report to Congress In developing those estimates TERM uses statistical decay curves to model the life cycle of all transit asset types including bus
Federal Transit Administration 78
Useful Life of Transit Buses and Vans Chapter 6 Final Report Engineering Analysis
vehicles and related facilities These condition decay relationships were used in this contribution to the useful-life analysis
Considerable care was taken to ensure that the vehicles and transit agencies included in the inspection process yielded a representative sample of the nations bus fleet and agencies as a whole This objective was achieved by first examining both the overall characteristics of the nations bus fleets and related facilities and the prime determinants of the physical decay processes for these asset types (eg variations in passenger loadings average miles per year per vehicle and climate) The sample of assets for inspection was then selected to ensure a representative sample based on these national characteristics and one with sufficient data points to permit comprehensive statistical analysis of the asset decay process for buses and facilities This representative sample is equally important to this engineering analysis of the useful life of buses and vans
Overview of Key Results
The national bus condition assessment yielded several significant results regarding the physical condition and asset decay characteristics of the nations bus vehicles These include the following
1 The rate of decay for bus vehicles appears to fall into three distinct regimes over the asset life cyclemdashbeing highest over the first five years of revenue service slowing markedly between the ages of 5 through 14 and then accelerating again as the vehicle approaches retirement These observed regimes are consistent with the known service and rehabilitation practices of US transit operators throughout a typical vehicle life cycle In general most transit agencies obtain their highest revenue mileage and conduct the least amount of rehabilitation activities over the initial years of vehicle revenue service (ie producing a high decay rate) Between the ages of 5 and 14 (approximately) vehicles see less revenue service and begin to undergo multiple small rehabilitation activitiesmdashreducing the rate of decay Finally the value of maintaining a low-service vehicle approaching retirement declines continuously after the age of 14 leading to significant reductions in rehabilitation activity and consequently a rapid increase in the rate of decay
2 On average agencies pursuing aggressive preventive maintenance programs tended to experience lower overall maintenance costs superior bus conditions (a lower rate of deterioration) and extended vehicle life In contrast agencies focused primarily on corrective maintenance tended to exhibit poorer overall conditions higher maintenance costs and higher vehicle failure rates
3 Overall the primary contributors to vehicle decay were high utilization rates salt-related corrosion (highest in regions using road salt andor adjacent to salt water) and weak preventive maintenance Many vehicles also suffered from the effects of vandalism
4 While the national condition inspections covered all bus and vehicle types the inspection effort was concentrated on 12-year buses Consequently the data quality is highest for this vehicle type and much of the analysis that follows relate specifically to findings for the 12shyyear vehicle type
Federal Transit Administration 79
Useful Life of Transit Buses and Vans Chapter 6 Final Report Engineering Analysis
Vehicle Condition Rating Criteria
The condition rating criteria used in the bus condition engineering analysis is based on a five-value measurement of every detailed component and element within each bus (Table 6-11) The 1 to 5 condition rating scale used here is derived directly from that used by FTA to report asset conditions for all transit asset types at the national level Every component was assessed in this process based on a detailed valuation description of the five measures for each component5
These component condition ratings were subsequently entered into a national bus condition assessment database and the overall physical condition of that vehicle calculated as the weighted average of the condition ratings across all vehicle components The component weights assigned for this calculation are equal to each components estimated percentage contribution to the total life-cycle capital cost of the vehicle (including the components purchase price capital maintenance and rehabilitation and replacement costs as applicable)
The condition assessment engineers observed a broad variation in the rate of vehicle decay across the transit agencies participating in the study For example on average 40-foot buses were observed to take 84 years to decay from condition 50 (excellent) to condition 30 (adequate) However this decline took only 51 years for the lowest ranked operators included in the study For the highest ranked operators this decay process required 135 yearsmdashone year past the FTAs minimum retirement age
Table 6-11 Vehicle Condition Rating System
Rating Condition Description 50 Excellent No visible defects near new condition 40 Good Some (slightly) defective or deteriorated component(s) 30 Adequate Moderately defective or deteriorated component(s) 20 Fair Defective or deteriorated component(s) in need of replacement 10 Poor Critically damaged component(s) or in need of immediate repair
Bus Vehicle Conditions
Figure 6-3 provides a scatter plot of the observed vehicle conditions for the 895 transit buses and vans Specifically each point represents the weighted average condition value for a single vehicle based on the assessed condition of that vehicles constituent components As expected vehicle conditions decline significantly over the life of the vehiclemdashstarting in excellent condition (5) and deteriorating to marginal or poor condition (2 or 1 approximately) over a 10- to 20-year period
5 For more information about the TERM model or details of the bus condition assessment process please reference ldquoStatus of the Nationrsquos Highways Bridges and Transit Conditions and Performancerdquo and the ldquoTransit Economic Requirements Model Users Guiderdquo
Federal Transit Administration 80
Useful Life of Transit Buses and Vans Chapter 6 Final Report Engineering Analysis
Figure 6-3
Bus Physical Condition Versus Age
10
15
20
25
30
35
40
45
50 Ph
ysic
al C
ondi
tion
Full Bus (12 yr) Small Bus (7-10 yr) Vans (4 yr)
0 1 2 3 4 5 6 7 8 9 10 11 12 13 14 15 16 17 18 19 20 21
Vehicle Age (Years)
This figure also reveals broad variation in the rate at which vehicles deteriorate For example while most 12-year vehicles tend to remain in the good through excellent range (ratings 35 to 5) during the first two years of revenue service several vehicles appear to fall quickly below this level This rapid rate of decline was typically the result of very high service levels high passenger loadings accidents and in a few instances vandalism At the same time many 12-year vehicles were in adequate (condition 3) or better condition well past the FTAs 12-year minimum retirement age These well-preserved vehicles were typically the product of strong preventive maintenance programs milder operating environments and lighter duty cycles Relatively few 12-year vehicles had an overall condition rating less than 20 (although many individual vehicle components were assigned a condition rating of 1) This result reflects transit agency reticence to place a vehicle in active service if it has deteriorated such that it represents a safety hazard has poor reliability or provides poor service quality
Implications for FTArsquos Minimum Service-life Policy Part 1
For this review of FTArsquos minimum service-life policy an overall vehicle condition rating of 20 means a reasonable floor beneath vehicles should not generally be permitted in service In other words an overall condition of 20 helps to establish a maximum replacement life point (not a minimum) By inference then vehicles with ages equal to FTArsquos minimum retirement age (or mileage) should have overall condition ratings that are greater than 20 Specifically this minimum retirement age should optimally occur after a vehicle type has declined below a condition rating of 30 (ie adequate) but before it reaches an overall condition of 20 (substandard)
Federal Transit Administration 81
Useful Life of Transit Buses and Vans Chapter 6 Final Report Engineering Analysis
Average Vehicle Condition by Age 12-Year Vehicles
Figure 6-4 illustrates the change in average vehicle conditions by vehicle age for the full sample of 12-year vehicles once the scatter plot data presented above are ldquosmoothedrdquo to better capture the rate of vehicle decay for different bus populations6 Inspection of this smoothed average graph reveals several significant features First as expected average vehicle physical conditions tend to decline as vehicle age increases Second the rate of decline is not constant but varies over time In particular the rate of decline appears to fall into three distinct regimes over the asset life cyclemdashbeing highest from procurement through age 5 (approximately) slowing markedly from age 5 to 14 and then accelerating again after age 14 Finally the rate of decline decreases slowly from year to year within each regime appearing to follow an exponential decay process within each regime period
Figure 6-4
Average Bus Conditions by Age (Smoothed)
10
15
20
25
30
35
40
45
50
0 1 2 3 4 5 6 7 8 9 10 11 12 13 14 15 16 17 18 19 20 Vehicle Age
Con
ditio
n
Sample Average Top Quartile Agencies Bottom Quartile Agenices
As shown in Table 6-12 the observed deterioration regimes are entirely consistent with the known service maintenance and rehabilitation practices of US transit operators throughout a typical vehicle life cycle In general most transit agencies obtain the highest revenue mileage from bus vehicles during their initial years of service (ages zero through five approximately) During this period the vehicles require the least maintenance and provide the highest quality service to transit patrons in terms of comfort cleanliness and reliability The lower rate of
6 Specifically Figure 6-4 presents a smoothed average of the data points first presented in Figure 1-2 The smoothed average was calculated by first computing the observed average condition rating value at each vehicle age These observed average age values were then smoothed such that the smoothed average value for age t was set equal to the observed average values for ages t t-1 and t+1 (ie Smoothed AverageAge t = 13AverageAge t-1 + AverageAge t + AverageAge t+1)
Federal Transit Administration 82
Useful Life of Transit Buses and Vans Chapter 6 Final Report Engineering Analysis
capital maintenance and high rate of utilization combine to produce the highest rate of asset decay during this time period
Table 6-12 12-Year Vehicle Decay Rate Regimes
Age Regime Vehicle Ages Rate of Decay Agency Practices
Like New 0 to 5 Highest bull High annual mileage bull Minimalno rehabilitation (near new condition)
Mature 5 to 14 Moderate bull Reduced annual mileage bull Significant rehabilitation activity (engine rebuilds
mid-life overhauls)
Old 14 + Moderate Increasing
bull Low annual mileage bull Significant reduction in maintenance and
rehabilitation activity (nearing retirementmdashallowed to deteriorate)
Between the ages of 5 and 14 (approximately) vehicles begin to undergo more or less continuous capital maintenance and rehabilitationmdashincluding engine and transmission rebuilds upholstery replacement exterior painting and other component replacement activities These capital maintenance activities occur regardless of whether there is an overhaul process or scheduled or unscheduled component replacements Most agencies pursue these activities on an as-needed basis throughout this time period with very few agencies conducting a more or less complete vehicle overhaul at a single point in time Furthermore the actual level of maintenance and rehabilitation pursued during this period varies widely across agencies
During this period a typical vehicles overall condition rating will actually fluctuate up and down (eg pass above and then decay below the smoothed average line in Figure 6-3) as various rehabilitation activities are completed and the asset decay process begins again Regardless of the level of rehabilitation pursued these activities tend to reduce the rate of asset decay At the same time the level of annual service mileage derived from these vehicles tends to decrease over this period as operators focus service on newer fleet vehicles The combined increase in rehabilitation activity and decrease in annual service miles serve to decrease the rate of vehicle decay This emphasizes the necessity of rehabilitation activities regardless of whether they are part of an overhaul program scheduled in an organized replacement process or completed as failures necessitate on an unscheduled basis (unusual) In addition this pattern may support the exclusion of rehabilitation costs from a new federal reimbursable expensemdashan option that was considered in the initial hypotheses of potential service-life options
Finally most agencies begin to retire vehicles past the age of 12 or 14 years As vehicles approach retirement their annual miles of revenue service decrease significantly in favor of younger vehicles (tending to decrease the rate of asset decay) However the value of fully maintaining a low-service vehicle approaching retirement declines continuously during this time period leading to significant reductions in rehabilitation activity and consequently a significant increase in the rate of vehicle decay It should be noted however that several agencies operated vehicles in adequate (condition 3) or better condition well past the FTAs 12-year minimum retirement age Service-life options in this extended-life time period (beyond 12 years) has very little interest based on historical usage experience
Federal Transit Administration 83
Useful Life of Transit Buses and Vans Chapter 6 Final Report Engineering Analysis
Variation in Vehicle Decay Rates across Transit Agencies 12-Year Vehicles
Figure 6-3 provides the upper and lower bounds demonstrating the (smoothed) average condition values for those sample agencies with the highest and lowest overall condition ratings While these bounds do not fully explain the wide variation in 12-year vehicle conditions they do point to significant differences in the rate of vehicle decay across US transit operators (see Table 6-13)
Table 6-13 Average Number of Years to Attain Different Condition Ratings
Condition Rating
Years to Attain Condition Rating Bottom Quartile
Agencies Average Top QuartileAgencies
50 00 00 00 45 10 12 14 40 20 24 29 35 33 40 70 30 51 84 135 25 136 157 NA 20 189 200 NA
Note None of the agencies with average fleet conditions ranking in the top quartile operated vehicles older than age 16
For example 12-year vehicles operated by the lowest ranked transit agencies typically decline from Excellent to Good (ie from condition rating 5 to 4) in only two years However for the highest ranked agencies vehicles appear to decay more slowly and take an additional year to reach condition 4 Similarly while vehicles operated by the lowest ranked operators typically take five years to decline to Adequate (condition 3) vehicles operated by the top ranked agencies do not attain this rating until after age 13 over one year past the FTAs minimum 12shyyear retirement age
Implications for FTArsquos Minimum Service-life Policy Part 2
The agency analysis presented above demonstrates that even the bottom quartile agencies can easily attain FTArsquos current 12-year minimum retirement age for 40-foot buses without concern for operating vehicles into the lower engineering condition values of 25 to 20 (As discussed above an overall condition of 20 represents an overall vehicle condition that corresponds to the concept of a maximum retirement age or better yet a minimum acceptable service condition) This implies that a lower minimum life option may not be necessary or appropriate given the current bus design standards and operating conditions
Correlation with Vehicle Life-Cycle Cost Analysis
Chapter 7 of this report reassesses the bus condition information considered here There the life-cycle cost analysis is used to identify financially optimal retirement ages for all transit bus and van vehicle types The financially optimal retirement ages are then mapped to the corresponding
Federal Transit Administration 84
Useful Life of Transit Buses and Vans Chapter 6 Final Report Engineering Analysis
expected physical condition for vehicles of the optimal retirement age This correlation of engineering condition and life-cycle cost analyses is intended to provide an absolute answer to the optimal retirement age question (based on financial considerations) combined with an understanding of the physical condition implications of the identified optimal age (including expected levels of service reliability service quality and vehicle safety)
Federal Transit Administration 85
Useful Life of Transit Buses and Vans Chapter 7 Final Report Life-Cycle Cost Analysis
CHAPTER 7 LIFE-CYCLE COST ANALYSIS
This chapter presents the results of a minimum life-cycle cost analysis of the useful life of transit buses and vans This analysis considers all of the capital or non-recurring costs associated with vehicle acquisition as well as the recurring costs of vehicle operations maintenance and rehabilitation The objective of this analysis is to identify the point in the asset life cycle at which total life-cycle costs are at their lowest or are ldquominimizedrdquo From a financial perspective the minimum life-cycle cost point represents the optimal vehicle retirement age This minimum life-cycle cost analysis is presented first for the mainstay vehicle of the transit fleetmdashthe 40-foot heavy-duty ldquo12-yearrdquo bus The process is then repeated for each of the other transit bus and van categories Prior to presenting this analysis the chapter first identifies several of the primary determinants to life-cycle costs and life expectancy (including annual vehicle mileage average operating speed and agency rehabilitation practices) and then presents the full range of variation in these determinants across the nationrsquos bus transit operators
Later towards the end of the chapter the results of the life-cycle cost analysis are combined with the vehicle physical condition analysis from the last chapter The objective is to provide the reader with some understanding of a vehiclersquos expected physical condition at the financially optimal retirement point (in other words while the retirement point may be financially optimal is the vehiclersquos physical condition still acceptable to riders and operators) Finally this chapter concludes with an analysis of the potential loss of ridership and related fare revenues associated with increasing failure rates of an aging fleet Together the combined results of these differing analytical perspectives (cost physical condition and failure rates) help define the optimal useful-life periods for each bus and van vehicle category
Data Sources and Caveats
The cost and timing of rehabilitation activities used for the analysis were obtained from agencies and vehicle manufacturers that participated in the interview process for this study However the response rate for the cost data portion of the interview guide was low with few agencies responding fully Additional cost data were obtained from prior studies including a 2002 Booz Allen Hamilton analysis of 30 small and medium-sized bus operators in Illinois While the data obtained are of good quality and reported costs are comparable across all data sources the overall sample size is small Future life-cycle studies may wish to improve on the statistical reliability of the analysis by devoting additional resources to expanded data collection and a larger sample size Data on the average annual vehicle mileages were obtained from NTD
Key Determinants of Life-Cycle Costs
Life-cycle costs and vehicle life expectancy can vary significantly across transit operators even for operators using the same vehicle type under similar vehicle maintenance regimes Hence it is important to consider these factors when conducting a life-cycle cost analysis intended to represent the experience of the nationrsquos transit operators as a whole Towards this end this section identifies three key determinants of vehicle life-cycle costs (and life expectancies)mdash
Federal Transit Administration 86
Useful Life of Transit Buses and Vans Chapter 7 Final Report Life-Cycle Cost Analysis
annual vehicle mileage average operating speed and agency rehabilitation practices The section then goes on to discuss how these determinants vary across the nationrsquos transit fleets providing the full range of experience that needs to be reflected in the life-cycle cost analysis The analysis here is focused on the 12-year vehicle type but was also completed for the 10- 7- 5- and 4-year vehicle categories (see below)
Fleet Operating Conditions Annual Mileage and Operating Speed
The rate of vehicle wear is determined by a variety of factors including annual mileage average operating speed and passenger loadings In general higher annual mileages increase the rate of vehicle deterioration Similarly decreasing bus operating speeds are typically an indication of heavier duty-cycles (more frequent stops and starts) leading to a reduced life expectancy for drive trains brakes and other vehicle components Variations in annual mileages and operating speeds also have an impact on both the timing of fleet rehabilitation activities (eg drive train replacements) and annual operating and maintenance costs (higher annual mileage vehicles generally require higher maintenance and consume more fuel per mile than lower mileage vehicles of the same age) Hence an effective analysis of vehicle life-cycle costs must consider the range of annual mileages and service operating speeds experienced by US transit operators
Figure 7-1 shows the distribution of annual vehicle mileages for 12-year transit buses based on 2004 NTD data This chart shows a range of annual bus vehicle mileages with most US vehicles traveling between 25000 and 45000 miles each year The average annual mileage across all of the nationrsquos transit motor buses is just under 37000 miles The life-cycle cost analysis below will examine three specific annual vehicle mileage casesmdash25000 35000 and 45000 miles per year
Figure 7-1 Average Annual Miles
Distribution of US Transit Bus Vehicles
10000 15000 20000 25000 30000 35000 40000 45000 50000 55000 60000 65000
Average Annual Miles Per Fleet Vehicle
Average annual vehicle mileage tends to be highest during the earlier years of a vehiclersquos life (when utilization of the vehicle is highest) and then tends to decline as the vehicle ages (and is
00
20
40
60
80
100
120
140
160
Num
ber o
f Veh
icle
s (th
ousa
nds)
Federal Transit Administration 87
Useful Life of Transit Buses and Vans Chapter 7 Final Report Life-Cycle Cost Analysis
applied to lower demand routes) This characteristic is shown for the 12-year bus type in Figure 7-2 Once again analysis of life-cycle costs needs to reflect natural variations in the rate of vehicle utilization throughout a vehiclersquos life to accurately determine the timing of rehabilitation activities
Figure 7-2 Average Annual Milage 40 Foot Bus
00
50
100
150
200
250
300
350
400
450
500
Mile
s pe
r Yea
r (th
ousa
nds)
1 2 3 4 5 6 7 8 9 10 11 12 13 14 15 16 17 18 19 20
Vehicle Age
Finally Figure 7-3 shows the distribution of average operating speeds for 12-year transit buses Based on this data the average operating speed for 12-year transit buses is roughly 13 miles per hour with a range of between 8 and 20 miles per hour (although there is a small number of operators with average operation speeds outside of these boundaries) The life-cycle cost analysis presented below will utilize these minimum maximum and average operating speed values in defining the cost characteristics of the nationrsquos fleets of 12-year vehicles Similar bounds for annual vehicle mileage and operating speeds were developed for the life-cycle cost analyses of the 10- 7- 5- and 4-year bus and van vehicle categories (see below) As noted earlier in this report differences in average operating speed can be used as a proxy to account for differences in the total service hours (and the condition impacts of differences in hours) of transit vehicles with similar life-to-date service miles (Note Agencies can and do measure life-to-date vehicle mileage but currently have no means to measure life-to-date hours)
Fleet Rehabilitation Practices
In addition to variations in annual vehicle mileages and mean operating speeds transit agencies also employ differing life-cycle vehicle rehabilitation practices for their fleets This analysis will consider two specific cases The first case considers those agencies that undertake an extensive mid-life overhaul of their fleet vehicles In addition to the typical drive train replacement (engine and transmission replacement occurring every 250000 miles on average) extensive overhauls also include some body work exterior repainting replacement of most or all interior upholstery window and floor replacements technology upgrades etc The practice of conducting major mid-life overhauls is typically confined to the nationrsquos largest and highest ridership bus operators
Federal Transit Administration 88
Useful Life of Transit Buses and Vans Chapter 7 Final Report Life-Cycle Cost Analysis
00
20
40
60
80
100
120
Num
ber o
f Veh
icle
s (T
hous
ands
)
(eg New York City Transit New Jersey Transit and WMATA) but is relatively uncommon for most other operator sizes Where utilized major mid-life overalls of 12-year vehicles typically occur when the vehicle is six to seven years in age and are expected to provide several years of additional service life
Figure 7-3 Average Operating Speed
Distribution of US Bus Vehicles
80 90 100 110 120 130 140 150 160 170 180 190 200
Average Operating Speed (mph)
The second case considered here is intended to represent those operators that do not perform a major coordinated mid-life overhaul (most of the nationrsquos bus operators and roughly three-quarters of the nationrsquos bus vehicle fleet) For these operators replacement and rehabilitation of worn vehicle components is an ongoing continuous process performed on an as-needed basis In reality there is likely a continuum of rehabilitation practices between these two extremes However examination of these two limiting cases will effectively convey the relevant range of life-cycle cost issues between them
Life-Cycle Cost Analysis
The preceding analysis is intended to provide an understanding of the range of operating characteristics and rehabilitation practices that together are believed to drive differences in life-cycle costs and vehicle life expectancy across the nationrsquos transit operators Using that analysis this section develops a detailed life-cycle cost analysis of the 12-year 40-foot vehicles that constitute the bulk of the nationrsquos bus transit fleets This analysis is then used to identify that point in the vehicle life cycle when the sum total of all annualized costs (capital operating maintenance and rehabilitation) is minimized This minimum life-cycle cost point represents a financially optimal age to retire and replace a vehicle in effect providing a measure of ldquoeconomic useful liferdquo (as distinguished from an engineering useful life or other measure) As expected the point at which life-cycle costs are minimized can vary appreciably given differences in annual mileages average operating speeds and rehabilitation practices
Federal Transit Administration 89
Useful Life of Transit Buses and Vans Chapter 7 Final Report Life-Cycle Cost Analysis
Specifically this analysis considers the following life-cycle costs
bull Acquisition Cost and Disposal Value This includes purchase cost plus related procurement costs as well as the expected sale price or scrap value of the used vehicle
bull Expected Component Replacements and Mid-Life Overhaul Costs This includes the cost of all expected component replacements and rebuilds naturally occuring over the life of a vehicle (eg drive train rebuild) as well as the cost of any additional planned mid-life overhaul activities (if any) These costs are oriented toward the larger component replacement rebuild or rehabilitation needs and exclude the cost of minor vehicle repairs Examples include
ndash Engine and transmission rebuilds
ndash Other expected component replacements (eg brakes tires batteries suspension etc)
ndash Mid-life overhaul costs (eg repainting replacement of flooring upholstery windows body work etc)
bull Operating and Maintenance Costs This includes the cost of fuel preventative maintenance programs and all labor and parts for minor repairs as required to maintain vehicles in good working order
The following sub-sections provide an analysis of the expected annual cost of these different cost types throughout the vehicle life cycle beginning with a discussion of expected component replacement and mid-life overhaul costs
Expected Component Replacement and Mid-Life Overhaul Costs
Figure 7-4 presents the distribution of expected major component replacement and mid-life overhaul costs over a potential 20-year life cycle for a 40-foot transit bus (hence it excludes the cost of vehicle acquisition and all other vehicle operating and maintenance costs) The chart assumes a vehicle that averages 35000 miles per year over the full life cycle The chart also considers the two cases of (1) those agencies that complete an extensive mid-life overhaul and (2) those agencies that do not complete a mid-life rebuild but carry out their major component replacements on a continuous as-needed basis The analysis also assumes that the number of times a given replacementrebuild activity is performed depends on the vehiclersquos age at the time of retirement For example if engine rebuilds occur on roughly a six-year cycle (every 210000 miles) then this activity will occur once for a vehicle retired before 12 years twice for a vehicle retired before 18 years and 3 times for a vehicle retired at age 20 or later Similarly it is assumed that agencies currently pursuing a major mid-life rebuild program at vehicle age 7 (for example) would want to repeat the process again at age 14 if the vehicle was expected to operate well past that age
In reviewing Figure 7-4 it is easy to identify the timing of major vehicle replacement activities In particular the timing of the 7-year major mid-life overhaul (and its potential repetition at age 14) stands out clearly These investments include the cost of engine and transmission rebuilds repainting significant rehab and replacement of vehicle interiors (flooring upholstery and windows) bodywork as needed some electrical work and other upgrades In contrast the midshylife peaks for those agencies that do not perform a major mid-life overhaul are significantly
Federal Transit Administration 90
Useful Life of Transit Buses and Vans Chapter 7 Final Report Life-Cycle Cost Analysis
lower (fewer rehab activities equate to lower costs) but also have higher cost peaks for the intervening years (as some replacement activities tend to be more spread out) The smaller peaks primarily represent replacement of those components having shorter expected lives including tires brakes and batteries
Figure 7-4
Life Cycle Cost Profile Major Component Replacements and Overhauls
Maj
or C
ompo
nent
Rep
lace
men
ts a
nd O
verh
aul C
osts
$140000
$120000
$100000
$80000
$60000
$40000
$20000
$0
(Assumes 35000 miles per year)
Major Mid-Life Overhaul (40ft)
Continuous Rehabilitation (40 ft)
Optional (Rehab activities not
performed within 1 to 3 years of retirement)
1 2 3 4 5 6 7 8 9 10 11 12 13 14 15 16 17 18 19 20
Vehicle Age (years)
From the viewpoint of evaluating FTArsquos service-life policy the key point to note is that whether or not an agency conducts a major mid-life overhaul there are major cost cycles that are repeated throughout a vehiclersquos life cycle which are roughly concurrent with drive-train rebuilds (eg the cost peaks at roughly ages 6 to 7 and 12 to 14 in Figure 7-4) These major cycles help guide agency rehab-replacement decisionsmdashspecifically agencies will only complete a major vehicle rehabilitation initiative if they intend to keep that vehicle in service for at least three to five years after these improvements have been made For example in the case of a heavy-duty vehicle approaching 12 years in age an agency will only reinvest in that vehicle (eg rebuildreplace the engine and transmission) if the agency intends to obtain an additional three to five years of revenue service from that vehicle Otherwise these rehabilitation activities will be avoided (to save cost) and the vehicle will be retired after the minimum retirement requirements have been satisfied To summarize vehicle rehab and replacement decisions are determined by the timing of the vehiclersquos major reinvestment cycles with the timing of these cycles determined by annual vehicle mileage average operating speed and environment and agency maintenance practices
Minimum Life-Cycle Cost Analysis
Figure 7-4 above profiles the expected annual expenditures on component replacements and midshylife overhaul activities for heavy-duty vehicles for each year in the asset life cycle (including several years beyond the industry average retirement ages) In contrast the objective of this analysis is to identify that point in the asset life cycle at which the annualized value of all life-
Federal Transit Administration 91
Useful Life of Transit Buses and Vans Chapter 7 Final Report Life-Cycle Cost Analysis
cycle costsmdashincluding acquisition costs component replacement costs mid-life overhaul costs and operations and maintenance (OampM) costsmdashare minimized This minimum life-cycle cost analysis is depicted graphically in Figure 7-5 Specifically the cost values in this chart provide a measure of the average cost of ownership for a 40-foot vehicle at each vehicle age7 For example if a heavy-duty vehicle were retired at age 5 the annualized cost would be roughly $115000 (at that point regardless of whether the owner agency performs a mid-life rehab or not) Somewhere between the ages of 8 and 10 this annualized cost drops below $100000 reaching a cost minimum around a vehicle age of 14
Figure 7-5 Minimum Life Cycle Cost Profiles Including Vehicle Acquisition Major
Component Replacement Overhaul and OampM Costs
Tota
l Ann
ualiz
ed L
ife C
ycle
Cos
ts
$200000
$180000
$160000
$140000
$120000
$100000
$80000
$60000
(Assumes 35000 miles per year)
Major Mid-Life Overhaul (40 ft)
Continuous Rehabilitation (40 ft)
Minimum Life Cycle Costs
1 2 3 4 5 6 7 8 9 10 11 12 13 14 15 16 17 18 19 20
Vehicle Age (years)
The determinants for the shape of the cost curve in Figure 7-5 including the ldquoUrdquo shaped minimum are as follows First as the number of years of ownership increase a vehiclersquos acquisition cost becomes spread over an increasing number of years thus reducing the average annualized capital cost of ownership It is this decreasing annualized capital cost (the largest of all vehicle life-cycle costs) that accounts for the downward sloping curve through age 14 At the same time increasing vehicle age is also accompanied by increasing operating and maintenance costs (vehicles require more frequent repairs as they age) an effect that is captured by the slow rise in costs that becomes apparent in this chart after vehicle age 14 (Note At age 14 in this chart the savings from spreading capital costs over a greater number of service years is overtaken by the increase in annual OampM costs) Together the combined impacts of decreasing annualized capital costs and increasing operating costs as vehicle age increases yields a ldquoUrdquo shaped curve with a cost minimum Finally the bumps in this curve around ages six and seven
7 More precisely annualized cost is not the actual cost divided by the number of years of service (eg acquisition cost vehicle age) Rather annualized cost represents the stream of annual payments the net present value of which are equivalent to the initial investment cost Specifically the annualized cost of the vehicle acquisition cost for any age is given by
minus Vehicle Age )(Acquisition Cost ) (i (1minus (1+ i) ( ))
Federal Transit Administration 92
Useful Life of Transit Buses and Vans Chapter 7 Final Report Life-Cycle Cost Analysis
capture the cost of major component replacement and overhaul activities (eg drive train replacement) costs that become less apparent at later vehicle ages as they are also spread over an increasing number of years of service
This brief discussion is intended to provide a high-level overview of the application of minimum life cycle analysis to transit buses and vans A more detailed explanation and analysis can be found in Appendix D (minimum life-cycle cost methodology) Appendix E (details of the life-cycle cost analysis for heavy-duty vehicles) and Appendix F (transit vehicle life-cycle cost data)
Minimum Life-Cycle Cost Analysis Results 40-Foot Buses
The results of the minimum life-cycle cost analysis for 40-foot heavy-duty buses is presented in Table 7-1 Each row provides the age and mileage at which the minimum life-cycle cost point is reached depending on (1) the average annual vehicle mileage and (2) whether or not the vehicle undergoes agency performs a major mid-life overhaul (versus ldquocontinuous rehabilitationrdquo) For each of these six cases the minimum life-cycle cost is attained at or after the current FTA 12shyyear minimum (see below) For the single case where the cost minimum occurs right at the 12shyyear age (ie vehicles with 45000 annual miles) the cost minimum is attained at 540000 miles thus exceeding the 500000-mile minimum requirement Recall here that the average annual vehicle mileage for 40-foot buses is just over 35000 miles
Table 7-1 Minimum Life-Cycle Cost Replacement Ages
40-Foot 12-Year500000-Mile Bus
Annual Vehicle Mileage
Agency Performs Major Mid-Life Overhaul
Agency Performs Continuous Vehicle Rehabilitation
Minimum Life-Cycle Cost Age
Minimum Life-Cycle Cost Mileage
Minimum Life-Cycle Cost Age
Minimum Life-Cycle Cost Mileage
25000 16 400000 17 425000 35000 14 490000 14 490000 45000 12 540000 12 540000
The analysis in Table 7-1 considers the minimum life-cycle cost for three specific annual vehicle mileagesmdash25000 35000 (the national average) and 45000 annual vehicle miles Figure 7-6 provides the ages and life-to-date mileages at which life-cycle costs are minimized for vehicles traveling between 20000 and 70000 miles annually The solid bars and left-side axis present the ages at which life-cycle costs are minimized for this range of annual vehicle mileages The solid line and right-hand axis present the life-to-date mileages at which life-cycle costs are minimized
Review of Figure 7-6 suggests that from a cost-effectiveness perspective FTArsquos current retirement minimums (for large buses) of 12 years or 500000 miles represent reasonable choices For all annual vehicle mileages the minimum cost point is attained at either an age or mileage that exceeds one or both of the FTA minimums for these measures In all cases the difference between one and both of the current FTA minimum requirements also provides some
Federal Transit Administration 93
Useful Life of Transit Buses and Vans Chapter 7 Final Report Life-Cycle Cost Analysis
margin for the early retirement of vehicles with reliability problems For example vehicles traveling an average of 40000 miles per year could reach their cost minimums at age 13 and a LTD (life to date) mileage of 520000 miles Hence this provides a ldquomarginrdquo of one year or 20000 miles of optimal service beyond the FTA minimum for an average vehicle or the option to reduce service life by these amounts for less reliable vehicles Moreover this difference between the 12-year and 500000-mile minimum is smallest (while still providing a meaningful early retirement margin) for vehicles that average between 30000 and 45000 miles of travel per year Together these vehicles account for more than 70 percent of the nationrsquos large buses
Figure 7-6
Age and Mileage at Which Life-Cycle Cost Is Minimized (Single Mid-Life Rehabilitation or Single Drive Train Replacement)
20
20000 25000 30000 35000 40000 45000 50000 55000 60000 65000 70000
Average Annual Mileage
Age Minimum Life Cost is Attained Life to Date Miles Minimum Life Cost is Attained
FTA Mileage Minimum
FTA Age Minimum
Average Annual Mileage
700000
18 600000
16
500000 14
12 400000
10
300000 8
6 200000
4 100000
2
0 0
Vehi
cle
Age
Life
-Cyc
le C
ost I
sM
inim
ized
(Yea
rs)
Vehicle LTD M
iles Life-Cycle
Cost Is M
inimized
Other Bus and Van Types
The preceding analysis has focused entirely on the life-cycle cost attributes of a standard 12shyyear 40-foot bus This section provides a summary analysis of all remaining bus and van types (with their current FTA retirement minimums) including bull Articulated buses (12-year 500000-LTD-mile minimum) bull Heavy-duty small buses (10-year 350000-LTD-mile minimum) bull Medium-duty small buses (7-year 200000-LTD-mile minimum) bull Light-duty mid-size buses and vans (5-year 150000-LTD-mile minimum) bull Light-duty small buses and vans (4-year 100000-LTD-mile minimum)
This analysis is founded on both data collected for this study as well as data available from similar analyses (including an analysis of small and medium-sized bus operators located in downstate Illinois) Again while these data sources have provided good quality vehicle
Federal Transit Administration 94
Useful Life of Transit Buses and Vans Chapter 7 Final Report Life-Cycle Cost Analysis
purchase and rehabilitation cost data the sources lack depth It is recommended that future useful-life studies devote increased resources to ensure a more robust data sample
Articulated Buses
Table 7-2 presents the ages and LTD mileages at which life-cycle costs for articulated buses reach their minimum Here each row provides the age and mileage at which the minimum life-cycle cost point is reached depending on the average annual vehicle mileage and on whether or not the agency performs a major mid-life overhaul (versus ldquocontinuous rehabilitationrdquo) Overall the minimum cost ages and mileages as well as the optimal overhaulrebuild assumptions are the same for articulated buses as that found for 40-foot buses
Table 7-2 Articulated Bus (60 Foot) ndash Minimum Life-Cycle Cost Replacement Ages
Annual Vehicle Mileage
Agency Performs Major Mid-Life Overhaul
Agency Performs Continuous Vehicle Rehabilitation
Minimum Life-Cycle Cost Age
Minimum Life-Cycle Cost
Mileage Minimum Life-Cycle Cost Age
Minimum Life-Cycle Cost
Mileage
25000 19 475000 17 425000 35000 14 490000 14 490000 45000 12 540000 12 540000
Figure 7-7 Age and Mileage at Which Life-Cycle Cost Is Minimized
Articulated Bus
Age
Life
-Cyc
le C
ost I
s
Min
imiz
ed (Y
ears
)
18
16
14
12
10
8
6
4
2
0
FTA Mileage Minimum
FTA Age Minimum
Average Annual Mileage 600000
500000
400000
300000
200000
100000
0
LTD Miles Life-C
ycle Cost Is M
inimized
25000 35000 45000
Average Annual Mileage Age Minimum Life Cost is Attained Life to Date Miles Minimum Life Cost is Attained
Figure 7-7 charts the results from Table 7-2 along with the current FTA minimum age and mileage requirements This chart suggests that FTArsquos current age and mileage minimums are appropriate when assessed from the viewpoint of minimizing total life-cycle costs This is based on the fact that (1) all vehicles regardless of annual average mileage attain their minimum life-cycle point at an age or LTD mileage that exceeds the existing FTA minimums and (2) in all
Federal Transit Administration 95
Useful Life of Transit Buses and Vans Chapter 7 Final Report Life-Cycle Cost Analysis
cases the current FTA age and mileage minimums provide a margin for early retirement of problem vehicles (ie vehicles with above average expenses andor reliability issues) Note that the national average annual mileage for US articulated buses is 31900 miles per year
Heavy-Duty Small Buses (10-year 350000-LTD-mile minimum)
Table 7-3 presents the ages and LTD mileages at which life-cycle costs for small heavy-duty buses reach their minimum Similarly Figure 7-8 charts the results from Table 7-3 along with the current FTA minimum age and mileage requirements This analysis again suggests that FTArsquos current age and mileage minimums are appropriate when assessed from the viewpoint of minimizing total life-cycle costs Again all vehicles regardless of annual average mileage attain their minimum life-cycle point at an age andor LTD mileage that exceeds the existing FTA minimums and in all cases the current FTA age and mileage minimums provide a margin for early retirement of problem vehicles The national average annual mileage for US heavy-duty small buses is 35400 miles per year
Table 7-3 10-Year Heavy-Duty Small Bus ndash
Minimum Life-Cycle Cost Replacement Ages
Annual Vehicle Mileage
Agency Performs Continuous Vehicle Rehabilitation
Minimum Cost Age Minimum Cost Mileage
Full Drive Train Replacement
25000 12 300000 No 35000 11 385000 Yes 45000 11 495000 Yes
The analysis selects the minimum cost age and mileage for that drive train replacement option (ie replace or do not replace) that provides the lowest minimum total life-cycle cost
Figure 7-8 Age and Mileage at Which Life-Cycle Cost Is Minimized
Heavy-Duty Small Buses
0
2
4
6
8
10
12
14
Age
Life
-Cyc
le C
ost I
sM
inim
ized
(Yea
rs)
0
100000
200000
300000
400000
500000
600000
LTD Miles Life-Cycle
Cost Is Minim
ized
FTA Mileage Minimum
FTA Age Minimum
Average Annual Mileage
25000 35000 45000
Average Annual Mileage Age Minimum Life Cost is Attained Life to Date Miles Minimum Life Cost is Attained
Federal Transit Administration 96
Useful Life of Transit Buses and Vans Chapter 7 Final Report Life-Cycle Cost Analysis
Medium-Duty Small Buses (7-year 200000-LTD-mile minimum)
Table 7-4 presents the ages and LTD mileages at which life-cycle costs for small medium-duty buses reach their minimum while Figure 7-9 charts these results along with the current FTA minimum age and mileage requirements As with the larger vehicle types this analysis finds that (1) all vehicles regardless of annual average mileage attain their minimum life-cycle point at an age andor LTD mileage that exceeds the existing FTA minimums and (2) in all cases the current FTA age and mileage minimums provide a margin for early retirement of problem vehicles
Table 7-4 7-Year Medium-Duty Small Bus ndash
Minimum Life-Cycle Cost Replacement Points
Annual Vehicle Mileage
Agency Performs Continuous Vehicle Rehabilitation
Minimum Cost Age Minimum Cost Mileage
Full Drive Train Replacement
25000 9 225000 No 35000 8 280000 Yes 45000 7 315000 Yes
The analysis selects the minimum cost age and mileage for the drive train replacement option (ie replace or do not replace) that provides the lowest minimum total life-cycle cost
Figure 7-9 Age and Mileage at Which Life-Cycle Cost Is Minimized
Medium-Duty Small Bus
0
1
2
3
4
5 6
7
8
9
10
Age
Life
-Cyc
le C
ost I
sM
inim
ized
(Yea
rs)
0
50000
100000
150000
200000
250000
300000
350000
LTD Miles Life-Cycle
Cost Is Minim
ized
FTA Mileage Minimum
FTA Age Minimum
Average Annual Mileage
25000 35000 45000
Average Annual Mileage Age Minimum Life Cost is Attained Life to Date Miles Minimum Life Cost is Attained
One difference here is the fact that minimum life-cycle cost points for all three of the annual vehicle mileage groupings considered here (25000 35000 and 45000 miles per year) meet or exceed both the current FTA minimum age requirement and the current minimum LTD mileage requirement Despite this observation there does not appear to be significant justification for revising the existing FTA minimums (ie using minimum life-cycle cost as a criterion) The national average annual mileage for medium-duty small buses is 32800 miles per year
Federal Transit Administration 97
Useful Life of Transit Buses and Vans Chapter 7 Final Report Life-Cycle Cost Analysis
Light-Duty Mid-Size Buses and Vans (5-year 150000-LTD-mile minimum)
Table 7-5 presents the ages and LTD mileages at which life-cycle costs for light-duty mid-size buses and vans reach their minimum while Figure 7-10 charts the results for these vehicles along with their current FTA minimum age and mileage requirements (Note here that the annual vehicle miles of travel groupings have all dropped by 5000 miles as compared to the prior charts reflecting the lower average annual mileages for light-duty vehicle types)
Table 7-5 5-Year Light-Duty Mid-Size Buses and Vans ndash Minimum Life-Cycle Cost Replacement Points
Annual Vehicle Mileage
Agency Performs Continuous Vehicle Rehabilitation
Minimum Cost Age Minimum Cost Mileage
Full Drive Train Replacement
20000 7 140000 No 30000 6 180000 No 40000 5 200000 No
This analysis selects the minimum cost age and mileage for the drive train replacement option (ie replace or do not replace) that provides the lowest minimum total life-cycle cost
Figure 7-10 Age and Mileage at Which Life-Cycle Cost Is Minimized
Light-Duty Medium-Size Buses and Vans
0
1
2
3
4
5
6
7
8
Age
Life
-Cyc
le C
ost I
sM
inim
ized
(Yea
rs)
0
50000
100000
150000
200000
250000
LTD Miles Life-Cycle
Cost Is Minim
ized
FTA Mileage Minimum
FTA Age Minimum
Average Annual Mileage
20000 30000 40000
Average Annual Mileage Age Minimum Life Cost is Attained Life to Date Miles Minimum Life Cost is Attained
As before this analysis finds that (1) all vehicles regardless of annual average mileage attain their minimum life-cycle point at an age andor LTD mileage that exceeds the existing FTA minimums and (2) in all cases the current FTA age and mileage minimums provide a margin for early retirement of problem vehicles Compared to the vehicle types considered above one difference here is that the minimum cost ages and mileages for all vehicle types (based on this analysis) are associated with the scenario where there is no engine replacement over the life of
Federal Transit Administration 98
Useful Life of Transit Buses and Vans Chapter 7 Final Report Life-Cycle Cost Analysis
the vehicle (in contrast for the vehicle types considered above the lowest life-cycle cost points for vehicles with average and higher annual mileages were associated with the full drive-train replacement option) The national average annual mileage for light-duty mid-size buses and vans is 29500 miles per year
Light-Duty Small Buses and Vans (4-year 100000-LTD-mile minimum)
Table 7-6 presents the ages and LTD mileages at which life-cycle costs for light-duty small buses and vans reach their minimum while Figure 7-11 charts this information along with the FTA minimum age and mileage requirements Again this analysis finds that (1) all vehicles regardless of annual average mileage attain their minimum life-cycle point at an age andor LTD mileage that exceeds the existing FTA minimums and (2) in all cases the current FTA age and mileage minimums provide a margin for early retirement of problem vehicles Each of the three vehicle mileage examples (20000 30000 and 40000 per year) has minimum life-cycle cost mileages that exceed the FTA minimum retirement requirement of 100000 LTD miles The national average annual mileage for light-duty small buses and vans is 28500 miles per year
Table 7-6 4-Year Light-Duty Small Buses and Vans ndash
Minimum Life-Cycle Cost Replacement Points Annual Vehicle Mileage
Agency Performs Continuous Vehicle Rehabilitation
Minimum Cost Age Minimum Cost Mileage Full Drive Train Replacement
20000 6 120000 No 30000 5 150000 No 40000 4 160000 No
This analysis selects the minimum cost age and mileage for that drive-train replacement option (ie replace or do not replace) that provides the lowest minimum total life-cycle cost
Figure 7-11 Age and Mileage at Which Life-Cycle Cost Is Minimized
Light-Duty Small-Size Buses and Vans
0
1
2
3
4
5
6
7
Age
Life
-Cyc
le C
ost I
s M
inim
ized
(Yea
rs)
0
20000
40000
60000
80000
100000 120000
140000
160000
180000
200000
LTD Miles Life-C
ycle Cost Is M
inimized
FTA Mileage Minimum
FTA Age Minimum
Average Annual Mileage
20000 30000 40000
Average Annual Mileage Age Minimum Life Cost is Attained Life to Date Miles Minimum Life Cost is Attained
Federal Transit Administration 99
Useful Life of Transit Buses and Vans Chapter 7 Final Report Life-Cycle Cost Analysis
Life-Cycle Cost Analyses of Changes to FTArsquos Service-life Policy
In addition to identifying the financially optimal retirement point for each bus and van category a related study objective was to consider other potential financial implications of or changes to FTArsquos minimum service-life policy Specifically this includes finding answers to the following questions
bull How would an increase or decrease in FTArsquos minimum service-life requirements impact transit industry finances including annual replacement expenditures and agency operating costs
bull How does the continuing addition of new technologies affect the financially optimal useful life
The following sub-sections consider each of these questions
Financial Impacts of More and Less Frequent Bus Replacement Industry Perspective
This sub-section seeks to answer the first question from the perspective of the transit industry as a whole Specifically how would an increase or decrease in FTArsquos minimum service-life requirements affect vehicle replacement at the industry level The analysis first considers the case of a two-year reduction in the FTA minimum service-life requirements for large heavy-duty buses (ie from 12 to 10 years) and then repeats this analysis for a two-year increase in the minimum age requirements for that vehicle type (from 12 to 14 years) The impact of these changes from the agency perspective is considered in the next sub-section
Reduction in Minimum Life from 12 to 10 Years As discussed in prior sections of this report very few of the nationrsquos transit operators are likely to reduce their current vehicle retirement ages if FTA were to reduce the current retirement minimums by one or two years This is because the vast majority of the nationrsquos operators retire their heavy-duty buses two to four years after the retirement minimums have been reached due to financial constraints Hence any reduction in FTArsquos minimum useful life would only impact those few operators whose retirement decisions are in fact constrained by the existing service-life policy and the resulting industry-wide cost impact of that change would be very small
To emphasize this point refer back to Figure 4-1 Based on the analysis presented there roughly 6 percent and potentially as much as 10 percent of all retirements for heavy-duty buses occur right at vehicle age 12 This translates to an average of roughly 200 to 300 vehicle retirements per year for which the time of retirement is potentially constrained by FTArsquos minimum life requirements Suppose now that the minimum retirement age for heavy-duty buses was reduced two years (ie from 12 to 10 years) Assuming that all vehicles currently retired right at the current 12-year minimum shifted to the new 10-year minimum (an unlikely event as some of these operators will also face funding constraints or state and local minimum life requirements) then the long-term average annual replacement rates for these operators would increase from 200 to 300 vehicles annually to 240 to 360 vehicles annually an increase of 40 to 60 additional
Federal Transit Administration 100
Useful Life of Transit Buses and Vans Chapter 7 Final Report Life-Cycle Cost Analysis
vehicles per year8 Given that deliveries of new buses have averaged roughly 3000 per year over the past decade and the industryrsquos estimated total vehicle production capacity of 7500 to 10000 vehicles the addition of 40 to 60 additional new vehicles resulting from a two-year reduction in the heavy-duty vehicle minimum life requirement is far from significant
Increase in Minimum Life from 12 to 14 Years In contrast an increase in the minimum retirement age would force about 825 annual vehicle retirements (roughly 20 percent of the total) to be postponed by one or two years Assuming that all vehicles currently retired at age 12 or 13 would now be retired at the new 14-year minimum the long-term average annual replacement rates for these operators would decrease from roughly 825 vehicles annually to roughly 700 vehicles annually a decrease of 125 vehicles per year9
Once again the impact of this change on an industry that delivers roughly 3000 per year is not significant It is critical to understand however if the minimum life were extended past 14 years of age (eg to ages 15 16 or more) the impact on the industry would quickly become very significant particularly for vehicle manufacturers
Financial Impacts of More and Less Frequent Bus Replacement Agency Perspective
Consider the impact now from the viewpoint of an individual transit operator that currently retires its vehicles at 12 years of age and would reduce that retirement age to 10 years if permitted by FTA policy Here earlier vehicle retirement would increase that agencyrsquos vehicle-related capital costs but would also reduce the agencyrsquos operating costs (as newer vehicles require less maintenance) What then would be the net impact of this two-year reduction in FTArsquos replacement age minimum for operators of this type Table 7-7 answers this question using the life-cycle cost analysis discussed in the preceding sections of this chapter Specifically this analysis shows the annualized costs of capital and major component replacement costs and operating and maintenance costs for retirement at ages 12 and 10 and the differences in these costs As expected earlier retirement increases annualized capital and component costs and decreases annualized operating costs The net impact is a $3600 increase in annualized costs from retiring at age 10 versus age 12 Roughly speaking this implies that the total annual cost of vehicle operationsmdashincluding capital major component replacement and OampM costs (and taking discounting into effect)mdashwould be roughly $3600 higher for agencies retiring their vehicles at age 10 than for those retiring their vehicles at age 12 This amounts to more than a four percent increase in annual vehicle-related costs
8 This analysis excludes the initial ldquobumprdquo in vehicle replacements of roughly 400 to 600 vehicles that would occur in the first year the policy took effect
9 This analysis excludes the initial postponement of roughly 800 or more vehicles that would occur in the first two years the policy took effect
Federal Transit Administration 101
Useful Life of Transit Buses and Vans Chapter 7 Final Report Life-Cycle Cost Analysis
Table 7-7 Annualized Vehicle Costs ndash Large Heavy-Duty Bus
Per Vehicle Impact of Reducing Vehicle Retirement Age from 12 to 10 Years
Cost Element Annualized Costs for Retirement at Age 12 Age 10 Change
Capital Costs and Major Component Replacement Costs $60700 $66300 + $5600
Operating and Maintenance Costs $27000 $25000 - $2000 Total $87700 $91300 + $3600
Assumes vehicle averaging 35000 miles per year
What then would be the impact of increasing the minimum retirement age for heavy-duty vehicles from 12 to 14 years (for example) The answer to this question is addressed in Table 7-8 Later retirement decreases annualized capital and component costs and increases annualized operating costs The net impact is a $2800 decrease in annualized costs from retiring at age 14 versus age 12 Roughly speaking this implies that the total annual cost of vehicle operations would be roughly $2800 lower for agencies retiring their vehicles at age 14 than for those retiring their vehicles at age 12 This amounts to more than a three-percent drop in annual vehicle-related costs
Table 7-8 Annualized Vehicle Costs ndash Large Heavy-Duty Bus
Per Vehicle Impact of Increasing Vehicle Retirement Age From 12 to 14 Years
Cost Element Annualized Costs for Retirement at Age 12 Age 14 Change
Capital Costs and Major Component Replacement Costs $60700 $55700 - $5000
Operating and Maintenance Costs $27000 $29200 + $2100 Total $87700 $84900 - $2800
Assumes vehicle averaging 35000 miles per year
Impact of New Bus Technologies on the Financially Optimal Retirement Age
The next question to be addressed is How does the continuing addition of new technologies affect the financially optimal useful life In considering this question it is important to understand that any increase in vehicle capital costs will tend to increase the financially optimal retirement age while any increase in operating and maintenance costs will tend to decrease the optimal retirement age The net change depends on which of these two impacts is larger This interaction is presented in Figure 7-12
With respect to new technologies such as AVL APCs voice annunciation security cameras and collision avoidance systems the increase in vehicle purchase price is dependent on which specific technologies are included in a new bus specification Adding most or all of these components can be expected to increase the price of the bus by roughly $30000 to $50000 Assuming these technology components have life cycles comparable to that of the bus itself yields a roughly 10-percent to 15-percent increase in the annualized vehicle capital cost In the absence of any change to operating costs the life-cycle analysis shows that this increase does not
Federal Transit Administration 102
Useful Life of Transit Buses and Vans Chapter 7 Final Report Life-Cycle Cost Analysis
impact the optimal vehicle retirement age In fact vehicle capital cost needs to increase by up to $200000 to alter the financially optimal retirement age by even one year (upward)10
Figure 7-12 Impact of Changes in Capital and Operating Costs on Minimum Life-Cycle Cost
Increase in Purchase and Operating Costs
$000
$050
$100
$150
$200
$250
100000 200000 300000 400000 500000 600000 700000 800000 Vehicle Age
Cos
t Per
Mile
Capital OampM
Change in Optimal Useful Life
Increase in Vehicle Purchase Cost
$000
$050
$100
$150
$200
$250
100000 200000 300000 400000 500000 600000 700000 800000 Vehicle Age
Cos
t Per
Mile
Capital (Old) Capital (New) OampM Costs
Increase in Optimal Useful Life
Increase in Purchase Cost
Increase in Vehicle Operating Costs
$000
$050
$100
$150
$200
$250
100000 200000 30 0 700000 800000 Vehicle Age
Cos
t Per
Mile
0000 400000 500000 60000
Capital OampM Costs (Old) OampM Costs (New)
Decrease in Optimal Useful Life
Increase in OampM Costs
Similarly operators investing in these new technologies now anticipate increased costs to maintain these new systems (either directly by operator staff or through vendor maintenance agreements) Even if it is assumed that these costs add 20 percent to annual vehicle OampM costs (a rather conservative assumption) there is still no impact on the optimal retirement ages identified earlier in this chapter However the key unknown in this analysis is how these operating costs change with time Most agencies anticipate that these new technologies will begin to fail at an increasing rate as the vehicle approaches 12 or more years of revenue service With multiple systems in place these failures may have significant impacts on an agencyrsquos ability to make their peak-period pullout requirements However none of these systems has been in place for a sufficiently long time to have reliable cost data for these systems at the more advanced bus ages (ie age 12 or higher) It can be noted however that based on the cost analysis performed for this study vehicle OampM costs would need to increase by more than one-third before the cost impact of these new technologies would alter the financially optimal retirement age by even one year (downward)
10 This because of the very flat shape of the annualized capital cost curve
Federal Transit Administration 103
Useful Life of Transit Buses and Vans Chapter 7 Final Report Life-Cycle Cost Analysis
Vehicle Physical Condition versus Minimum Cost Retirement Age
Heavy-Duty Large Buses
The analysis above considers the point in the asset life cycle at which annualized life-cycle costs are minimized This provides an assessment of useful life based entirely on cost effectiveness and hence without reference to vehicle condition or quality of service In contrast to this approach Figure 7-13 presents measures of vehicle physical condition (and by association vehicle quality of service ldquoesthetic qualityrdquo reliability and potentially safety) as a function of vehicle age for medium- to large-size transit buses (ie 35 to 60 feet) This bus condition-decay curve was developed for FTArsquos TERM model and the details of this process were presented at the end of the last chapter The scale ranges from a perfect score of 50 (excellent) to 40 (good) 30 (adequate) 20 (substandard) and 10 (poor) In practice most agencies retire their large buses somewhere between the conditions 20 to 30
Within Figure 7-13 the solid center line represents the average physical condition of vehicles with roughly 35000 in annual mileage (and average maintenance practices) The upper line represents the projected condition of vehicles with lesser mileage (25000 miles per year) while the lower dotted line represents those with above-average mileage (45000 miles per year) Unlike the minimum life-cycle cost analysis above there is no obvious point at which vehicles should be retired Rather vehicle decay is a gradual decline in physical condition where the selection of a specific retirement point is necessarily arbitrary
Figure 7-13
Bus Physical Condition Versus Age 50
45
40
35
30
25
20
15
10
35000 miles per year
25000 miles per year
45000 miles per year
Vehicle Condition at Minimum Life-Cycle Cost
0 1 2 3 4 5 6 7 8 9 10 11 12 13 14 15 16 17 18 19 20 21
Vehicle Age (Years)
Phys
ical
Con
ditio
n
Federal Transit Administration 104
Useful Life of Transit Buses and Vans Chapter 7 Final Report Life-Cycle Cost Analysis
However when the minimum life-cycle ages are plotted on Figure 7-13 (as red circles) these retirement points are located at reasonable condition valuesmdashafter vehicle condition begins to decline below ldquoadequaterdquo (30) but before the vehicle attains the ldquosubstandardrdquo designation (20) The lower condition value for vehicles with higher mileages (ie condition of the 35000 annual mileage vehicle at minimum life-cycle cost is higher than that of the 45000 annual mileage vehicle) is a reflection of the higher LTD mileages attained by these vehicles at the minimum cost points (ie 425000 miles for vehicles traveling 25000 miles per year 490000 miles for vehicles traveling 35000 miles per year and 540000 miles for vehicles traveling 45000 miles per year)
For the viewpoint of reconsidering vehicle useful life and FTArsquos minimum life requirements this cross-referencing of the minimum life-cycle cost and condition model approaches suggest that the minimum life-cycle cost ages (and mileages) represent reasonable optimal retirement ages (both in terms of cost-effectiveness and retirement occurring at a reasonable condition value) More importantly these optimal retirement ages (and some mileages) occur after the current FTA-required retirement minimums of 12 years or 500000 miles is satisfied Conversely the current FTA retirement minimums provide some margin for the early retirement of lower-reliability vehicles
All Bus and Van Categories
Figure 7-14 identifies the condition values at which all bus and van vehicle categories attain their minimum life-cycle cost based on total LTD mileage (and not age) As with Figure 7-13 this chart also indicates the differing condition values at the minimum cost point within a given vehicle type (eg heavy-duty small bus) Specifically the blue circles indicate the mileage and condition at which minimum life-cycle cost is attained for vehicles with low average annual mileage for that specific vehicle type The yellow and red circles capture the same mileages and conditions for vehicles with average and high annual mileages respectively
As in Figure 7-13 the minimum life-cycle cost points for the three average annual mileage scenarios all occur at condition values less than adequate but typically well above substandard Hence all these retirement points are ldquologicalrdquo in that they occur after the vehiclersquos condition has begun to show signs of age but before the vehicle begins to experience significant quality of service reliability or potential safety issues (as is expected for vehicles with condition ratings less than 20 or ldquosubstandardrdquo) Again it is important to emphasize that the points represented here are founded on the objective of minimizing total life-cycle cost In practice different transit operators or the federal and state governments may wish to target useful-life standards based on other objective criteria (eg a minimum quality of service)
Federal Transit Administration 105
Useful Life of Transit Buses and Vans Chapter 7 Final Report Life-Cycle Cost Analysis
Figure 7-14
Condition At Which Minimum Life-Cycle Cost is Attained
10
15
20
25
30
35
40
45
50
0 100000 200000 300000 400000 500000 600000 700000
Life-to-Date Miles
Phys
ical
Con
ditio
n
Heavy-Duty Large Bus (12 year)
Heavy-Duty Small Bus (10 year)
Medium-Duty and Purpose Built (7 year)
Light-Duty Mid-Size BusVan (5 year)
Light-Duty Small Bus Van (4 year)
Excellent
Good
Adequate
Substandard
Poor
= Low annual milage vehicle
= Average annual milage vehicle
= High annual milage vehicle
Condition at Which Minimum Life-Cycle Cost is Attained For
Vehicle Age Service Reliability and Ridership
While transit riders are known to have a clearly stated preference for newer cleaner transit vehicles the study team was unable to identify any empirically based studies providing a quantitative relationship between vehicle age (or condition) and vehicle ridership This despite the very extensive literature on the responsiveness of travel demand to many different factors (including elasticities for service price service frequency and travel time and cross elasticities for gas and differences in travel time) Hence while the qualitative response to newer vehicles is well documented (ie riders prefer newer vehicles and state that they are more apt to use transit given a newer cleaner fleet) the quantitative ridership response to changes in fleet age or condition are not well documented Given the lack of information on this subject the study has focused on the direct ridership impacts of decreasing vehicle reliability with vehicle age as a means of addressing the issue of the ridership response to changes in vehicle condition
Road Calls
As bus vehicles age the probability of mechanical failures increases leading ultimately to increased service disruptions for system riders Figure 7-15 demonstrates the relationship between vehicle age and the number of road calls per vehicle mile (the inverse of mean distance between failures) for full-size transit buses This relationship was developed using actual road call data from a sample of five US transit operators11 Each point on this chart represents the average failure rate (over a 12-month period) for all vehicles in a given sub-fleet for one of these operators For this analysis a road call was defined as an in-service failure causing a vehicle to
11 At the request of these operators their names have been excluded from this presentation
Federal Transit Administration 106
Useful Life of Transit Buses and Vans Chapter 7 Final Report Life-Cycle Cost Analysis
be pulled from service (and hence resulting in a service disruption for system riders) The estimated relationship clearly captures the increasing likelihood of in-service failures as bus vehicle age increases The surrounding data points similarly capture the wide variability in vehicle reliability resulting from both differences in the inherent reliability of different vehicle models differences in service environment and differences in vehicle maintenance practices
Figure 7-15
Road Calls Per Mile (Agency Sub-Fleets)
00000
00001
00002
00003
00004
00005
00006
0 2 4 6 8 10 12 14 16 18 20 Vehicle Age (Years)
Roa
d C
alls
Per
Mile
As with the presentation of declining condition above this analysis does not suggest a specific point in the asset life cycle at which bus vehicles should be retired (note also that the repair costs associated with these in-service failures are already captured in the minimum life-cycle cost analysis above) However this analysis does emphasize the negative service reliability implications of increasing fleet age
Vehicle Age Reliability and Ridership
As transit buses age their appearance and ride quality typically decline with potential negative impacts for system ridership (ie some riders may select an alternative to buses if bus vehicle condition falls below some acceptable threshold) Unfortunately no prior research has been identified that assesses the impact of fleet age on system ridership12 However from the relationship presented in Figure 7-15 it is clear that increasing vehicle age does lead to an increased frequency of road calls and consequently to service disruptions for the sub-group of riders impacted by those road calls Figure 7-16 uses the vehicle age and road calls relationship presented in Figure 7-15 to estimate the annual number of riders directly impacted by bus service failures for agencies with fleets of various sizes (ie 100 500 and 1000 buses) These
12 The study team conducted a statistical analysis specifically for this project comparing average vehicle loadings with average fleet age using NTD data to determine whether increasing average fleet has any impact on system ridership This analysis did not identify a statistically significant relationship between these two measures
Federal Transit Administration 107
Useful Life of Transit Buses and Vans Chapter 7 Final Report Life-Cycle Cost Analysis
calculations assume an average annual vehicle mileage for these fleets of 35000 miles per bus They also assume an average bus passenger load of 68 riders (hence on average 68 riders are directly impacted by each road call or service disruption event)13 This chart shows that increasing fleet age clearly has a significant impact on the number of riders experiencing a road call event especially for the nationrsquos larger operators
Figure 7-16 presents the total number of riders impacted by road calls for differing average fleet ages However we must also address the incremental impact of a one-year increase in average fleet age Table 7-9 presents this incremental ridership impact for a range of fleet sizes and annual vehicle mileages per vehicle As expected the incremental numbers of riders impacted by road calls from increasing fleet age is highest for the larger transit operators and those with the highest annual mileage per vehicle
Figure 7-16
Number of Riders Impacted By Road Calls by Average Fleet Age
0
10000
20000
30000
40000
50000
60000
70000
80000
90000
100000
0 1 2 3 4 5 6 7 8 9 10 11 12 13 14 15 16 17 18 19 20
Average Fleet Age (Years)
Ave
rage
Ann
ual N
umbe
r of R
ider
s Im
pact
ed b
y B
us R
oad
Cal
ls
100 Vehicle Fleet 500 Vehicle Fleet 1000 Vehicle Fleet
Table 7-9 Incremental Increase in Annual Number of Riders Impacted By Road Calls from One-Year Increase in Average Fleet Age
Annual Vehicle Mileage Fleet Size 100 Vehicles 500 Vehicles 1000 Vehicles 25000 miles 225 1120 2245 35000 miles 320 1610 3220 45000 miles 565 2823 5645
The final consideration here is the ridership impact of declining service reliability with increasing fleet age If it is assumed that road call andor service disruption events motivate riders to abandon buses in favor of an alternative mode perceived to be more reliable (eg auto) then the numbers in Table 7-9 estimate the maximum potential ridership loss from an increase in
13 The average passenger load of 68 persons represents the average for all US bus fleets reporting to NTD
Federal Transit Administration 108
Useful Life of Transit Buses and Vans Chapter 7 Final Report Life-Cycle Cost Analysis
service failures due to a one-year increase in average fleet age However in most transit markets a significant proportion of bus riders have no viable alternative to bus and hence are unlikely to discontinue bus use after having experienced a road-call event Hence it can be assumed that the actual loss in ridership resulting from increasing in-service failures with increasing fleet age is much smaller than that presented in the table above
From the viewpoint of FTArsquos minimum service life policy the implications are as follows First it has been noted repeatedly throughout this report that very few agenciesrsquo retirement decisions are constrained by the current FTA minimums (retirements that generally occur two or more years after the retirement minimums have been satisfied and the timing of which has been determined by funding constraints) Given this situation it is unlikely that a decrease in the FTA retirement minimums would impact service reliability service quality ridersrsquo transit experiences or actual ridership levels In contrast an increase in the FTA retirement minimums would begin to constrain the vehicle retirement decisions of some transit operators by forcing them to maintain their transit vehicles for a longer period of time (see Figure 4-1) In this case the increase to the minimum retirement ages would negatively impact service quality service reliability riderrsquos transit experiences and potentially actual ridership levels
Federal Transit Administration 109
Useful Life of Transit Buses and Vans Chapter 8 Final Report Prior Useful-life reviews
CHAPTER 8 PRIOR BUS USEFUL-LIFE REVIEWS
This section reviews the results of prior useful-life research conducted by FTA and the Transit Cooperative Research Program (TCRP)
Initial Policy Statement ndash FTA Circular 90301
On June 17 1985 FTA (at that time UMTA) issued a change to its FTA Circular 90301 that incorporated the service-life policy for transit buses This marked the official public announcement of the FTArsquos position on the issue which required transit authorities to operate heavy-duty transit buses for a minimum of 12 years or 500000 miles with a maximum fleet-wide spare ratio of 20 percent FTA officials interviewed during the development of this study stated that the 12-year service-life requirement was not based on any detailed study Rather it was selected based on industryrsquos operating experience or ldquorules of thumbrdquo in maintaining heavy-duty transit buses
1985 Inspector General Statement
The 12-year requirement announced in the FTArsquos circular was not without controversy Later that same year the Inspector General (IG) unsuccessfully challenged the minimum service life policy attempting to increase the service life from 12 to 15 years and increase the spare ratio from 20 to 30 percent
1988 Useful Life of Transit Vehicles Study
In 1988 the FTA sponsored a study entitled ldquoUseful Life of Transit Vehiclesrdquo (UMTA-IT-06shy0322-88-1) This study focused primarily on the mechanical or engineering life of transit buses It excluded other factors such as the economic life ridership impacts and technological obsolescence of the vehicle The engineering analysis was focused on the life expectancy of the vehicle and components and not on any measure of vehicle condition
The key findings of this study were that the availability of capital funds and the FTA 12-year minimum were the main drivers of bus replacement decisions that the average age of retirements was over 16 years and that spare ratios of 20 percent were achievable with good maintenance Recommendations included increasing the minimum requirements to at least 14 years (600000 miles for commuter buses) allowing justified exceptions to the policy and developing a funding policy that encourages the extension of buses beyond their minimum life requirements
The earlier finding that the availability of capital funds is a key driver of fleet retirement decisions is consistent with the findings presented in this report In contrast while the 1987 study identified the 12-year minimums as a primary driver of replacement decisions for heavy-duty vehicles agencies participating in this study rarely referred to the minimums as a decision driver Rather for the current study agency participants suggested that replacement decisions were driven more by funding availability maintenance requirements and quality of service issues
Federal Transit Administration 110
Useful Life of Transit Buses and Vans Chapter 8 Final Report Prior Useful-life reviews
1988 Transit Capital Investment to Reduce Operating Deficits ndash Alternative Bus Replacement Strategies Study
In 1988 a study entitled ldquoTransit Capital Investments to Reduce Operating Deficits ndash Alternative Bus Replacement Strategiesrdquo (National Cooperative Transit Research and Development Program (NCTRP) Report No 15) surveyed several transit agencies to identify the major factors in current and planned bus replacement decisions The survey found that the availability of federal funds and vehicle age are among the top considerations while operating and maintenance cost reductions are typically not considered a driver for vehicle replacement At that time the average planned replacement age for heavy-duty buses for agencies participating in this study was 16 Funding constraints were a major factor in the plans to maintain vehicles in service for this length of time
The 1988 NCTRP Report also looked at the relationship between vehicle age and various components of operating and maintenance costs such as fuel and lubrication engine repairs AC and brakes A key objective of this study was to develop a methodology to incorporate operating costs in vehicle replacement decisions This is based on the studyrsquos hypothesis that the timing and extent of maintenance work affects the retirement age of a vehicle and the retirement decision affects the need for major work The actual study analysis was limited by data availability although the researchers did find a strong correlation between vehicle age and vehicle maintenance and rehabilitation costs The methodology developed by this study was designed to guide transit managers in evaluating the trade-offs between continuing to operate an existing vehicle ldquoas isrdquo replacing it or significantly rehabilitating it
1995 Bus Industry Summit
On September 22 1995 FTA convened a Bus Industry Summit to identify and discuss industry concerns related to FTArsquos bus service-life policy The summit yielded a broad diversity of opinions on vehicle useful life and several suggestions on how FTA might consider altering its service-life requirements For example many summit participants suggested that FTArsquos 12-year service-life standard for 40-foot buses should be reexamined These discussions included suggestions to both lengthen and shorten the minimum service-life requirement
bull 8-Year Bus Some manufacturers suggested moving to an 8-year service-life minimum It was suggested that this would ensure that the latest technological advances could be introduced sooner leading to cleaner lighter safer and more fuel-efficient buses It would also expand the size of the overall market potentially increasing the viability of the domestic transit bus market
bull General Reduction in Service Life Some agency representatives concurred with the general objective of a reduced service-life requirement under the expectation that this would enhance the vehicle thus driving down the base vehicle process and accelerating the adoption of new technologies The anticipated results were improved service quality and a stabilized vehicle market
Federal Transit Administration 111
Useful Life of Transit Buses and Vans Chapter 8 Final Report Prior Useful-life reviews
bull 15-Year Bus FTA staff noted that the US DOT Inspector General considered a 15-year service-life standard because of the lessened need for federal capital funds
bull 18-Year Bus A bus builder noted that Ontario Canada has an 18-year standard with a substantial overhaul scheduled for year 12 The practice of extending vehicle useful life to 18 years or more through enhanced initial design and materials specifications improved maintenance practices and application of more extensive and frequent vehicle rebuild programs has spread throughout Canada due to the lack of national capital funding for bus replacement
bull Flexible Policy Some participants argued that national policy should be flexible and should not be based on a one size fits all service-life standard They argued that a single standard cannot consider differences in ndash Climatic and demographic circumstances ndash Budgetary constraints and priorities of transit operators ndash Overall operating expenses ndash Maintenance practices and maintenance management systems ndash The types of operating systems on buses ndash Rebuilding and replacement policies
These varied responses show that there was no clear consensus among the Bus Industry Summit participants on an optimal minimum service-life policy Also in addition to these suggested changes in overall vehicle useful life it was also pointed out that useful-life issues directly impact decisions concerning the approach to warranty programs Maintenance management systems and rebuilding schedules are also impacted
Overall the meeting highlighted the need for analysis that would consider all of the factors that bear on the relative costs and benefits of moving to an alternative service-life standard For example maintenance and fuel costs the impact on service quality for riders early deployment of new safety efficiency and technical features the health of the bus manufacturing industry and funding impacts on a longer-term basis must be examined when considering changes in current replacement parameters based on a specified useful life
1997 Useful Life of Heavy-Duty Transit Buses Study
In 1997 the FTA sponsored a second study entitled ldquoUseful Life of Heavy-Duty Transit Busesrdquo (TCRP Project J-6 Task 15) This study was commissioned based on feedback from industry received during the FTA-sponsored Bus Industry Summit meeting (see above) This study expanded on the 1988 study by addressing variables such as operating environment regulations technology maintenance practices and operating economics
The purpose of this special study was to review relevant data in order to make recommendations on the appropriateness of the current service-life standard for heavy-duty transit buses The effort included an analysis of factors that impact vehicle life including the operating environment (eg climate terrain annual bus mileage average operating speed and urban suburban or rural)
Federal Transit Administration 112
Useful Life of Transit Buses and Vans Chapter 8 Final Report Prior Useful-life reviews
requirements mandated by the ADA Clean Air Act Amendments and others and the introduction of new technologies (eg alternative fuels advanced electronics)
This study identified duty cycle as likely the most important variable affecting vehicle life with the life of buses decreasing as the severity of the duty cycle increases The study suggested that average operating speed could be used as a proxy for duty cycle severity in future useful-life analyses14 Recommendations included changes to the current service-life policy to consider the total age of the fleet (and not the age of the individual vehicles) and the type of service the vehicle is operated under FTArsquos age and mileage standards were not changed following this study
Other Studies
The following are descriptions of several additional studies that have addressed the issue of transit vehicle useful life
bull In 1995 the New York Metropolitan Transportation Authority Office of the Inspector General published a report evaluating the then-perceived deterioration in the condition of New York City Transitrsquos bus fleet At that time one-third of the fleet was over the 12-year minimum retirement age and older buses were experiencing significant corrosion and parts failures The report attributed the poor conditions to the failure of management to establish and enforce preventive maintenance procedures and poor capital planning to purchase new vehicles and operate and maintain older age vehicles Recommendations emphasized the need for adequate maintenance and inspection policies especially targeted to buses over 12 years of age
bull In 2004 a group of university researchers led by Li et al developed a model to explore the contribution of preventive maintenance to vehicle condition Vehicle condition ratings (or the probability of a vehicle being at a condition rating) were calculated based on the vehiclersquos age mileage and amount of maintenance spending The decision analysis model evaluated the benefitcost ratio of the expected gain from extended life that would result from specific maintenancerepair actions and the associated costs The model developed in this study introduced a quantitative measurement of the expected benefits of maintenance actions on the vehicle life cycle The analysis clearly indicated a relationship between vehicle condition useful life and preventive maintenance practices
bull The 1988 Pennsylvania Department of Transportation (PennDOT) ldquoHandbookrdquo is a guide to assist transit agencies purchasing small transit vehicles The handbook contains information on the characteristics of small transit vehicles PennDOT procurement procedures and optional equipment with technical specifications and costs The expected life reported for standard vans body on chassis vehicles and small buses is 3 to 5 years 5 to 7 years and 10 to 15 years respectively all depending on a number of factors such as operating environment and preventive maintenance programs
14 Note that the analysis in Chapter 7 uses average agency operating speed as a cost driver for OampM costs However this study was unable to demonstrate quantitatively a relationship between decreasing operating speed and decreasing vehicle life expectancy
Federal Transit Administration 113
Useful Life of Transit Buses and Vans Chapter 8 Final Report Prior Useful-life reviews
bull The Small Transit Vehicle economics (STVe) model was developed by a group of university researchers and is designed to support decision-makers purchasing small transit vehicles The model provides an economic evaluation of various types of vehicles given the inputs of operating conditions such as type of service and capacity Types of vehicles listed in Table 8-1 are categorized based on characteristics that affect capital maintenance and operating costs The vehicle categories presented in the table and the expected useful lives for each of these categories are all roughly similar to those currently used by FTA
Table 8-1 Small Transit Vehicle Economics Model
Category Description Approx Seating Capacity
Expected Life+
1 Van 10 ndash 11 4 2 Van Cutaway Single Wheel 13 4
3G Van Cutaway Dual Wheel Gasoline 18 5 3D Van Cutaway Dual Wheel Diesel 18 5 4 Purpose Built Front Engine 22 6 5 Purpose Built Rear Engine 22 7 6 Medium-Duty Low-Floor Front Engine 20 7 7 Heavy-Duty Low-Floor Front Engine Varies 12 8 30 ft Heavy-Duty Bus Varies 12
+ As considered in the STVe model
Comparisons of Past Studies with This Report
Largely the findings of the studies sited above appear to be consistent with the findings reported elsewhere in this report Key common findings between this and prior studies include
bull Transit buses (heavy-duty buses in particular) generally have many years of valuable service life well after the service minimum age has been reached Also operators generally retire their vehicles well past this point in time
bull Vehicle retirement decisions are driven less by the service-life minimums than they are by funding availability maintenance requirements and quality of service issues
bull Economic and engineering analyses suggest that the current FTA service-life minimums are generally appropriate for each of FTArsquos five minimum service-life categories (ie there is no clear need to change the categories or the service-life minimums for each category)
bull Duty cycles (as measured by the average operating speed proxy) are a key driver of vehicle useful life especially for vehicles operated in fixed-route service
bull There are diverse opinions among industry representatives as to the preferred useful life of heavy-duty (ie 12-year) transit vehicles ranging from 8 to 15 years or more
bull There is value in having some flexibility in the application of the service-life minimums to reflect differences in agency service environments and to address the issue of problem vehicles
Federal Transit Administration 114
Useful Life of Transit Buses and Vans Chapter 8 Final Report Prior Useful-life reviews
Other Considerations
In addition to the considerations outlined above review of FTArsquos minimum service-life policy for transit buses and vans can also gain perspective from a brief review of this subject from different perspectives To that end the following sub-sections consider bus useful life from the viewpoints of the New Starts cost-effectiveness evaluation and the experience of Canadian transit agencies operating essentially the same transit buses as their American counterparts but for several additional years of useful life
New Starts Program Impacts
For FTArsquos New Starts program asset useful life values including those for transit vehicles are used to determine the total annualized cost of proposed New Starts investments New Starts projects with low annualized capital costs tend to have more favorable cost effectiveness and net benefit measures relative to those with higher annualized capital costs Hence revisions to FTA minimum service-life standards (the standards also used to annualized vehicle costs for New Starts investments) can have the potentially unexpected impact of lowering or increasing the cost-effectiveness measures for New Starts investments with bus or van components (eg BRT investments) Longer useful life results in increased years that vehicle capital costs will be spread over within the annualized cost calculation thus reducing the projectrsquos cost-effectiveness measure (increasing net benefits)
Note that this issue has already arisen with respect to some BRT designs intended to have a useful life of approximately 18 years Assigning an 18-year minimum useful life value to these vehicles (versus the current 12-year value for large buses) would make these vehicles more competitive with similar rail investments
The Canadian Experience
As already noted Canadian transit authorities do not receive bus replacement funding assistance from their national or provincial governments Because of this Canadian transit agencies tend to operate their buses longer and maintain a larger spare fleet than their US counterparts It is not clear how the service life of Canadian buses is influenced by the lack of Canadian federal assistance versus the fact that these operators have no spare ratio maximum Either way Canadian transit agencies have been operating transit buses with similar designs to US buses for 15 years on a consistent basis and have extended them to the 18-year range through enhanced designs and more extensive component replacement programs
Canadian agencies have also conducted cooperative research efforts into bus designs and the available means to extend useful life through more aggressive design specifications The results of these approaches are evident in the extended useful bus life for these operatorsrsquo vehicle fleets However the extent to which this longer vehicle life is driven by differences in bus design is not fully clear given that these agencies have higher spare ratios providing them with a larger pool of buses to draw from when problems are encountered within an aging fleet The conclusion then
Federal Transit Administration 115
Useful Life of Transit Buses and Vans Chapter 8 Final Report Prior Useful-life reviews
is that vehicle life can be prolonged significantly from the current FTA minimums for large buses The uncertainty is the full costs and service quality implications of extending vehicle life beyond 15 to 16 years
Case Study ndash US versus Canadian Useful Life
The transit bus industries in Canada and the United States use virtually identical vehicles and the services provided are very similar In both countries the majority of agencies are municipal Interestingly three of the six largest North American transit bus manufacturers are Canadian or have significant Canadian-based manufacturing facilities
Table 8-2 Geographic Locations of Major North American Bus Manufacturers
Manufacturer Head Office Canadian Facilities American Facilities
New Flyer Winnipeg MB Winnipeg MB St Cloud MN Crookston MN
Nova Bus St-Eustache PQ St-Francois-du-lac PQ NA Orion Bus Mississauga ON Mississauga ON Oriskany NY
NABI Anniston AL NA Anniston AL Gillig Hayward CA NA Hayward CA
Millennium Roswell NM NA Roswell NM
While there is significant Canadian content in the manufacturing and assembly of the buses the majority of the major components going into the final product specifically the high-dollarhighshyvalue items such as engines transmissions axles and HVAC are all supplied by non-Canadian companies and are almost exclusively US companies In addition exporting to the United States is critical for both New Flyer and Orion who have large US facilities in order to meet the Buy American requirements
Despite the similarities in the vehicles manufactured in the United States and Canada there is a significant difference in agency requirements for useful life As just noted Canadian agencies expect an 18-year useful life versus 12 years in the United Statesmdasha 50-percent increase above the US requirement Other distinguishing characteristics between the US and Canadian markets are reflected in the higher usage and productivity of urban transit in Canada Canadian transit use per capita is 150 percent of the US use (144 billion trips versus 917 billion trips) Of these trips it is estimated that 75 percent are made by bus in Canada compared to just over 60 percent in the United States Government funding (from all levels combined) on a per-capita basis is less than 80 percent of the US level
The buses used in the United States and Canada are virtually identical in design and purchased using similar specifications and procurement approaches Regardless Canadian agencies expect the vehicle to have an 18-year life From our interviews with agencies and manufacturers there are two leading factors driving this difference in expected bus life
1 Federal capital funding for transit is non-existent in Canada Other than intercity rail all transit funding in Canada is a provincial responsibility
Federal Transit Administration 116
Useful Life of Transit Buses and Vans Chapter 8 Final Report Prior Useful-life reviews
2 Provinces have not established long-term funding allocations While annual operating budgets are supplemented there is not an established formula for capital vehicle replacements similar to the FTA
The US agencies interviewed have adapted to the FTArsquos 12-year useful life for transit buses primarily because it is tied to the FTArsquos 80-percent funding Agencies have adjusted their internal funding and planned vehicle replacement schedules to match the established FTA funding streams In Canada where there is no established funding formula for vehicle purchases agencies must plan to keep their vehicles longer Agencies have therefore focused on an 18-year vehicle life
Federal Transit Administration 117
Useful Life of Transit Buses and Vans Chapter 9 Final Report Conclusions
CHAPTER 9 KEY FINDINGS AND RECOMMENDATIONS
Key Findings
Following are key findings from this study
Review of FTArsquos Current Service-life categories
The review of FTArsquos minimum service-life requirements yielded the following key findings
bull The current service-life category groupings are appropriate The study found that the current categories represent logical groupings of vehicles having broadly similar characteristics in terms of construction methods size weight passenger capacities cost manufacturers and customer bases A possible exception here is for 4-year and 5-year vehicles built using cutaway chassis where there is a significant degree of overlap between the two age categories in terms of construction type sizes and manufacturers
bull Transit has little ability to alter bus and van useful-life characteristics cost-effectively Given transitrsquos small share of the vehicle and component markets (typically less than one percent) the transit industry has little ability to influence component useful-life characteristics in a cost-effective manner A key exception here is the structure of 12-year buses To the extent that 12-year bus structures are designed specifically for transit use the transit industry has some leverage to influence this componentrsquos design and durability characteristics
Review of Procurement Regulations with Potential Useful-Life Implications
While many federal regulations (eg Buy America Bus Testing ADA and EPA) and industry procurement practices (third-party contracting) are believed to have potential useful-life implications these implications are generally considered minor relative to the issues of annual mileage new vehicle designs changing life-cycle economics and other drivers of useful life
Analysis of Actual Retirement Ages Using NTD Vehicle Data
The study used NTD data to determine how recent actual retirement ages for transit buses and vans compare with FTArsquos current minimum service requirements for transit buses and vans to determine whether these requirements are affecting the vehicle retirement decisions of the nationrsquos transit operators
bull Most buses and vans retired well after the minimum service age requirement is satisfied On average transit buses and vans are retired between one to three years after their minimum service-life requirement has been satisfied (Table 9-1) In addition a significant proportion of buses and vans remain in service at least one year past the retirement minimum (eg 20 percent of heavy-duty 12-year buses) and with many still in service three or more
Federal Transit Administration 118
Useful Life of Transit Buses and Vans Chapter 9 Final Report Conclusions
years past the minimum requirement (eg one in ten ldquo12-yearrdquo buses in active service are age 15 or older)
Table 9-1 Minimum Versus Average Retirement Age by Vehicle Category
Vehicle Category Minimum Retirement
Age Average Retirement
Age (Years) Share of Active Vehicles that are
One or more years past the retirement minimum
Three or more years past the retirement minimum
12-Year Bus 151 19 9 10-Year Bus 7 4 7-Year Bus 82 12 3
5-Year Bus Van 59 23 5 4-Year Van 56 29 10
Average retirement age estimates for these vehicle categories suffer from small sample issues
bull Minimum service age does not constrain agency vehicle retirement decisions Relatively few transit buses and vans are retired right at the minimum service age requirement Hence the current retirement minimums are not constraining the vehicle retirement decisions of the vast majority of the nationrsquos bus and van operators This indicates that any reduction to the current minimum age requirements (eg from 12 to 10 years for a ldquo12-year busrdquo) would not result in a significant increase in the rates of retirement for the five service-life categories
Industry Outreach
Representatives of local transit operators vehicle manufacturers and private bus fleet operators were interviewed to assess their current experiences with bus and van useful life The following are key findings from this industry outreach process
bull Actual retirement ages generally exceed both FTA minimums and agency service-life policies The actual timing of vehicle retirement for all nine agencies typically occurs between one to four years after the FTA minimum has been reached (but can occur as late as vehicle age 20) Moreover for most agencies the recent actual retirement ages also exceed the planned or policy retirement age Hence it is clear that FTArsquos current minimum service-life requirement is not actively constraining these agenciesrsquo retirement decisions
bull Capital funding availability is the primary determinant of retirement age Limited capital funding was cited as the primary reason why the timing of actual vehicle retirements has exceeded the planned and policy retirement age (and FTA service minimums) Because of this the average fleet age is more likely to be impacted by the increased availability of federal funding than by any relaxation in the minimum service-life requirements Other decision factors included service reliability vehicle condition vehicle maintenance physical and local environmental conditions procurement process and duty cycle (operating speed mainly)
bull Only large agencies operating in severe environments perform scheduled mid-life overhauls Only the larger urbanized agencies interviewed (Massachusetts Bay Transportation Authority New York City Transit Toronto Transit Commission and Washington Metropolitan Area Transit Authority) perform comprehensive ldquomid-liferdquo
Federal Transit Administration 119
Useful Life of Transit Buses and Vans Chapter 9 Final Report Conclusions
overhauls of their heavy-duty cycle vehicles stating that these overhauls are required to obtain full service lives given the tough service environments in which they operate In contrast none of the other agencies interviewed (including Los Angeles Metropolitan Transportation Authority and Houston Metro) regularly complete a mid-life overhaul with most suggesting it is not cost effective for them
bull Most agencies reported not being impacted by FTArsquos service-life requirements Most interviewed agencies stated that their vehicle retirement decisions are not significantly impacted by FTArsquos service-life minimums (these decisions are constrained more by capital funding availability)
bull Extending the service-life requirements would hurt many agencies Conversely most if not all of the agencies reported that they would be negatively impacted if current FTA minimum service lives were extended These negative impacts include a decrease in quality of service (higher rate of failures aesthetic of vehicles reliability) an increase in maintenance costs (between 10 to 50 percent higher) and less leeway to retire ldquoproblemrdquo vehicles
bull Agencies support development of a ldquolemon lawrdquo and a technology demonstration option Interview respondents supported development of a ldquolemon lawrdquo and a technology demonstration option The lemon law concept would permit early retirement of problem vehicles without penalty to the agency Under the technology demonstration concept a grantee could request a similar release from the service-life policy for FTA-approved tests of new vehicle technologies
bull Most agencies were not interested in more or less durable heavy-duty vehicles Most agencies stated that they were not interested in a more durable vehicle (ie with a more expensive heavier weight longer life expectancy structure) This is due to concerns over the cost effectiveness weight and rider comfort for this option All nine agencies also expressed significant concerns with a less durable vehicle (ie with a cheaper lighter weight lower life expectancy structure) There were concerns regarding the expected inability to survive the required duty cycles and the relationship with a decrease in quality and an increase in procurement efforts
Engineering Analysis
The engineering analysis provides further evaluation of bus useful life from a vehicle engineering perspective The following are key findings
bull Useful life is ultimately determined by the life of the vehicle structure Vehicle structure defines the useful life of the vehicle as a whole more than any other single vehicle component Should the structure wear out or fail due to corrosion or a collision then the life of the vehicle is essentially at an end
bull Service environment is a key determinant of structure useful life Many interview participants clearly indicated that service environment is a key determinate of structure (and hence vehicle) useful life Because of this several agencies expressed the desire that FTA revise the service-life requirements definition to include service environment severity along with service years and miles (eg 12 years or 500000 miles)
Federal Transit Administration 120
Useful Life of Transit Buses and Vans Chapter 9 Final Report Conclusions
bull ldquoStick busrdquo and low-floor vehicles may have shorter useful life Interview participants suggested that stick bus (structures constructed using hundreds of welded tubes) and low-floor designs (which use stick construction) may have shorter useful life as compared to traditional designs Interview participants stated that it is too early to tell whether this is in fact the case
Economic Analysis
The economic analysis identified the age for all vehicle categories at which total life-cycle costsmdashincluding all capital operating and maintenance costsmdashare minimized (reflecting the impact of differences in mileage) This analysis identifies a financially optimal retirement point for the vehicle
bull The minimum cost retirement points all occur at or after the FTA minimum service life From a cost-effective perspective FTArsquos current service-life minimumsmdashincluding both the minimum years and miles requirementsmdashrepresent reasonable choices For each service-life category the minimum cost point is attained at either an age or mileage that exceeds one or both of the FTA minimums for these measures
bull Reducing heavy-duty vehicle service life from 12 to 10 years would only have a minimal impact on vehicle sales Assuming all vehicles currently retired right at the current 12-year minimum shifted to a new 10-year minimum the long-term average annual replacement rates for these operators would increase from 200 to 300 vehicles to 240 to 360 vehicles annually or 40 to 60 additional vehicles per year The addition of 40 to 60 additional new vehicles is unlikely to yield a significant boost to the small domestic bus market
Recommendations
Based on the findings above it is recommended that the FTA consider the following
bull Maintain the current service-life minimums Few buses and vans are currently retired right at FTArsquos current service-life minimums Rather the vast majority of these vehicles are retained in service for at least one year (4- and 5- years vehicles) and as many as three or more years (eg for 12-year vehicles) after the minimum service requirements have been met indicating that these vehicles have some service life remaining beyond the minimums Moreover the current service-life age andor mileage minimums for all vehicle types occur before the minimum life-cycle cost points for these vehicles are reached Hence the current service-life minimums clearly meet the joint objectives of (1) ensuring that buses and vans purchased using federal dollars remain in service for most of their useful life (2) of providing agencies some flexibility in determining when their vehicles will be retired and (3) of helping to minimize life-cycle costs In this sense the current service-life minimums really are just that the minimum ages at which vehicles can be retiredmdashnot a recommended retirement age or a measure of actual expected useful life The current minimum service-life requirements should be maintained
bull Maintain the current service-life categories Similarly the segmentation of transit bus and van types into the current five service-life categories reflects actual similarities in vehicle
Federal Transit Administration 121
Useful Life of Transit Buses and Vans Chapter 9 Final Report Conclusions
structures designs components costs origin markets manufacturers and end users These current categories should be maintained
bull Review the service-life minimums and service-life categories regularly The analysis of recent changes in vehicle designs the adoption of new technologies and the introduction of new vehicle types (eg stainless steel BRT vehicles) highlight the fact that the useful-life characteristics of transit buses and vans are subject to change For this reason FTA should review the minimum life requirements and service-life categories on a regular basis (eg every 5 to at most every 10 years)
bull Consider adoption of a ldquolemon lawrdquo This law would define circumstances under which ldquoproblemrdquo vehicles could be retired early without financial penalty
bull Consider adoption of a technology demonstration option Similar to the ldquolemon lawrdquo this option would define circumstances under which agencies could retire vehicles purchased to test new technologies (with FTArsquos prior agreement) early again without financial penalty The intention would be to encourage test and adoption of new but potentially unreliable technologies expected to benefit the entire transit industry
bull Restrict the service-life categories in which vehicles are tested In recent years some manufacturers have successfully lobbied to have their vehicles tested in a more durable category than would appear warranted by their vehiclersquos general characteristics (eg testing a bus with 10-year characteristics as a ldquo12-yearrdquo bus) The result has been service reliability issues and in some instances early retirement for the purchasing agencies when the tested vehicles were not found to have the expected durability Thus FTA may wish to more tightly control which categories vehicles are eligible to test in based on some combination of characteristics (eg gross vehicle weight seating capacity) but with the potential for special waivers to test in a different category so as not to stifle innovation (Manufacturers should be required to provide reasonable justification as to why their vehicles should be tested in the higher durability category)
bull Modify the NTD reporting requirements to better document actual vehicle retirement age and each vehiclersquos assigned service-life category The analysis used in this study to determine actual vehicle retirement ages relied on cross comparisons of NTD data from multiple reporting years to identify when specific vehicle sub-fleets have been retired FTA should modify NTD to track the actual age of vehicle retirements thus significantly improving FTArsquos ability to track and monitor any trends in vehicle retirement ages Similarly NTDrsquos vehicle documentation should also include the service-life category to which each vehicle has been assigned (again to facilitate monitoring of the retirement ages for each service-life category)
bull Conduct a study to evaluate the sensitivity of bus ridership to changes in vehicle age and condition A key objective of this study was to consider how bus ridership might change (increase) in response to a reduction in the average age of the nationrsquos bus fleets (eg with the introduction of a new shorter lived heavy-duty transit vehicle) However while review of the existing literature provides numerous references to the sensitivity of ridership to changes in fares and service frequency no literature references were identified that provide a quantitative link between ridership and fleet age or condition In the absence of solid empirical data linking ridership and fleet age any analysis of this relationship can only be
Federal Transit Administration 122
Useful Life of Transit Buses and Vans Chapter 9 Final Report Conclusions
based on conjecture and limited anecdotal evidence For this reason it is recommended that FTA conduct a study to evaluate the sensitivity of bus ridership to changes in vehicle age and condition Given the availability of good-quality route-level ridership data (from electronic fare boxes and APCs) this study could easily be conducted using a sample of US transit operators using before and after comparisons of which older sub-fleets have been replaced by new (or newer) vehicles
Federal Transit Administration 123
1
Useful Life of Transit Buses and Vans Final Report Bibliography
BIBLIOGRAPHY
The following documents have been used as project resources
Books papers technical reports
Federal Transit Administration 1988 ldquoUseful Life of Transit Vehiclesrdquo UMTA-IT-06-0322-88shy1 Washington DC US Department of Transportation
This study focused primarily on the mechanical or engineering life of transit buses It excluded other factors such as the economic life ridership impacts and technological obsolescence of the vehicle
Abrams E and E Hide 1997 ldquoUseful Life of Heavy-Duty Transit Busesrdquo TCRP Project J-6 Task 15 Washington DC Transportation Research Board
This task reviews FTA guidelines on the minimum useful life of 12 years or 500000 miles of operation for heavy-duty buses The study expanded on the 1988 study and includes an analysis of factors that impact vehicle life (operating environments mandated requirements and new vehicle technologies) and makes recommendations on the appropriateness of the current service-life standards
American Public Transportation Association 1997-2002 ldquoStandard Bus Procurement Guidelinesrdquo
This is a comprehensive set of industry-wide purchase standards with both technical specifications and procurement guidelines for transit buses
Booz Allen Hamilton 2005 ldquoManaging Capital Costs of Major Federally Funded Public Transportation Projectsrdquo TCRP Project No G-07 Washington DC Transportation Research Board (TRB)
This report examines the strategies tools and techniques to better estimate contain and manage major transit capital projects Nine case study projects were examined in detail to provide insight into various project management approaches Major cost drivers considered in this analysis were initial inflation scope changes and schedule changes
Yang F L Yu G Song W Wang and W Pei 2004 ldquoVehicle Age Distribution Model and Application for Beijing Chinardquo Washington DC Annual Meeting of the TRB
This paper proposes a survival probability-based model to calculate and forecast the area-specific vehicle age distributions which uses the total number of registered vehicles (not distinguished by years) and the total number of newly registered vehicles or the number
Federal Transit Administration 124
Useful Life of Transit Buses and Vans Final Report Bibliography
of scrapped vehicles (the most recent year) The model is designed for areas where historical vehicle registration records are incomplete or unavailable
Li Q H Zhao and Y Xingping 2004 ldquoDecision Making Modeling for Rural and Small Urban Transit Asset Managementrdquo Washington DC Annual Meeting of the TRB
This paper describes the framework of a transit asset management system and discusses the methodologies developed to assist agencies in foreseeing the transit deterioration process The study explores the contribution of preventive maintenance costs to the vehicle condition ratings The optimization procedures developed help allocate sufficient funding to sustain future well-being of transit vehicles The concept of extended life (payoff for maintenance actions) of transit vehicles is introduced to provide a structure for the management decision-making process
KFH Group Inc 2000 ldquoAnalyzing the Costs of Operating Small Transit Vehiclesrdquo TCRP Report 61 Washington DC Transportation Research Board
This report serves as a user guide to the accompanying Small Transit Vehicle economics model which is designed to provide support to transit planners and other decision-makers on the purchase of small transit vehicles for different services and operating environments The user guide also discusses qualitative and non-financial factors that influence the size of vehicles to be purchased
Schneck D C and R S Laver 1995 ldquoTransit Capital Cost Indexrdquo Washington DC Annual Meeting of the TRB
This study presents the results of research aimed at improving the estimation of future capital costs for light and heavy-rail fixed guideway projects The research produced a set of cost indices for a broad range of project elements comparing these cost indices with broader measures of inflation and suggesting how they should be incorporated into cash flow projections for proposed fixed guideway projects
Pennsylvania Department of Transportation (PennDOT) Bureau of Public Transportation 1988 ldquoHandbook for Purchasing a Small Transit Vehiclerdquo Urban Mass Transportation Administration Washington DC US Department of Transportation
This handbook was developed to assist Pennsylvania grantees in the vehicle procurement process The first part of the handbook contains information on the characteristics of small transit vehicles objective criteria for selection and PennDOT procurement procedures while the second part provides a list of optional equipment and features with their technical specifications and approximate costs
Metropolitan Transportation Authority Office of the Inspector General 1995 ldquoIs New York City Transitrsquos Bus Fleet Too Old to Provide Reliable and Safe Bus Servicerdquo TRA 4506-4 ISNYC 94-79636 New York NY New York State Library
Federal Transit Administration 125
Useful Life of Transit Buses and Vans Final Report Bibliography
This document reviews the conditions and problems of the New York City Transit bus fleet which at the time had one-third of its buses over the 12-year retirement criterion Age-related safety performance and structural deficiencies are examined The report offers a number of recommendations to restore the fleet to a state of good repair and monitor the condition of its overage vehicles
Hemily B and R King ldquoThe Use of Small Buses in Transit Servicerdquo TCRP Synthesis Report 41 Washington DC Transportation Research Board
This research explores the use of small buses (30 feet or less) in the transit industry The study included a survey of North American transit agencies using small buses transit agencies that do not have small buses and bus manufacturers Results from this research were related to the fleet composition with respect to small buses the wide variety of vehicle models and service categories and overall experiences and most common areas of concern for transit agencies regarding small buses
2 FTA and agency reports
Federal Transit Administration 2006 ldquoNon-Rail Vehicle Market Viability Studyrdquo MI-26-7008shy051 Washington DC US Department of Transportation
Federal Transit Administration 1988 ldquoUseful Life of Transit Vehiclesrdquo UMTA-IT-06-0322-88shy1 Washington DC US Department of Transportation
Federal Transit Administration 1998 ldquoUrbanized Area Formula Programrdquo Circular C90301C Washington DC US Department of Transportation
Federal Transit Administration 1995 ldquoFinal Report Bus Industry Summit Proceedingsrdquo Washington DC US Department of Transportation
Federal Transit Administration ldquoBuy America Requirements ndash Surface Transportation Assistance Act of 1982rdquo 49 CFR 661 Washington DC US Department of Transportation
Federal Transit Administration ldquoBus Testing Regulationrdquo 49 CFR 665 Washington DC US Department of Transportation
Americans with Disabilities Act of 1990 United States Public Law 101-336
3 Internet sources
Altoona Bus Research and Testing Center lthttpwwwvsspsuedubtrchtmgt (January 16 2006)
American City amp County ldquoPublic TransitCommission Uses Third Party for Bus Procurementrdquo lthttpwwwamericancityandcountycommaggovernment_commission_uses_thirdindexhtmlgt (January 13 2006)
Federal Transit Administration 126
U F
seful Life of Transit Buses and Vans inal Report Bibliography
This article describes the bus procurement process taken by the Metropolitan Transit Commission (MTC) in St Cloud MN
Hubbard D 2005 ldquoIf It Makes It Here It Can Make It Anywhererdquo BUSRide Magazine lthttpswwwbusridecom200507If_it_makes_it_here_it_can_make_it_anywhere_aspgt (January 16 2006)
This article is about the Altoona Bus Research and Testing Center (ABRTC)
Goby D 2004 ldquoThe Environment and New Bus Service Liferdquo School Transportation News lthttpwwwstnonlinecomstnbusmaintenanceschoolbustechniciangoby_buslife0404htmgt (January 16 2006)
This is an opinion article on the environmental impacts of school buses with six- to eight-year service life compared to longer (10 to 15 year) service life
Federal Transit Administration 127
Useful Life of Transit Buses and Vans Appendix A Final Report Summary of Transit Agency Survey
APPENDIX A SUMMARY OF TRANSIT AGENCY SURVEY
Issue Area WMATA (Washington)
Toronto Transit
Montgomery Co Ride-On
New York City Transit MBTA (Boston) LA MTA
(Los Angeles) Frederick Co Capital Metro (Austin TX)
Jefferson Transit
General Experience - Federal Funding
Use Federal funding to purchase buses and vans (yn) Yes Limited
Few (some State funded - which is partially funded with federal sources most are from County
No use MTANY State Capital Funds Yes Yes Yes Yes Yes
Percent of fleet purchased using Federal funds 100
Limited diesel hybrid support on a demonstration basis (150 buses) - 13 city 13 province and 13 federal Rest of fleet is funded by agency or city Not given 0 100 Not stated
25-30 Other funding sources State and Local 99 95
General Experience - Service-life policy (Heavy-Duty Vehicles)
Have policy in place State or agency
Yes ndash imposed by WMATA board Yes
State (more stringent than FTA) and County policies
Not stated (use average age of fleet to make sure garages have equal distribution - not for policy)
Yes (use average age of fleet) Yes
Follow State policy which is similar to FTA (see table) Yes Yes
Planned agency policy retirement age
15 years for 40-foot
18 years at 40-45000 annual
12 for County funded none stated for State funded
12 years as an objective 12 years
13 years or 500000 miles (not given)
ldquo12-yearrdquo bus retirement target is age 15 ldquo7-yearrdquo is age 9 5-year bus target is age 8 and 4-year is age 5
Preferred retirement age from the viewpoint of agency staff
5 years due to funding limitationsconst raints
18 year can extend to 20-24 to correspond with procurement cycle
Same as FTAMD 12 years 8 years
12 years (Budget)
Yes FTAMTA minimums Maintaining vehicles for longer period is too expensive
Same as scheduled
Same as scheduled
Federal Transit Administration 128
Useful Life of Transit Buses and Vans Appendix A Final Report Summary of Transit Agency Survey
Issue Area WMATA (Washington)
Toronto Transit
Montgomery Co Ride-On
New York City Transit MBTA (Boston) LA MTA
(Los Angeles) Frederick Co Capital Metro (Austin TX)
Jefferson Transit
Do actual retirement ages differ from the scheduled retirement age
Difficulties with Thomas SLFs (scheduled at 12 failing at 10-11)
States NO but CNG buses had to be retired at 12-years due to high maintenance
Close to minimum life budget not a problem (delay usually due to procurement process)
Yes 13-15 years due to lack of funding (structural rebuild and re-power program to extend)
Yes Actual exceeds scheduled due to other funding priorities Use average age of fleet Target is 8 years for fleet average age unable to meet this because of limited funding
Yes due to budget and legal consent degree obligations
Yes but retirement was within 1-2 years for minimums Minibuses (retired at 6 years 145000 miles) were very old Cutaways (retired 6 years 210000 miles) very old No
Yes Prior to 4 years ago no established replacement schedule existed
Examples of recent sub-fleet retirements
Group of 1983 MAN artics operated barely 11-12 years (12-year sched) and 400k-500k miles (600k sched) All other groups retired at scheduled miles or more
Group of 1984 30-ft TMCs (retired 1999 - 15 years Expensive to maintain Group of 1989 30-ft Gilligs (retired 20012002 - 12 years) had been re-engined 19921993 no lift poor ac expensive maintenance drivers hated
Group of 1987 RTS (20-30k miyr retired 2006) kept in reserve fleet while other vehicles were in overhaul Group of 1990 RTS (retired 2006 360-380k miles total) 1990 RTS not sent through re-power program no engine replacement wo failure
Retired 032006 heavy duty Schedule 8 Actual 16 Retired 1205 heavy duty Scheduled 8 Actual 17 Retired 1204 heavy duty Schedule 8 Actual 18 Retired 1203 heavy duty Scheduled 8 Actual 19
1991 Orions (retired at 14 years) -replacement decision driven by increasing maintenance -does not use mileages Goshen coach (retired at 6 years averaged 150000 miles) Vehicles could not stand up to fixed route services
(1) 30 1993 TMC CNG (retired 032005) -Retired 6 month early due to CNG equip outdated 1986 Gilligs Phantoms (retired 92005) - kept for contingency and for use by local PD
1984 35 Foot Orion (retired June 2006) age 22 years and with over 800000 miles 1985 Orion (retired August 2006) age 21 years and with 892625 miles
Drivers of Retirement Policy
In order of priority Capital funding vehicle maintenance other-ridership physical conditionQOS
Agency Duty Cycle (need to specify vehicles to operate with heavy-duty) and Capital Funding (mainly the LACK of alternative funding option) Does not use average fleet age or percent over age due to lack of funding
Physical CondQOS agency duty cycle (which is lowmoderate) veh Maintenance cap funds
(1) Cap Funds (2) ConditionQOS (3) Maintenance (4) Duty Cycle (5) WeatherRoad (6) FTA reqs
Availability of capital funding FTA minimum requirements
ConditionQOS Maintenance Capital Funding FTA ages
FTA retirement ages OTHER MD MTA procurement cycle is slow (Frederick purchases most vehicles through the state) Significant lag between replacement order and vehicle delivery state rarely provides as many vehicles as requested
Maintenance Capital Funding FTA minimums (QOS can be attained independent of age)
Physical condition duty-cycle maintenance requirements and capital funding availability
Federal Transit Administration 129
Useful Life of Transit Buses and Vans Appendix A Final Report Summary of Transit Agency Survey
Issue Area WMATA (Washington)
Toronto Transit
Montgomery Co Ride-On
New York City Transit MBTA (Boston) LA MTA
(Los Angeles) Frederick Co Capital Metro (Austin TX)
Jefferson Transit
General Experience - Mid-Life Overhaul
Perform mid-life overhaul (yn) Yes
Yes at 6 and 12 years With further decline in provincial funding revise overhaul program established at 9-10 years
No tried back in 19921993 and found not cost effective Not effective likely due to easy duty (larger buses maintained by County)
Yes planned but not always done - last up to 15 years When not done rehab activities are as needed or on component basis Yes
Sometimes (no due to funding and manpower)
No Frederick is small agency only perform basic vehicle maintenance on-site Enginetransmis sion replacements are contracted out No other scheduled rehab performed
No on an as-needed basis No
Components included in overhaul cost of overhaul
Engine and major components (transmission brakes ac) avg $110kvehicle
Engine transmission plus extensive other components avg $100kbus NA
Power plant paint suspension transmission some structural $100-120k per bus Mini-overhaul 3-4 years paint interior brakes suspensions shocks airbags) = $30-40k Geared towards performance not extension gain in reduction of corrective maintenance and road incidents
Rebuild power plant AC brakes steering axels body and frame air tanks limited wiring Avg cost of $173000 bus NA NA NA
Overhaul on Vehicle types All 40-ft buses All 40-ft buses NA Heavy-duty Heavy-duty 40-ft fixed route NA NA NA
Additional years
Gets vehicles from 12 to 15 years additional 150k miles
Extends 12-15-year bus to 18 years NA
3-4 years if necessary to keep past 12 years but done as corrective maintenance and keep incidents to minimum 6 years NA NA NA NA
Federal Transit Administration 130
Useful Life of Transit Buses and Vans Appendix A Final Report Summary of Transit Agency Survey
Issue Area WMATA (Washington)
Toronto Transit
Montgomery Co Ride-On
New York City Transit MBTA (Boston) LA MTA
(Los Angeles) Frederick Co Capital Metro (Austin TX)
Jefferson Transit
Coordination of overhaul timing with expected life of major components (eg drive train replacement)
Coordinate with those that fail 6-8 years looking into additional smaller overhauls (39 and 12)
With extension of major overhaul to 9-10 year doing more componentmini overhauls during other years Components with separate replacement cycles (brakes steering suspension) are on an ongoing basis (vs one major overhaul) affects availability for service NA
Follow strategy of preventive maintenance Use overhauls plus campaigns to do most maintenance as schedule (vs corrective)
6-year midlife ensures continued performance of all components and subsystems
NA budget is major factor in whether midlife overhaul is performed NA NA NA
FTA Minimum Service-life policy
Impact of current FTA policy on retirement decisions (yn)
No however later in interview agency states some difficulty in reaching 12-year retirement age - did not retired but lighten duty
No (Canadian no life constraint)
Used as basis for policy schedule and actual retirement No impact
12-year minimums result in 6-year midlife rehab at considerable capital expense
Budget does not allow MTA to retire at 12 MTA attempts to retire at 13 yrs
Submits vehicle replacement requests to MD MTA as vehicles meet minimums State requirements for smaller vehicles are slightly more strict
No negative impact
No Vehicles exceed the FTA minimums in terms of both age and miles Staff viewed this as a ldquopositiverdquo for the current service-life minimums
Would you retire earlier than the FTA minimums if you could
No agency retires later (15 years) due to Board policy
No funding to do so Have kept vehicles longer than desired -would prefer to retire at 15 but no funding requires extending to 18 and further for procurement cycles Have retired buses earlier than preferred (no
No impacts from retirement ages
No impact exception of FTA funded 19831984 Grumman that could not handle NY duty and street conditions Reimbursed FTA for portion (80) - reason for use of State and City funds now Early
Earlier 8-year replacement would eliminate 6-year midlife rehab and ensure latest technology Have not retired earlier than FTA mins
Early possible but budget constraint Budget has forced longer service than desired due to absent fundingbudget Metro might entertain using shorter design lives Has retired early (fire and beyond
In general NO Current minimums are appropriate Would not retire sooner but do like to retire close to minimum ages for maintenance issues (not QOS) Exceptions are Goshen and Thomas SLF
Would not retire earlier in absence of requirements and has not forced vehicles pass desired age Have retired prior to FTA minimum (1993 TMC - due to CNG outdated) FTA approved early retirement
No vehicles still have yearsmiles of remaining useful life after minimums have been attained
Federal Transit Administration 131
Useful Life of Transit Buses and Vans Appendix A Final Report Summary of Transit Agency Survey
Issue Area WMATA (Washington)
Toronto Transit
Montgomery Co Ride-On
New York City Transit MBTA (Boston) LA MTA
(Los Angeles) Frederick Co Capital Metro (Austin TX)
Jefferson Transit
FTA requirement) due to high failure rates and maintenance
retirement affected other MTA projects and delayed procurements to refund those projects
economical repair)
which have provided problems Goshens keep longer than desired (are unreliable and unfit for fixed service)
Does your state have a minimum vehicle life policy No No
Yes same for larger vehicles more yearsmiles for smaller
Yes 7 years to cover all bus types No No
Yes (more strict than FTA minimums on smaller vehicles) Not stated
Yes same as FTA minimums
Recommendations
Options for agencies inclusion of rehab costs as reimbursable extended warranties as reimbursable
Suggest shorter useful life is NOT feasible for heavy-duty operations and procurement methods Minimum agemileage should be increased to 12151820 and 24 years FTA classification be revised for rehab costs to be included
No current minimums are appropriate Cannot judge appropriateness for smaller since they were recently purchased (previously contracted)
Makes sense to provide options mileage looks high on annual average should include rebuild costs as capital reimbursement (improve maintenance) stipulations on use of FTA funds for rebuild use testing to pre-qualify buses higher-level specs from ldquoWhite Bookrdquo
Reduce minimum agemileage to reduce maintenance costs Change 12-year 500000-mile category for 40-ft heavy duty to 8-year 300000 miles
Allow more discretion on buses not performing at optimum level In general age is acceptable No changes
Retirement minimums are OK extending them would be a problem due to increasing maintenance
No current minimums are appropriate
Maintain current policy
Vehicle Life Classes
Opinions on the usefulness and applicability of the current classification
FTA should provide options for each vehicle type make rehab and warranty reimbursable longer life
Mainly focus on heavy-duty buses maybe extend heavy-duty specs to smaller buses too No
Mileage seems high (calculate avg annual mileage and apply to each option consistently)
Useful but redefine to include 8-year 300000-mile heavy duty vehicles NA
Retirement minimums are OK extending them would be a problem due to increasing maintenance
No revisionsreducti onsincreases to minimums
They are good They allow for the purchase of a quality product and still provide reasonable replacement for high-volume
Federal Transit Administration 132
Useful Life of Transit Buses and Vans Appendix A Final Report Summary of Transit Agency Survey
Issue Area WMATA (Washington)
Toronto Transit
Montgomery Co Ride-On
New York City Transit MBTA (Boston) LA MTA
(Los Angeles) Frederick Co Capital Metro (Austin TX)
Jefferson Transit
shorter vehicles areas would be good but are the required components amp structure available
1st Option (more durable longer lasting vehicles)
Not right now possibly in future
BRT vehicles not considered yet have developed longer life vehicle specs with NYCT WMATA and MBTA focused on stainless steel structure composite panels and extensive rust protection
Only if other features come in not just for the sake of durability
Yes in terms of durability duty cycle places great strain on buses Stainless steel is key to this No
If such vehicles truly had an extended vehicle life METRO is very hard on vehicles and struggle to get past 12 yrs
No not appropriate for market concern of increasing maintenance costs and decreased reliability and service quality Yes
No We are not in a high-volume service corridor and a longer life vehicle would only put us behind in technological advancements that are of benefit for safety and operating costs
2nd Option (less durable shorter life vehicles)
Interesting but do not see benefits Component life is typically 6-8 yrs - would have to be in this range
No do not believe can handle heavy-duty cycles
Skeptical that vehicle can be constructed with cost savings to make it cost effective option Concern over increase of cost and effort of procurement process
Would not apply to NYCT duty cycles
No Looking for same heavy-duty vehicle with an 8 year minimum life requirement
Metro is hard on vehicles could work if vehicles were suitably durable
No current agemileage requirements are preferred Concern reduced life = reduce safetyreliability durability Consider life expectancy of vehicle structure and components
No revisionsreducti onsincreases to minimums
Our experience with shorter-life medium duty equipment has been negative Increased operating and repair costs for the agency more service disruptions and increased passenger dissatisfaction
3rd Option (allow agencies to replace vehicles as needed relying upon funding formula constraints to limit fleet
Currently done by agency (15-year major overhaul -considering mini overhauls in between) Would not do
Does not affect agency (Canadian) but
Yes but concern about
Should be done as an industry to cause a change in life
If funding match were changed to 5050 6040 7030 8020 9010hellipbased on equipment age mileage it would encourage prudent maintenance and vehicle
replacement activities)
anything different
believe this is best way
capabilities of other agencies No objection Reasonable
expectancy of buses
replacement practices
Federal Transit Administration 133
Useful Life of Transit Buses and Vans Appendix A Final Report Summary of Transit Agency Survey
Issue Area WMATA (Washington)
Toronto Transit
Montgomery Co Ride-On
New York City Transit MBTA (Boston) LA MTA
(Los Angeles) Frederick Co Capital Metro (Austin TX)
Jefferson Transit
4th Option (consisting of up to three different options of minimum retirement ages mileages for each vehicle category plus pre-defined rehabilitation requirements for each option)
Interesting but not appropriate to 40-ft and with agency policies would not alter procurement decisions would probably require incentive
No only do longer life durable procurements (no impacts to current procurement decisions) Heavy-duty 10-year option not useful - others OK (no experience with light-duty) Agency would require additional federalprovincia l funding
Interesting but skeptical Rehab provisions are of no interest (no rehab performed) Concern over capacity of rehab vendors to meet increased demand and how rehab would be monitored and approved by FTA
Yes like idea of options within consistent structure Procurement decisions not affected - would like to consider 15-18 year options Suggestion to reduce annual miles
No but suggest 8-year option
Yes alter procurement by more evaluation of trade-offs (age vs operating costs) Need to consider impact of sustaining vehicles on emissions Challenge Need to have good understanding of how increased age decreases QOS Incentives could encourage our procurement decisions to look at alternative procurement scenarios
Like having more options Interest in having rehab option but concern how smaller agencies might implement option (do not do rehabs typically contracted out) Who would perform rehabs and to what level General interest in longer more reliable vehicles no interest in short life (perceived as cheaper componentsreli abilitysafety)
No low pricebid not conducive to best value for rolling stock
No The mileages are too high for replacement the percentage of match funds We would be always running older behind the technological curve coaches
Effects of earlier bus replacement
No price benefits with shorter life components do not allow for shorterlonger life sourcing of parts for older vehicles is a BIG issue (longer life would increase problem)
Potentially more inventory control issues Vague answer
Reduced maintenance costs fuel costs midlife rehab costs emissions and increased customer satisfaction No negative impacts
Shortens time to adopt new techn (improved passenger amenities efficientlower emissions) Faster replacement means passengers benefit from newer equipment
Cheaper buses = cheaper components = decreased reliability
Federal Transit Administration 134
Useful Life of Transit Buses and Vans Appendix A Final Report Summary of Transit Agency Survey
Issue Area WMATA (Washington)
Toronto Transit
Montgomery Co Ride-On
New York City Transit MBTA (Boston) LA MTA
(Los Angeles) Frederick Co Capital Metro (Austin TX)
Jefferson Transit
Extend Minimum Life Additional costs including maintenance
Little effect on current costs (policy is already at 15) some financial impacts from procurements that couldnt make 15 year Maintenance expenses would increase because of increase in mean distance between failures
Increased need for mini overhauls of components slightly increase - planned component overhauls helping to maintain reliability and cost increases
Increased maintenance cost and demand more durable vehicles from manufacturers
Maintenance expenses would increase approx 8 per year
Addition of mid-life overhaul program higher rate of catastrophic failures and corresponding operating costs Costs increase Mid-life overhaul $50-$100k plus 10-50 higher maintenance cost (higher component and structural failures) Reliability reduced by 10-25
Increased maintenance expenses Passenger complaints also an issue (80 are work trips 50 are captive riders)
Higher maintenance costs (corrosion could cause additional costs) Running repair costs could go up 10-15 plus paint cosmetic and corrosion repair to be evaluated for feasibility
Would limit ability to purchase replacement coaches when funding was available could force us to use antiquated less passenger friendly equipment and limit our ability to expand future service maintenance costs would increase
EnergyEmissions impacts of earlier bus replacement
Slight increase in emissions but larger increases from newer engine performance Slight reductions in energy efficiency from original engine performance but larger reductions from newer engine performances
Have not seen increase or decrease emissions not changing energy nearly the same no decline in performance
EnergyEmissio ns would increase by 8 a year
Difficult to quantify Energy efficiency No unless significant breakthrough in engine efficiency
No on emissions No on energy newer engines are getting less mpg
New technology is leading the charge to produce emissions free vehicles Not all older fleets will be able to retrofit to current and future EPA requirements
Federal Transit Administration 135
Useful Life of Transit Buses and Vans Appendix A Final Report Summary of Transit Agency Survey
Issue Area WMATA (Washington)
Toronto Transit
Montgomery Co Ride-On
New York City Transit MBTA (Boston) LA MTA
(Los Angeles) Frederick Co Capital Metro (Austin TX)
Jefferson Transit
Other options for FTA to consider
Consider an 8-year minimum life option for heavy-duty larger buses keep same level of quality (no decrease in quality) Would improve customer satisfaction reliability maintenance latest technologies emissions fuel economy educated workforce positive community perception
Other options Large regional transit agencies should be allowed to use proposed pooled procurement approach This allows for 90 reimbursement They would have to allow other regional operators to piggy-back on those procurements
Supports development of more durable better quality 10-year bus (30-ft Orions are too large for downtown) desire for sturdydurable short vehicle capable of extended heavy duty
No impact on performance maintenance plans would be tailored to bus needs
Base FTA replacement schedules on serviceagency type urban rural or non-profit high-volume or low-volume Based on these criteria use variable agency match as the incentive to regulate quality maintenance and vehicle life
Vehicle Components ndash Impacts of Life Expectancy
Is maintainability life expectancy of vehicle components a key retirement driver
Structural members determine life (reason to retire early) - everything else is replaceable (choice is replace vs maintain)
Yes CNG buses had to be retired at 12 due to high maintenance -dont know for hybrids (expect same as diesel) AC drives rebuild every 5 years on hybrids Expect 500k miles on engine Structural corrosion is limited by stainless steel composite panels and rust prevention efforts
No although concerns of general maintainability are a factor
No Retirement is aged-based not component-based No component is durable beyond expected 12-years Yes
Increasing maintenance and decreasing reliability is primary concern of age
Yes if corrosion is bad then consider early replacement Yes
Federal Transit Administration 136
Useful Life of Transit Buses and Vans Appendix A Final Report Summary of Transit Agency Survey
Issue Area WMATA (Washington)
Toronto Transit
Montgomery Co Ride-On
New York City Transit MBTA (Boston) LA MTA
(Los Angeles) Frederick Co Capital Metro (Austin TX)
Jefferson Transit
Components important to replacement decisions
Heavy-Duty Electrical system (tends to go at 15) Engine and transmission the most expensive
Body structure panels corrosive protection drive train and suspension on low-floor vehicles
Components changed on correctivefailure basis Engines transmission alternators starters AC compressors air compressors fuel injectors AVL assemblies
Interviewees area not capable of answer general sense that no parts in particular cause problems but typically a range of components become less reliable
Structure axes exterior skin floor corrosion Other issues typically resolved with proper maintenance
Body condition (ie leaking excessive corrosion) power plant electronics failure structural wear and integrity
Components with no impact on retirement decisions
Doors brakes controls windows bumpers and interior replaced on a corrective basis Doors brakes and controls below that expected
Brakes seats stanchions suspension steering transmission paint flooring signage and wheelchair lifts
Other Issues affecting Procurement Process
Current procurement policy for your agency
Best value negotiated based on price and other factors (low bid no good = lower quality)
Low bid with tight specifications and brand requirements No bids have been fully compliant Needed to negotiate relative compliance to specs Tight specifications focused on body undercarriage and panels are more important in procurement
RFP - price is only 10 of evaluation great emphasis on quality (evaluated by quality selection committee) Low-bid
IFB amp RFP More advanced vehicles are usually purchased via negotiated procurement Believe procurement process has an effect on quality and expected life of bus
Purchase through the state (MD MTA) Have piggy backed some procurements with other counties (low bid) Best value RFP
Piggy-back on existing FTA approved bids
Federal Transit Administration 137
Useful Life of Transit Buses and Vans Appendix A Final Report Summary of Transit Agency Survey
Issue Area WMATA (Washington)
Toronto Transit
Montgomery Co Ride-On
New York City Transit MBTA (Boston) LA MTA
(Los Angeles) Frederick Co Capital Metro (Austin TX)
Jefferson Transit
Impact of procurement methods on useful life
Big impact on useful life due to higher quality product received (vs low bid = lower quality)
Impacts on longer-life requirements
Precludes known quality components No impacts
Best value as lowest bid does not always mean best value as the life expectancy could be worse Believes procurement process has impact on quality and expected life of bus
Yes If the bid options necessary for our service conditions are not available and yet we need to purchase the vehicle that vehicle will be retired at the FTA minimum as opposed to exceeding the FTA replacement criteria
Suggestions
Enhance standard bus procurement guidelines to include performance-based specs and include more optionsalternati ves Current specs are too prescriptive
If there was a good way to accurately estimate vehicle life cycle costs for certain vehicles especially composite vehicles
Proviso for small agencies to add options necessary to their service area or require RFP agencies to include in bids as many allowable options as possible It is not unusual to see a large agency produce specs with only their agency needs in mind and attach no options lists
Federal Transit Administration 138
Useful Life of Transit Buses and Vans Appendix A Final Report Summary of Transit Agency Survey
Issue Area WMATA (Washington)
Toronto Transit
Montgomery Co Ride-On
New York City Transit MBTA (Boston) LA MTA
(Los Angeles) Frederick Co Capital Metro (Austin TX)
Jefferson Transit
Impact of Buy America on useful life
Yes structural members drive useful life and Buy America does limitaffect how a manufacturer develops structure Buy America also limits design improvements due to limited marketcompetiti on for change
No requirements in Canada but do limit European content to 20 due to their use of low-carbon steel Have restricted use of frame design and manufacture from European suppliers
Only applies to state-funded vehicles (which is a minority)
Reduce heavy-duty to 8 years
Somewhat true Most Buy America compliant bus manuf build their bus structures outside of US though dont know whether this has a qualitative impact Given how small the US bus industry has become the current provisions may be restricting how quickly US Transit Properties can adopt the latest international technologies
Not qualified to answer (purchase through state)
Useful life is dependent upon procuring agency to know what they need and how to maintain
The Buy-America requirements increase the cost of a vehicle without necessarily increasing its useful life Lowering the Buy-America percentage will allow manufacturers to produce vehicles at a lower cost with the same or better quality Example Mercedes-Benz
Altoona Testing - Use of Testing Results
Yes use them but not rigorous enough Results included in price and other factor measurements for bid (weighed) More agencies should use results recommend providing actual test results (vs passfail)
Yes use the bus testing results in the evaluation and require the New York drive files from the B-35 bus route shaker test Not directly
Yes new purchasing is a in-houseconsultan t function consultants use Altoona when advising clients or writing specs Data could be organized to establish quality ratings as a guide in achieving minimum life requirements Suggestion Expand Altoona testing to include quality rating system for buses
Yes reports are reviewed and discussed with vendors prior to all new bus deliveries
Not qualified to answer (purchase through state)
Yes testing is required by APTA guidelines More testing as in Altoona will provide better information for agencies (but who will pay)
The Altoona testing is done in such a manner that it is of no practical value to maintenance personnel or to operations for passenger safety Competition between manufacturers is the best for achieving a quality long-life product Altoona simply adds costs passed on to the transit system
Federal Transit Administration 139
Useful Life of Transit Buses and Vans Appendix A Final Report Summary of Transit Agency Survey
Issue Area WMATA (Washington)
Toronto Transit
Montgomery Co Ride-On
New York City Transit MBTA (Boston) LA MTA
(Los Angeles) Frederick Co Capital Metro (Austin TX)
Jefferson Transit
ldquoWhite Bookrdquo
Adapt guidelines to reflect alternative useful life options
Very good idea guidelines should be performance-based and offer alternativesopti ons for each components include extended warranties as just warranties Need to develop plans to respond to many design exceptions
Yes and use more onerous specs from Toronto NYCT
See similar options for mediumlight duty Yes
Only if there was an understanding that 10 years in heavy urban transit can be far more severe than 15 in suburban
Not qualified to answer (purchase through state)
Yes as long as todays 12-year do not become tomorrows 10-year
Would you consider using design specification for an FTA approved 10 year bus
No due to 15-year Board policy If policy changes then maybe for limited specialty fleet like downtown circulators No
If bus components remained at 12-year level
Yes but not necessarily agree that a 15-year bus for suburban use got more funding than a 10-year bus for urban use Maybe
Would you consider using design specification for an FTA approved 15 year bus
Yes this way now would appreciate more work on bus specs for longer life buses
Already use No experience in medium or light duty but sounds ok No
I have yet to see a bus that will hold up well to 15 years service in heavy duty urban environment
No 15 years is too long Yes
Would you consider similar useful life Do not use No the light-options for medium except for No experience duty market is and light vehicles paratransit but sounds ok Yes Not applicable OK
Federal Transit Administration 140
Useful Life of Transit Buses and Vans Appendix A Final Report Summary of Transit Agency Survey
Issue Area WMATA (Washington)
Toronto Transit
Montgomery Co Ride-On
New York City Transit MBTA (Boston) LA MTA
(Los Angeles) Frederick Co Capital Metro (Austin TX)
Jefferson Transit
Use of useful life exempt FTA demonstration programs to advance adoption of new technologies
Good idea to help move state of industry forward use to introduce new technologies
Alternatives of interest to TTC are procurement of prototype buses from several manufactures to test in service before selection of supplier This is similar to NYCT program Also maybe lease buses to test new manufacturer or model in operations before authorizingappr oving for bid
RideOn is too small not in-depth experience with maintenance No Yes
No as a smaller agency small staff limited resources limited capability to support technologies Yes No
Bus Procurement Difficulties
Difficulties keeping a vehicle in service through the minimum life requirement
Yes used vehicles for lighter duty shorter service spans then moved to spare and contingency until 12-year
Yes 150 Orion 6 CNG buses that were unreliable and high maintenance Retired at 12-years trouble getting to that 12 years
Yes premature failure of cradles and frames
Yes Methanol TMC buses in 1992 need to be converted to diesel to run reliably
Goshens and Thomas SPFs found to be unreliable for fixed route now use for limited service on lower duty cycles or low ridership routes This increases service hours of more reliable vehicles
Yes TMC CNG buses (outdated CNG) No
Requested waiver from the service-life policy
Yes but rejected Not applicable No
Not in recent memory except for a handful of accident buses No No
Federal Transit Administration 141
Useful Life of Transit Buses and Vans Appendix A Final Report Summary of Transit Agency Survey
Issue Area WMATA (Washington)
Toronto Transit
Montgomery Co Ride-On
New York City Transit MBTA (Boston) LA MTA
(Los Angeles) Frederick Co Capital Metro (Austin TX)
Jefferson Transit
Reaction to creation of a Lemon Law for problem vehicles
Good concept difficult to qualityenforce Suggest for this to work there should be an industry-wide finding of poor performance (not just agency) - exclude them from counting against spare fleet allow agency to decide optimum retirement and ensure remaining years funding rolled into next procurement (perhaps with higher local funding reqs)
Yes Had New Flyer and Icarus artic space frame corrosion problem and structural failures that had to be expensively maintained to make 12-years Great
Yes under constraint that manufactures should be compelled to ensure the structural integrity and durability of bus frames with min maintenance requirements over the min life of the vehicle
Yes if it were necessary Option should not be used 1) following completion of normal warranty period 2) when the annual operating cost or fleet reliability are substantially different than the rest of an agencys fleet
Yes but need to define conditions under which it would be applicable Suggest really only apply to limited and fairly serious conditions OwnSelf problems not sufficiently problematic to warrant use of option
Yes if responsible party (bus supplier) is dealt with Yes
Other Suggestions and or Comments
Policies need to consider difference between large urban operators and small suburban or rural operators
Federal Transit Administration 142
Useful Life of Transit Buses and Vans Appendix B Final Report Summary of Vehicle Manufacturer Survey
APPENDIX B SUMMARY OF VEHICLE MANUFACTURER SURVEY
Issue Area Orion Bus Industries Millennium Transit Optima Bus Corporation
General Life Expectations
Current buses manufactured
Two models 30-40 length 44-47 passengers Minimum life 12 years Expected 18 years Altoona tested No inventory provided
Three models (1) Opus Under 30 305 length 23-27 passengers Minimum scheduled manuf estimated life of 12 years (2) Opus Under 35 35 length 31 passengers Minimum scheduled and manuf estimated life of 12 years (3) American Heritage Streetcar 2875 length 28 passengers Minimum scheduled and manuf estimated life of 12 years
Marketing based on FTA categories (yn) Yes
Yes vehicles in 12-year service-life category tested and sold Yes
Vehicles not subjected to Bus Testing Regulation
Yes the Sprinter Van bought by smaller agencies with local money
Yes and No Same buses are sold in Canada which do not have to meet regulation (sell based on service record)
Yes FTA granted waiver to perform additional testing on Opus Under 35 vehicles
Specific expected-life characteristics
18-year vehicles in Canada Agency customers ask for longer warranty period and extensive corrosion resistance in Eastern part of country (high salt environment)
No transit operators want buses that hold-up (argue their environment is the most severe) Not all 12-year buses created equal (New York does not purchase Bluebirds tested at 12-year does not hold up to NY environment)
Yes request from agency customers is for heavy-duty transit buses normally aligned with FTA minimums However they may choose to keep vehicles in service longer Primary determinants of vehicle retirement age operating environment and duty cycle maintenance needs above 12-year age
Recommendation of mid-life overhaul (yn)
Do not recommend on chassis Cannot predict future condition of vehicle depends on duty environment maintenance etc
Do not recommend or get involved No benefits to manufacturer if agency does or does not perform overhaul - overhaul funds go to component vendors
Recommend following vehicle and component maintenance schedule Need for mid-life overhaul dependent on duty cycle of vehicle
Components included in overhaul recommendation
No on chassis Engine and transmission should be replaced Manufacturer provides few unique parts for overhaul most parts are purchased directly from vendor
Provide few unique parts for overhaul but most parts are purchased directly from vendors
Engines transmission suspension and axle (approx cost of overhaul or update is a little over $18k)
FTA Minimum Requirements
Impacts by FTA minimums (design driver)
Yes especially the 12-year category Category fundamentally drives design 12-year is heavy-duty benchmark
Buses built to meet FTA service-life requirements Impacts would be from changes (1) sell less buses if increased to 15 years and (2) be put in competition with lighter-bus manufacturers if requirements decreased to 8 years Corrosion requirements dictate use of stainless steel and aluminum instead of mild steel
Yes design and durability affected by minimums Compete in heavy-duty market thus need to design for 12-year500000-mile vehicles Build relationship with agency as vehicles sold approach minimum ages Also affects sales of parts after components fail past warranty period but before reaching minimum age Drive design by specifying service-life requirements to component suppliers chassis and body durability and testing requirements of category establish engineering design levels for load stress and fatigue criteria
Federal Transit Administration 143
Useful Life of Transit Buses and Vans Appendix B Final Report Summary of Vehicle Manufacturer Survey
Issue Area Orion Bus Industries Millennium Transit Optima Bus Corporation
Vehicles or components affected
Components not replaceable or cannot be rebuilt - such as chassis
Structure required to last 12 years without class 1 or 2 failures Warranty periods depends on component manufacturers Engine manufacturers charger higher for 12-year warranty (ie price of 4 engines)
Chassis body axles suspension engine transmission floor crash worthiness and air conditioner
Customer requests different than FTA minimums
Canada requests 18-year vehicles Others want a 15-year life for chassis CNG tanks with 15 to 20-year service life No No
RecommendationsChang es to current FTA minimums
There has been debate over 12-year build vehicles not durable enough (ensure testing is within right category) Altoona testing should be more (stress the durability more) and have more of a passfail aspect
No changes Lower minimums would put company in competition with smaller-bus manufacturers Increase of service life would result in less vehicles sold Do not believe longer more durable bus can be manufactured Already build most durable buses out there
No changes recommended to current minimums Classifications should be revised if tied directly to Altoona Bus Testing and monitorregulation should be revised (less arbitrary subjective method) FTA minimum retirement ages are arbitrary classifications driven by Altoona testing Testing not always reliable benchmark as manufacturers choose category to test under Vehicles are also not given rating Testing not monitored by FTA or governing body In the eyes of the industry Altoona bus testing drives life expectancy of buses although transit operators cannot review testing reports Bus testing reports should be a determining factor because it gives insight into durability and reliability (failure types problems etc)
New Vehicle Life Classes
Current usefulnessapplicability of vehicle classification
Categories are not definite enough They conflict with EPA definitions and weight classes are too loose It is what it is
Minimum retirement age based on Altoona Bus Testing no passfail assignment manufacturers choose classification to test under Vehicles are given classification when it completes test regardless of length of test time or durability This gives marketing edge which forces manufacturers to test at highest possible classification regardless of vehicles quality or durability
Option 1 Longer-life vehicles
Interest in manufacturing Yes No do not believe more durable buses can be manufactured
No components would not survive longer minimum retirement ages In most cases component manufacturers cannot produce more durable components Also duty cycle plays a key role in retirement decisions Larger specialized BRT vehicles would more likely have strenuous duty cycle affecting ability to meet longer-life requirement
Characteristics
Characteristics would include being inherently resistant to corrosion and have a higher GVW (over 33000 lbs category)
Component suppliers would have to provide longer more durable components Longer-life vehicle would be heavier (heavy-duty parts or higher-cost materials) would reduce fuel economy and would increase purchase price
Federal Transit Administration 144
Useful Life of Transit Buses and Vans Appendix B Final Report Summary of Vehicle Manufacturer Survey
Issue Area Orion Bus Industries Millennium Transit Optima Bus Corporation
Challenges
Challenges would be to encourage a modular design (beneficial to operators) Same bus in different lengths the weight class is the discriminator Rebuild cycles would create problems with part availabilities such as engine parts
Could not support todays technology for long periods (engines software)
Cannot increase life-expectancy of components increase purchase price
Option 2 Shorter-life vehicles
Interest in manufacturing Yes - the need of transit operators differ especially duty cycles and suburbanurban areas
No focus is on 12-year buses Less desirable would mean eliminating options use of mild steel less expensive components European design methodology previously used for low-floor bus - did not pass testing Not our market niche
Characteristics Lighter weight lower-cost components lower expectation of durability maybe lighter duty engine
Truck engines and axles cheap seats medium heavy-duty engines Not our market niche
Challenges Establishing market for these vehicles Getting cost out from components not structure Not our market niche
Other options None None
New vehicle types hybrid electric Properties diesel or gasoline engine that rotates a generator providing electric power to electric mothers through either batteries or ultra-capacitors to an electric motor driving the rear wheels
Vehicle Components
Effects of maintainabilitylife-expectancy of vehicle component on service life
Structure dictates life of vehicle - retirement comes as structure cannot be economically repaired Yes specifically the major component systems
Yes maintainability and availability of parts plays a key role in retirement decision Another driver of retirement is the perception of ridership and willingness to ride older vehicles (vs newer vehicles that may attract more riders)
Components that impact service life Structure chassis
Engine (CNGs do not last as long as diesel) transmission destination signs axles HVAC CNG tanks
No specific components listed Overall maintainability and quality of vehicle impacts retirement decision
Components that do not impact service life Wear items glass moving parts wiring harness
Seats hand rail-stanchions radios destination signs fare box windows - changed as needed
Customers have transferred the following items from 15-year old vehicles to new vehicles in all of our models fare boxes radios and voice announcement systems
Challenges to vehicle components with longer vehicles
No challenges to longer-life vehicles - already build 18-year vehicles
Challenges to longer-life no change to engine warranty by engine manufacturers batteries on hybrids
Parts becoming obsolescent as a driving factor Challenges of longer-life vehicles to the following components affect all models engine transmissions axles lack of stainless steel chassis suspension package fiberglass components electronic systems (including wiring) HVAC system brakes air system alternators and doors (and door controls)
Federal Transit Administration 145
Useful Life of Transit Buses and Vans Appendix B Final Report Summary of Vehicle Manufacturer Survey
Issue Area Orion Bus Industries Millennium Transit Optima Bus Corporation
Challenges to vehicle components with shorter vehicles
Challenges to shorter-life vehicles take out cost with reduced service life smaller engines lighter axle rating
Challenges to shorter-life vehicles de-rating components (use lighter-duty components from automotive industry) mild steel structure (if benign operating environment was certain)
Downgrade of design of each vehicle Vehicles have been designed for 12-year500000-miles mindset of industry demand for this vehicle type would have to change if life expectancy decreased No specific components stated
Component life-expectancy driven by other markets Yes - axles brakes engines (but not transmission)
Yes - engine transmission HVAC (by refrigerator truck market) axles (drop axles not specific to bus market - off road is larger market)
Federal Transit Administration 146
Useful Life of Transit Buses and Vans Appendix C Final Report Engineering Interviews
APPENDIX C ENGINEERING INTERVIEWS
Questions
Service-life policy and T
How does your agency define the useful life
CATS (Charlotte NC)
argets
By age and then mileage
Golden Gate Transit (San Francisco CA)
Useful life is determined primarily by age but GGT will keep buses longer if condition is good
Harris County Metro (Houston TX)
Useful life is FTA 12 year
LA MTA (Los Angeles CA)
The MTA uses the FTA definition of useful life 500000 miles 12 years 40000 milesyear
Lane Transit District (Eugene OR)
LTD defines useful life according to FTArsquos service life criteria
MUNI (San Francisco CA)
Muni uses 12 years as economic useful life of buses Munirsquos buses are often in service for up to 16 years
WMATA (Washington DC)
FTA and APTA New Bus Procurement Guidelines
Does your agency have a target useful life for your standard 40 foot transit buses What is it for smaller buses
Target is for 12 years but can get 15 years from heavy-duty buses The target is 5 years150000 miles for cutaways
Target is 12 years Buses are typically in-service for 14 years OTR coaches are kept for 16 years Target is 12 years
13 years or 500000 miles
LTD targets 15-year service life Smaller buses are replaced at 7-year Same as above Policy is 15 years
Life Extending Practices What are they
What life extending practices does your agency utilize if any
MTA uses an extensive maintenance program to maintain its fleet of 2400 buses Nothing on structure
Midlife overhauls of engines flooring and other components as needed fleet wide campaigns as necessary (battery replacement etc)
Preventive maintenance (PM) and Vehicle overhaul (VOH) programs
Preventive maintenance
PMs are done by mileage at 6K and 12K As the Gillig Phantoms aged they were required to have a 3K PM due to engine issues
Rigorous PM program which includes engine oil and transmission fluid analysis at each oil change interval providing early warning of problems
Mid-life overhauls interiors suspension paint engine Basic
Daily ndash pretrip 3000 mile ndash Minor mechanical 12000 mile - Major mechanical PM inspections 18-day interior housecleaning
Specify corrosion resistant structure materials (aluminum stainless steel)
New bus specification are for a stainless steel structure
Do not spec entire stainless steel bus but will specify at critical areas such as power train mounting locations
Do not spec stainless steel
None Eugene doesnrsquot have issues with corrosion
Buses speced to be built with corrosion resistant materials but allow the bus builder to specify brand
Stainless steel amp protected carbon steel
Specify undercoating
Undercoating is included in specification None
Interior tube rust inhibitor Tectyl 506 Waxoy or equal Undercarriage Tectyl 127 CG or equal
Federal Transit Administration 147
Useful Life of Transit Buses and Vans Appendix C Final Report Engineering Interviews
Questions CATS (Charlotte NC)
Golden Gate Transit (San Francisco CA)
Harris County Metro (Houston TX)
LA MTA (Los Angeles CA)
Lane Transit District (Eugene OR)
MUNI (San Francisco CA)
WMATA (Washington DC)
Warranty What are your warranty requirements for a 40rsquo transit bus
Engine
2 year standard warranty (new spec calls for 5 year extended warranty)
5 year extended warranty
2 year standard warranty METRO does not use extended warranties as FTA does not fund
2 year standard warranty
Standard 2-year On new engine designs LTD purchases extended 5-year warranties
5 years 300000 miles
Transmission
1 year standard warranty (new spec calls for 5 year extended warranty)
5 year extended warranty
2 year standard warranty
2 year standard warranty Same as engine
5 years 300000 miles
If more than 10 failure rate considered fleet
Bus structure 12 year corrosion warranty
2 year standard warranty
defect per specification
40rsquo bus ndash 12 years 500000 miles
Procurement and Legislation
Do you think the low bid process has impacted the expected useful life of transit buses and vans
CATS does not use low bid they use a Best Value negotiated procurement
Yes ndash bus builders must use lower costlower quality materials to compete andor use lower costless qualified labor to assemble bus GGT has used a negotiated procurement on their last vehicle purchase
Yes ndash they had a very bad experience with Neoplan which was a low bid procurement
Yes absolutely The MTA has been burned by low bid processes
Not if you have a tight specification If your specification is tight the manufacturer can not substitute inferior quality parts that could cause service life issues
Muni uses negotiatedbest value method In past electric trolley bus fleet procurement the low bid winner was an Eastern European manufacturer that typically had shorter life spans than North American customer expectations
Yes Negotiated procurements give more flexibility to acquire more reliable components and system
Do you think the Buy America ACT in any way impacts the expected useful life of transit buses and vans
Limits choices especially for BRT type vehicles However this is not a current concern for CATS No
No ndash does not impact useful life
No negative impact LTDrsquos challenge is complying with the regulation in performing inspections and assuring component content source
There is not enough background data to know this
EPA Emissions
CATS stated that this is a good thing It has not influenced early retirement of buses but has required retrofits to older buses
CARB regulations more stringent than EPArsquos Resulted in small California transit bus engine market of only 400 engines per year making these engines an expensive
MTA operates in the most restrictive regulatory environment State EPA audits emissions twice per year
Diesel particulate filters on 2004 engine plugging prematurely causing excess back pressure This back pressure is expected to reduce life of the engine Too early to tell how much
Federal Transit Administration 148
Useful Life of Transit Buses and Vans Appendix C Final Report Engineering Interviews
Questions CATS (Charlotte NC)
Golden Gate Transit (San Francisco CA)
Harris County Metro (Houston TX)
LA MTA (Los Angeles CA)
Lane Transit District (Eugene OR)
MUNI (San Francisco CA)
WMATA (Washington DC)
FTA ADA
Has impacted facilities but not vehicles No None
On a recent bus procurement an ADA compliant wheelchair ramp was mechanically inferior to manufacturersquos standard ramp because the cables were tested and found more likely to fail in service
FTA Bus Testing Regulation No
Good requirement Helps assure the availability of quality products
Impact of Service Environment Vehicle Structure on Useful Life
Have you had any issues in meeting the FTA 12 year minimum life requirement
Have not had an issue with 40rsquo buses No
Engine cradles with NABI buses were a problem ndash but were addressed by the manufacturer
No as long as maintenance is performed the MTA meets the 12 year life
No issues with meeting 12-year life No
Aggressive PMrsquos and mid-life overhaul programs have allowed us to meet minimum life requirements for transit buses
What is the primary determinant of the useful life of the structure (service environment age mileage) Mileage
Service environment A unique Californian impact is the requirement to recycle bus wash water ndash this was found to be corrosive to the buses
Service environment Buses on demanding service routes get beat up much more quickly than buses of similar age or mileage
1) Construction 2) Environment The MTA operates in a harsh environment Every street has manhole storm drains that beat up the fleet on a daily basis
Age mileage repair costs and safety issues
Munirsquos severe service environment (ie the topography)
Service environment age and mileage plus life extending practices
To what extent does was your service environment the cause of early vehicle retirement
Charlottersquos service environment not a major determinant of useful life
GGT replaces buses at 12-14 years this is not necessarily because they are worn out
Results in cracking body loosening of panels more rattles
The environment is a key factor in the life of the fleet
It doesnrsquot Mild temperature
Early failures are sometimes seen around the interfaces between suspension and frame or axle and suspension if not properly designed for the Muni topography
Service environment causing early retirement of the vehicle is highly unlikely
Do you consider your service environment more severe average or less severe than the national average
Less severe to average (roads are in good shape do not use salt no snow)
Less severe to average Average
More severe The buses are abused by the environment loads and service demands Less severe
Severe Muni topography is unique and requires structure development is necessary and limited to a certain extent by foreign or domestic suppliers
Average to more severe due to winter salting of road surfaces
Federal Transit Administration 149
Useful Life of Transit Buses and Vans Appendix C Final Report Engineering Interviews
Questions CATS (Charlotte NC)
Golden Gate Transit (San Francisco CA)
Harris County Metro (Houston TX)
LA MTA (Los Angeles CA)
Lane Transit District (Eugene OR)
MUNI (San Francisco CA)
WMATA (Washington DC)
Different designs Low Floor or Articulated Do you expect the Only expect 12 years Too early to tell Low useful life of low-floor from low floor buses Have not run the low floor buses require vehicles to be less but could get 15 floor artics long more frequent Hope and expect the than or greater than years from high floor enough to form an replacement of same based on standard buses buses opinion No No issues suspension parts testing and analysis Equal to standard bus
What about articulated vehicles Na
Recently purchased some New Flyer articulated buses Too early to tell Same as above Equal to standard bus
What about for smaller cutaway and body on frame constructed buses
Had a 5-year target but high mileage and demanding service made it difficult to achieve
METRO Lift vans were originally purchased to keep for 3 years ndash will keep for 5 years No data
Muni does not employ these types of buses
Plannedscheduled overhauls
Do you perform a major mid-life rehab No
No Repair replace components as needed
No Buses are fixed when broken
Sometimes (no due to funding and manpower)
No LTD has studied but decided it wasnrsquot worth doing
No (just drive train) Flooring and other components as necessary
Mid life overhauls are performed to standard 40rsquo 12-year bus at the 4 and 8-year interval
Do you perform engine transmission overhauls at regular intervals
No Replace with rebuilt engine transmission as needed Typically swap out an engine at 200000-300000 miles (6-9 years)
GGT performs regular oil and fluid analysis for engines and transmissions to identify pending enginetransmission problems
No Will replace as needed A bus will go through 2-3 engines and 3-4 transmissions over its life Engines 250000
Yes Engine 350k miles Trans 250k miles Yes Midlife
Engine and transmission overhauls are performed to standard 40rsquo 12-year bus at the mid-life vehicle overhaul
Reliability of vehicles as age increases
How significant are reliability issues as your vehicles approach the end of their useful life
CATS is a young agency and it does not have long term service experience
GGT has not seen a deterioration of vehicle reliability as vehicles age This attributed to the PM program
Will see vehicles become more expensive to run as they age
If the fleet is maintained the life can be achieved
Maintenance requirements do go up as age of vehicle increases
It varies from fleet type to fleet type
Vehicles approaching the end of their useful life are less reliable and more costly to maintain depending on the life extending practices employed
Do you have quantitative measures of reliability versus vehicle age
Quarterly audits are performed that sample 25 of the fleet
METRO tracks operating costs not necessarily reliability Buses are replaced when they are considered too expensive to operate
No In process of switching to a new maintenance management system Yes
No quantitative measures of vehicle reliability vs age are employed at this time
Federal Transit Administration 150
Useful Life of Transit Buses and Vans Appendix C Final Report Engineering Interviews
Questions CATS (Charlotte NC)
Golden Gate Transit (San Francisco CA)
Harris County Metro (Houston TX)
LA MTA (Los Angeles CA)
Lane Transit District (Eugene OR)
MUNI (San Francisco CA)
WMATA (Washington DC)
Have you encountered issues sourcing replacement components for older buses
Yes ndash this is always an issue
Yes ndash can no longer get parts for Neoplans and have problems sourcing parts for European OTR coaches In contrast older RTS buses kept in service for up to 18 years
Yes Example Detroit Diesel has gone out of the transit bus business Parts are no longer available
No Oldest buses are 1991 Gilligs Parts are available
Yes This happens often with non-US supplied parts or if the bus builder or supplier goes out of business
New vehicle procurement contracts contain provisions that ensure support from the OEM for the life of the vehicle for items such as replacement parts
Alt-Fuels and Hybrid Vehicles
Has the useful life of alt fuels vehicles been less than standard diesel vehicles
CATS has two Allison hybrids There is concern that the extra weight may impact structure life
NA Will begin testing ethanoldiesel blend this year
No longer operate alternate fuel vehicles due to fueling station issues
Too early to tell The CNG buses require 30 more manpower to maintain Na Too early to tell
We anticipate their useful life to be equal to standard bus
Alternatively how does their long-term maintainability compare with standard diesel vehicles
The hybrid buses have very low maintenance Both buses have exceeded 50 longer brake life and may also achieve longer oil change intervals NA Na
Too early to compare Anticipate Muni may have to spend more time maintaining batteries Equal to standard bus
New Technologies (AVL AVM APCs Multiplexing collision avoidance cameras)
How do you expect the long-term performance of vehicles with new technologies will compare with older less technology oriented vehicles
Will take more resources to maintain buses with additional equipment which will impact vehicle life if maintenance resources switched from vehicle PM to maintaining new technology
Too early to tell Think of this type of equipment as separate from the bus Upgrades are necessary as the equipment ages independent of the bus age Equal to standard bus
Alternatively how do you expect their long-term maintainability to compare to standard vehicles with less equipment
All of these systems result in higher electrical loads on the bus It is expected that there will be electrical system problems previously not seen on standard buses with less equipment
Maintaining new technologies is a challenge The staff are not trained on maintaining new technologies
The more high tech features a bus has the more failures are experienced For example a new fleet of electric trolley buses had significantly higher failure rates (lower mean distances between failures) Equal to standard bus
Federal Transit Administration 151
Useful Life of Tran Final Re
sit Buses and Vans Appendix C port Engineering Interviews
Questions CATS (Charlotte NC)
Golden Gate Transit (San Francisco CA)
Harris County Metro (Houston TX)
LA MTA (Los Angeles CA)
Lane Transit District (Eugene OR)
MUNI (San Francisco CA)
WMATA (Washington DC)
Do you think reliability with these vehicles as they age will lead to the need for a greater spare fleet
Anticipate that all these additional systems will have an impact on long-term life of electrical system due to the additional loads (have not had good reliability with cameras) Bus radio is the system that will keep a bus from going into service
No Currently buses are not held out of service if these systems (ie cameras) are not working
These technologies will increase maintenance costs but will not impact useful life
This may be an issue Too early to tell Yes
No at this time we do not anticipate the need for a greater spare fleet due to reliability issues
Federal Transit Administration 152
Useful Life of Transit Buses and Vans Appendix D Final Report Minimum Life-Cycle Cost Methodology
APPENDIX D MINIMUM LIFE-CYCLE COST METHODOLOGY
Chapter 7 presents the results of life-cycle cost analyses for each of the existing FTA minimum service-life categories This appendix presents the methodology behind that analysis Specifically this discussion includes
bull Adjustment of participant agency supplied life-cycle cost data to reflect differences in annual fleet mileage
bull Calculation of annualized cost factors
bull Calculation of annualized vehicle acquisition major component replacements and vehicle rehabilitation costs
bull Regression analysis and annualization of OampM costs
bull Calculation of total annualized costs
Conversion of Participant Life-Cycle Costs to Reflect Differences in Annual Mileage
Agencies and vehicle manufacturers participating in this study supplied life cycle costs for major component replacements and rehabilitations of their transit vehicles (see Appendix E) Note however that the agencies providing data have annual mileages that are close to the national average (ie about 37000 miles annually for a 12-year bus) Hence while the timing of major component replacements for these agencies is representative of industry averages they are not representative of agency fleets with lower or higher average annual mileages (eg 25000 or 45000 miles per vehicle per year respectively) As discussed in Chapter 6 agencies with lower annual fleet mileages per vehicle will be able to ldquostretch-outrdquo their major component replacement cycles while agencies with high annual mileages per vehicle will need to accelerate those cycles relative to operators with average fleet mileages
Therefore to conduct analyses considered representative of the nationrsquos full distribution of transit fleet mileages the life-cycle cost data were adjusted to replicate the annual mileage of three separate annual vehicle mileage groups 25000 miles 35000 miles and 45000 miles This adjustment was completed by first converting each componentrsquos reported replacement age to a replacement mileage value based on the annual vehicle mileage of the operator supplying the data (ie multiply annual mileage by the component replacement age) Next the replacement mileage values for each major component were used to determine the number of years that component would remain in service for fleets of varying annual average vehicle mileages For example if bus engine was determined to have roughly 250000 miles between rebuilds operators with only 25000 miles in annual service only need to rebuild this engine in (250000 miles) (25000 miles per year) = 10 years In contrast an agency operating its vehicles 45000 miles each year will need to rebuild the engine in roughly 55 years
Federal Transit Administration 153
Useful Life of Transit Buses and Vans Appendix D Final Report Minimum Life-Cycle Cost Methodology
Calculation of Annualized Cost Factors
Next all vehicle costsmdashincluding the cost of vehicle acquisition major component replacements rehabilitation activities and operating and maintenance (OampM) costsmdashneed to be converted to an annualized basis Annualizing tells us what the cost of each item would be on a per year basis if maintained in service for x years Here the value of the annualized cost can be calculated for any value of x allowing determination of the annualized cost if the vehicle is owned for a period of time including 1 year 2 years 12 years 18 years or more
Table D-1 The factor for annualizing any cost is given by the Annualization Factors (70) following Annualization
Years Factor 1Years minustAnnualized Cost Factor= (i (1minus(1+ i) )) 1 1070 1000
2 0553 0500 Here t is the number of years a component or 3 0381 0333
4 0295 0250 vehicle is expected to remain in service and i is the 5 0244 0200 discount rate (set to 7 percent for this analysis in 6 0210 0167 compliance with OMB guidance) Note that the 7 0186 0143
value of the annualized cost factor declines as the 8 0167 0125 number of service years for a component increases 9 0153 0111 (ie as the cost of that component is spread over an 10 0142 0100 increasing number of service years) The values for 11 0133 0091 the annualized cost factor at different years of 12 0126 0083
13 0120 0077 service are presented in Table D-1 (for the sake of 14 0114 0071 comparison Table D-1 also includes the value of 15 0110 0067 1years a frequently used but imprecise means of 16 0106 0063 estimating annualized cost) 17 0102 0059 18 0099 0056
Calculation of Annualized Vehicle 19 0097 0053 20 0094 0050 Acquisition Major Component
Replacement and Rehabilitation Costs
Next these annualized cost factors were used to estimate the annualized value of all vehicle costs excluding OampM costs This was merely a matter of annualizing the costs of vehicle acquisition major component replacement and rehabilitation activities using the annualization factors This calculation is presented below The double summation represents the discounted cost of all components (x) replaced as of vehicle age t The value Annualized Vehicle Cost t then provides a vehiclersquos total annualized cost value were that vehicle to be retired at age t (excluding OampM costs which are considered next)
minustAnnualized Vehicle Costt = (Vehicle Acquisition Cost+sumsumComponentCostxt )(i (1minus(1+ i) ))
Federal Transit Administration 154
Useful Life of Transit Buses and Vans Appendix D Final Report Minimum Life-Cycle Cost Methodology
Regression Analysis and Annualization of OampM Costs
To this point the analysis has excluded all vehicle OampM costs (eg fuel preventive maintenance and corrective maintenance) As noted in Chapter 6 OampM costs tend to increase overtime as vehicles age (ie as smaller parts begin to fail more regularly and fuel economy tends to decrease) The first step for this analysis was to develop regression models to model increasing OampM costs with increasing vehicle age Unfortunately this study did not have the resources required to conduct a detailed primary data collection effort of OampM costs by vehicle age for all five minimum service-life categories (and across multiple operators) For this reason members of the study team drew upon an earlier analysis completed for a group of over 40 different small and medium sized bus operators based in Illinois Together these Illinois operators use each of the bus and van types represented by FTArsquos five minimum service-life categories and have multiple years of cost records for their vehicle fleets
Analysis of Illinois OampM cost data yielded the following regression model of OampM cost per mile at vehicle life-to-date (LTD) mileage x for 40-foot buses (t-stats in parenthesis)
Cost per mile at LTD mileage x = -0783 + 401E-07( LTD Miles) ndash 00317(Operating Speed) (-941) (511) (-527)
The results of this model are presented in Figure D-1
Figure D-1 Life Cycle Cost Profiles Annualized OampM Costs
(35000 miles per year 40 Ft bus)
$0
$5000
$10000
$15000
$20000
$25000
$30000
$35000
$40000
$45000
$50000
Ann
ualiz
ed V
ehic
le O
ampM
Cos
ts
Low Speed (8 mph) 35000 miles per yr
Medium Speed (12 mph) 35000 miles per yr
High Speed (20 mph) 35000 miles per yr
1 2 3 4 5 6 7 8 9 10 11 12 13 14 15 16 17 18 19 20
Vehicle Age (years)
Finally the equation above provides the cost per mile at different LTD mileages However to calculate the annualized values of OampM costs at age t these LTD mileage based costs must be summed across the full life of the vehicle through age t discounted and then annualized
Federal Transit Administration 155
Useful Life of Transit Buses and Vans Appendix D Final Report Minimum Life-Cycle Cost Methodology
Calculation of Total Annualized Costs
Once OampM costs are added to the mix the final calculation of total annualized cost is given by
minustAnnualizedVehicle Costt = (Vehicle Acquisition Cost+sumsumComponentCostxt + LTD O amp M Costs)(i (1minus (1+ i) ))
This analysis was then used to calculate total annualized cost at each age to determine the specific vehicle age at which life-cycle costs for each vehicle type are minimized
Federal Transit Administration 156
Useful Life of Transit Buses and Vans Appendix E Final Report Heavy-Duty Vehicle Life-Cycle Cost Analysis
APPENDIX E HEAVY-DUTY VEHICLE LIFE-CYCLE COST ANALYSIS
Chapter 7 provides a high-level minimum life-cycle cost analysis for heavy-duty 12-year transit buses The presentation there is indented to provide the reader with a high-level overview of that analysismdashyielding an understanding of the results but without focusing on the details of the analysis In contrast this appendix reproduces much of that presentation this time providing an understanding of the details behind that analysis (including application of the minimum life-cycle cost analysis as presented in Appendix D)
Heavy Duty Vehicle Life-Cycle Cost Analysis
Using the analysis of national differences in operating characteristics and rehabilitation practices as presented in Chapter 6 this appendix develops a detailed life-cycle cost analysis of the 12shyyear 40-foot vehicles that constitute the bulk of the nationrsquos bus transit fleets This analysis is then used to identify that point in the vehicle life cycle when the sum total of all annualized costs (capital operating maintenance and rehabilitation) is minimized This minimum life-cycle cost point represents a financially optimal age to retire and replace a vehicle in effect providing a measure of ldquoeconomic useful liferdquo (as distinguished from an engineering useful life or other measure) As expected the point at which life-cycle costs are minimized can vary appreciably given differences in annual mileages average operating speeds and rehabilitation practices
Specifically this analysis considers the following life-cycle costs
bull Acquisition Cost and Disposal Value Purchase cost plus related procurement costs as well as the expected sale price or scrap value of the used vehicle
bull Expected Component Replacements and Mid-Life Overhaul Costs This includes the cost of all expected component replacements and rebuilds that naturally occur over the life of a vehicle (eg drive train rebuild) as well as the cost of any additional planned mid-life overhaul activities (if any) These costs are oriented toward the larger component replacement rebuild or rehabilitation needs and exclude the cost of minor vehicle repairs Examples include ndash Engine and transmission rebuilds ndash Other expected component replacements (eg brakes tires batteries suspension) ndash Mid-life overhaul costs (eg repainting replacement of flooring upholstery windows
bodywork)
bull Operating and Maintenance Costs Includes the cost of fuel preventative maintenance programs and the cost of all labor and parts for minor repairs as required to maintain vehicles in good working order
Federal Transit Administration 157
Useful Life of Transit Buses and Vans Appendix E Final Report Heavy-Duty Vehicle Life-Cycle Cost Analysis
The following sub-sections provide an analysis of the expected annual cost of these different cost types throughout the vehicle life cycle beginning with a discussion of expected component replacement and mid-life overhaul costs
Expected Component Replacement and Overhaul Costs
Figure E-1 presents the distribution of expected major component replacement and overhaul costs over a potential 20-year life cycle for a 40-foot transit bus (hence it excludes the cost of vehicle acquisition and all other vehicle operating and maintenance costs) The chart assumes a vehicle that averages 35000 miles per year over the full life cycle The chart also considers the two cases of (1) those agencies that complete an extensive mid-life overhaul and (2) those agencies that do not complete a mid-life rebuild but carry out their major component replacements on a continuous as-needed basis The analysis also assumes that the number of times a given replacementrebuild activity is performed depends on the vehiclersquos age at the time of retirement For example if engine rebuilds occur on roughly a six-year cycle (every 210000 miles) then this activity will occur once for a vehicle retired before 12 years twice for a vehicle retired before 18 years and 3 times for a vehicle retired at age 20 or later Similarly it is assumed that agencies currently pursuing a major mid-life rebuild program at vehicle age 7 (for example) would want to repeat the process again at age 14 if the vehicle was expected to operate well past that age
Figure E-1
Life Cycle Cost Profile Major Component Replacements and Overhauls
Maj
or C
ompo
nent
Rep
lace
men
ts a
nd O
verh
aul C
osts
$140000
$120000
$100000
$80000
$60000
$40000
$20000
$0
(Assumes 35000 miles per year)
Major Mid-Life Overhaul (40ft)
Continuous Rehabilitation (40 ft)
Optional (Rehab activities not
performed within 1 to 3 years of retirement)
1 2 3 4 5 6 7 8 9 10 11 12 13 14 15 16 17 18 19 20
Vehicle Age (years)
In reviewing Figure E-1 it is easy to identify the timing of major vehicle replacement activities In particular the timing of the seven-year major mid-life overhaul (and its potential repetition at age 14) stands out clearly These investments include the cost of engine and transmission rebuilds repainting significant rehab and replacement of vehicle interiors (flooring upholstery and windows) bodywork as needed some electrical work and other upgrades In contrast the mid-life peaks for those agencies that do not perform a major mid-life overhaul are significantly
Federal Transit Administration 158
Useful Life of Transit Buses and Vans Appendix E Final Report Heavy-Duty Vehicle Life-Cycle Cost Analysis
lower (fewer rehab activities equate to lower costs) but also have higher cost peaks for the intervening years (as some replacement activities tend to be more spread out) The smaller peaks primarily represent replacement of those components having shorter expected lives including tires brakes and batteries
From the viewpoint of evaluating FTArsquos service-life policy the key point is that whether or not an agency conducts a major mid-life overhaul there are major cost cycles that are repeated throughout an vehiclersquos life cycle which are roughly concurrent with drive-train rebuilds (eg the cost peaks at roughly ages 6 to 7 and 12 to 14 in Figure E-1) These major cycles help guide agency rehab-replacement decisionsmdashspecifically agencies will only complete a major vehicle rehabilitation initiative if they intend to keep that vehicle in service for at least three to five years after these improvements have been made For example in the case of a heavy-duty vehicle approaching 12 years in age an agency will only reinvest in that vehicle (eg rebuildreplace the engine and transmission) if the agency intends to obtain an additional three to five years of revenue service from that vehicle Otherwise these rehabilitation activities will be avoided (to save cost) and the vehicle will be retired after the minimum retirement requirements have been satisfied To summarize vehicle rehab and replacement decisions are determined by the timing of the vehiclersquos major reinvestment cycles with the timing of these cycles determined by annual vehicle mileage average operating speed and environment and agency maintenance practices
Finally the difference in the timing of the ldquomid-liferdquo activities as presented in Figure E-1 is an artifact of the particular operating characteristics maintenance practices and service performance standards of the sample of agencies that provided data for this study In other words it should not be expected that all major mid-life overhauls only occur at age seven (they may happen earlier or later depending on differences in average annual mileage rehab policies funding availability and other factors) Similarly those agencies that perform more continuous rehabs do not all concentrate their ldquomid-liferdquo activities at age six Rather these activities are ldquospread outrdquo over multiple years Again the exact timing of these activities can and do occur at differing times for different agencies depending on differences in annual mileages rehabilitation practices and operator finances
Figure E-2 highlights how differences in annual vehicle mileages can impact the timing and cost of component replacement and overhaul activities Specifically this example presents the expected life-cycle cost profile for agencies performing major mid-life rebuilds but with fleet vehicles traveling an average of 45000 35000 or 25000 miles per year As expected vehicles traveling fewer miles per year require less frequent component replacements (and hence lower average annual costs) while higher mileage vehicles have more frequent component replacement needs This same analysis is repeated for those agencies that do not perform major mid-life rehabs in Figure E-3
Federal Transit Administration 159
Useful Life of Transit Buses and Vans Appendix E Final Report Heavy-Duty Vehicle Life-Cycle Cost Analysis
Figure E-2 Life Cycle Cost Profiles Major Component Replacements and Overhauls
(Agenices Performing Major Mid-Life Overhauls)
1 2 3 4 5 6 7 8 9 10 11 12 13 14 15 16 17 18 19 20
Vehicle Age (years)
Annualized Acquisition Major Component Replacement and Overhaul Costs
The analysis next adds the cost of vehicle acquisition to the component and mid-life rehabilitation costs considered above (operating and maintenance costs are considered shortly) All of these costs are then annualized over different time periods The combined annualized costs are presented in Figure E-4 The cost values in this chart provide a measure of the average cost of ownership for a 40-foot vehicle at each vehicle age15 As the number of years of ownership increase the vehiclersquos acquisition cost is spread over an increasing number of years thus reducing the average annualized cost of ownership (leading to the downward sloping curve) The bumps in this curve capture the timing of major component replacement and overhaul activities (costs that also decrease on an annualized basis as vehicle age increases as these costs are spread over increasing years of service)
$0
$20000
$40000
$60000
$80000
$100000
$120000
$140000
$160000
$180000
Maj
or C
ompo
nent
Rep
lace
men
ts a
nd O
verh
aul C
osts
Major Mid-Life Overhaul (40ft) 45000 miles per yr
Major Mid-Life Overhaul (40ft) 35000 miles per yr
Major Mid-Life Overhaul (40ft) 25000 miles per yr
Optional (Rehab activities not
performed within 1 to 3 years of retirement)
15 More precisely annualized cost is not the actual cost divided by the number of years of service (eg acquisition cost vehicle age) Rather annualized cost represents the stream of annual payments the net present value of which are equivalent to the initial investment cost Specifically the annualized cost of the vehicle acquisition cost for any age is given by
minus Vehicle Age )(Acquisition Cost ) (i (1minus (1+ i) ( ))
Federal Transit Administration 160
Useful Life of Transit Buses and Vans Appendix E Final Report Heavy-Duty Vehicle Life-Cycle Cost Analysis
Figure E-3 Life Cycle Cost Profiles Major Component Replacements and Overhauls
(Agenices Performing Continuous Rehabilitations) $120000
Continuous Rehab (40ft) 45000 miles per yr
Continuous Rehab (40ft) 35000 miles per yr
Continuous Rehab (40ft) 25000 miles per yr $100000
$80000
Optional (Rehab activities not
performed within 1 to 3 $60000 years of retirement)
$40000
$20000
$0
1 2 3 4 5 6 7 8 9 10 11 12 13 14 15 16 17 18 19 20
Vehicle Age (years)
Figure E-4 Life Cycle Cost Profiles Vehicle Acquisition Major Component
Replacements and Overhaul Costs (excludes OampM costs) (Assumes 35000 miles per year)
$140000
$120000 Major Mid-Life Overhaul (40ft)
Continuous Rehabilitation (40 ft) $100000
$80000
$60000
$40000
$20000
$0 1 2 3 4 5 6 7 8 9 10 11 12 13 14 15 16 17 18 19 20
Vehicle Age (years)
Figure E-5 reproduces the analysis in Figure E-4 for those agencies that do pursue comprehensive mid-life overhauls but this time for the three annual mileage groupings including 45000 35000 or 25000 miles Figure E-6 does the same for agencies that perform vehicle rehabilitation on a more continuous basis Both of these charts capture the increase in annualized cost as annual vehicle miles increase the higher annualized costs for those agencies pursuing
Tota
l Ann
ualiz
ed C
osts
M
ajor
Com
pone
nt R
epla
cem
ents
and
Ove
rhau
l Cos
ts
Federal Transit Administration 161
Useful Life of Transit Buses and Vans Appendix E Final Report Heavy-Duty Vehicle Life-Cycle Cost Analysis
extensive mid-life overhauls and the overall flattening of the annualized cost curves as the number of years of service approaches and surpasses 12 years
Figure E-5 Life Cycle Cost Profiles Vehicle Acquisition Major Component
Replacements and Overhaul Costs (excludes OampM costs) (Agencies that Perform Major Mid-Life Overhauls)
$140000
$120000
$100000
$80000
$60000
$40000
$20000
$0
Tota
l Ann
ualiz
ed C
osts
To
tal A
nnua
lized
Cos
ts
Major Mid-Life Rebuild (40ft) 45000 miles per yr
Major Mid-Life Rebuild (40ft) 35000 miles per yr
Major Mid-Life Rebuild (40ft) 25000 miles per yr
1 2 3 4 5 6 7 8 9 10 11 12 13 14 15 16 17 18 19 20
Vehicle Age (years)
Figure E-6
Life Cycle Cost Profiles Vehicle Acquisition Major Component Replacements and Overhaul Costs (excludes OampM costs)
(Agencies that Perform Continuous Rehabilitation) $140000
$120000
$100000
$80000
$60000
$40000
$20000
$0
Continuous Rehab (40ft) 45000 miles per yr
Continuous Rehab (40ft) 35000 miles per yr
Continuous Rehab (40ft) 25000 miles per yr
1 2 3 4 5 6 7 8 9 10 11 12 13 14 15 16 17 18 19 20
Vehicle Age (years)
Federal Transit Administration 162
Useful Life of Transit Buses and Vans Appendix E Final Report Heavy-Duty Vehicle Life-Cycle Cost Analysis
$0
$5000
$10000
$15000
$20000
$25000
$30000
$35000
$40000
$45000
$50000
Ann
ualiz
ed V
ehic
le O
ampM
Cos
ts
Low Speed (8 mph) 35000 miles per yr
Medium Speed (12 mph) 35000 miles per yr
High Speed (20 mph) 35000 miles per yr
Annualized Operating and Maintenance Costs
The analysis above considers all life-cycle costs excluding basic operating and maintenance (OampM) costs (ie the cost of fuel and corrective and preventive maintenance) As described above vehicle OampM costs tend to increase as the total number of vehicle miles increase OampM costs also tend to be higher for fleets operating in more congested urban areas and hence experiencing heavy-duty cycles Figure E-7 presents estimates of changes in annual vehicle operating and maintenance costs based on data obtained from a sample of bus operators throughout the State of Illinois
Figure E-7 Life Cycle Cost Profiles Annualized OampM Costs
(35000 miles per year 40 Ft bus)
1 2 3 4 5 6 7 8 9 10 11 12 13 14 15 16 17 18 19 20
Vehicle Age (years)
Total Annualized Life-Cycle Costs
Finally this section combines all of the prior annualized costsmdashincluding the costs of vehicle acquisition major component replacement major overhaul (if any) and operations and maintenance (OampM) costsmdashinto a single annualized cost measure The analysis then considers the annualized vehicle costs and minimum cost replacement points for the following combinations of operator characteristics
bull Performance of major mid-life overhaul yes or no
bull Differing annual average mileages 25000 35000 and 45000 miles per year
bull Number of overhauls (for agencies performing major mid-life overhauls) or drive train rebuilds (for agencies performing continuous rehabilitation) over the life of the vehicle including No overhaul (or drive train rebuild) one overhaul (or drive train rebuild) and multiple overhauls (or drive train rebuilds)
This represents a total of 18 different scenarios for analysis
Federal Transit Administration 163
Useful Life of Transit Buses and Vans Appendix E Final Report Heavy-Duty Vehicle Life-Cycle Cost Analysis
Agencies Performing Major Mid-Life Overhauls
Figure E-8 presents the total life-cycle cost profile (including annualized acquisition component replacement vehicle overhaul and OampM costs) for an agency that (1) performs a major mid-life overhaul and (2) operates its fleet vehicles an average of 35000 miles per year (roughly the national average) The three lines in the chart consider the differing options of (1) performing no mid-life overhaul (including no mid-life drive train rebuild) (2) performing one mid-life overhaul (the standard) and (3) performing two ldquomid-liferdquo overhauls (the second to extend vehicle life toward 20 years)
Figure E-8 Total Life Cycle Cost Profiles
Tota
l Ann
ualiz
ed L
ife C
ycle
Cos
ts
$200000
$180000
$160000
$140000
$120000
$100000
$80000
$60000
$40000
$20000
$0
Major Mid-Life Overhaul 35000 miles per yr
No Overhaul
One Overhaul Only
Multiple Overhauls
End of useful life
1 2 3 4 5 6 7 8 9 10 11 12 13 14 15 16 17 18 19 20
Vehicle Age (years)
Note that the cost curve for the ldquono overhaulrdquo scenario has been cut off at age 8 while the curve for the ldquoone overhaul onlyrdquo curve has been cut off at vehicle age 15 These cut-off points reflect the assumption that agencies not performing an engine and transmission rebuild at approximately age six or seven cannot expect the vehicle to remain in reliable working order more than a few years (eg age eight) Similarly if the agency completed a major rebuild at age 7 an additional major rebuild will be required to maintain service quality beyond age 14 or 15 The results in Figure E-8 suggest that total annualized life-cycle costs are (1) minimized at different vehicle ages for the three major overhaul options (none one or two) and (2) are lowest for the one-overhaul option and highest for the two-overhaul option Table E-1 presents the cost minimum amounts and ages for these three alternatives
Federal Transit Administration 164
Useful Life of Transit Buses and Vans Appendix E Final Report Heavy-Duty Vehicle Life-Cycle Cost Analysis
Table E-1 Life-Cycle Cost Minimums Major Mid-Life Overhauls ndash 35000 Annual Miles
Number of Overhauls Annualized Life-Cycle Cost Minimum ($2006)
Vehicle Age at Cost Minimum (years)
No Overhaul $99000 Between 7 to 8 One Overhaul $91000 Between 14 to 15 Multiple Overhauls $96000 13
This option does not make logical sense as the minimum cost point is reached before the second major rehabilitation
Both the chart and table indicate that the one-overhaul option is the optimal choice from a cost perspective and that this minimum cost point is reached at roughly age 14 to 15 or two to three years after the current FTA service-life minimum for this ldquo12-yearrdquo vehicle type In contrast the multiple-overhaul option is not cost effective relative to either the no- or one-overhaul options (as its cost minimum is both higher and earlier than the one-overhaul alternative and prior to the second overhaul) Overall the annualized cost differences between each option are clear but not significantly different (ie the most expansive no-overhaul option is roughly 10 percent more than the least expensive one-overhaul option)
Figure E-9 Total Life Cycle Cost Profiles
Major Mid-Life Overhaul 45000 miles per yr
1 2 3 4 5 6 7 8 9 10 11 12 13 14 15 16 17 18 19 20
Vehicle Age (years)
The analysis above suggests that life cycle costs for a 40-foot vehicle averaging roughly 35000 miles per year and receiving a major mid-life overhaul occurs roughly around age 14 or 15 or two to three years after the current FTA minimum of 12 years Note here that 35000 annual miles is roughly the national average for this vehicle type
For vehicles with lower or high average annual mileages Figure E-9 considers the life-cycle cost profiles for the 45000 annual mile scenario and Figure E-10 for the 25000 annual mile scenario
$0
$20000
$40000
$60000
$80000
$100000
$120000
$140000
$160000
$180000
$200000
Tota
l Ann
ualiz
ed L
ife C
ycle
Cos
ts
No Overhaul
One Overhaul Only
Multiple Overhauls
End of useful life
Federal Transit Administration 165
Useful Life of Transit Buses and Vans Appendix E Final Report Heavy-Duty Vehicle Life-Cycle Cost Analysis
Figure E-10 Total Life Cycle Cost Profiles
Major Mid-Life Overhaul 25000 miles per yr
1 2 3 4 5 6 7 8 9 10 11 12 13 14 15 16 17 18 19 20
Vehicle Age (years)
High Annual Mileage (45000 per year) Figure E-9 considers the case of an agency that does perform an extensive mid-life overhaul with fleet vehicles traveling an average of 45000 miles per year In this case the one-overhaul option is clearly the most cost effective (Table E-2) In this case the cost minimum is reached somewhere between 11 and 12 years of vehicle life and close to 500000 miles In contrast neither the multiple major overhaul nor the no-overhaul options appear while the no-overhaul option being (marginally) the most expensive
Table E-2 Life-Cycle Cost Minimums Major Mid-Life Overhauls ndash 45000 Annual Miles
$0
$20000
$40000
$60000
$80000
$100000
$120000
$140000
$160000
$180000
$200000
Tota
l Ann
ualiz
ed L
ife C
ycle
Cos
ts
No Overhaul
One Overhaul Only
Multiple Overhauls
End of useful life
Number of Overhauls Annualized Life-Cycle Cost Minimum ($2006)
Vehicle Age at Cost Minimum (years)
No Overhaul $115000 7 One Overhaul $108000 Between 11 and 12 Multiple Overhauls $114000 Between 10 and 11
Low Annual Mileage (25000 per year) Figure E-10 considers an agency that does perform an extensive mid-life overhaul but with fleet vehicles traveling an average of 25000 miles per year In this case the no-overhaul option is the most cost effective (Table E-3) but only marginally more so as compared to the one-overhaul option
Table E-3 Life-Cycle Cost Minimums Major Mid-Life Overhauls 25000 Annual Miles
Number of Overhauls Annualized Life-Cycle Cost Minimum ($2006) Vehicle Age at Cost Minimum
No Overhaul $74000 10 One Overhaul $78000 17 Multiple Overhauls $79000 19
Federal Transit Administration 166
Useful Life of Transit Buses and Vans Appendix E Final Report Heavy-Duty Vehicle Life-Cycle Cost Analysis
As will be shown later when considering those agencies that do not perform a major-mid-life overhaul (ie those that perform continuous rehabilitations) agencies with lower annual mileage per fleet vehicle may be better off performing less than the full overhaul and retiring their 12shyyear fleet vehicles some time after ages 14 or 15 (Note here that this and all other scenarios were evaluated based on the data obtained for this study In reality it is not certain that there are any agencies with low annual miles per vehicle that actually perform a full life-extending overhaul)
Summary Agencies Performing Major Mid-Life Overhauls
In summary for those agencies that do perform major life-extending rehabilitations the one-overhaul option appears to be the most cost effective for most operators (ie those with average or higher annual mileage) From a cost-effective perspective those with lower mileage (ie less than or equal to 25000 miles annually) are likely best off performing a scaled-down rehabilitation around age 9 and then operating the vehicle past age 14 (this scenario will be considered in greater depth in the following section under the ldquocontinuousrdquo rehabilitation agency discussion) The multiple-overhaul option was not found to be cost effective within the scenarios considered here (in all cases this option experiences its cost minimum before a second rehabilitation is undertaken) Finally while the one-overhaul option generally appears to be the most cost effective the total life-cycle cost difference between this and the no-overhaul option (on an annualized basis) was not found to be more than 10 percent
Implications for Useful Life Agencies Performing Major Mid-Life Overhauls
When evaluated solely in terms of cost-effectiveness vehicles with average mileages of between 35000 and 45000 miles per year reach their minimum annualized life-cycle cost after the FTArsquos current 12-year minimum retirement age (ie 14 years for vehicles with 35000 annual miles and 12 years for vehicles with 45000 annual miles) Assuming agencies with lower mileages choose to avoid the more-extensive mid-life rehabilitation in favor of the less-expensive continuous rehabilitation (as discussed below) these agencies reach their minimum annualized life-cycle cost between ages 14 and 16 (depending on the rehabilitation activities completed)
Agencies Practicing Continuous Rehabilitation
The preceding analysis considered those agencies that undertake major life-extending overhauls some time near the mid-point of a vehiclersquos expected useful life (examples include New York City Transit New Jersey Transit and WMATA) These agencies are characterized by above-average duty cycles high ridership and highly congested urban environmentsmdashfactors that require more significant rehabilitation activities to ensure reliable operability and quality of service over the vehiclersquos life In contrast most US transit operators (in particular the smaller and mid-size operators) do not perform a single major mid-life overhaul Rather these agencies complete rehabilitation activities on an as-needed or continuous basis Moreover these agencies will ultimately perform many if not most of the same rehabilitation activities as those agencies that do complete a major overhaul but not in a single coordinated event In other words these operators tend to spread their rehabilitation activities throughout the vehiclersquos life cycle
Federal Transit Administration 167
Useful Life of Transit Buses and Vans Appendix E Final Report Heavy-Duty Vehicle Life-Cycle Cost Analysis
Rehabilitation Assumptions Once again agencies performing continuous vehicle rehabilitation complete many of the same rehabilitation activities as those conducting a full mid-life overhaul The following are key examples of rehabilitation activities not typically performed by continuous rehabilitation operators chassis or structural element refurbishment or reconstruction (not related to a significant accident) major body work complete refurbishment of vehicle interior replacement of fare collection equipment interior climate control replacement and electrical system upgrades16
Similar to the analysis above this analysis of the continuous rehabilitation operators does assume that operators make a determination of how many major rehabilitation cycles their vehicles undergo throughout the vehiclersquos life cycle Specifically the analysis considers the options of (1) one drive train rebuild (2) multiple drive train rebuilds or (3) no drive train rebuild Despite its name the ldquono drive train rebuildrdquo scenario considered here does assume one transmission rebuild three or four years into the vehicle life cycle However this is the only drive train rehabilitation activity assumed under the ldquono drive train rebuildrdquo scenario
Average Annual Mileage (35000 per year) Figure E-11 presents the total life-cycle cost profile (including annualized acquisition component replacement vehicle overhaul and OampM costs) for an agency that (1) performs continuous vehicle rehabilitation and (2) operates its fleet vehicles an average of 35000 miles per year (roughly the national average)
Figure E-11 Total Life Cycle Cost Profiles
Continuous Rehabs 35000 miles per yr
1 2 3 4 5 6 7 8 9 10 11 12 13 14 15 16 17 18 19 20
Vehicle Age (years)
16 In practice the complete list of rehabilitation activities performed over a vehiclersquos life cycle can vary significantly across agencies Hence some ldquocontinuous rehab agenciesrdquo may perform one or more of the rehabilitation activities excluded from this analysis of this agency ldquotyperdquo Moreover continuous rehab agencies will sometimes need to perform some of these activities on a periodic basis due to extenuating circumstances (eg problem vehiclescomponents or accident repairs) The intention here is to group operators into two basic types those that do and those that do not perform major mid-life overhauls In reality there is a range of rehabilitation practices each particular to the specific needs objectives and management practices of the nationrsquos many bus operators
$0
$20000
$40000
$60000
$80000
$100000
$120000
$140000
$160000
$180000
$200000
Tota
l Ann
ualiz
ed L
ife C
ycle
Cos
ts
No Drive Train Rebuild
One Drive Train Rebuild Only
Multiple Drive Train Rebuilds
End of useful life
Federal Transit Administration 168
Useful Life of Transit Buses and Vans Appendix E Final Report Heavy-Duty Vehicle Life-Cycle Cost Analysis
Table E-4 shows that in this case the one-drive-train rebuild option is clearly the most cost effective Similar to the above the multiple-drive-train rebuild scenario experiences its cost minimum prior to the second rebuild event thus negating any logic to multiple rebuilds In contrast the no-drive-train rebuild scenario does not provide sufficient time to distribute vehicle acquisition costs over sufficient years to compete with the one-rebuild option This option is roughly 15 percent more costly as compared to the one-drive-train rebuild option
Table E-4 Life-Cycle Cost Minimums Continuous Rehabilitation ndash 35000 Annual Miles
Number of Overhauls Annualized Life-Cycle Cost Minimum ($2006) Vehicle Age at Cost Minimum
No Drive Train Rebuild $97000 7 One Drive Train Rebuild $85000 14 Multiple Drive Train Rebuilds $94000 11
High Annual Mileage (45000 per year) Figure E-12 considers the case of an agency performing continuous rehabilitations with fleet vehicles traveling an average of 45000 miles per year Here again the one-drive-train rebuild option is easily the most cost effective occurring at roughly age 14 This option is roughly 15 percent more cost effective as compared to the no-drive-train rebuild option
Table E-5 summarizes the life-cycle cost analysis and the results of the minimum-cost values for each of the high-mileage scenarios presented in Figure E-12 For this higher-mileage scenario the one-rebuild option is necessary to reach the 12-year life and provides the lowest minimum life-cycle cost
Figure E-12 Total Life Cycle Cost Profiles
Continuous Rehabs 45000 miles per yr $200000
$180000
$160000
$140000
$120000
$100000
$80000
$60000
$40000
$20000
$0
Tota
l Ann
ualiz
ed L
ife C
ycle
Cos
ts
No Drive Train Rebuild
One Drive Train Rebuild Only
Multiple Drive Train Rebuilds
End of useful life
1 2 3 4 5 6 7 8 9 10 11 12 13 14 15 16 17 18 19 20
Vehicle Age (years)
Federal Transit Administration 169
Useful Life of Transit Buses and Vans Appendix E Final Report Heavy-Duty Vehicle Life-Cycle Cost Analysis
Table E-5 Life-Cycle Cost Minimums Continuous Rehabilitation ndash 45000 Annual Miles
Number of Overhauls Annualized Life-Cycle Cost Minimum ($2006)
Vehicle Age at Cost Minimum
No Drive Train Rebuild $114000 6 One Drive Train Rebuild $98000 12 Multiple Drive Train Rebuilds $113000 9
Low Annual Mileage (25000 per year) Figure E-13 considers the case of an agency performing continuous rehabilitation with fleet vehicles traveling an average of 25000 miles per year In this case the one-drive train rebuild option is marginally more cost effective as compared to the no-rebuild option Once again the multiple-rebuild option makes little sense with the cost minimum attained just prior to the second engine rebuild event
Table E-6 summarizes the life-cycle cost analysis and the results of the minimum-cost values for each of the high-mileage scenarios presented in Figure E-13 For this higher-mileage scenario the one-rebuild option is necessary to reach the 12-year life and also provides the lowest minimum life-cycle cost
Figure E-13 Total Life Cycle Cost Profiles
Continuous Rehabs 25000 miles per yr $200000
$180000
$160000
$140000
$120000
$100000
$80000
$60000
$40000
$20000
$0
Table E-6 Life-Cycle Cost Minimums Continuous Rehabilitation ndash 25000 Annual Miles
Tota
l Ann
ualiz
ed L
ife C
ycle
Cos
ts
No Drive Train Rebuild
One Drive Train Rebuild Only
Multiple Drive Train Rebuilds
End of useful life
1 2 3 4 5 6 7 8 9 10 11 12 13 14 15 16 17 18 19 20
Vehicle Age (years)
Number of Overhauls Annualized Life-Cycle Cost Minimum ($2006)
Vehicle Age at Cost Minimum
No Drive Train Rebuild $76000 9 One Drive Train Rebuild $72000 17 Multiple Drive Train Rebuilds $78000 17
Federal Transit Administration 170
Useful Life of Transit Buses and Vans Appendix E Final Report Heavy-Duty Vehicle Life-Cycle Cost Analysis
Summary Agencies Performing Continuous Vehicle Rehabilitation
In summary for those agencies that do perform vehicle rehabilitations on a continuous as-needed basis the one-overhaul option appears to be the most cost effective for operators high average and low annual mileages (with the advantage being only marginal for lower mileage operators) The multiple-overhaul option was not found to be cost effective within the scenarios considered here (in all cases this option experiences its cost minimum before a second rebuild is undertaken) Finally the one-drive-train rebuild option was found to have roughly a 15-percent cost advantage over the other options for operators with 35000 or more in annual mileage This advantage was only a little more than 5 percent for agencies with 25000 in annual mileage
Implications for Useful Life Agencies Performing Continuous Rehabilitation
When evaluated solely in terms of cost-effectiveness vehicles with average annual mileages of 25000 35000 and 45000 miles per year reach their minimum annualized life-cycle cost on or after FTArsquos current 12-year minimum retirement age (ie 17 years for vehicles with 25000 annual miles 14 years for vehicles with 35000 annual miles and 12 years for vehicles with 45000 annual miles)
Summary Minimum Life-Cycle Cost Values and Ages
Tables E-7 and E-8 respectively identify the minimum annualized life cycle cost values and the ages at which these cost minimums are attained (by annual vehicle mileage) Each table highlights the cost minimum values and ages for each annual mileage group
Table E-7 Minimum Life-Cycle Cost Values ($2006)
Annual Vehicle Mileage
Agency Performs Major Mid-Life Overhauls
Agency Performs Continuous Vehicle Rehabilitation
No Overhaul
One Overhaul
Multiple Overhauls
No Drive Train Replacement
One Drive Train
Replacement
Multiple DriveTrain
Replacements 25000 $74000 $78000 $79000 $76000 $72000 $78000 35000 $99000 $91000 $96000 $97000 $85000 $94000 45000 $115000 $108000 $114000 $114000 $98000 $113000
Note Differences in costs between agencies that do and do not perform major mid-life overhauls reflect both (1) differences in rehabilitation activities performed and (2) differences in the cost data provided by those agencies participating in this study
With one exception minimum life-cycle cost is attained at or after the current FTA 12-year minimum The exception is those agencies with 25000 average annual miles that ordinarily perform a major life-extending rehabilitation (As noted above it is unlikely that agencies would pursue this option as with only 25000 miles per year it is likely more cost-effective to perform a less extensive rehabilitation around year 10 and then operate the vehicle until age 14 or later)
Federal Transit Administration 171
Useful Life of Transit Buses and Vans Appendix E Final Report Heavy-Duty Vehicle Life-Cycle Cost Analysis
Table E-8 Minimum Life-Cycle Cost Ages
Annual Vehicle Mileage
Agency Performs Major Mid-Life Overhauls
Agency Performs Continuous Vehicle Rehabilitation
No Overhaul
One Overhaul
Multiple Overhauls
No Drive Train Replacement
One Drive Train
Replacement
Multiple DriveTrain
Replacements 25000 10 17 19 9 17 17 35000 9 14 13 7 14 11 45000 7 12 11 6 12 9
Higher-Mileage Vehicles
The vehicles with 45000 miles experience their cost minimum at 12 years When converted to miles this equates to 540000 miles (12 X 45000) by the age of retirement Here again the life-cycle cost analysis results are in line with the current FTA minimum life requirements of 12 years or 500000 miles Hence although the age at which the minimum life-cycle cost value is attained continues to decline as average annual mileage increases these operators can take advantage of FTArsquos current minimum 12-year or 500000-mile-of-service option to ensure retirement at the minimum life-cycle cost point Hence based on this cost-effectiveness assessment the current minimum-life mileage requirement of 500000 appears reasonable
Generalized Analysis
The analysis above considered the minimum life-cycle cost for three specific annual vehicle mileages 25000 35000 (the national average) and 45000 Figure E-14 provides the ages and LTD mileages at which life-cycle costs are minimized for vehicles traveling between 20000 miles and 70000 miles annually Here the solid bars and left-side axis present the ages at which life-cycle costs are minimized for this range of annual vehicle mileages The solid line and right-hand axis present the LTD mileages at which life-cycle costs are minimized
Review of E-14 suggests that from a cost-effective perspective FTArsquos current retirement minimums (for large buses) of 12 years or 500000 miles represent reasonable choices For all annual vehicle mileages the minimum cost point is attained at either an age or mileage that exceeds one or both of the FTA minimums for these measures In all cases the difference between one and both of the current FTA minimum requirements also provides some margin for the early retirement of vehicles with reliability problems For example vehicles traveling an average of 40000 miles per year could reach their cost minimums at age 13 and an LTD mileage of 520000 miles Hence this provides a ldquomarginrdquo of one year or 20000 miles of optimal service beyond the FTA minimum for an average vehicle or the option to reduce service life by these amounts for less reliable vehicles Moreover this difference between the 12-year and 500000shymile minimum is smallest (while still providing a meaningful early retirement margin) for vehicles that average between 30000 and 45000 miles of travel per year Together these vehicles account for more than 70 percent of the nationrsquos large buses
Federal Transit Administration 172
Useful Life of Transit Buses and Vans Appendix E Final Report Heavy-Duty Vehicle Life-Cycle Cost Analysis
Figure E-14 Age and Mileage at Which Life-Cycle Cost Is Minimized
(Single Mid-Life Rehabilitation or Single Drive Train Replacement)
0
2
4
6
8
10
12
14
16
18
20 Ve
hicl
e A
ge L
ife-C
ycle
Cos
t Is
Min
imiz
ed (Y
ears
)
0
100000
200000
300000
400000
500000
600000
700000 Vehicle LTD
Miles Life-C
ycle C
ost Is Minim
izedAge Minimum Life Cost is Attained Life to Date Miles Minimum Life Cost is Attained
FTA Mileage Minimum
FTA Age Minimum
Average Annual Mileage
20000 25000 30000 35000 40000 45000 50000 55000 60000 65000 70000
Average Annual Mileage
Federal Transit Administration 173
Useful Life of Transit Buses and Vans Appendix F Final Report Agency Supplied Life-Cycle Cost Data
APPENDIX F AGENCY SUPPLIED LIFE-CYCLE COST DATA
The following are the contents of the life-cycle cost database created for this study using data supplied by the local transit operators and vehicle manufacturers responding to the study interview guide This information includes the expected cost and timing (in years) for replacement of all major vehicle components The cost data have been ldquopooledrdquo and averaged here to provide a more complete and representative set of vehicle life-cycle costs Given this pooling the tables below present cost data for three different ldquooperatorrdquo types bull Large operators that perform a major mid-life rehabilitations bull Operators that do not perform mid-life overhauls bull Vehicle manufacturers supplying life-cycle cost data
In the end the life-cycle cost data supplied by the vehicle manufacturers was not used for this study as it was found to differ significantly from the actual cost experiences of the nationrsquos transit operators Also the cost data supplied by agencies (including those that do and do not perform major rehab activities) is representative of agencies with average annual mileages of roughly 37500 annual miles (for those do perform major mid-life rehabilitations) and roughly 36000 miles (those than do not major mid-life rehabilitations) These cost data were then adjusted accordingly for the analyses presented in Chapter 6
Table F-1 Large Operator With Major Rehab
CompID Group Component Replacement
Cost Expected Life
(years) 1 Body Structure 14 2 Body Exterior and Applied Panels 3 Body Paint $250000 7 4 Body Interior 5 Body Floor $220000 7 6 Body Steps and Stepwells $12000 7 7 Body Wheel Housings $172000 7 8 Body Exit Passenger Doors $300000 7 9 Body Service Compartment
10 Body Engine door Access Doors 11 Operating Components Doors $3800 7 12 Operating Components Windshield Wipers and Washers $19000 3 13 Operating Components Headlight Assy Lighting 14 Operating Components Dimmer switch Controls 15 Operating Components Speedometer Instruments 16 Interior Trim Panels 17 Interior Headlining
Federal Transit Administration 174
Useful Life of Transit Buses and Vans Appendix F Final Report Agency Supplied Life-Cycle Cost Data
CompID Group Component Replacement
Cost Expected Life
(years) 18 Interior Front End 19 Interior Rear End 20 Interior Passenger Info and Advertising 21 Interior One Seat Insert Passenger Seats $340000 7 22 Interior Driverrsquos Seat $135600 3 23 Interior Rubber Floor Covering 24 Windows Windshield $250000 14 25 Windows Driverrsquos Side Window $50000 14 26 Windows Side Windows $300000 14 27 Insulation Insulation 28 Ancillary Items Dash Panels 29 Ancillary Items Visors 30 Ancillary Items Chime Exit Signal 31 Ancillary Items Outside Mirrors $76000 3 32 Ancillary Items Inside Mirrors 33 Passenger Assists Front Doorway 34 Passenger Assists Vestibule 35 Passenger Assists Overhead 36 Passenger Assists One Set Insert Longitudinal Seats 37 Passenger Assists Rear Doorway 38 Bumpers Front Bumper $189300 7 39 Bumpers Rear Bumper $92300 7 40 Destination Signs Run Box Run Numbers $654500 7 41 Destination Signs Rear Route Route Numbers 42 Destination Signs Front Main Auxiliary Destination Sign 43 Destination Signs Fare Collection Device 44 Destination Signs Wheelchair Lift $1200000 7 45 Destination Signs Wheelchair Restraints 46 ITS Components AVL 47 ITS Components APC 48 ITS Components Others 49 Propulsion System Engine Mounts $50000 7 50 Propulsion System Accessories $200000 7 51 Propulsion System Pump Hydraulic Drive $120000 7 52 Propulsion System Engine $1294000 7 53 Propulsion System Radiator Cooling System $370000 3 54 Propulsion System Transmission $1164300 4 55 Propulsion System Muffler Cat Conv Exhaust System $430000 7 56 Propulsion System EGR Emissions Control Devices $190000 7 57 Propulsion System Reman Diff Axles and Differential $900000 7 58 Propulsion System Sway Bar Suspension 59 Propulsion System Air Springs 60 Propulsion System Shock Absorbers
Federal Transit Administration 175
Useful Life of Transit Buses and Vans Appendix F Final Report Agency Supplied Life-Cycle Cost Data
CompID Group Component Replacement
Cost Expected Life
(years) 61 Propulsion System Steering Gear 62 Propulsion System Steering 63 Brakes Brake Chamber Actuators 64 Brakes Rear Axel Set Friction Material 65 Brakes Hubs $280000 7 66 Brakes One Drums or Rotors 67 Brakes Compressor Air System $350000 3 68 Brakes Wheels 69 Brakes Tires $160000 3 70 Fuel System Fuel Tank 71 Fuel System Fuel Filler 72 Electrical Components Batteries 73 Electrical Components Master Battery Switch 74 Electrical Components Fire Detectors 75 Electrical Components Radio Noise Suppression 76 Interior Climate Control Master control ac heat Controls 77 Interior Climate Control Plenums and Vents 78 Interior Climate Control Filter Air Intakes 79 Interior Climate Control Radio amp Public Address System $800000 7 99 BodyStructure Other Overhaul Costs $700000 7 99 BodyBody Other Overhaul Costs $300000 7 99 Interior Other Overhaul Costs $824400 7 99 Fare Collection Other Overhaul Costs $500000 14 99 Suspension Other Overhaul Costs $460000 7 99 Brakes Other Overhaul Costs $500000 7 99 Fuel System Other Overhaul Costs $150000 7 99 Electrical Components Other Overhaul Costs $381000 3 99 Interior Climate Control Other Overhaul Costs $1000000 7
Table F-2 Mid to Large Operator No Major Rehab
CompID Group Component Replacement
Cost Expected
Life (years) 1 Body Structure 12 2 Body Exterior and Applied Panels $18026 12 3 Body Paint $300000 6 4 Body Interior 12 5 Body Floor 12 6 Body Steps and Stepwells 12 7 Body Wheel Housings 12 8 Body Exit Passenger Doors $174244 6 9 Body Service Compartment 12
10 Body Engine door Access Doors $235071 6
Federal Transit Administration 176
Useful Life of Transit Buses and Vans Appendix F Final Report Agency Supplied Life-Cycle Cost Data
CompID Group Component Replacement
Cost Expected
Life (years) 11 Operating Components Doors $33223 4 12 Operating Components Windshield Wipers and Washers $24706 1 13 Operating Components Headlight Assy Lighting $10828 1 14 Operating Components Dimmer switch Controls $8962 3 15 Operating Components Speedometer Instruments $10168 3 16 Interior Trim Panels 12 17 Interior Headlining 12 18 Interior Front End 12 19 Interior Rear End 12 20 Interior Passenger Info and Advertising 12 21 Interior One Seat Insert Passenger Seats $183680 6 22 Interior Driverrsquos Seat $223733 4 23 Interior Rubber Floor Covering 12 24 Windows Windshield $250000 12 25 Windows Driverrsquos Side Window $133421 12 26 Windows Side Windows $228184 12 27 Insulation Insulation 28 Ancillary Items Dash Panels $10288 12 29 Ancillary Items Visors $23234 6 30 Ancillary Items Chime Exit Signal $18756 6 31 Ancillary Items Outside Mirrors $40228 1 32 Ancillary Items Inside Mirrors $3655 6 33 Passenger Assists Front Doorway 12 34 Passenger Assists Vestibule 12 35 Passenger Assists Overhead 12 36 Passenger Assists One Set Insert Longitudinal Seats $4592 6 37 Passenger Assists Rear Doorway 12 38 Bumpers Front Bumper $109112 12 39 Bumpers Rear Bumper $139336 12 40 Destination Signs Run Box Run Numbers 1 41 Destination Signs Rear Route Route Numbers $422300 3 42 Destination Signs Front Main Auxiliary Destination Sign $607100 6 43 Destination Signs Fare Collection Device 44 Destination Signs Wheelchair Lift $2100000 12 45 Destination Signs Wheelchair Restraints $9544 6 46 ITS Components AVL 47 ITS Components APC 48 ITS Components Others 49 Propulsion System Engine Mounts $8896 3 50 Propulsion System Accessories 51 Propulsion System Pump Hydraulic Drive $105676 3 52 Propulsion System Engine $1932000 6 53 Propulsion System Radiator Cooling System $386500 6
Federal Transit Administration 177
Useful Life of Transit Buses and Vans Appendix F Final Report Agency Supplied Life-Cycle Cost Data
CompID Group Component Replacement
Cost Expected
Life (years) 54 Propulsion System Transmission $1823200 4 55 Propulsion System Muffler Cat Conv Exhaust System $274239 6 56 Propulsion System EGR Emissions Control Devices $39619 3 57 Propulsion System Reman Diff Axles and Differential $201475 6 58 Propulsion System Sway Bar Suspension $38222 4 59 Propulsion System Air Springs $11842 4 60 Propulsion System Shock Absorbers $11923 4 61 Propulsion System Steering Gear 62 Propulsion System Steering $99586 6 63 Brakes Brake Chamber Actuators $10972 3 64 Brakes Rear Axel Set Friction Material $14000 1 65 Brakes Hubs $89087 6 66 Brakes One Drums or Rotors $11000 1 67 Brakes Compressor Air System $100866 3 68 Brakes Wheels $16968 6 69 Brakes Tires $40000 05 70 Fuel System Fuel Tank $202708 6 71 Fuel System Fuel Filler $28828 12 72 Electrical Components Batteries $8935 2 73 Electrical Components Master Battery Switch $1624 6 74 Electrical Components Fire Detectors $45369 4 75 Electrical Components Radio Noise Suppression 76 Interior Climate Control Master control ac heat Controls $100000 6 77 Interior Climate Control Plenums and Vents 12 78 Interior Climate Control Filter Air Intakes $1066 1 79 Interior Climate Control Radio amp Public Address System $16423 4 99 BodyStructure Other Overhaul Costs 12 99 BodyBody Other Overhaul Costs $18026 12 99 Interior Other Overhaul Costs $300000 6 99 Fare Collection Other Overhaul Costs 12 99 Suspension Other Overhaul Costs 12 99 Brakes Other Overhaul Costs 12 99 Fuel System Other Overhaul Costs 12 99 Electrical Components Other Overhaul Costs $174244 6 99 Interior Climate Control Other Overhaul Costs 12
Table F-3 Vehicle Manufacturer Costs
Comp ID Group Component Replacement
Cost Expected
Life (years) 1 Body Structure 12 2 Body Exterior and Applied Panels $31000 12 3 Body Paint 12
Federal Transit Administration 178
5
10
15
20
25
30
35
40
45
Useful Life of Transit Buses and Vans Appendix F Final Report Agency Supplied Life-Cycle Cost Data
CompID Group Component Replacement
Cost Expected
Life (years) 4 Body Interior 12
Body Floor 12 6 Body Steps and Stepwells 12 7 Body Wheel Housings 12 8 Body Exit Passenger Doors 12 9 Body Service Compartment
Body Engine door Access Doors $240000 12 11 Operating Components Doors 12 12 Operating Components Windshield Wipers and Washers $55000 12 13 Operating Components Headlight Assy Lighting $15000 12 14 Operating Components Dimmer switch Controls
Operating Components Speedometer Instruments $27000 12 16 Interior Trim Panels 12 17 Interior Headlining 12 18 Interior Front End 12 19 Interior Rear End 12
Interior Passenger Info and Advertising $5000 12 21 Interior One Seat Insert Passenger Seats 12 22 Interior Driverrsquos Seat 12 23 Interior Rubber Floor Covering 12 24 Windows Windshield $72000 12
Windows Driverrsquos Side Window $51000 12 26 Windows Side Windows $63000 12 27 Insulation Insulation 28 Ancillary Items Dash Panels 12 29 Ancillary Items Visors $16000 6
Ancillary Items Chime Exit Signal 12 31 Ancillary Items Outside Mirrors $7000 12 32 Ancillary Items Inside Mirrors $3000 12 33 Passenger Assists Front Doorway 12 34 Passenger Assists Vestibule 12
Passenger Assists Overhead 12 36 Passenger Assists One Set Insert Longitudinal Seats 12 37 Passenger Assists Rear Doorway 12 38 Bumpers Front Bumper 12 39 Bumpers Rear Bumper 12
Destination Signs Run Box Run Numbers 12 41 Destination Signs Rear Route Route Numbers 12 42 Destination Signs Front Main Auxiliary Destination Sign 12 43 Destination Signs Fare Collection Device 12 44 Destination Signs Wheelchair Lift 12
Destination Signs Wheelchair Restraints 12 46 ITS Components AVL
Federal Transit Administration 179
Useful Life of Transit Buses and Vans Appendix F Final Report Agency Supplied Life-Cycle Cost Data
CompID Group Component Replacement
Cost Expected
Life (years) 47 ITS Components APC 48 ITS Components Others 49 Propulsion System Engine Mounts $6000 6 50 Propulsion System Accessories $280000 6 51 Propulsion System Pump Hydraulic Drive $67000 6 52 Propulsion System Engine $1700000 6 53 Propulsion System Radiator Cooling System 12 54 Propulsion System Transmission $1170000 6 55 Propulsion System Muffler Cat Conv Exhaust System $75000 12 56 Propulsion System EGR Emissions Control Devices $68500 12 57 Propulsion System Reman Diff Axles and Differential $300000 12 58 Propulsion System Sway Bar Suspension 12 59 Propulsion System Air Springs $27000 3 60 Propulsion System Shock Absorbers $26000 3 61 Propulsion System Steering Gear 62 Propulsion System Steering 12 63 Brakes Brake Chamber Actuators $14000 6 64 Brakes Rear Axel Set Friction Material $20000 3 65 Brakes Hubs $26000 12 66 Brakes One Drums or Rotors $25000 3 67 Brakes Compressor Air System 12 68 Brakes Wheels $23000 12 69 Brakes Tires $40000 05 70 Fuel System Fuel Tank 12 71 Fuel System Fuel Filler 12 72 Electrical Components Batteries $10000 3 73 Electrical Components Master Battery Switch $4000 12 74 Electrical Components Fire Detectors $21000 12 75 Electrical Components Radio Noise Suppression 12 76 Interior Climate Control Master control ac heat Controls $78000 12 77 Interior Climate Control Plenums and Vents 12 78 Interior Climate Control Filter Air Intakes $4000 05 79 Interior Climate Control Radio amp Public Address System 12 99 BodyStructure Other Overhaul Costs 12 99 BodyBody Other Overhaul Costs $31000 12 99 Interior Other Overhaul Costs 12 99 Fare Collection Other Overhaul Costs 12 99 Suspension Other Overhaul Costs 12 99 Brakes Other Overhaul Costs 12 99 Fuel System Other Overhaul Costs 12 99 Electrical Components Other Overhaul Costs 12 99 Interior Climate Control Other Overhaul Costs
Federal Transit Administration 180
Useful Life of Transit Buses and Vans Final Report Useful Life of Transit Buses and Vans Final Report
METRICENGLISH CONVERSION FACTORS
FedeFederal Tranral Transit Administrasit Administrationtion 181181

Useful Life of Transit Buses and Vans Final Report
REPORT DOCUMENTATION PAGE Form Approved OMB No 0704-0188
Public reporting burden for this collection of information is estimated to average 1 hour per response including the time for reviewing instructions searching existing data sources gathering and maintaining the data needed and completing and reviewing the collection of information Send comments regarding this burden estimate or any other aspect of this collection of information including suggestions for reducing this burden to Washington Headquarters Services Directorate for Information Operations and Reports 1215 Jefferson Davis Highway Suite 1204 Arlington VA 22202-4302 and to the Office of Management and Budget Paperwork Reduction Project (0704-0188) Washington DC 20503 1 AGENCY USE ONLY (Leave blank) 2 REPORT DATE
April 2007 3 REPORT TYPE AND DATES COVERED
Final Report 4 TITLE AND SUBTITLE Useful Life of Transit Buses and Vans
5 FUNDING NUMBERS
6 AUTHOR(S) Richard Laver Donald Schneck Douglas Skorupski Stephen Brady Laura Cham
Booz Allen Hamilton
7 PERFORMING ORGANIZATION NAME(S) AND ADDRESS(ES) Booz Allen Hamilton Inc 8283 Greensboro Drive McLean Virginia 22102
8 PERFORMING ORGANIZATION REPORT NUMBER
FTA
9 SPONSORINGMONITORING AGENCY NAME(S) AND ADDRESS(ES) Federal Transit Administration US Department of Transportation Washington DC 20590
10 SPONSORING MONITORING AGENCY REPORT NUMBER
FTA-VA-26-7229-071
11 SUPPLEMENTARY NOTE Online at [httpwwwftadotgov]
12a DISTRIBUTIONAVAILABILITY STATEMENT Available From National Technical Information ServiceNTIS Springfield Virginia 22161 Phone (703) 605-6000 Fax (703) 605-6900 Email [ordersntisfedworldgov]
12b DISTRIBUTION CODE
13 ABSTRACT (Maximum 200 words) The Federal Transit Administration (FTA) sponsored this research to assess both the appropriateness of its existing minimum service-life policy for transit buses and vans and the need to change that policy The research evaluated the federal minimum service-life requirements based upon the actual experience of both transit operators and vehicle manufacturers The analyses in this research provide the transit industry and the FTA with a better understanding of (1) the current useful life of transit buses and vans (2) the appropriateness of FTArsquos minimum service-life policy and (3) the policyrsquos impact on transit vehicle life expectancies and vehicle retirement decisions at the agency level Actual ages of buses retired from service generally exceed FTA minimums Transit agencies interviewed cited availability of capital funds for bus replacement as the primary determinant of retirement age 14 SUBJECT TERMS Transit Bus Van Useful Life Engineering Analysis Economic Analysis FTA Bus and Van Minimum Service-Life Policy Transit Fleet Retirement Age
15 NUMBER OF PAGES 195
16 PRICE CODE
17 SECURITY CLASSIFICATION OF REPORT Unclassified
18 SECURITY CLASSIFICATION OF THIS PAGE Unclassified
19 SECURITY CLASSIFICATION OF ABSTRACT Unclassified
20 LIMITATION OF ABSTRACT
NSN 7540-01-280-5500 Standard Form 298 (Rev 2-89) Prescribed by ANSI Std 239-18298-102
Federal Transit Administration
Useful Life of Transit Buses and Vans Final Report
NOTICE
This document is disseminated under the sponsorship of the United States Department of Transportation in the interest of information exchange The United States Government assumes no liability for its contents or use thereof
The United States Government does not endorse products or manufacturers Trade or manufacturersrsquo names appear herein solely because they are considered essential to the objective of this report
Federal Transit Administration
Useful Life of Transit Buses and Vans Final Report
FOREWORD
The Federal Transit Administration (FTA) sponsored this research to assess both the appropriateness of its existing minimum service-life policy for transit buses and vans and the need to change that policy The research evaluated the federal minimum service-life requirements based upon the actual experience of both transit operators and vehicle manufacturers The analyses in this research provide the transit industry and the FTA with a better understanding of (1) the current useful life of transit buses and vans (2) the appropriateness of FTArsquos minimum service-life policy and (3) the policyrsquos impact on transit vehicle life expectancies and vehicle retirement decisions at the agency level Actual ages of buses retired from service generally exceed FTA minimums Transit agencies interviewed cited availability of capital funds for bus replacement as the primary determinant of retirement age
Author Acknowledgements
This report was authored by Richard Laver Donald Schneck Douglas Skorupski Stephen Brady Laura Cham and Jeff Rankin of Booz Allen Hamilton Valuable insight and direction was provided by Henry Nejako John Bell and Nancy Ody of the FTA In addition the authors would like to thank the staff of those transit operators and vehicle manufacturers who graciously provided their time and input to this study and without whom the study would not have been possible
Federal Transit Administration
Useful Life of Transit Buses and Vans Final Report Table of Contents
Table of Contents
EXECUTIVE SUMMARY IV
Study Goals and Objectives iv Approach v Key Findings vi Recommendations xiii
CHAPTER 1 INTRODUCTION 1
Background 1 Study Objectives 2 Reasons for Reviewing the Service-Life Policy 3 What is Useful Life 4 Project Approach 8
CHAPTER 2 FTA SERVICE-LIFE CATEGORIES 10
Service-Life Category Descriptions 10 Implications for the Current Service-Life Categories 19
CHAPTER 3 LEGISLATION AND PROCUREMENT 23
FTA Service-Life Circulars and Regulations 23 Procurement Methods and Guidelines 25 Conclusions Impact of Regulations and Procurement Practices 26
CHAPTER 4 AVERAGE RETIREMENT AGES 27
Analysis of Actual Fleet Retirement Ages Using NTD Vehicle Data 27 Assessment of Existing Bus Type Categories Based on NTD Analysis 35
CHAPTER 5 INDUSTRY OUTREACH 37
Transit Agency Participants 37 Agency Interview Guide Responses 38 Vehicle Manufacturer Response 51 Private Operators Response 56
CHAPTER 6 ENGINEERING ANALYSIS 60
Transit Agency Participants ndash Follow-Up Interviews 60 Useful Life of Transit Vehicle Chassis and Components 61 Vehicle Structure ndash A Second Look 70
Federal Transit Administration i
Useful Life of Transit Buses and Vans Final Report Table of Contents
Bus Durability and New Technologies 74 Life-Extending Practices 76 Vehicle Emissions 76 Vehicle Reliability 77 National Bus Condition Assessment 78
CHAPTER 7 LIFE-CYCLE COST ANALYSIS 86
Data Sources and Caveats 86 Key Determinants of Life-Cycle Costs 86 Life-Cycle Cost Analysis 89 Other Bus and Van Types 94 Life-Cycle Cost Analyses of Changes to FTArsquos Service-life Policy 100 Vehicle Physical Condition versus Minimum Cost Retirement Age 104 Vehicle Age Service Reliability and Ridership 106
CHAPTER 8 PRIOR BUS USEFUL-LIFE REVIEWS 110
Initial Policy Statement ndash FTA Circular 90301 110 1985 Inspector General Statement 110 1988 Useful Life of Transit Vehicles Study 110 1988 Transit Capital Investment to Reduce Operating Deficits ndash Alternative Bus Replacement Strategies Study 111 1995 Bus Industry Summit 111 1997 Useful Life of Heavy-Duty Transit Buses Study 112 Other Studies 113 Comparisons of Past Studies with This Report 114 Other Considerations 115
CHAPTER 9 KEY FINDINGS AND RECOMMENDATIONS 118
Key Findings 118 Recommendations 121
BIBLIOGRAPHY 124
APPENDIX A SUMMARY OF TRANSIT AGENCY SURVEY 128
APPENDIX B SUMMARY OF VEHICLE MANUFACTURER SURVEY 143
APPENDIX C ENGINEERING INTERVIEWS 147
APPENDIX D MINIMUM LIFE-CYCLE COST METHODOLOGY 153
Conversion of Participant Life-Cycle Costs to Reflect Differences in Annual Mileage 153 Calculation of Annualized Cost Factors 154
Federal Transit Administration ii
Useful Life of Transit Buses and Vans Final Report Table of Contents
Calculation of Annualized Vehicle Acquisition Major Component Replacement and Rehabilitation Costs 154 Regression Analysis and Annualization of OampM Costs 155 Calculation of Total Annualized Costs 156
APPENDIX E HEAVY-DUTY VEHICLE LIFE-CYCLE COST ANALYSIS 157
Heavy Duty Vehicle Life-Cycle Cost Analysis 157 Summary Minimum Life-Cycle Cost Values and Ages 171
APPENDIX F AGENCY SUPPLIED LIFE-CYCLE COST DATA 174
METRICENGLISH CONVERSION FACTORS 181
Federal Transit Administration iii
Useful Life of Transit Buses and Vans Final Report Executive Summary
EXECUTIVE SUMMARY
The Federal Transit Administrationrsquos (FTArsquos) service-life policy for transit buses and vans establishes the minimum number of years (or miles) that transit vehicles purchased with federal funds must be in service before they can be retired without financial penalty The clear goal of this policy is to ensure that vehicles procured using federal funds remain in service for a substantial portion of their service life thus ensuring that federal taxpayers obtain an adequate return on their investment
Over time perception of these requirements has become less as a minimum service-life requirement (to ensure a reasonable return on federal dollars invested) and more as the actual useful life (a point at which the asset should be retired) Given this change in interpretation most industry experts commonly refer to a standard 40-foot bus as a ldquo12-yearrdquo bus and many transit authorities have adopted 12 years as their retirement policy for this vehicle type There is also a common perception within the industry that transit vehicle manufacturers especially those working under low-bid procurements now design their vehicles to meet but not exceed the 12shyyear minimum-life requirement Hence rather than defining a minimum life expectancy to ensure an adequate return on federal funds the FTArsquos service-life policy has become viewed as the FTArsquos and the industryrsquos expectation for the full service life of the vehiclemdasha view that may have impacted the actual life expectancy of the nationrsquos transit fleets
Table ES-1 Minimum Service-life categories for Buses and Vans
Category Typical Characteristics Minimum Life
Length ApproxGVW Seats Average Cost
(Whichever comes first)
Years Miles
Heavy-Duty Large Bus 35 to 48 ft and 60 ft artic
33000 to 40000 27 to 40 $325000 to
over $600000 12 500000
Heavy-Duty Small Bus 30 ft 26000 to 33000 26 to 35 $200000 to
$325000 10 350000
Medium-Duty and Purpose-Built Bus 30 ft 16000 to
26000 22 to 30 $75000 to $175000 7 200000
Light-Duty Mid-Sized Bus 25 to 35 ft 10000 to 16000 16 to 25 $50000 to
$65000 5 150000
Light-Duty Small Bus Cutaways and Modified Van 16 to 28 ft 6000 to
14000 10 to 22 $30000 to $40000 4 100000
Study Goals and Objectives
FTA established its minimum life requirements for transit buses and vans in 1985 At that time the requirements represented the consensus opinion of a broad range of industry representatives Since then the requirements have undergone only minimal changes and remain essentially unaltered The objective of this study is to reassess FTArsquos existing minimum-life policy given
Federal Transit Administration iv
Useful Life of Transit Buses and Vans Final Report Executive Summary
the actual experiences of both transit operators and vehicle manufacturers Key questions to be addressed by this review include
bull What are the actual ages (and mileages) at which operators are retiring their transit buses and vans and how do those ages compare to the FTA minimums
bull Do the current minimum age and mileage requirements meet the needs of all agency types
bull How do FTArsquos current retirement minimums affect the purchase and retirement decisions of the nationrsquos operators
bull How have changes in vehicle designs (eg low floor) and technologies (eg alternative fuels) affected the expected vehicle life
bull Should FTA consider changing the current minimums given the experience of the nationrsquos transit operators and manufacturers
This study seeks to provide answers to each of these questions with the ultimate objective of assessing both the appropriateness of FTArsquos existing minimum service life policy for transit buses and vans and any potential need to change that policy
Approach
To meet the needs of the study the study team completed the following eight independent analyses Each of these analyses aimed to provide a different perspective on (1) the current useful life of transit buses and vans (2) the appropriateness of FTArsquos minimum life policy and (3) the policyrsquos impact on transit vehicle life expectancies and vehicle retirement decisions at the agency level
bull Review of FTArsquos Current Service-life Categories The study reviewed the definitions and the characteristics of the vehicles found in each of the five existing service-life categories The objectives were to determine the appropriateness of the categories based on the similarities and dissimilarities of the vehicle types found in each category and to conduct a market analysis for each category (ie annual vehicle sales and transitrsquos share of those sales)
bull Review of Procurement Regulations with Potential Service-life Implications The study reviewed federal legislation and circulars to identify federal requirements potentially affecting either the useful life or vehicle retirement decisions of the nationrsquos operators of transit buses and vans This review included FTArsquos bus testing regulations the Americans with Disabilities Act (ADA) Buy America requirements the Standard Bus Procurement Guidelines and the Clean Air Act and its Amendments
bull Analysis of Actual Retirement Ages The study used National Transit Database (NTD) data to determine the actual ages at which US agencies are currently retiring each of the transit bus and van types This analysis was then used to compare the average retirement ages with the minimum FTA age requirements for each vehicle category to determine how these minimums may be impacting local operatorrsquos vehicle retirement decisions
bull Industry Outreach The study team conducted two sets of interviews with bus fleet managers vehicle engineers and procurement personnel from a sample of the nationrsquos large medium and small-sized bus and van operators The first set of interviews documented
Federal Transit Administration v
Useful Life of Transit Buses and Vans Final Report Executive Summary
industry concerns with the existing service-life policy and elicited suggestions on how or if that policy should be changed A second set of follow-up interviews focused on engineering specific issues such as the impact of new vehicle designs on expected vehicle life
bull Market Analysis Most transit bus and van components and many of the vehicles themselves are derived from the general truck and automotive market Market analysis provides a perspective on transitrsquos role and position within the broader truck and automotive market with emphasis on where transit has the ability to influence component and overall vehicle life expectancy
bull Engineering Analysis The engineering analysis examines the life expectancy of individual vehicle components and of the vehicle as a whole (ie the factors that determine overall vehicle useful life) This analysis then considers the appropriateness of the minimum life requirements for each vehicle category given the useful-life characteristics of each vehiclersquos component parts
bull Economic Analysis This analysis identifies that point in the life cycle of each bus and van type at which total life-cycle costs are minimized This point provides a financially logical age (mileage) at which to retire that vehicle The identified minimum cost replacement ages are then placed in context with the results of the engineering analysis The combination of these two perspectives helps illustrate factors that drive granteesrsquo vehicle retirement decisions
bull Review of Prior Useful-Life Studies The study reviewed prior useful-life studies completed by FTA and the American Public Transportation Association (APTA) with the objective of working to obtain more current answers to the same questions and to compare and contrast the findings of this study with those of prior efforts
Key Findings
Each of the eight independent analyses yielded insights into the useful life of transit buses and vans and FTArsquos minimum service-life policy Key findings from each of the various analyses performed for this study are outlined below
Review of FTArsquos Current Service-Life Categories
The review of FTArsquos minimum service-life requirements yielded the following key findings
bull Transit bus and van fleets are dominated by 12-year and 4-year vehicles Of the roughly 91000 transit buses and vans currently in service at US transit operators more than 70000 (about 78 percent) are 12-year vehicles about 16500 (18 percent) are 4-year vehicles and the remaining 5 percent are divided between the 10-year 7-year and 5-year vehicle categories
bull The current service-life category groupings are appropriate A key study objective was to assess the appropriateness of the existing service-life categories (ie whether these categories ldquomake senserdquo) The study found that the categories represent logical groupings of vehicles having broadly similar characteristics in terms of construction methods size weight passenger capacities cost manufacturers and customer bases (see Table ES-1 above) A possible exception here is with 4-year and 5-year vehicles built using cutaway chassis where
Federal Transit Administration vi
Useful Life of Transit Buses and Vans Final Report Executive Summary
there is a significant degree of overlap between the two age categories in terms of construction type sizes and manufacturers However the similarities are not adequate grounds for combining the two into a single ldquo4-to-5-yearrdquo vehicle category
bull The transit industry has little ability to alter bus and van useful-life characteristics cost-effectively Nearly half of the vehicle components for 12-year buses and most components for all other vehicle categories (including the vehicles themselves) are obtained from either the heavy-truck or automotive markets Given its small share of these markets (typically less than one percent) the transit industry has little ability to influence component useful-life characteristics in a cost-effective manner A key exception here is the structure of 12-year buses To the extent that 12-year bus structures are designed specifically for transit use the transit industry has some leverage to influence this componentrsquos design and durability characteristics (However given the manufacturersrsquo small annual order sizes and tight local agency capital budgets funding such innovation is challenging in practice) For most other components and vehicle types (eg minivans and cutaway chassis) the transit industry cannot significantly alter the useful-life characteristics without incurring the cost of customizing mass-produced items to meet transit-specific needs
Review of Procurement Regulations with Potential Useful-Life Implications
While many federal regulations (eg Buy America Bus Testing ADA Environmental Protection Agency) and industry procurement practices (third-party contracting) are believed to have potential useful-life implications these implications are generally considered to be minor relative to the issues of annual mileage new vehicle designs changing life-cycle economics and other drivers of useful life A key exception here is the low-bid procurement process which can yield vehicles with lower quality structures leading to reduced longevity To protect against this outcome agencies need to establish firm structural component requirements during the pre-bid stage to ensure the minimum-life requirements are attained
Analysis of Actual Retirement Ages
The study used NTD data to determine how recent actual retirement ages for transit buses and vans compare with the FTArsquos current minimum service requirements for transit buses and vans and whether these requirements affect the vehicle retirement decisions of the nationrsquos transit operators Table ES-2 summarizes this analysis
Table ES-2 Minimum versus Average Retirement Age by Vehicle Category
Vehicle Category Minimum Retirement
Age Average Retirement
Age (Years) Share of Active Vehicles That Are
One or more years past the retirement minimum
Three or more years past the retirement minimum
12-Year Bus 151 19 9 10-Year Bus 7 4 7-Year Bus 82 12 3
5-Year BusVan 59 23 5 4-Year Van 56 29 10
Average retirement age estimates for this vehicle category suffers from small sample issues
Federal Transit Administration vii
Useful Life of Transit Buses and Vans Final Report Executive Summary
The analysis yielded the following key findings
bull Most buses and vans are retired well after minimum service-age requirement is satisfied With one exception Table ES-2 shows that on average transit buses and vans are retired between one to three years after their minimum service-life requirement has been satisfied The exception is the 10-year bus category where small sample issues prevented determination of a reliable average retirement age value (hence it remains unclear how far past the minimum service-life requirement this vehicle type is typically retired) In addition Table ES-2 demonstrates that a significant proportion of buses and vans remain in service at least one year past the retirement minimum (eg 20 percent of heavy-duty 12-year buses) with many still in service three or more years past the minimum requirement (eg one in 10 ldquo12-yearrdquo buses in active service are age 15 or older)
bull Minimum service age does not constrain agenciesrsquo vehicle retirement decisions Based on this and other analyses conducted using NTD data it is clear that relatively few transit buses and vans are retired right at the minimum service age requirement Thus the current retirement minimums are not constraining the vehicle retirement decisions of the vast majority of the nationrsquos bus and van operators (a finding confirmed in the agency interviews described below) Given this observation it is also clear that any reduction to the current minimum-age requirements (eg from 12 to 10 years for a ldquo12-year busrdquo) would not result in any significant increase in the rates of retirement for the five service-life categories
Industry Outreach
The included interviews of representatives of local transit operators vehicle manufacturers and private bus fleet operators to assess their current experiences with bus and van useful life as well as FTArsquos minimum service-life requirements Questions covered areas such as vehicle replacement decisions alternatives to the current FTA policies maintenance practices and the impacts on service quality The following are key findings from this industry outreach process
bull Most agencies have vehicle service-life policies All nine of the agencies completing the detailed interviews reported having either a service-life policy or a planned retirement age for heavy-duty 12-year buses For four of the agencies the planned retirement age exceeds the FTA minimum of 12 years (with the Los Angeles County Metropolitan Transportation Authority at 13 years the Washington Metropolitan Area Transit Authority and Jefferson Transit at 15 years and the Toronto Transit Commission at 18 years)
bull Actual retirement ages generally exceed both FTA minimums and agency service-life policies The actual timing of vehicle retirement for all nine agencies typically occurs between one to four years after the FTA minimum has been reached (but can occur as late as vehicle age 20) Moreover for most agencies the recent actual retirement ages also exceed the planned or policy retirement ages Given these observations it is clear that FTArsquos current minimum service-life requirement for heavy-duty buses does not actively constrain the agenciesrsquo retirement decisions (as retirements occur after the minimum retirement age has been reached) None of the agencies reported having to take advantage of FTArsquos ldquolike-kind exchangerdquo provision permitting early retirement of specific vehicles
bull Capital funding availability is the primary determinant of retirement age Limited capital funding was cited as the primary reason that the timing of actual vehicle retirements
Federal Transit Administration viii
Useful Life of Transit Buses and Vans Final Report Executive Summary
has exceeded the plannedpolicy retirement age (and FTA service minimums) by all but one of the responding agencies Because of this the average fleet age is more likely to be impacted by the increased availability of federal funding than by any relaxation in the minimum service-life requirements Other decision factors included service reliability vehicle condition vehicle maintenance physical and local environmental conditions (salt intrusion) procurement process (low bid or negotiated) and duty cycle (mainly operating speed)
bull Only large agencies operating in ldquosevererdquo urban environments perform scheduled mid-life overhauls Only the larger urbanized agencies interviewed (Massachusetts Bay Transportation Authority New York City Transit Toronto Transit Commission and Washington Metropolitan Area Transit Authority) perform comprehensive ldquomid-liferdquo overhauls of their heavy-duty cycle vehicles stating that these overhauls are required to obtain service lives of 12 years or more given the tough service environments in which they operate In contrast none of the other agencies interviewed (including Los Angeles County Metropolitan Transportation Authority and Houston Metro) regularly complete a mid-life overhaul with most suggesting it is not cost effective for them
bull Most agencies have needed to retire vehicles early Most of the agencies have had to retire vehicles prior to their scheduled or desired retirement age The causes of these early retirements range from unexpected declines in vehicle condition high maintenance costs equipment upgrades or damage beyond repair Most agencies would support the introduction of a policy variance for particularly troublesome procurements but were equally concerned about how FTA could control the review and approval process
bull Most agencies have not been impacted by FTArsquos service-life requirements Most interviewed agencies stated that their vehicle retirement decisions are not significantly impacted by FTArsquos service-life minimums (the decisions are constrained more by capital funding availability) The agencies did suggest that more category options may be advantageous in the future to reflect differences in expected vehicle life as new vehicle designs and technologies are introduced (eg for bus rapid transit)
bull Extending the service-life requirements would hurt many agencies Conversely most (if not all) of the agencies reported that they would be negatively impacted if current FTA service-life minimums were extended These negative impacts include a decrease in service quality (eg higher failures rate vehicle aesthetic and reliability) an increase in maintenance costs (between 10 to 50 percent higher) and less leeway to retire ldquoproblemrdquo vehicles
bull Agencies support development of a ldquolemon lawrdquo and a technology demonstration option Interview respondents supported development of a ldquolemon lawrdquo and a technology demonstration option The lemon law concept would permit early retirement of problem vehicles without penalty to the agency All respondents agreed that this provision would need to clearly specify the conditions under which vehicles could be retired early andor define a clear FTA process for evaluating whether a vehicle is in fact a ldquolemonrdquo Under the technology demonstration concept a grantee could request a similar release from the service-life policy for FTA-approved tests of new vehicle technologies that would allow the agency to discontinue operation of the vehicle if the technology proved too problematic FTA could
Federal Transit Administration ix
Useful Life of Transit Buses and Vans Final Report Executive Summary
approve this on a selective basis through documentation of the demonstration results and industry dissemination
bull Most agencies are not interested in more or less durable heavy-duty vehicles Interview respondents were asked to consider their agencyrsquos interest in heavy-duty vehicles with longer shorter or other service-life characteristics They responded as follows
ndash More Durable (Longer Life) Heavy-Duty Vehicles Most agencies indicated that they were not interested in a more durable vehicle (ie with a more expensive heavier weight longer life expectancy structure) This is due to concerns over the cost effectiveness weight and rider comfort for this option Some agencies stated a more durable vehicle type might be considered if its components were equally durable
ndash Less Durable (Shorter Life) Heavy-Duty Vehicles All nine agencies expressed significant concerns with a less durable vehicle (ie with a cheaper lighter weight lower life expectancy structure) Concerns involved the vehiclersquos anticipated inability to survive the required duty cycles relationship with the expected life of components and decreased quality and the increase in procurement efforts
ndash Agency-Determined Retirement Age None of the agencies objected to the alternative option of allowing agencies to use their own judgment in determining vehicle retirement ages (ie drop all minimum life requirements and rely on funding constraints to ensure vehicles are retained for reasonable service lives) Based on the current actual retirement ages of the nine agencies few agency vehicles would be retired before the current FTArsquos current minimums (due to funding constraints)
Engineering Analysis
The engineering analysis provides further evaluation of bus useful life from a vehicle engineering perspective The following are key findings
bull Useful life is ultimately determined by the life of the vehicle structure Relatively few vehicle components typically last the full ldquoservice liferdquo of the vehicle For 12-year vehicles this includes the structure exterior and electrical system (see Figure ES-1) Vehicle structure as a whole defines the useful life of the vehicle more than any other single vehicle component The reason being that the structure is the backbone to which all other vehicle components are ultimately attached If the structure wears out or fails due to corrosion or a collision then the life of the vehicle is essentially at an end
bull Service environment is a key determinant of structure useful life In addition to vehicle age and service miles many interview participants clearly indicated that service environment is a key determinate of structure (and hence vehicle) useful life Vehicle structures that endure high passenger loads or operate in more severe service environments (eg rough urban roads) wear out faster Because of this several agencies expressed a desire for FTA to revise the service-life requirements definition to include service environment severity along with service years and miles (eg 12 years or 500000 miles) This desire was also identified in prior reviews of bus service life including the 1995 Bus Industry Summit
Federal Transit Administration x
Useful Life of Transit Buses and Vans Final Report Executive Summary
Figure ES-1 Component Expected Life 12-Year Bus
Structure
Electrical System
Suspension
Fuel System
Engine
Axles and Differential
Wheels and Tires
Transmission
Brakes
Wheelchair Lift
Radio and Public Address System
Hubs
Fare Collection Device
Air System
Body
Windows
Interior Climate Control
Interior
Destination Signs
Operability
Safety
Esthetics
0 2 4 6 8 10 12 14 16 Expected Component Life (Years)
bull ldquoStick busrdquo and low-floor vehicles may have a shorter useful life Interview participants suggested that stick bus (structures constructed using hundreds of welded tubes) and low-floor designs (which use stick construction) may have a shorter useful life as compared to traditional designs With the stick bus the thousands of welds that hold the structure together are more subject to corrosion and fatiguemdashan issue that manufacturers have largely addressed using corrosion-resistant coatings stainless steel and design strengthening Interview participants stated that it is too early to determine whether the low-floor design will impact vehicle longevity but noted that this design is more susceptible to road-side damage and salt spray (as the floor structure is closer to the ground)
bull New propulsion systems and electronics technologies may also impact useful life While engines for compressed natural gas and hybrid electric buses are expected to have similar useful lives compared to diesel these two engine types weigh more than diesel engines which may have an impact on structural wear (this has yet to be determined in practice) Similarly the rapid proliferation of new electronics technologies on buses (such as automatic vehicle location automatic passenger counters (APCs) on-board cameras and voice annunciation) may have implications for useful life as the presence of so many systems increases the likelihood of reliability issues Again the actual impact on useful life has yet to be determined in practice
Economic Analysis
For all vehicle categories the economic analysis identified the age at which total life-cycle costs including all capital operating and maintenance costs are minimized (reflecting the impact of differences in mileage) This analysis identifies a financially optimal retirement point for the vehicle Table ES-3 summarizes the results of this analysis
Federal Transit Administration xi
Useful Life of Transit Buses and Vans Final Report Executive Summary
Table ES-3 Minimum Life-Cycle Cost Replacement Ages and Mileages by Service-Life Category
Vehicle Type Category Annual Vehicle Mileage
Minimum Cost Age
Minimum Cost Mileage
Heavy-Duty Large Bus 12-Years 500000 Miles
25000 35000
17 14
425000 490000
45000 12 540000 Heavy-Duty Small Bus 10-Years 350000 Miles
25000 35000
12 11
300000 385000
45000 11 495000 Medium-Duty Small Bus 7-Years 200000 Miles
25000 35000 45000
9 8 7
225000 280000 315000
Light-Duty Midsize BusVan 5-Years 150000 Miles
20000 30000
7 6
140000 180000
40000 5 200000 Light-Duty Small BusVan 20000 6 120000 4-Years 100000 Miles 30000 5 150000
40000 4 160000 Note Shaded cells indicate where minimum cost point exceeds FTA age or mileage minimums
The following are key findings
bull The minimum cost retirement points all occur at or after the FTA minimum service life Table ES-3 suggests that from a cost-effective perspective FTArsquos current service-life minimums including both the minimum years and miles requirements represent reasonable choices For each service-life category the minimum cost point is attained at either an age or mileage that exceeds one or both of the FTA minimums for these measures In all cases the difference between one or both of the current FTA minimum requirements and the minimum cost age or mileage also provide some margin for the earlier retirement of vehicles with reliability problems This suggests that current age and mileage service-life minimums represent financially sound minimum-life choices
bull Reducing heavy-duty vehicles service life from 12 to 10 years would only have a minimal impact on vehicle sales At most 10 percent of all retirements for heavy-duty buses occur right at vehicle age 12 translating to an average of roughly 200 to 300 annual retirements potentially constrained by FTArsquos minimum-life requirements Assuming vehicles retiring at the current 12-year minimum shifted to a new 10-year minimum the long-term average annual replacement rates for these operators would increase from 200 to 300 vehicles to 240 to 360 vehicles annually or 40 to 60 additional vehicles per year Given that deliveries of new buses average roughly 3000 per year and the industryrsquos estimated total vehicle production capacity of 7500 to 10000 vehicles the addition of 40 to 60 new vehicles is far from significant Hence reducing useful life for heavy-duty vehicles by two years is unlikely to yield a significant boost to the small domestic bus market
bull Reducing heavy-duty service life from 12 to 10 years would have a minimal impact on ridership and service reliability Given that so few vehicle retirements are currently
Federal Transit Administration xii
Useful Life of Transit Buses and Vans Final Report Executive Summary
constrained by FTArsquos current service-life policy any reduction is unlikely to drive significant improvements in ridership levels or service reliability Note however that the relationship between vehicle condition and ridership is not well understood and FTA may wish to sponsor studies to better evaluate this issue
Recommendations
Based on the findings above it is recommended that FTA consider the following
bull Maintain the current service-life minimums Few buses and vans are currently retired right at FTArsquos current service-life minimums Rather the vast majority of these vehicles are retained in service for at least one year (4- and 5- years vehicles) and as many as three or more years (eg for 12-year vehicles) after the minimum service requirements have been met indicating that these vehicles have some service life remaining beyond the minimums Moreover the current service-life age andor mileage minimums for all vehicle types occur before the minimum life-cycle cost points for these vehicles are reached Hence the current service-life minimums clearly meet the joint objectives of (1) ensuring that buses and vans purchased using federal dollars remain in service for most of their useful life (2) of providing agencies some flexibility in determining when their vehicles will be retired and (3) of helping to minimize life-cycle costs In this sense the current service-life minimums really are just that the minimum ages at which vehicles can be retiredmdashnot a recommended retirement age or a measure of actual expected useful life The current minimum service-life requirements should be maintained
bull Maintain the current service-life categories Similarly the segmentation of transit bus and van types into the current five service-life categories reflects actual similarities in vehicle structures designs components costs origin markets manufacturers and end users These current categories should be maintained
bull Review the service-life minimums and service-life categories regularly The analysis of recent changes in vehicle designs the adoption of new technologies and the introduction of new vehicle types (eg stainless-steel bus rapid transit vehicles) highlight the fact that the service-life characteristics of transit buses and vans are subject to change For this reason FTA should review the minimum life requirements and service-life categories on a regular basis (eg every 5 to at most every 10 years)
bull Adoption of a ldquolemon lawrdquo This law would define circumstances under which ldquoproblemrdquo vehicles could be retired early without financial penalty
bull Adoption of a technology demonstration option Similar to the ldquolemon lawrdquo this option would define circumstances under which agencies could retire vehicles purchased to test new technologies (with FTArsquos prior agreement) earlymdashwithout financial penalty The intention would be to encourage test and adoption of new but potentially unreliable technologies expected to benefit the entire transit industry
bull Restrict the service-life categories in which vehicles are tested In recent years some manufacturers have successfully lobbied to have their vehicles tested in a more durable category than would appear warranted by their vehiclersquos general characteristics (eg testing a bus with 10-year characteristics as a ldquo12-yearrdquo bus) This has resulted in service reliability
Federal Transit Administration xiii
Useful Life of Transit Buses and Vans Final Report Executive Summary
issues and in some instances early retirement for the purchasing agencies when the tested vehicles were not found to have the expected durability Thus FTA may wish to more tightly control the categories in which vehicles are eligible to test based on some combination of characteristics (eg gross vehicle weight and seating capacity) but with the potential for special waivers to test in a different category so as not to stifle innovation (Manufacturers should be required to provide reasonable justification as to why their vehicles should be tested in the higher durability category)
bull Modify the NTD reporting requirements to better document actual vehicle retirement age and each vehiclersquos assigned service-life category The analysis used in this study to determine actual vehicle retirement ages relied on cross comparisons of NTD data from multiple reporting years FTA should modify NTD to track the actual age of vehicle retirements thus significantly improving FTArsquos ability to track and monitor any trends in vehicle retirement ages Similarly NTDrsquos vehicle documentation should also include the service-life category to which each vehicle has been assigned (again to facilitate monitoring of the retirement ages for each service-life category)
bull Conduct a study to evaluate the sensitivity of bus ridership to changes in vehicle age and condition A key objective of this study was to consider how bus ridership might change (increase) in response to a reduction in the average age of the nationrsquos bus fleets (eg with the introduction of a new shorter-lived heavy-duty transit vehicle) However while review of the existing literature provides numerous references to the sensitivity of ridership to changes in fares and service frequency no literature references were identified that provide a quantitative link between ridership and fleet age or condition In the absence of solid empirical data linking ridership and fleet age any analysis of this relationship can only be based on conjecture and limited anecdotal evidence For this reason the study team recommends that FTA conduct a study to evaluate the sensitivity of bus ridership to changes in vehicle age and condition Given the availability of good-quality route-level ridership data (from electronic fare boxes and APCs) this study could easily be conducted using a sample of US transit operators using before and after comparisons of which older sub-fleets have been replaced by new (or newer) vehicles
Federal Transit Administration xiv
Useful Life of Transit Buses and Vans Chapter 1 Final Report Introduction
CHAPTER 1 INTRODUCTION
Background
Transit agencies purchasing transit buses and vans using federal capital funds are required to keep these vehicles in service for a minimum period of time (years) andor number of miles prior to that vehiclersquos retirement to ensure effective use of federally funded assets This minimum service-life requirement differs based on bus and van size and other characteristics and is specified in FTA Circular 90301B The requirements currently recognize five different service-life categories (see Table 1-1)
Table 1-1 Minimum Service-Life Categories for Buses and Vans
Category Minimum Life
(Whichever comes first)
Years Miles Heavy-Duty Large Bus 12 500000
Heavy-Duty Small Bus 10 350000 Medium-Duty and Purpose-Built Bus 7 200000
Light-Duty Mid-Sized Bus 5 150000 Light-Duty Small Bus Cutaways and Modified Van 4 100000
The relative abundance of vehicles within these different categories varies significantly (see Figure 1-1) As might be expected 12-year buses account for more than three-quarters of all US transit buses and vans while 4-year vehicles account for nearly one-fifth of vehicles The remaining vehicle types including 10- 7- and 5-year vehicles collectively account for less than 5 percent (one in 20 vehicles) of the nationrsquos transit bus and van fleet The limited number of vehicles and relatively shallow depth of the market for 10- 7- and 5-year vehicles (roughly 4000 vehicles out of a total of more than 90000 transit buses and vans nationwide) make it difficult to effectively assess the actual useful-life characteristics of these less popular vehicle types In contrast agency and industry data sources have relatively good quality data on the useful-life experiences of the 12- and 4-year vehicle types
Since its inception several issues have been raised regarding FTArsquos minimum service-life policy These include the vehicle category definitions the use of vehicle age or miles (or hours) as the basis for defining service life and the potential for extended life cycles through life-extending overhauls More generally the question arises as to whether the current minimum life ages and mileages are appropriate given the experiences of the nationrsquos operators of transit buses and vans
Federal Transit Administration 1
Useful Life of Transit Buses and Vans Chapter 1 Final Report Introduction
Figure 1-1
Minimum Life Categories Shares of Nations Total Bus and Van Fleet
12 Year Buses
10 Year Buses and Vans
5 Year Buses and Vans 7 Year Buses
4 Year Van 18
and Vans 78
and Vans 11 2
Study Objectives
The aim of this study is to reassess FTArsquos existing minimum service-life policy (including both the actual minimum age and mileage requirements and the service-life categories into which bus and van vehicles are placed) based on the experiences vehicle retirement practices and life-cycle cost characteristics of the nationrsquos transit operators and vehicle manufacturers Key questions to be addressed by this review include the following
bull What are the actual ages (mileages or service hours) at which operators are retiring their transit buses and vans and how do those ages compare to the FTA minimums
bull Do the current minimum age and mileage requirements meet the needs of all agency types
bull How do FTArsquos current retirement minimums affect the purchase and retirement decisions of the nationrsquos operators
bull How has other federal legislation such as ldquoBuy Americardquo impacted vehicle bus and van useful life if at all
bull Should FTA consider changing the current minimums given the experience of the nationrsquos transit operators and manufacturers Alternatively how would an increase or decrease in the current minimum life requirements affect the fleet investment decisions of the nationrsquos transit operators
bull Are operators interested in procuring vehicles with shorter life expectancies than are permitted by the current policy (eg a cheaper and shorter life expectancy 40-foot bus)
bull How have changes in vehicle designs (eg low floor) and technologies (eg alternative fuels) affected the expected vehicle life
bull How do vehicle procurement policies impact expected vehicle life
Federal Transit Administration 2
Useful Life of Transit Buses and Vans Chapter 1 Final Report Introduction
This study seeks to provide answers to each of these questions with the ultimate objective of assessing both the appropriateness of FTArsquos existing minimum service-life policy for transit buses and vans and any potential need to change that policy
Reasons for Reviewing the Service-Life Policy
More than 20 years have passed since the adoption of FTArsquos minimum service-life guidelines Since that time the industry has undergone several significant changes many with potential implications for vehicle useful life Among these are the following
bull Operator Experience and Changing Economics The current minimum service-life requirements were developed based on the industryrsquos understanding of useful life as of 1985 With two decades of experience operating under these requirements operators have developed their own impressions and opinions as to how these requirements align with actual useful-life experience Moreover even if it is assumed that there have been no changes to the buses themselves (which of course there have been) changes to capital and operating costs as well as to vehicle utilization (passenger loads and duty cycles) will have yielded changes to both the economic and physical determinants of vehicle useful life
bull Impact of the Policy Itself It has been suggested that the presence of FTArsquos vehicle service-life policy has itself impacted actual useful-life expectations For example the combination of the low-bid and minimum life requirements may have yielded buses designed specifically to meet but not exceed the minimum life requirement (eg thus reducing the total expected useful life of a 40-foot bus from 14 to 16 years to say 12 years) Alternatively many manufacturers have lobbied to have their vehicles moved to a higher minimum age category (eg 10-year buses re-categorized to 12-years) as a means of expanding the potential market for their product There is now some evidence that this practice may have yielded buses that are capable of meeting the higher category bus testing requirements and yet not capable of meeting the service-life minimums once in service
bull New Vehicle Designs and Materials The past 20 years have seen the introduction of many new vehicle designs including increasing use of differing vehicle lengths (from 60 foot articulated to 30 foot sizes for 12-year buses and a similar range of sizes for 10-year 7-year and 5-year vehicles) low floor buses and ldquostickrdquo buses using a network of welded tubes in place of more traditional structures Each of these design variations especially those with changes of structural significance has implications for expected vehicle life
bull Alternative Fuels Operators have also increasingly adopted the use of alternative fuels vehicles including compressed natural gas (CNG) duel-fuel gas hybrid and potentially fuel cell vehicles Some of these are coming to the end of their first full life cycle thus providing an opportunity to assess their impact on vehicle useful life
bull New Technologies The past 5- to 10-year period has seen a significant increase in the number of new technologies installed on transit buses These include automatic vehicle location (AVL) automatic passenger counters (APCs) voice annunciation on-board cameras multiplexers and potentially collision avoidance systems Assuming many or all of these systems are expected to function before a vehicle can be released for revenue service each day the sheer proliferation of the technologies and the increasing likelihood that any
Federal Transit Administration 3
Useful Life of Transit Buses and Vans Chapter 1 Final Report Introduction
one of them will fail as the vehicle ages has significant implications for vehicle useful life From another perspective the increasing desirability of having the latest suite of technologies on each fleet vehicle can also drive down the useful life of transit vehicles with life here being determined more by technological obsolescence than by asset wear
bull Changes to the Domestic Manufacturing Market The combined influences of wide production variances Buy America provisions and the exit of several suppliers has significantly affected the long-term structure and viability of the domestic bus market The changes have yielded uncertainty regarding the future of exiting manufacturers and also impacted the availability of replacement parts for (and hence maintainability of) older fleet vehicles
bull Legislation In addition to Buy America provisions bus suppliers and purchasers are subject to a variety of additional federal requirements that may impact vehicle useful life Among these are the Bus Testing ADA and EPA emissions requirements
bull Procurement Strategies While transit operators continue to use a variety of vehicle procurement strategies the use of low-bid procurements in particular may have a negative impact on vehicle useful life Moreover as discussed elsewhere in this study the relatively small size of individual agency procurements (and the small size of the transit market in relation to the broader truck and automotive market) gives transit operators and the industry as a whole little ability to directly impact the useful-life characteristics of many bus and van types or their components
bull Desire to Increase Ridership Service Quality FTArsquos policy objective of increasing ridership might be served by accelerating the removal of older vehicles from service (thus improving the quality of service) As noted above such an accelerated replacement cycle could similarly quicken the adoption of new technologies further enhancing the rate of service improvement
Each of these considerations supports a reassessment of FTArsquos current minimum service-life requirements This study duly reviews each of these considerations
What is Useful Life
Before reviewing the study analyses and results it is helpful to first establish a working definition of useful lifemdasha concept that has different meanings to different users Useful life is typically defined as that age (ie number of years) after which an asset is no longer ldquofit for userdquo in the sense that it has become worn not fully operational unreliable andor does not otherwise deliver transit service of acceptable quality For mechanical assets such as transit vehicles the total utilization of that asset (eg life to date vehicle miles or hours) is equally important to age when establishing a minimum useful life Useful life based on asset utilization depends on the asset type its design specifications and the service it performs For transit buses and vans it is clear that total vehicle miles is in most instances a better measure of asset ware than vehicle age (with the latter frequently functioning as a rough proxy for the former) An empirical analysis of the relationship between useful life expectancy in years and vehicle life-to-date mileage for US transit buses is demonstrated in Chapter 7 (and repeated again later in the report using financial
Federal Transit Administration 4
Useful Life of Transit Buses and Vans Chapter 1 Final Report Introduction
analysis) These analyses underscore the importance of maintaining a combined age- and mileage-based FTA service-life policy
Engineering-Based Bus Conditions
For transit buses it is not sufficient to be merely ldquooperationalrdquo Rather transit patrons expect a vehicle that is reliable safe and offers reasonably comfortable travel The problem lies in identifying a specific point in the assetrsquos life (age or service miles) at which service quality safety or reliability is no longer acceptable In reality the decline in condition of a transit vehicle is a slow continuous process (excepting the impact of major overhauls) with no obvious point of retirement What is acceptable to one transit patron may not be to another
Figure 1-2 highlights both the absence of an obvious retirement age based on physical condition alone as well as the effect of vehicle use on vehicle condition In support of model development for the Transit Economic Requirements Model (TERM) FTA has conducted detailed physical condition inspections of more than 900 transit bus and van vehicles at more than 40 different transit agencies nationwide (each inspection is represented by a point in Figure 1-2) The sloping lines in Figure 1-2 represent vehicle decay curves developed using this data for the 12-year and 4-year service-life categories Here overall vehicle physical condition is measured on a scale of 5 (excellent) through 1 (poor) The trend lines capture the rate of vehicle decay
The inspections revealed both a slow decline in vehicle physical condition (and related service quality and reliability) with age and (for each age) a wide variation in condition driven primarily by differences in vehicle mileage and maintenance practices (captured here by the spread of vehicle condition observation points) but no obvious age or condition value for vehicle retirement Hence while these conditionage relationships are extremely valuable in understanding and predicting the rate of physical decay for transit vehicles they cannot be used to identify a specific desired retirement age or condition As a point of reference most transit operators replace their vehicles somewhere between condition 20 to 25 on this chart
Cost-Based Useful Life Analysis
In contrast to this condition-based approach vehicle cost analysis can be used to identify a specific vehicle retirement age (or service miles) at which average annual life-cycle costs for each vehicle type are minimized For example the ldquominimum life-cycle costrdquo approach employed in this report (see Chapter 7) compares the decline in purchase cost per service mile over the life of a vehicle with the corresponding increase in operating and maintenance costs (as well as periodic engine transmission and other rehabilitation activities) The period in time at which the sum of these annualized capital and operating costs is minimized represents the financially optimal point for vehicle retirement Unlike the engineering-based condition assessment this method identifies a specific optimal point in the asset life cycle for vehicle retirement However while the engineering-based assessment does not provide a specific useful-life age it does recognize declining service quality with age (which financial considerations alone do not) Table 1-2 outlines the tradeoff between these two approaches
Federal Transit Administration 5
Useful Life of Transit Buses and Vans Chapter 1 Final Report Introduction
Figure 1-2 Ph
ysic
al C
ondi
tion
Bus and Van Physical Condition Versus Age 50
Full Bus (12 yr)
Small Bus (7-10 yr)
Vans (4 yr)
Decay Curve - 12-Year Bus
Decay Curve - 4-Year Van
Excellent
45
40 Good
35
30 Adequate
25
Substandard 20
15
Poor 10
0 1 2 3 4 5 6 7 8 9 10 11 12 13 14 15 16 17 18 19 20 21
Vehicle Age (Years)
Table 1-2 Engineering Versus Economic Approaches to Identifying Useful Life
Approach Measures Service Quality
Identifies a Specific Useful-Life Value
Engineering Condition Based Yes No Economic Minimum Cost Replacement No Yes
Minimum Optimal Expected and Average Useful Life
Finally this study frequently makes the distinction between four different concepts of useful-life including optimal useful life expected (or planned) useful life minimum useful life and the current average retirement ages for US transit buses Table 1-3 presents these concepts and their definitions Understanding the differences in these definitions is important to understanding the analyses in the succeeding chapters of the report and also has importance to any potential changes to FTArsquos current service-life minimums These concepts are also illustrated graphically in Figure 1-3
The distinctions between the definitions in Table 1-3 are more than semantic Many within the transit industry equate FTArsquos 12-year minimum with the expected or desired useful life of a large transit bus (indeed many of the agencies participating in this study have set their agencyrsquos expected useful life values equal to the FTA minimum) This rather then viewing the 12-year minimum as a point at which some useful-life remains From the viewpoint of establishing policy it is recommended that FTA continue to establish its service-life minimum requirements such that some useful life does remain and yet the majority of useful life has been consumed Under these circumstances the expected average and optimal useful life values for each transit bus and van type should each occur after the service-life minimum (as is currently the case based on the results of this study) Maintaining this policy will ensure that (1)
Federal Transit Administration 6
t
Useful Life of Transit Buses and Vans Chapter 1 Final Report Introduction
tax payers derive good value from funds invested in transit buses (2) agencies with higher than average vehicle wear rate characteristics (ie their expected and optimal useful lives are lower than the average) will have some leeway for earlier retirement and (3) agencies with a ldquoproblemrdquo vehicle model will also have some leeway for earlier retirement (Chapter 5 considers provisions for more highly problematic vehicle models)
Table 1-3 Vehicle Useful Life Concepts
Useful Life Concept Definition Example Based on ldquo12-Yearrdquo Bus
Expected or Planned Useful Life The age at which transit operators plan to retire their transit vehicles
For many agencies this point is driven by policy and or funding
The age at which agencies ldquoexpectrdquo under the assumption that these availability and occurs at age 12 to or ldquoplanrdquo to retire their vehicles assets will be completely worn 15 Average Useful Life
The age at which agencies ldquodordquo retire their vehicles
The average age at which US transit operators ldquoactuallyrdquo retire their transit vehicles
Based on analysis of NTD data presented below the average retirement age is 151 years
Optimal Useful Life
The age at which agencies ldquoshouldrdquo retire their vehicles
The financially optimal point for vehicle retirement (ie the point at which life-cycle costs are minimized)
Based on the analysis in Chapter 7 this occurs between 12 to 14 years depending on annual mileage and other factors
Minimum Useful Life
The minimum age at which agencies are ldquoallowedrdquo to retire their federally funded vehicles without penalty
The minimum agemileage to retire a vehicle This point assumes that most vehicles still have additional years of useful and cost-effective service but that most of the assetrsquos value has been consumed
Currently set at 12 years
Figure 1-3 Minimum Life-Cycle Cost Curve
TToottaall
OOwwnneerr--sshhiipp
CCoossttss
AAvveerraaggee LLiiffee
EExxppeecctteedd LLiiffee
MMiinniimmuumm LLiiffee
CCoossttss LLoowweesstt CCoosstt
AAggee MMiilleess oorr HHoouurrss
AAnnnnuuaalliizzeedd CCaappiittaall
RReeppllaacceemmeenntt UUsseeffuull LLiiffee RRaannggee
MMaaiinntteennaannccee CC t
Federal Transit Administration 7
Useful Life of Transit Buses and Vans Chapter 1 Final Report Introduction
Finally the upcoming chapters of this report investigate and assess each of these differing useful life measures based on the survey responses vehicle retirement activities and life-cycle costs of US transit operators Specifically Chapter 4 documents average useful life of all transit bus and van categories based on actual vehicle retirements as obtained from FTArsquos National Transit Database (NTD) Next Chapter 5 documents the expected useful life of the nationrsquos transit buses based on agency responses to a survey conducted for this study Finally Chapter 7 estimates the optimal useful life based on a minimum life-cycle cost analysis of each bus and van type The study then compares and contrasts the assessed values for each of these differing measures of useful life with FTArsquos current service-life minimums to assess the appropriateness of those minimums and any potential need to change them
What About Vehicle Hours
Finally FTArsquos minimum service-life policy is currently defined in terms of both vehicle age and vehicle miles But what about vehicle hours As noted above vehicle miles generally provide a better measure of vehicle ware as compared to vehicle age However the number of hours of service can vary significantly between vehicles with the same life-to-date mileage Consider the contrasting cases of vehicles operated in slower moving central business district routes versus vehicles operated for higher-speed longer-distance commuter bus service A vehicle operated at a relatively slow operating speeds will have many more service hours (and likely poorer physical condition) than a similar vehicles with the same life-to-date miles but operated at higher speeds This suggests that vehicle hours should be included along with age and mileage as a minimum useful-life measure
The problem with adopting vehicle hours as a measure of useful life is the fact that unlike vehicle age and mileage which can be measured (with mileage based on hub meter readings) operators do not currently maintain records of life-to-date vehicle hours and have no existing means of doing so Hence to be used as a measure of minimum useful life these values would need to be estimated somehow most likely based on an agencies average operating speed The impact of average operating speeds (and by extension vehicle hours) on vehicle retirement age is considered in the life-cycle cost analysis discussed in Chapter 8
Project Approach
To meet the needs of the study the study team completed the following six independent analyses Each of these analyses aimed to provide a different perspective on (1) the current useful life of transit buses and vans (2) the appropriateness of FTArsquos minimum life policy and (3) the policyrsquos impact on transit vehicle life expectancies and vehicle retirement decisions at the agency level
bull Review of FTA Service-Life Categories The study provides descriptions of the types of vehicles found in each of FTArsquos five service-life categories This includes descriptions of the vehicle physical characteristics purchase costs common service applications primary manufacturers and annual units sold The analysis also considers the source markets for transit components including transit-specific and those components obtained from the
Federal Transit Administration 8
Useful Life of Transit Buses and Vans Chapter 1 Final Report Introduction
broader heavy-truck and automotive markets The market analysis is intended to provide perspective on transitrsquos role and position within the broader truck and automotive market with emphasis on where transit has the ability (or inability) to influence component and overall vehicle life expectancy
bull Review of Useful-Life Related Bus Procurement Regulations The study reviews federal legislation and circulars to identify federal requirements potentially impacting either the useful life or vehicle retirement decisions of the nationrsquos operators of transit buses and vans This review includes FTArsquos bus testing regulations the Americans with Disabilities Act (ADA) Buy America requirements the Standard Bus Procurement Guidelines and the Clean Air Act and its Amendments
bull Review of Actual Retirement Ages NTD data were used to determine the actual ages at which US agencies are currently retiring vehicles within each of FTArsquos service-life categories This analysis was then used to compare the average retirement ages with the minimum FTA age requirements for each of these vehicle types to determine how the current minimum retirement ages may be impacting local operatorrsquos vehicle retirement decisions
bull Industry Outreach The study team conducted two sets of interviews with bus fleet managers vehicle engineers maintenance staff and procurement personnel from a sample of the nationrsquos large medium and small-sized bus and van operators The first set of interviews were designed to document the industryrsquos concerns with FTArsquos current service-life policy to obtain agency perspective on how that policy impacts agency procurement decisions retirement decisions or the expected life of agency vehicles and to elicit suggestions on how or if that policy should be changed These interviews were also used to further document vehicle retirement ages (both agency policy as well as the actual retirement ages) and to obtain bus and van life-cycle cost data The second set of interviews consisted of follow-up questions to the original interviewsmdashwith greater focus on specific engineering issues such as the impact of new vehicle designs and technologies on expected vehicle life
bull Engineering Analysis The engineering analysis examines the life expectancy of transit buses and vans within each of the existing vehicle categories all from an engineering perspective (ie based on ability to maintain service reliability and safety) This analysis is completed both from the perspective of individual vehicle components and from that of the vehicle as a whole (ie the factors that determine overall vehicle useful life) The analysis then considers the appropriateness of the minimum life requirements for each vehicle category given the useful-life characteristics of each vehiclersquos component parts
bull Economic Analysis This analysis identifies that point in the life cycle of each bus and van type at which total life-cycle costs are minimized This point provides a financially logical age (or mileage) at which to retire that vehicle The identified minimum cost replacement ages are then placed in context with the results of the engineering analysis The combination of these two perspectives helps illustrate factors that drive granteesrsquo vehicle retirement decisions
Once again each of these analyses provides perspective on how the current FTA minimum life requirements compare with useful life as determined from actual vehicle retirement ages agency assessments of useful life and life-cycle cost analyses In turn these perspectives provide a vantage point from which to assess the merits of FTArsquos current retirement minimums
Federal Transit Administration 9
Useful Life of Transit Buses and Vans Chapter 2 Final Report FTA Service-Life Categories
CHAPTER 2 FTA SERVICE-LIFE CATEGORIES
This chapter provides a detailed review of each of the five service-life vehicle categories currently used by FTA The purposes of this chapter are threefold First the chapter provides the reader with a solid understanding of the characteristics of each of the five vehicle types This includes both the general physical differences between vehicles in the differing category types as well as differences in cost This background is critical for an effective understanding of the findings in the sections and chapters to follow
Second the detailed descriptions of each vehicle type and the components used in their manufacture also serve to emphasize the commonalities among vehicles in the same category and differences between vehicles in different categories Stated differently this review of the five categories and the vehicles in those categories demonstrate that FTA is well served by the five existing minimum service-life categories The exceptions are the 4-year and 5-year categories which have significant similarities to each other in terms of both general characteristics as well as the names of the manufacturers serving those markets
Third this chapter provides a market assessment for both vehicles and their components of all five FTA bus and van categories A primary objective here is to highlight the small size of the market for transit buses and vans relative to the auto and heavy-truck market from which most transit bus vehicle components and some bus and van vehicle types are derived Given this small market share the transit industry has little ability to impact the useful life of most transit vehicle types and components in a cost-effective manner For this reason the useful-life characteristics of transit buses and vans are largely determined by the wider truck and auto market and any significant attempts to increase or decrease the useful life of transit specific vehicles are also likely to have a negative impact on vehicle cost
This chapter is organized as follows bull Service-Life Category Descriptions
ndash Physical Description of Each Vehicle Type ndash Market Analysis of Vehicle Chassis and Components by Category
bull Implications for the Current Service-Life Categories
Service-Life Category Descriptions
Large Heavy-Duty Buses (12 Years 500000 Miles)
Approximately three in four rubber-tired transit vehicles are 12-year buses making this vehicle type the transit industryrsquos primary workhorse With a standard length of 40 feet (with variants ranging from 30 to 60 feet) a gross vehicle weight of roughly 33000 to 40000 pounds and an average seating capacity for about 40 passengers the 12-year bus is also the largest heaviest and biggest capacity rubber-tired vehicle serving the transit market
Federal Transit Administration 10
Useful Life of Transit Buses and Vans Chapter 2 Final Report FTA Service-Life Categories
Construction Vehicles in the 12-year category are typically built on integrated structure chassis unit body monocoque or semi-monocoque chassis Heavy duty chassis of the high-floor unit body type are built with substantial amounts of metal in under-structural bulkheads and sidewalls located at points of concentrated stress such as the front and rear suspension attach points passenger door openings and the engine cradle The size and thickness of these bulkheads and sidewalls results in a strong structure with a good margin for corrosion-related structural degradation and are a key factor in the overall longevity of this vehicle type
A less expensive type of construction is an integrated chassis composed of multiple tubing elements sometimes referred to as a ldquostick builtrdquo chassis These stick-built structures consist of an integrated floor roof and sidewall structure of Low-Floor Stick Chassis metal tubes welded together on which the major components are attached Low-floor buses typically use this type of construction as there is very little space under the floor for large structural elements The relatively small size of the structural elements of the low-floor bus provides less structure to bear the suspension and engine loads and reduces the tolerance of the structure to the effects of corrosionmdasha factor which may lead to shorted vehicle life expectancies for this vehicle type (this issue is discussed further in Chapter 6) Both traditional and stick-built structures are covered with outer panels composed of either stainless steel aluminum or composite materials
12-Year Vehicle Types High and Low Floor Vehicles Prior to the mid-1990s all 12-year buses were exclusively ldquohighshyfloorrdquo vehicles However in response to the ADA the industry developed low-floor buses that use ramps kneeling mechanisms or steps just a few inches above the curb or level with the curb for ease of entry Low-floor buses are available in every size of heavy-duty bus from short lengths to 60-foot articulated vehicles While the cost and most physical characteristics of high- and low-floor vehicles are similar some NABI Articulated Low-Floor Bus operators suspect that low-floor vehicles may have a lower expected life as compared to the traditional high-floor vehicle Chapter 6 Engineering Analysis addresses this possibility
Vehicle Lengths 12-year buses come in a variety of sizes ranging from 30 feet to 60 feet (articulated) buses Shorter 30- to 35-foot
Composite Monocoque Structure
Federal Transit Administration 11
Useful Life of Transit Buses and Vans Chapter 2 Final Report FTA Service-Life Categories
models are used on lower ridership routes andor on streets with limited maneuverability In contrast 60-foot articulated buses are used on high ridership corridors Articulated buses are available in both high- and low-floor configurations
Propulsion System Options Twelve-year vehicles are available with a wide variety of propulsion system options including diesel gas CNG electric and hybrid systems
Vehicle Costs Table 2-1 presents typical purchase costs for large heavy-duty 12-year buses
Table 2-1 Purchase Costs Large Heavy-Duty Buses (12-Year)
Model Type Cost
High-floor 40 foot $350000 Low-floor 40 foot $350000 40-foot Hybrid $500000 60-foot articulated $500000 Bus rapid transit $500000-$1M
12-Year Vehicle Market Unlike all other bus and van types the ldquo12-yearrdquo bus is manufactured almost exclusively for the transit market by a small number of specialized manufacturers Hence while this vehicle includes numerous components obtained from the heavy-truck market the chassis body and many key components of this vehicle type are manufactured specifically with the needs of the transit market in mind Of the roughly 3000 heavy-duty 12-year transit buses sold each year approximately 95 percent or more of these vehicles are destined for use in the transit market Most of the remaining vehicles are sold for applications similar to transit including shuttle buses at airport parking lots and at some national parks
While 12-year vehicles are manufactured specifically for transit and similar applications a large proportion of these vehiclesrsquo components including the engine transmission axels brakes suspension air compressors and power steering are derived from the significantly larger heavy-truck market In fact the total value of components derived from the heavy-truck market account for roughly 40 percent of the value of a new 40-foot bus In a sense transit bus manufacturers ldquoborrowrdquo these components from the much larger heavy-truck market (roughly 300000 heavy trucks are sold annually versus 3000 twelve-year buses) leading to significantly cheaper component prices than would be possible if they were manufactured solely for the 12-year vehicle market On the down side these components are designed with the heavy-truck market in mindmdashand not the specific needs of transit users Hence transit has little ability to influence the useful-life characteristics of these components in a cost-effective manner (ie as any transit ldquocustomizedrdquo components would be developed for a transit market that is one percent of the size of the truck market for which those components are currently manufactured)
In contrast the chassis body and several other components including the doors wheelchair lifts axles on low-floor buses destination signs and HVAC are manufactured solely for the transit
Federal Transit Administration 12
Useful Life of Transit Buses and Vans Chapter 2 Final Report FTA Service-Life Categories
market Table 2-2 summarizes the shares of 12-year vehicles and related vehicle components destined for the transit market
Manufacturers Vehicles in this category are built by a relatively small number of manufacturers that specialize in this vehicle type These include Gillig Millennium Transit North American Bus Industries (NABI) New Flyer Nova Bus and Orion
Table 2-2 Market Analysis 12-Year Bus Vehicles and Components
Vehicle Components Primary Market
Annual Units Sold
12-Year Vehicle Share of Market
Share of Vehicle Purchase Cost
Total Vehicle 12-Year Bus Transit 3000 95 or more NA Vehicle Components Chassis body doors wheelchair lifts low floor axles destination signs HVAC
Transit 3000 95 or more 60
Engine transmission axles brakes suspension air compressors and power steering
Heavy Truck 300000 1 40
Small Heavy-Duty Buses (10 Years 350000 Miles)
The 10-year service-life category represents the second-most durable buses used in transit Vehicles in the category average roughly 30 to 40 feet in length (with most in the 30-foot range) have gross vehicle weights of approximately 26000 to 33000 pounds and have seating capacity for between 26 to 35 passengers Vehicles in this category account for roughly one percent of the nationrsquos bus and van fleet
Construction This class of vehicles was initially served by body-on-frame manufacturers using construction methods similar to school buses These manufacturers build their vehicles using medium heavy-duty rear engine ldquostrippedrdquo chassis also used for both school buses and motor homes Many of these buses are built using stripped chassis manufactured by medium- and heavy-duty truck manufacturers (eg International Freightliner and GM) although some 10-year vehicle manufacturers produce their own chassis The 10-year transit vehicle manufacturer (eg Blue Bird Optima and Thomas Built) then adds a body and other components to complete construction of the 10-year bus
More recently small bus manufacturers have been adapting European designs for the North American bus market The European designs have narrower widths (some as narrow as 96 inches) than typical North American bus designs and are promoted as more maneuverable in tight urban and suburban operating areas The adapted European designs also incorporate aluminum integral structure unit body monocoque or semi-monocoque structures which is a
Federal Transit Administration 13
Useful Life of Transit Buses and Vans Chapter 2 Final Report FTA Service-Life Categories
departure from the typical steel or stainless steel in more traditional North American designs The vehicles are available in both low floor and high floor
Champion Heavy-Duty Small Bus Eldorado Heavy-Duty Small Bus
Vehicle Costs Table 2-3 presents typical purchase costs for small heavy duty 10-year buses
Table 2-3 Purchase Costs Small Heavy Duty Buses (10-Year)
Model Type Cost
Body on Frame (30-40 feet) $200000 - $250000 Integral Chassis (30-40 feet) $250000 - $325000
10-Year Vehicle Market Transit buses account for only a very small proportion of the body-on-frame vehicle market from which the 10-year bus is derived More accurately of the roughly 60000 vehicles manufactured using body-on-frame construction each year only 200 to 300 are finished as 10-year transit buses (ie the body is a passenger compartment intended for transit or similar applications) The vast majority are finished as school buses or motor homes (in fact many buses sold in the 10shyyear category are just modified school buses) Hence for most 10-year transit buses the primary transit-specific components are the body (including the interior) destination signs and fare collection equipment The majority of the vehiclersquos major components including the chassis engine transmission axles brakes and steering are derived from either the broader school bus or motor home market of the still larger heavy-truck market Table 2-4 presents a summary market analysis of the 10-year vehicles and their components
Manufacturers Vehicles in this category are built by a relatively small number of firms that generally specialize in the manufacture of school buses motor homes and small transit vehicles These include Blue Bird Corporation Optima Bus Supreme Corporation and Thomas Built buses
Federal Transit Administration 14
Useful Life of Transit Buses and Vans Chapter 2 Final Report FTA Service-Life Categories
Table 2-4 Market Analysis 10-Year Bus Vehicles and Components
Vehicle Components Primary Market Annual Units Sold
10-Year Vehicle Share of Market
Share of Vehicle Purchase Cost
Total Vehicle 10-Year Bus Transit 200 to 300 95 or more NA Vehicle Components Body doors destination signs Transit 200 to 300 95 or more 35 Chassis wheelchair lifts HVAC School bus and
motor home 60000 Less than 1 25
Engine transmission axles brakes suspension air compressors and power steering
Heavy-Truck 300000 Less than 1 40
Medium-Duty and Purpose-Built Buses (7 Years 200000 Miles) Medium-Duty Cab Chassis
The 7-year service-life category represents the mid-level in terms of bus durability and size Vehicles in the category average roughly 25 to 35 feet in length (with most in the 30-foot range) have gross vehicle weights of approximately 16000 to 26000 pounds and have seating capacity for between 22 to 30 passengers Vehicles in the 7-year category account for just over two percent of the nationrsquos bus and van fleet
The majority of buses in this category are purpose built using either a front-engine cab chassis or a stripped chassis both of which are manufactured by medium- and heavy-duty truck manufacturers (eg International Freightliner and Workhorse) A ldquofinal stagerdquo transit vehicle manufacturer (eg Champion Eldorado National and Goshen Coach) then adds a body and other components to complete construction of the 7-year bus
Purpose-Built Front-Engine Cab
Medium-Duty Cab Chassis Bus Cab chassis is a term the trucking industry uses to describe a chassis equipped with a complete operator cab The chassis has a conventional layout with an engine and transmission at the front and the chassis is available in varying wheelbases and lengths The cab chassis and chassis are sent incomplete to final stage manufacturers who mount custom bodies to the chassis rails These chassis are popular and used for school buses delivery trucks transit Medium-Duty Stripped Chassis and shuttle buses and recreational vehicles
Medium-Duty Stripped Chassis Stripped chassis are similar to cab chassis except that the chassis is supplied without a sheet metal cab The chassis is provided by the final stage manufacturer (eg a transit vehicle manufacturer) with an operatorrsquos platform that includes the instrument cluster and
Federal Transit Administration 15
Useful Life of Transit Buses and Vans Chapter 2 Final Report FTA Service-Life Categories
switch gear control pedals operator heating and air conditioning and an operatorrsquos seat The final stage manufacturer then builds a single body to place on top of the chassis that houses both the passenger section and operator station The stripped chassis enables a bus manufacturer to design a body configuration closer to that of an urban transit bus The front engine layout however dictates the locations of the entrance door to be behind the front axle and operator station Typically the body is equipped with a single door Front-engine chassis are popular because they are produced in large numbers for the trucking industry and hence are relatively affordable However the front-engine configuration compromises ride quality because of its heavily forward-biased weight distribution
Vehicle Costs Table 2-5 presents typical purchase costs for medium-duty 7-year buses
Table 2-5 Purchase Costs Medium-Duty Buses (7-Year)
Model Types Cost
Bus built on cab chassis $75000 Bus built on stripped chassis $100000 Trolleybus built on stripped chassis $175000
7-Year Vehicle Market As with the 10-year vehicle type vehicles in the 7-year category account for only a very small proportion of the medium-duty truck market from which they are derived Of the roughly 50000 vehicles manufactured by the medium-duty truck market each year only about 300 are finished as 7-year transit buses (ie the body is a passenger compartment intended for transit or similar applications) The remaining vehicles of this general type are completed for a broad array of different uses including airport and hotel courtesy vehicles ambulances moving vans medium-size trucks and motor homes Here again for most 7-year transit buses the primary transit specific components are the body (including the interior) doors destination signs and fare collection equipment The remaining major components including the chassis engine transmission axles and brakes are once again derived from a broader ldquonon-transitrdquo market Table 2-6 presents a summary market analysis of the 10-year vehicles and their components
Manufacturers The number of manufacturers that have developed transit vehicles in this category is larger than the 10-year and 12-year vehicle types These include Cable Car Classics Champion Bus Eldorado National Glaval Bus Goshen Coach Molly Corporation Starcraft Automotive Corporation Startrans Supreme Corp and Trolley Enterprises
Federal Transit Administration 16
Useful Life of Transit Buses and Vans Chapter 2 Final Report FTA Service-Life Categories
Table 2-6 Market Analysis 7-Year Bus Vehicles and Components
Vehicle Components Primary Markets Annual Units Sold
10-Year Vehicle Share of Market
Share of Vehicle Purchase Cost
Total Vehicle 7-Year Bus Transit 300 90 or more Na Vehicle Components Body doors destination signs wheelchair lifts Transit 300 90 or more 30
Chassis engine transmission axels brakes suspension air compressors and power steering HVAC
Medium-Duty Truck Market 50000 Less than 1 70
Light-Duty Vehicles (5 Years 150000 Miles and 4 Years 100000 Miles)
The 4- and 5-year service-life categories Automotive Minivan with Second-Stage Access Ramp represent the smallest buses used in transit and are typically built on cutaway van chassis or modified vans approximately 16 to 28 feet in length as characterized by FTA The majority of buses in this category are modified minivans modified and unmodified full-size passenger vans and specially built buses using cutaway chassis produced by automobile manufacturers In contrast to the 12- 10- and 7-year categories (which are more clearly defined from one another) the 4- and 5-year vehicle categories have a significant amount of overlap with each other in terms of both the vehicle characteristics and the manufacturers that serve these categories For this reason these two categories are presented together in this section Together the two categories account for more than 20 percent of all transit buses and vans (the vast majority of which are 4-year vehicles) Automotive Minivan with Second-Stage
Raised Roof and RampModified Minivans (4-year vehicle) The automotive minivan is a popular choice in serving vanpools and paratransit operations for transit authorities These minivans are the same vehicles popular with large families because of their efficient use of space low floor and sliding doors For use in the transit industry minivans are often modified by second-stage manufacturers and equipped with wheelchair ramps and raised roofs Installing a wheelchair ramp requires major modifications to provide sufficient height clearance for the wheelchair and its occupant
Modifications typically involve cutting and removing the floor structure between the front and rear axles and welding a custom floor constructed from rectangular tubes that is lower by as
Federal Transit Administration 17
Useful Life of Transit Buses and Vans Chapter 2 Final Report FTA Service-Life Categories
much as six inches from the existing structure The modified floor necessitates rerouting of the exhaust system brake lines and electrical harnesses While lowering the floor is an extensive modification it enables the use of a ramp rather than a wheelchair lift Another approach to integrating a wheelchair ramp into a minivan is to raise the roof and add a raised top This modification increases the height of the opening enabling the wheelchair and its passenger to enter the van without restriction In performing this modification critical structure such as the point where the pillars and the roof structure come together are retained Other than these noted access enhancements these vans are used as they are sold to the general market with no further modifications
Full-Size Passenger Vans (4-year vehicle) With Full-Size Van Modifications the advent of the minivan full-size vans have become less popular with large families but remain popular in commercial applications and in serving vanpool and paratransit operations for transit authorities Since 1996 all full-size vans use body-on-frame construction meaning that the body is a separate component and physically mounts to the frame with bolts and rubber isolating bushings similar to the method used for trucks Modifications to full-size vans are limited to raised roofs and the installed wheelchair lifts These types of modifications are typically supported by the van manufacturer
Buses Built on Cutaway Van Chassis (4- or 5-year vehicle) Cutaway Van Chassis Cutaway chassis is a term the vehicle industry uses to describe a full-size van with the section of the body behind the B-pillar or the area aft of the front passenger seats removed These chassis are manufactured primarily by the domestic auto manufacturers including Ford GM and DaimlerChrysler Final-stage manufacturers take these cab chassis mount specialty-built bodies to the frame rails and integrate them with the remaining front cab section In doing so final-stage manufacturers provide custom-made bodies that better meet the requirements of their customers or targeted industry (eg transit) For transit bodies are constructed from a variety of materials including steel aluminum and fiberglass
Example Passenger Body Note here that the distinction between the 4- and 5-year vehicles is not well defined A general rule in making the distinction between them is that the 5-year vehicles generally feature higher capacity truck axles with dual rear wheels (versus single for the 4-year vehicle) higher capacity springs and other suspension components a somewhat heavier-duty frame and frequently a slightly wider body These differences support high passenger capacities and some additional durability as compared to the 4-year models
Federal Transit Administration 18
Useful Life of Transit Buses and Vans Chapter 2 Final Report FTA Service-Life Categories
Van and cutaway van chassis manufacturers provide detailed guidelines on approved modifications to their products Following these guidelines prevents the final-stage manufacturer from having to re-certify to federal emissions and safety standards
Vehicle Costs Table 2-7 presents typical purchase costs for light-duty 4- and 5-year buses
Table 2-7 Purchase Costs Light-Duty Buses (4-Year and 5-Year)
Model Types Cost
Modified Mini-Van (paratransit) $30000-40000 ndash mini-van platform $20000-30000 Full-Size Van (van pool) $25000-30000 Small Bus Built on Cutaway Van Chassis $50000-65000 ndash Cutaway van chassis $20000-30000
4-Year and 5-Year Vehicle Market More so than any of the other vehicle categories transit has very little influence on the design and manufacture of vehicles in these two categories For example of the 11 million minivans sold each year roughly 3000 are purchased and modified for transit uses (less than 03 percent of the total market) Similarly of the 370000 cutaway chassis sold annually roughly 2500 are purchased and modified for transit uses (a 07-percent market share)
Manufacturers Ford Motor Company General Motors and DaimlerChrysler are the three manufacturers building selling vans and supplying vans and cutaway van chassis to second-stage manufacturers for final assembly for the transit industry The manufacturers modifying these vehicles for transit uses are largely the same as that for the 7-year vehicle category These include Braun Corporation Champion Bus Eldorado National Girardin Corporation Goshen Coach Mid Bus National Coach Corp Starcraft Automotive Corporation Supreme Corp Turtle Top and Vision Point Mobility
Implications for the Current Service-Life Categories
In addition to providing the reader with some familiarity of the five current service-life categories the preceding review also supports some critical assessments of FTArsquos existing service-life policy and the broader issue of useful life in general These include the following questions bull Do the existing service-life categories ldquomake senserdquo bull Should FTA restrict the service-life categories in which vehicles are tested bull What leverage does the transit industry have in influencing vehicle useful life bull Do the service-life categories require periodic review
The following sections address each of these questions
Federal Transit Administration 19
Useful Life of Transit Buses and Vans Chapter 2 Final Report FTA Service-Life Categories
Do the existing service-life categories ldquomake senserdquo
A key objective of this study was to review and assess the appropriateness of the five existing service-life categoriesmdashnot just from the viewpoint of the useful-life values themselves (eg 12- 10- and 7-years) but also examining whether the groupings of vehicles in these categories ldquomake senserdquo Based on the review above it is clear that the five existing service-life categories do represent logical groupings of vehicles having broadly similar characteristics in terms of construction methods size weight passenger capacities cost and manufacturers (the following chapters address the actual useful-life similarities of vehicles in these five categories) Table 2-8 provides support for this view
Table 2-8 Comparison of Vehicle Types in FTArsquos Five Service-life categories
Category Typical Characteristics Minimum Life
Length ApproxGVW Seats Average Cost
(Whichever comes first)
Years Miles
Heavy-Duty Large Bus 35 to 48 ft and 60 ft artic
33000 to 40000 27 to 40 $325000 to
over $600000 12 500000
Heavy-Duty Small Bus 30 ft 26000 to 33000 26 to 35 $200000 to
$325000 10 350000
Medium-Duty and Purpose-Built Bus 30 ft 16000 to
26000 22 to 30 $75000 to $175000 7 200000
Light-Duty Mid-Sized Bus 20 to 30 ft 10000 to 16000 16 to 25 $50000 to
$65000 5 150000
Light-Duty Small Bus Cutaways and Modified Van 16 to 28 ft 6000 to
14000 8 to 22 $30000 to $40000 4 100000
As noted in the text above the key exceptions to this observation are the 4-year and 5-year vehicles built using cutaway chassis Here there is a significant degree of overlap between the 4- and 5-year vehicle categories in terms of construction type sizes vehicle weights costs and manufacturers It should also be noted that the useful life attributes of these two vehicle types were not found to be significantly different in the review of actual vehicle retirement ages presented in the next chapter However despite these similarities the review in this chapter and the analysis in succeeding chapters do not provide adequate grounds for combining these two into a single 4- or 5-year vehicle category
Should FTA restrict the service-life categories in which vehicles are tested
The preceding section suggests that FTA is well served by the five existing minimum service-life categories However this suggestion is subject to the important caveat that the bus testing program ldquoratesrdquo vehicles in the categories best suited to those vehiclersquos characteristics In recent years some manufacturers have successfully lobbied in a more durable category than would appear warranted by their vehiclersquos general characteristics (eg testing a bus with 10-year characteristics as a 12-year bus) This has resulted in service reliability issues and in some
Federal Transit Administration 20
Useful Life of Transit Buses and Vans Chapter 2 Final Report FTA Service-Life Categories
instances early retirement for the purchasing agencies when the tested vehicles were not found to have the expected durability
The next chapter further discusses the overall requirements of the bus testing program and its relationships to useful life The issue here is that while the category definitions appear sound based on this review of vehicle types the most significant limitation in the current five-category system may lie in permitting vehicles to be tested in a higher service-life category than the one that best suits the characteristics of their vehicle Given this consideration FTA may wish to more tightly control in which categories vehicles are eligible to test based on some combination of characteristics (eg gross vehicle weight seating capacity other) but with the potential for special waivers to test in a different category so as not to stifle innovation (Manufacturers should be required to provide reasonable justification as to why their vehicles should be tested in the higher durability category)
What leverage does the transit industry have in influencing vehicle useful life
The analysis above identified the origin markets for the chassis body and other components for each of the five vehicle categories A key objective of this analysis was to demonstrate that nearly half of the vehicle components for 12-year buses and a significant majority of the components for all other vehicle categories (including chassis engines and transmissions) are obtained from the heavy-truck and automotive markets Given that transit represents a very small proportion of these markets (generally less than one percent) the transit industry has little ability to influence the characteristics of these components including their useful life in a cost-effective manner
A key exception here is the structure of 12-year buses As discussed in Chapter 6 the useful life of a 12-year vehicle is determined primarily by the durability of its structure (as most major components are replaced or rebuilt over the life of the structure) To the extent that 12-year bus structures are designed and manufactured solely for transit use the transit industry has better ability to influence this componentrsquos design and durability characteristics (Although given the manufacturersrsquo small annual order sizes and local agenciesrsquo tight capital budgets funding such innovation is challenging in practice)
With most other components and nearly all other service-life categories this is not the case Hence for example the transit industry cannot significantly alter the useful life characteristics of minivans or buses built on cutaway chassis without incurring the cost of further customizing these mass-produced items to meet transit-specific needs In short for component types and vehicle types derived largely from mass-produced markets the industry is likely better served by adopting useful life expectations to the existing characteristics of these assets rather than attempting to further modify them to better suit transit
Do the service-life categories require periodic review
Finally the useful life and other characteristics of transit buses and vans do change over time with changes in technologies vehicle designs new propulsion technologies new materials etc Given this ongoing change the current five-category system may no longer effectively capture
Federal Transit Administration 21
Useful Life of Transit Buses and Vans Chapter 2 Final Report FTA Service-Life Categories
the useful life or other characteristics of the nationrsquos bus fleets (eg consider the possibility of more durable BRT vehicles with useful life characteristics closer to rail vehicles) Thus FTA should consider conducting periodic reviews of the service-life categories every 5 to 10 years
Federal Transit Administration 22
Useful Life of Transit Buses and Vans Chapter 3 Final Report Legislation and Procurement
CHAPTER 3 LEGISLATION AND PROCUREMENT
This chapter provides a review of legislative requirements other than the minimum service-life requirements themselves with emphasis on their potential useful-life implications This includes FTArsquos bus testing regulations and ADA Buy America and Clean Air Act requirements In addition the chapter considers the impacts of procurement methods and guidelines on useful life expectations Finally this chapter reviews prior FTA and industry studies on both the establishment and the consequences of FTArsquos existing minimum service-life policy
FTA Service-Life Circulars and Regulations
This section highlights the federal regulations that are relevant to the useful life of buses and vans (with the exception of the minimum life requirements themselves) While many of these regulations are found to have potential useful life implications the implications generally are considered minor relative to the issues of annual mileage new vehicle designs changing life-cycle economics and other drivers of useful life as considered elsewhere in this report
Buy America Regulation
Buy America requires that rolling stock (ie vans buses and rail cars) procured with federal funding must contain at a minimum 60-percent domestic content by cost and that final assembly takes place in the Unites States These requirements are designed to protect and ensure the longshyterm viability of the domestic bus and van market
This legislation is also suspected of having a negative impact on vehicle life expectancy Since bus manufacturers rely on the cost of major components (eg engine transmission and axles) to meet domestic content requirements the Buy America regulation in effect limits the amount of money a bus manufacturer can spend on the (foreign built) structure of the vehicle which tends to drive the vehiclersquos useful service life
For example North American Bus Industries (NABI) recently pulled the ldquoCompoBusrdquo from the US market This bus used an expensive and durable composite material for the vehiclersquos structure which performed extremely well at FTArsquos Altoona testing facility Unfortunately for NABI the higher cost of the structure prevented it from complying with the Buy America regulation and from staying price competitive in the US low-bid bus procurement market Manufacturing this composite structure in the Unites States was not considered an option given higher domestic production costs The resulting bus structure cost exceeded the comparable cost level of the standard steel structure cost making the CompoBus uncompetitive in a low-bid procurement environment
Bus Testing Regulation
The Bus Testing Regulation requires new bus and van models to be tested at FTArsquos Altoona Pennsylvania test facility before they can be purchased using federal funds The purpose of the
Federal Transit Administration 23
Useful Life of Transit Buses and Vans Chapter 3 Final Report Legislation and Procurement
testing is to provide vehicle performance information that grantees can use to help inform their purchase or lease decisions for new vehicles These tests do not assign pass or fail standards nor do they assign an overall vehicle performance grade Rather the testing process is only designed to report test results to the manufacturer and potential grantees The Altoona program consists of seven automotive tests including maintainability reliability safety performance structural integrity fuel economy and noise
Importantly the busrsquos performance on the structural integrity test is believed to correlate closely with the busrsquos structural performance in revenue-generating service This accelerated testing simulates up to 25 percent of the mileage accumulated by transit buses in revenue service Most bus manufacturers design their structures to minimize the failures that occur during testing Even the better manufacturers find themselves altering their designs based on testing results The impact of this testing on actual vehicle useful-life remains unclear It is certainly the case that manufacturers may beef up their structures to ensure that they pass the 25-percent accumulated mileage test On the other hand by designing their structures to minimize the specific types of failures that occur during testing manufacturers may not be fully addressing the long-term structural requirements to meet FTArsquos minimum life requirements
The Bus Testing Program may also have other useful life implications The tests performed by the program vary depending on the FTArsquos service-life categories with the tests becoming more stringent for vehicles with higher service-life minimums (eg testing is more stringent for a 12shyyear bus than for a 10-year bus and so on) Over time many manufacturers have lobbied to have their vehicles tested in a higher service-life category than might otherwise be expected given the characteristics of their vehicle (eg based on gross vehicle weight passenger capacity or length) Given the absence of a passfail or vehicle grading scale this allows a manufacturer to advertise that their vehicle has been tested as a ldquo12-yearrdquo bus when its design characteristics are really more similar to those of a typical 10-year vehicle While this vehicle may easily pass the 25-percent accumulated mileage test for a 12-year vehicle the structure may not withstand a full 12 years of hard revenue service In this case the Bus Testing Program may not impact useful life so much as potentially allow vehicles to be incorrectly classified
Americans with Disabilities Act (ADA)
The ADA requires that transit buses and vans are accessible to persons with disabilities Initially this requirement was fulfilled with lifts but more recently low-floor buses have become the preferred approach to fulfill the ADA requirements With the popularity of heavy-duty low-floor buses issues surrounding compliance with regulations such as maintaining wheelchair lifts are losing relevance on 12-year vehicles However buses in the lower service-life categories (eg 4- 5- 7- and 10-year) that are built on top of truck or school bus-based frame rail chasses continue to necessitate the use of wheelchair lifts This adds costs that have some effect on the economic measure of useful life A more important effect of this regulation is that low-floor buses may not have the same long-term structural integrity as more traditional bus designs This suspicion (voiced by some study interviewees) cannot be fully confirmed until more vehicles with this relatively new bus design approach and pass their useful life standards
Federal Transit Administration 24
Useful Life of Transit Buses and Vans Chapter 3 Final Report Legislation and Procurement
Environmental Protection Agency (EPA) California Air Research Board (CARB) and Clean Air Act
The EPA CARB and Clean Air Act Amendments affect the permissible emissions levels for buses and vans In general these regulations have little or no impact on the physical life expectancy of transit buses This is because emissions regulations only have implications for vehicle drive trains (ie engine and transmission) and these vehicle components generally have life expectancies much less than that of the vehicle structure (eg 250000 and 300000 miles for the engine and more than 5000000 for the structure) However to the extent that environmental regulations drive the costs of replacement engines and transmissions they can affect vehicle life-cycle economics (both nonrecurring capital costs and recurring operating and maintenance costs) and thus impact the ldquooptimalrdquo timing of vehicle replacement
Major changes to the emission regulations are occurring in calendar years 2007 and 2010 The 2007 emission standards will dictate the use of exhaust after-treatment technology such as diesel particulate filters (DPFs) Most of the 2007 diesel engines will also incorporate cooled exhaust gas recalculating (EGR) technology These technologies are available and impacts on service-life options are not expected
Procurement Methods and Guidelines
This section considers the impacts of procurement guidelines and different procurement methods on the life expectancy of transit buses and vans
Standard Bus Procurement Guidelines
In the mid-1970s FTA sponsored the development of standard bus procurement guidelines This document is commonly referred to as the ldquoWhite Bookrdquo (in reference to the color of its cover) Since then the American Public Transportation Association (APTA) has sponsored updates of the bus procurement guidelines and expanded them to cover new technologies such as low floors CNG and articulated buses The guidelines heavily influence the design and durability of heavy-duty transit buses The guidelines address all areas of the vehicle including component design performance materials corrosion protection structural integrity and warranties By establishing useful and well-followed industry standards this reference has indirectly helped to maintain bus and van useful life characteristics
A group of the larger transit agencies in the Northeast has developed a more extensive set of bus specifications to append to the APTA ldquoWhite Bookrdquo These specifications have been developed to procure buses that can operate more reliably in the more difficult duty cycle and operating environment of these urbanized areas The revised requirements are focused on more stringent structural integrity and corrosion prevention specifications These are the most important constraints to fulfilling the FTA minimum service-life policy in these operating environments and even extending these buses to as long as 15 years of service Examples include
bull The Washington Metropolitan Area Transit Authority (WMATA) uses these extended specifications to procure buses that can better fulfill the 15-year life objective established by its board policy
Federal Transit Administration 25
Useful Life of Transit Buses and Vans Chapter 3 Final Report Legislation and Procurement
bull New York City Transit (NYCT) the main initiator of the more extensive bus specifications was looking for a bus design that could achieve the 12-year service-life objective with reliable service in a slow-speed stopstart urban duty cycle in New York City
bull The Toronto Transit Commission (TTC) was part of this research and is now trying to extend its bus useful life to 18 years or longer to help address constraints on bus replacement funding
All three of these examples present different paths to the same prioritymdasha structurally stronger bus to provide a longer andor more durable service life in tough urban operating environments
Third-Party Contracting Requirements
The methods transit authorities use to procure buses have potential impacts on their useful life In particular use of the low-bid procurement method without establishing some critical pre-bid requirements can result in the purchase of a lower quality bus with a below-average life expectancy This is the result of fierce price competition (and cost reductions) to ensure a contract win Within a pre-bid environment the firm establishment of structural component requirements during the specifications stage is of particular importance to ensuring the minimum life requirements are attained All other bus components can be replaced as long as the main structure can continue service
Conclusions Impact of Regulations and Procurement Practices
In conclusion while many federal regulations and industry procurement practices are believed to have potential useful life implications these implications are generally considered minor relative to the issues of annual mileage new vehicle designs changing life-cycle economics and other drivers of useful life The key exception here is the low-bid procurement process which may yield vehicles with lower quality structures leading to reduced vehicle longevity To protect against this outcome agencies need to establish firm structural component requirements during the pre-bid stage to ensure the minimum life requirements are attained
Federal Transit Administration 26
Useful Life of Transit Buses and Vans Chapter 4 Final Report Average Retirement Ages
CHAPTER 4 AVERAGE RETIREMENT AGES
This chapter uses NTD data to identity the actual retirement ages for vehicles from each of the five existing bus and van service-life categories The analysis is then used to evaluate how closely these average retirement ages correspond to the FTA minimums for each category To a certain extent the observed difference between the observed distribution of actual retirement ages as compared to FTArsquos retirement minimums provides a measure of actual vehicle durability relative to the minimum retirement points However for many operators the difference between the FTA minimum and actual agency retirement age is also a reflection of agency funding limitations (ie some agencies would retire their vehicles sooner if sufficient funding were available)
Analysis of Actual Fleet Retirement Ages Using NTD Vehicle Data
All US transit operators receiving FTA Section 5307 Formula Funds are required to include a comprehensive listing of their transit bus and van fleet holdings as part of their annual NTD submissions These vehicle listings document the number of active vehicles age (date built) current year mileage life-to-date mileage make model fuel type length and passenger capacity of each sub-fleet operated by the reporting agencies (including vehicles operated directly by the agency as well as those operated by contract providers) Unlike the study survey data described in the next chapter (which only covers a small sample of the nationrsquos bus and van operators) NTD provides good quality empirical data on the actual retirement practices of virtually all US bus and van operators1
Conspicuously missing from this data (from the viewpoint of this study) is documentation of the service-life category to which each sub-fleet vehicle has been assigned (ie 12-year 10-year 7shyyear 5-year and 4-year) a limitation FTA may wish to address in future revisions to the NTD reporting requirements To a limited extent these useful life assignments can be inferred based on the vehicle size and carrying capacity data found in NTD In addition the make and model data recorded in NTD can also be compared to that found in FTArsquos bus testing records to help supply the proper assignments (although NTDrsquos make and model data are not always populated or use the same designations as the bus testing records) Both of these approaches have been used by this study to help document actual vehicle retirement practices for each minimum service-life category
Analysis of NTD Bus and Van Data
This study used NTD transit bus and van vehicle data to assess the extent to which agencies operate vehicles beyond FTArsquos minimum service-life requirements and the extent to which the minimum vehicle age acts as a constraint on the fleet retirement decisions of the nationrsquos transit
1 As of 2006 rural transit operators receiving FTA Section 5311 funds are also required to report on their bus and van vehicle holdings These data are not expected to be published until later in 2007 With the exceptions of Urban 5309 operators (who own more than 95 percent of the nationrsquos bus fleets) and Rural 5311 operators no other operator types are required to report to NTD
Federal Transit Administration 27
Useful Life of Transit Buses and Vans Chapter 4 Final Report Average Retirement Ages
operators This analysis provides the measure of average vehicle useful life identified in Table 1shy3 in Chapter 1
In conducting this analysis this study used the bus size classification employed by NTD prior to 2002 (at which time the pre-existing three-tiered bus size categorization based on seating capacity was consolidated into a single ldquoMotorbusrdquo category) This bus size classification provided a useful means to help segment bus vehicles into the five vehicle type categorizations as recognized by FTArsquos service-life policy In addition the vehicle model names manufacturer names and vehicle specifications as reported to NTD were thoroughly reviewed to ensure that all bus and van models were placed in the correct minimum service-life categories (using each vehicle modelrsquos Altoona bus test assignment) Vehicles that could not be definitively placed within one of these five categories were not included in this analysis The resulting data sample covers all years from 1995 through 2001 and included more than 500 transit operators
While NTD records the date built make and model of each agencyrsquos sub-fleets it does not record the actual retirement of these vehicles Therefore as a means of identifying when individual agency sub-fleets were retired the records for each sub-fleet were tracked from year to year (ie across multiple years of NTD submissions) This analysis then identified the point in time at which individual bus sub-fleets ldquodisappearedrdquo from the NTD record (ie the age at which sub-fleets were retired from service) These data were then aggregated across all operators and time periods to estimate the average actual retirement ages for each vehicle type Use of multiple years of NTD vehicle data was crucial to an accurate determination of these retirement ages However even with seven years of NTD data and over 500 different transit operators the sample sizes for the 10- 7- and 5-year bus categories remain relatively small Hence the analytic results for these bus types are less certain in comparison to the considerably more popular 4- and 12-year vehicle types
This analysis was used to identify the following for each vehicle category
bull Actual Retirement Ages Specifically the distribution of actual retirement ages and the average retirement age for each vehicle type (comparing two consecutive years of data to determine which vehicles were retired from one year to the next)
bull Percentage of Fleet Vehicles Exceeding the FTA Minimum and Later Age Values Given the problematic nature of comparing vehicle records across multiple years of NTD submissions the analysis also looked at the percent of active fleet that ndash Exceed the service-life minimum by one or more years ndash Exceed the service-life minimum by two or more years ndash Exceed the service-life minimum by three or more years and so onhellip
This analysis is very helpful in assessing the distribution of fleet vehicle exceeding the minimum retirement ages
bull Impact of the Minimum Service Requirement The impact that the minimum service requirement has on the actual distribution of retirement ages
Federal Transit Administration 28
Useful Life of Transit Buses and Vans Chapter 4 Final Report Average Retirement Ages
Analysis of 12-Year500000-Mile Vehicles
As noted earlier 12-year category vehicles account for more than three in four of the nationrsquos 90000 transit buses and vans
Figure 4-1 Retirement Age Distribution of 12-NTD data on vehicles in the 12shyyear500000-mile vehiclesyear500000-mile category show
that retirements peak at ages 14 through 17 and the average retirement age for vehicles in this category is 151 years (see Figure 4-1) Hence the vast majority of these buses are retired well beyond the 12-year and 500000shymile minimum For example more than three-quarters of retirements occur at age 14 or later In contrast only 6 percent of vehicles are retired at age 12 and only 7 percent at age 13 These results clearly indicate that the 12-year minimum itself is not a binding constraint for most transit operators since they operate buses well beyond this age
Figure 4-1 also suggests that some vehicles are retired prior to the 12-year minimum Many of these retirements consist of vehicles that have reached the 500000 minimum mileage prior to the 12-year minimum age (the chart shows the vehicle life-to-date mileage as of the year prior to vehicle retirement) However there are also a number of ldquofalserdquo retirements depicted in this chart that capture NTD data entry errors (or changes in reported vehicle names from one year to the next) and perhaps some vehicle trading between agencies Vehicle retirements prior to age nine were excluded from the calculation of average retirement age
While the analysis in Figure 4-1 is helpful in evaluating the distribution of retirement ages it has little to say about the impact of vehicle utilization on useful life In contrast Figure 4-2 presents the proportion of active 12-year buses that are older than 12 14 16 and 18 years respectively (on the horizontal axis) These proportions are further segmented by average annual sub-fleet mileages including groupings of vehicles with between 20000 and 30000 annual miles 30000 and 40000 annual miles and so on (with the 30000 to 40000 group further segmented between those agencies that do and do not perform comprehensive mid-life overhauls)2 As expected the proportion of vehicles exceeding each age group threshold declines as the age threshold increases Moreover while roughly one-third of all vehicles for operators with between 20000 and 30000 annual miles per vehicle remain in service after the 12-year minimum is passed a surprising 12 percent (roughly one in eight) of vehicles for operators with between 40000 and 60000 miles remains in service past age 12 (representing a range of between 480000 and 720000 life-to-date miles) Hence even the highest mileage operators some with vehicles well
2 Note that most US transit operators do not perform a comprehensive mid-life vehicle overall for their 12-year buses Moreover those agencies that do perform such overhauls have average annual sub-fleet mileages of between 30000 to 40000 miles
Minimum Replacement Life = 12
0
200
400
600
800
1000
1200
1400
1 2 3 4 5 6 7 8 9 10 11 12 13 14 15 16 17 18 19 20 21 22 23 24 25 Retirement Age
Num
ber o
f Bus
es
Mileage Unknown Mileage gt= 500000 Mileage lt 500000
Federal Transit Administration 29
Useful Life of Transit Buses and Vans Chapter 4 Final Report Average Retirement Ages
beyond the 500000-mile minimum still maintain their vehicles in service past the 12-year age minimum
Figure 4-2 Share of Active 12 Year Buses Exceeding Specific Age Levels
For Operators With Differing Annual Fleet Milage 40
Average Annual Miles per Fleet Vehicle 35
Shar
e of
Fle
et V
ehic
les
30
25
20
15
10
5
0
20000 to 30000
30000 to 40000 (Major Rehab)
30000 to 40000 (No Major Rehab)
40000 to 50000
50000 to 60000
Older Than 12 Years Older Than 14 Years Older Than 16 Years Older Than 18 Years
Age Group
While the proportion of fleet vehicles remaining in service declines for all annual mileage groups Figure 4-2 shows that the proportions in service remain fairly high past the 12- 14- and 16-year age thresholds for vehicles that do versus those agencies that do not perform a major mid-life overall These findings demonstrate the effectiveness (if not the cost effectiveness) of these rehabilitations in extending vehicle life
Finally Figure 4-3 repeats the analysis from Figure 4-2 but this time segmenting 12-year vehicles between the articulated (60-foot) standard 40-foot and 35-foot vehicle types3 This chart demonstrates that while the proportion of vehicles in service past 12 years tends to decrease with increasing vehicle length a significant proportion of the active vehicles for each of these vehicle types remain in service after 12 years (including one in four 35-foot vehicles one in five 40-foot vehicles and one in six articulated vehicles)
In summary this analysis suggests that the current 12-year requirement provides a reasonable retirement age minimum for large heavy-duty vehicle types This is because the majority of these vehicles are retired in the 6-year period following the service-life minimum with the average retirement age occurring roughly three years past the minimum (providing a cushion for the early retirement of poor reliability vehicles) Similarly the fact that most of the vehicle retirements for this group are concentrated in a 5- to 6-year period following the retirement minimum implies that the vehicles have roughly common useful characteristics providing some
3 Note As of 2005 NTD does not report many 30-foot buses with ages of 12 years or more
Federal Transit Administration 30
Useful Life of Transit Buses and Vans Chapter 4 Final Report Average Retirement Ages
validation to the current grouping of these vehicles within the same service-life category Finally regardless of annual vehicle mileage or vehicle length a significant share of the nationrsquos heavy-duty vehicles remains in service after the 12-year minimum and many with more than 14 years of service
Figure 4-3 Share of Active 12 Year Buses Exceeding Specific Age Levels
Articulated 40 Foot and 35 Foot Vehicles 30
25
Shar
e of
Fle
et V
ehic
les 20
15
10
5
0
Articulated
40 Foot
35 Foot
Older Than 12 Years Older Than 14 Years Older Than 16 Years Older Than 18 Years
Age Group
Analysis of 10-Year350000-Mile Vehicles
Figure 4-4 Retirement Age Distribution The number of 10-year vehicles of 10-year350000-Mile Vehiclesreported to NTD is far smaller than the
number of 12-year vehiclesmdashthese vehicles account for little more than one percent of the nationrsquos transit buses and vans (roughly 1000 active vehicles) Consequently the analysis of average retirement age for this category suffers from small sample issues (Figure 4-4) This data suggests an average retirement age of approximately 84 years which is obviously less than the minimum retirement age Hence the quality of the analysis for this vehicle category is clearly problematic (the study had
Minimum Replacement Life = 10
0
10
20
30
40
50
60
1 2 3 4 5 6 7 8 9 10 11 12 13 14 15 16 17 18
Retirement Age
Num
ber o
f Bus
es
Mileage Unknown Mileage gt= 350000 Mileage lt 350000
difficulty in effectively identifying this vehicle type based on the data reported to NTD) and requires a better data source to properly evaluate an actual average retirement ages
Federal Transit Administration 31
Useful Life of Transit Buses and Vans Chapter 4 Final Report Average Retirement Ages
Figure 4-5 Share of Active Vehicles Exceeding Specific Age Levels
For 4 5 7 and 10-Year Buses and Vans 35
4 Year
5 Year 30
Shar
e of
Fle
et V
ehic
les 25
20
15
10
5
7 Year
10 Year
0 Greater Than Min Greater Than Min Greater Than Min Greater Than Min Retirement Age Retirement Age + 1 Retirement Age + 2 Retirement Age + 3
Age Group
NTD could be used however to document the proportion of 10-year vehicles currently in service that exceed the 10-year minimum in age (see Figure 4-5) This analysis suggests that only 7 percent (or roughly one in 15) of these vehicles remains in service past the 10-year service-life minimum It is also clear from Figure 4-5 that the 10-year vehicle Figure 4-6 Retirement Age Distribution of type has the lowest proportion of active 7-year200000-mile Vehicles vehicles exceeding the service-life minimum of the five existing service-life categories This may suggest the need to reduce the minimum life requirement for this vehicle type by one or more years
Analysis of 7-Year200000-Mile Vehicles
As with the 10-year vehicle category the number of vehicles in the 7-year category is relatively small accounting for just over 2 percent of the nationrsquos active bus and van fleets (under 2000 vehicles) However the data quality for
Minimum Replacement Life = 7
0
10
20
30
40
50
60
70
80
1 2 3 4 5 6 7 8 9 10 11 12 13 14 15 16 17 Retirement Age
Num
ber o
f Bus
es
Mileage Unknown Mileage gt= 200000 Mileage lt 200000
this sample is believed to be superior to that for the 10-year category based on the review of the
Federal Transit Administration 32
Useful Life of Transit Buses and Vans Chapter 4 Final Report Average Retirement Ages
NTD records and points to an average retirement age of approximately 82 years with retirements spiking at 10 years (Figure 4-6) This figure suggests that seven years is an appropriate minimum retirement age for these vehicles as many operators are clearly able to keep vehicles past this age and are retiring their vehicles within roughly a three- to four-year period after the minimum requirement is satisfied Figure 4-5 also supports this finding with 12 percent (roughly one in eight) of the nationrsquos active ldquo7-yearrdquo vehicles having a current age of 8 years or more
Analysis of 5-Year150000-Mile Vehicles
Vehicles in the 5-year age category also Figure 4-7 Retirement Age Distribution of account for only a small proportion of the 5-year150000-mile Vehiclesnationrsquos bus and van fleet (about 14 percent of the total or about 1500 active vehicles) For this vehicle type the average retirement age was estimated to be 59 years (Figure 4-7) Most vehicles are maintained in operation up to and beyond the five-year minimum although the age of retirements peaks right at five years with a significant number at four years (presumably for vehicles that attain the required mileage before they are retired) As with the analysis for 10- and 7-year categories the 5-year vehicle analysis using NTD suffers from small
Minimum Replacement Life = 5
0
20
40
60
80
100
120
140
160
180
200
1 2 3 4 5 6 7 8 9 10
Retirement Age
Num
ber o
f Bus
es Mileage Unknown
Mileage gt= 150000 Mileage lt 150000
sample issues and this approach should be revisited at a future point in time using an improved NTD dataset
Analysis of 4-Year100000-Mile Figure 4-8 Retirement Age Distribution of Vehicles 4-year100000-mile vehicles
Four-year vehicles account for close to Minimum Replacement Life = 4 one-fifth of the nationrsquos total bus and van fleet or roughly 15000 active vehicles 1600
The NTD data indicate that most vehicles 1400
in the 4-year and 100000-mile category are retired between four and seven years of age The majority of vehicles are being retired past 4 years with the average retirement age around 56 years This N
umbe
r of B
uses
1200
1000
800
600
400
suggests that the four-year minimum 200
service age for this vehicle category is 0
appropriate for the characteristics of this vehicle type (Figure 4-8) The fact that most retirements occur after the
Mileage Unknown Mileage gt= 100000 Mileage lt 100000
1 2 3 4 5 6 7 8 9 10 11 12
Retirement Age
Federal Transit Administration 33
Useful Life of Transit Buses and Vans Chapter 4 Final Report Average Retirement Ages
minimum retirement age suggests that the current minimum is not binding for most operators (a desirable characteristic for a retirement minimum)
Similarly Figure 4-9 presents the proportion of active 4-year vehicles exceeding the 4-year minimum age and other age thresholds for operators with differing annual mileages per feel vehicle As with the similar chart presented above for the 12-year vehicle category even those operators with very high annual mileage per fleet vehicle have more than one in 10 vehicles exceeding the minimum age requirement On average roughly one in three active 4-year vehicles is age five or older
Figure 4-9 Share of Active 4 Year Vans Exceeding Specific Age Levels
For Operators With Differing Annual Fleet Milage 45
Shar
e of
Fle
et V
ehic
les
40
35
30
25
20
15
10
5
10000 to 20000
20000 to 30000
30000 to 40000
40000 to 50000
50000 to 60000
60000 to 70000
0 Greater Than Age 4 Greater Than Age 5 Greater Than Age 6 Greater Than Age 7
Age Group
Summary
Table 4-1 summarizes the results of the preceding analysis This analysis of NTD bus vehicle data demonstrates that the average retirement age for most bus and van types occurs after the minimum age requirement is met This finding supports continued use of the existing policy as it provides age minimums that are clearly less than (but within one to three years of) the average actual retirement age This analysis also suggests that vehicles retired prior to the current age minimum have satisfied the current mileage minimums Finally a significant number of vehicles are operated well beyond the minimum age requirement suggesting that well-maintained vehicles can be retained in service well past the expected vehicle useful life
The fact that most vehicles are retired one to three years after the minimum age requirement has been attained is not in and of itself proof that the ldquotruerdquo useful life values of these vehicle types is greater than the minimum life requirement In some and perhaps many cases the actual
Federal Transit Administration 34
Useful Life of Transit Buses and Vans Chapter 4 Final Report Average Retirement Ages
retirement age exceeds the minimum requirement due to funding constraints (ie many operators would replace their vehicles earlier given additional funding capacity) and not optimal or preferred retirement age considerations However that fact that so many vehicles are regularly operated well beyond the service-life minimum requirements clearly indicates that most vehicles types do have some useful service-life remaining well past the current FTA minimums
Table 4-1 Minimum Versus Average Retirement Age by Vehicle Category
Vehicle Category Minimum Retirement Age
Average Retirement Age (Years)
Share of Active Vehicles That Are One or more years past the retirement minimum
Three or more years past the retirement minimum
12-Year Bus 151 19 9 10-Year Bus 84 7 4 7-Year Bus 82 12 3
5-Year Bus Van 59 23 5 4-Year Van 56 29 10
Average retirement age estimates for this vehicle category suffer from small sample issues
The fact that vehicles in service past the service-life minimums continue to deliver valuable service is demonstrated in Figure 4-10 (12-year buses) and Figure 4-11 (4-year vans) Both of these charts present the average annual mileage by vehicle age for vehicles in low average and high-mileage fleets Both charts demonstrate that while annual service mileage tends to decline with vehicle age vehicles well past the minimum retirement age continue to see significant service miles Hence far from being delegated to support or special service vehicles vehicles exceeding the minimum retirement age continue to deliver a significant proportion of the nationrsquos transit services
Assessment of Existing Bus Type Categories Based on NTD Analysis
FTArsquos current bus category definitions were designed to be widely encompassing and include virtually any new rubber-tired vehicle intended for transit service and purchased with FTA funds In terms of actual vehicle characteristics (eg length passenger capacity GVW) the existing service-life categories show considerable variation in vehicle characteristics both between and within each category (eg 12-year buses range in length from 30 to 60 feet) The question then concerns how sensible these categories are based on the observed useful life experience of each category type
Based on the preceding analysis the 12-year vehicle type demonstrates the greatest consistency in vehicle retirement ages followed next by the 4-year vehicle category (refer to the relatively smooth shape of the retirement age distributions in Figures 4-1 and 4-8 above) These orderly distributions around a mean replacement age are indicative of commonality of their overall useful life characteristics In contrast the distribution of retirement ages for the 10- 7- and 5shyyear vehicle types is more disorganized (see Figures 4-4 4-6 and 4-7) While some of this disorganization is a function of the relatively small purchase quantities for these less popular vehicle categories it may also reflect greater dissimilarities in the designs of these vehicle types (given their smaller purchase quantities there is probably less industry impetus and opportunity
Federal Transit Administration 35
Useful Life of Transit Buses and Vans Chapter 4 Final Report Average Retirement Ages
for vehicle type standardization) Hence based on this analysis of NTD data the 12- and 4-year categories appear to ldquomake senserdquo while the logic of the 10- 7- and 5-year categories may benefit from further review
Figure 4-10 Annual Vehicle Mileage By Vehicle Age for Fleets With
Differing Mileage Levels 12-Year Vehicles
Ann
ual V
ehic
le M
ileag
e A
nnua
l Veh
icle
Mile
age
80000
70000
60000
50000
40000
30000
20000
10000
0
Low Mileage Fleets (lt20000 annual miles per vehicle)
Average Mileage Fleets (35000 annual miles per vehicle)
High Mileage Fleets (50000 annual miles per vehicle)
Very High Mileage Fleets (65000 annual miles per vehicle)
1 2 3 4 5 6 7 8 9 10 11 12 13 14 15 16 17 18 Vehicle Age (Years)
Figure 4-11 Annual Vehicle Mileage By Vehicle Age for Fleets With
Differing Mileage Levels 4-Year Vehicles 80000
70000
60000
50000
40000
30000
20000
10000
0
Low Mileage Fleets (lt20000 annual miles per vehicle)
Average Mileage Fleets (35000 annual miles per vehicle)
High Mileage Fleets (50000 annual miles per vehicle)
1 2 3 4 5 6 7 8 9 Vehicle Age (Years)
Federal Transit Administration 36
Useful Life of Transit Buses and Vans Chapter 5 Final Report Industry Outreach
CHAPTER 5 INDUSTRY OUTREACH
This chapter presents the results of the first set of industry outreach interviews for this study (the results of the second set of interviews are presented in the next chapter) This first outreach effort consisted of a set of detailed interviews with a sample of transit agencies vehicle manufacturers transit industry suppliers and private operators The purpose of the interviews was to evaluate how FTArsquos existing minimum service-life requirements impact agency and manufacturer decisions regarding vehicle design procurement and retirement The interviews were also designed to elicit industry responses to a range of potential changes to the existing service-life requirements and to obtain industry representativesrsquo suggestions on how the current requirements might best be modified Finally the first set of industry outreach interviews provided valuable vehicle life-cycle cost data including the cost and expected useful lives of all major vehicle components (data required to support the life-cycle cost analysis in Chapter 7) Upon completion of these initial interviews a second set of follow-up interviews was conducted to further investigate several issues identified in the original interviews This second set of interviews focused on bus engineering concerns and the results of these issues are considered in the next chapter
Transit Agency Participants
The research team developed an interview guide to assess the current experience of transit agencies with the FTA service-life requirements Questions covered areas such as vehicle replacement decisions alternatives to the current FTA policies maintenance practices and the impacts on service quality Responses to the transit agency interview guide were received from the nine transit agencies identified in Table 5-1
The responding agencies include a mix of operator types such as urban suburban and rural operators and represents operators with fleet sizes ranging from less than 40 to over 4000 vehicles Seven of the nine agencies have purchased some or all of their fleet vehicles using FTA funds and hence have fleet vehicles that are subject to FTArsquos minimum service-life requirements Three of the agencies that have purchased some but not all of their vehicles using federal funds (Montgomery County Ride-On Frederick County TransIT and Jefferson Transit) are subject to state-imposed minimum life requirements that are at least as stringent as FTArsquos) NYCT was included in the sample because of both its large size and its decision to use non-FTA funding sources as a means of having more control over vehicle testing Toronto was included because of the absence of an active federal bus funding program in Canada (or service-life requirements) and the consequent need to regularly maintain heavy duty vehicles up to and past age 18
Staff Interviewed
The staff interviewed for this study were all members of senior and mid-level management holding fleet management and fleet maintenance responsibilities These respondents included representatives of one or more of the following types of positions within their organizations bull Bus Operations Manager
Federal Transit Administration 37
Useful Life of Transit Buses and Vans Chapter 5 Final Report Industry Outreach
bull Chief Mechanical Officer bull General Manager (smaller agencies only) bull Superintendent of Engineering bull Equipment Maintenance Manager bull Director of Vehicle Maintenance
Table 5-1 Agencies Responding to Detailed Interview Guide
Operator Type Fleet Size (2005 NTD)
Vehicles Purchased Using FTA Funds
Los Angeles County Metropolitan Transportation Authority (Metro) Los Angeles CA
Major Urban 2815 Buses Most
Massachusetts Bay Transportation Authority (MBTA) Boston MA
Major Urban 1311 Buses 235 Vans
Yes
New York City Transit New York NY Major Urban 630 Articulated Buses 4024 Buses
655 Vans
No
Toronto Transit Commission (TTC) Toronto Canada
Major Urban 1508 Buses No
Washington Metropolitan Area Transit Authority (WMATA) Washington DC
Major Urban 1467 Buses 378 Vans
Yes
Capital Metro Austin TX Medium Urban 434 Buses 187 Vans
Yes
Ride-On - Montgomery County MD Suburban 341 Buses Some
TransIT Services of Frederick County Frederick MD
Small Urban Rural
55 Buses 8 Vans
Some
Jefferson Transit Jefferson County WA Rural 20 Buses 17 Vans
Most
It is important to note here that most staff interviewed had considerable familiarity with the useful life of heavy-duty transit buses (ie the 12- and 10-year FTA bus categories) but generally did not have a firsthand understanding of the 4- 5- and 7-year vehicle types This is in part due to the relative scarcity of the 5- and 7- year vehicle types and to the fact that these smaller vehicle types are typically operated and maintained by contract operators The exceptions here are Frederick County TransIT and Jefferson County Transit which both provided valuable insight on the smaller vehicle types
Agency Interview Guide Responses
This section presents the received responses to the study interview guide by the nine responding agencies Not all of the agencies responded to every question therefore the number of responding agencies is indicated for every question Appendix A provides a complete summary of all responses to the interview guide
Federal Transit Administration 38
Useful Life of Transit Buses and Vans Chapter 5 Final Report Industry Outreach
Agency Useful-Life Experience
This section focuses on the sample agenciesrsquo current vehicle retirement policies including their expected and scheduled replacement age by vehicle type and other criteria driving retirement such as duty cycle funding constraints or maintenance issues
Table 5-2 summarizes the planned and agency policy retirement ages for heavy-duty vehicles for each of the sample agencies Table 5-2 also shows the range of actual retirement ages for recently retired fleet vehicles and a brief listing of some primary drivers of these recent retirement decisions
Table 5-2 Planned and Recent Actual Retirement Ages Heavy Duty Vehicles
Agency PlannedPolicyRetirement Age
(Heavy-DutyVehicles)
State Retirement
Policy (if any) Actual Retirement
Experience Issues With Recently Retired
Vehicles
WMATA 15 years (imposed by WMATA Board)
No 15 to 16 years High maintenance costs reliability
TTC 18 years at 40000-45000 annual miles
No 18 Years High maintenance costs
Montgomery County
12 years Yes same as FTA for larger vehicles
Close to scheduled TMCs retired at 15 years Gilligs retired at 12 years
Any delays due to procurement requests or testingapproval TMCs retired due to high maintenance costs Gilligs retired because of no lift poor quality and high maintenance
New York City Transit
12 years Yes 7 years (for all bus types and sizes)
13-15 years had to retire Grummans before FTA minimum
Overage due to lack of funding availability Early retirement of Grummans due to heavy duty cycle
MBTA 12 years No Recent retirements at 16-19 years
Limited funding
Los Angeles Metro
13 years or 500000 miles
No Within 2 to 3 years of planned
Retirement beyond scheduled due to budget and legal consent degree obligations Early retirement due to fire andor beyond repair
Frederick 12 years Yes same as FTA for larger vehicles
Within 1-2 years of planned
Delay due to procurement requests
Federal Transit Administration 39
Useful Life of Transit Buses and Vans Chapter 5 Final Report Industry Outreach
Agency PlannedPolicyRetirement Age
(Heavy-DutyVehicles)
State Retirement
Policy (if any) Actual Retirement
Experience Issues With Recently Retired
Vehicles
Austin 12 years Not stated Within 1-2 years of planned TMC CNG buses recently retired 6 months early ndash FTA approved
Outdated CNG equipment
Jefferson Transit
15 years Yes similar to FTA
15 to over 20 years Physical condition duty-cycle maintenance requirements
There are two key observations to be noted in Table 5-2 First all nine of the agencies reported having a policy on the useful life of heavy-duty buses and four of these nine agencies have planned retirement ages that exceed the FTA minimum of 12 years (with Los Angeles Metro at 13 years WMATA and Jefferson Transit at 15 years and TTC at 18 years) Second the actual vehicle retirement for all nine agencies typically occurs between one to four years after the FTA minimum has been reached (but can occur as late as vehicle age 20) Moreover for seven of the nine agencies the actual retirement age also typically exceeds the (less stringent) planned or policy retirement age Given these observations it is clear that FTArsquos current minimum service-life requirement for heavy-duty buses is not actively constraining the agenciesrsquo retirement decisions (as retirements occur after the minimum retirement age has been reached) Limited capital funding was cited as the primary reason why the timing of actual vehicle retirements has exceeded the plannedpolicy retirement age by all but one of the responding agencies The lone agency Frederick stated that funding is not an issue although the state rarely provides as many vehicles andor funds as the agency has requested
When asked to report on the primary problems associated with recently retired vehicles the agencies cited issues relating to vehicle maintenance deteriorated physical condition and component and structural wear related to heavy duty-cycles FTArsquos minimum service life requirements were only cited by three of the nine agencies (Boston Los Angeles and Austin) and each of these agencies typically maintains its vehicles two or more years past the current FTA minimum New York ranked FTA requirements as the lowest priority as it does not purchase vehicles with federal funds
It is also important to note here that all but one of the agencies has had to retire vehicles prior to their planned retirement age and in one case prior to the FTA minimum (Austin retired a problem CNG vehicle prior to 12 years with FTA approval) The causes of earlier-than-planned retirements included problem vehicles with abnormally high maintenance costs a desire for equipment upgrades and damage beyond repair Boston is the only agency that did not report early retirement of its vehicles This is despite a tough operating environment and the frequent need to keep vehicles well beyond planned 12-year retirement age MBTA staff also stated their desire for an 8-year replacement cycle to eliminate the need for a mid-life overhaul and to maximize use of the latest bus industry technologies None of the agencies reported having to take advantage of FTArsquos ldquolike-kind exchangerdquo provision which permits early retirement of
Federal Transit Administration 40
Useful Life of Transit Buses and Vans Chapter 5 Final Report Industry Outreach
specific vehicles and assignment of the unamortized FTA interest in them to replacement vehicles
Mid-Life Overhaul Practices
Table 5-3 summarizes responses to the current practices for comprehensive ldquomid-liferdquo overhauls of vehicles This overhaul is applied to all of the agenciesrsquo larger (40-foot) heavy-duty cycle vehicles with the strategy of maintaining vehicles to meet or pass their scheduled retirement age Overhauls are typically timed with the expected life of major components (eg drive train rebuilds) while service on minor components is on an as-needed basis New York reported that mid-life overhauls are planned though not typically performed on all vehicles In this case the vehicles are rehabbed on an as-needed basis or on an individual campaign basis following a preventive maintenance strategy Washington DC states that it is looking into additional smaller overhauls at 3 9 and 12 years for other component replacements and upgrades On the other hand Toronto indicated that it is considering revising its current 6- and 12-year overhaul program to a program with a 9- to 10-year major overhaul and smaller component overhauls at other years due to the decline in provincial funding
Table 5-3 Mid-Life Overhaul Practices Heavy-Duty Vehicles
Mid-Life Overhaul
Number of Respondents Agencies
Approximate Cost perVehicle ($2006)
Additional Years
Expected Components
Yes 4 Washington Toronto New York
$110000 3 years Engine transmissions AC brakes and other major components
Yes 1 Boston $175000 6 years
Sometimes 1 Los Angeles Limited due to lack of manpower and funds
Not stated
No 4 Frederick Montgomery Jefferson
Not considered cost effective
It is important to note that the sample presented here is heavily biased in favor of those agencies that do perform mid-life overhauls (with four of the nine respondent agencies performing such overhauls on a regular basis) Based on a prior FTA condition assessment of 43 US transit bus fleets the practice of completing major mid-life overhauls is relatively rare with only seven of the assessed operators regularly performing a major rehabilitation (four of which are also included in the sample for this study) In contrast those agencies that do not perform a scheduled mid-life overhaul typically complete many of the same rehab activities over the life of the bus but on an as-needed basis (as opposed to a single coordinated effort) It is important to note that those agencies undertaking major mid-life rehab activities represent many of the largest in the nation and hence are of critical importance to this study
Federal Transit Administration 41
Useful Life of Transit Buses and Vans Chapter 5 Final Report Industry Outreach
Impact of FTArsquos Minimum Service-Life Requirements
Although some agencies have occasionally had to either retire a vehicle prior to the FTArsquos minimum age or lighten the duty of vehicles to reach these minimums the overall sense is that agencies are not directly impacted by the current FTA requirements This is because the agencies have a state or agency-imposed minimum retirement age which is more stringent than the FTA minimums andor are impacted by the availability of capital funding which forces them to keep vehicles longer than desired
When asked how the agency has been impacted by FTArsquos current minimum retirement ages all but one of the agencies reported no impact due to having other state or agency-imposed minimums (Washington Montgomery Frederick Jefferson) or not purchasing vehicles with FTA funds (Toronto and New York and for some vehicles Los Angeles Montgomery Frederick and Jefferson) Austin reported not being negatively impacted by FTA guidelines although it has had to retire some buses six months early due to outdated equipment which FTA approved Boston reported being impacted by FTA minimums due to the need for a mid-life overhaul to reach the current 12-year heavy-duty minimum
Although New York reported no current impact from FTArsquos policy it has had to retire a group of vehicles prior to the FTA minimum retirement age which consequently led to a change in its vehicle funding policy These vehicles were purchased with federal funds and thus the agency had to reimburse 80 percent of the purchase price which was taken from other projects This early retirement forced a delay in future bus procurements and was the reason behind the current policy to purchase all vehicles with state and local funds
In the absence of the FTA 12-year minimum retirement age Boston would consider retiring vehicles earlier at eight years to eliminate the need and large capital expense of a six-year midshylife overhaul and keep up with the latest vehicle technologies Toronto and Los Angeles reported interest in retiring vehicles earlier than their own self-imposed policies require although in practice this would not be possible due to funding constraints
Regarding the appropriateness of the current FTA policy four of the agencies (Montgomery Frederick Austin and Jefferson) indicated that the retirement minimums are suitable and did not recommend any adjustments or revisions It should be noted that these agencies did not report any major problems with vehicles and have retired vehicles close to their planned retirement age Specific recommendations to the current FTA minimum retirement ages were given by five of the nine agencies Table 5-4 summarizes these recommendations The main recommendations reported by various agencies are to include rehabilitation costs or extended warranties as reimbursable costs and to give the agency more options or discretion on retirement ages
Federal Transit Administration 42
Useful Life of Transit Buses and Vans Chapter 5 Final Report Industry Outreach
Table 5-4 Recommendations on Current FTA Policy
Agency Recommendations Washington ndash WMATA bull Include options for agencies
bull Include rehab costs and extended warranties as reimbursable costs (up to some of original costs)
Toronto bull Shorter service-life options are not feasible (due to heavy-duty and procurement methods)
bull Increase to 12 15 18 20 and 24 years at agencyrsquos option bull Include rehab costs in federal funding
New York bull Provide options bull Mileage looks high based on annual average bull Include rebuild costs as reimbursable expense (to improve maintenance) bull Include stipulations on FTA funds for rebuild bull Use bus testing for bus prequalification bull Consider shaker-table in bus testing bull Identify higher-level options in ldquoWhite Bookrdquo specs
Boston bull Reduce agemileage from 12 years500000 miles to 8 years300000 miles Los Angeles bull Age is acceptable however allow more discretion on vehicles not performing at
optimum level
Vehicle Service-Life Categories
To review the current FTA service-life categories the survey asked agencies for their opinion on alternative vehicle classes based on durability and procurement value These alternatives are summarized as follows
bull More durable (more expensive) vehicles for high-volume service with longer FTA minimum ages and mileage requirements
bull Less durable (less expensive) vehicles with shorter FTA minimum retirement ages and mileage requirements
bull Use of the agencyrsquos own engineering and economic analysis to determine best retirement age and rely on existing funding constraints to ensure a reasonable length of service life
bull Mix of durability and minimum agemileage at the procurement level (procurement options)
Appendix A presents each agencyrsquos specific responses to each of these options The following is a summary of those responses
More Durable Vehicles Six of the nine responding agencies stated they were not interested in a more durable vehicle (only two agencies expressed a clear interest in this possibility) This generally negative response reflected concerns relating to cost effectiveness weight rider comfort and the slower adoption of new technologies Some agencies state that a more durable vehicle type might be considered if its components were equally durable especially with the
Federal Transit Administration 43
Useful Life of Transit Buses and Vans Chapter 5 Final Report Industry Outreach
strain from heavy-duty cyclesmdashand thus would not increase maintenance needs or decrease quality
Less Durable Vehicles Interest in less durable less expensive vehicles was even lower with all nine agencies expressing significant concerns Some agencies stated these vehicles would not be appropriate for their duty cycles and others expressed concern over the relationship with the expected life of components a decrease in quality and the increase in procurement efforts An MBTA participant reiterated their interest in reducing the current FTA minimum for heavy-duty buses from 12 to 8 years
Agency Determined Retirement Age None of the agencies clearly objected to the alternative option of allowing agencies to use their own judgment in determining vehicle retirement ages (ie drop all minimum life requirements and rely on funding constraints to ensure vehicles are retained for reasonable service lives) Based on the current actual retirement ages of the nine responding agencies few agency vehicles would be retired before FTArsquos current minimums (as is already the case for funding reasons) One concern with this option as expressed by an NYCT participant is the capability of some agencies to accurately determine the best vehicle retirement age
Mix of Procurement Options As a starting point for discussion the interview participants were provided with the list of procurement options presented in Table 5-5 and were then asked to consider these options or provide similar ideas The concept of providing a mix of procurement options was generally negative with only three of the nine operators clearly interested in this possibility Concerns included skepticism over the ability of vehicle manufacturers to develop cost-effective vehicles with the longer life spans and the slower adoption of new technologies with long-lived vehicles Respondents were also concerned with the capacity of rehab vendors to meet increased demand and how rehab would be monitored and approved by FTA There were also concerns as to how the smaller medium and even some larger sized operators would implement this option given that the vast majority of these operators do not currently perform (or have the capacity to perform) mid-life rehabilitations In addition operators with low average annual vehicle mileages often do not have the need to perform a mid-life overhaul given their relatively low rate of vehicle deterioration
Allowing Earlier Retirement of the Existing Vehicle Types The agencies also provided their opinions on permitting earlier retirement of the existing FTA vehicle types Positive impacts stated include reductions in fuel and maintenance costs reductions in emissions (newer vehicles) increased customer satisfaction from newer technologies and reductions in average fleet age It was also suggested that few agencies would be able to take advantage of such a reduction in service-life requirements due to funding constraints
Extending Retirement of the Existing Vehicle Types On the other hand most of the agencies cited negative impacts from extending the current FTA minimum service life These negative impacts include a decrease in quality of service (higher rate of failures aesthetic of vehicles reliability) and an increase in maintenance costs (between 10- to 50-percent higher) However the agencies did not predict significant increase or decrease in emissions and energy efficiency
Federal Transit Administration 44
Useful Life of Transit Buses and Vans Chapter 5 Final Report Industry Outreach
Table 5-5 Potential Transit Bus and Van Procurement Options
Category Length Approx
GVW Seated
Passengers Minimum Life Rehabilitation
Years Miles Years Comp Heavy-Duty Articulated Bus
55 - 70 ft
38000 - 48 - 60 12 500000 6 30 15 650000 610 50 18 750000 6 10 15 75
Heavy-Duty Large Bus 35 - 48 ft
33000 - 40000
27 - 40 10 450000 5 20 12 500000 6 30 15 650000 610 50 18 750000 6 10 15 75
Heavy-Duty Small Bus 20 - 30 ft
26000 - 33000
20 - 35 8 300000 4 10 10 350000 5 20 12 400000 6 30
Medium-Duty and Purpose-Built Bus
20 - 30 ft
16000 - 26000
22 - 30 7 200000 5 20 9 250000 6 30
Light-Duty Mid-Sized Bus 20 - 35 ft
10000 - 16000
16 - 25 5 100000 4 10 7 150000 5 20
Light-Duty Small Bus Cutaways and Modified
16 - 28 ft
6000 - 14000
8 - 20 4 100000 na 0 6 125000 4 10
The rehabilitation columns define the potential years of the rehab to account for components that cannot achieve the extended life and the likely of components that will need to be replaced during those rehabilitations
Vehicle Components
The survey also asked respondent agencies about the life expectancy of individual bus and van components and how these expectancies affect the decision to retire andor rebuild vehicles Unfortunately only three of the agencies responding to the survey provided detailed information on the life expectancy and costs of the requested list of vehicle components (see Appendix E) Given the small agency response rate this data was appended with manufacturer responses and other industry data to help guide the life-cycle cost analysis in Chapter 7
Cyclical Nature of Component Replacements However the data reported by those few agencies do clearly show that the expected life of major body components such as the structure and panels aligns closely with each agencyrsquos scheduled vehicle retirement age Similarly engine and transmissions have an expected life of approximately half or one-third of this retirement age which is roughly in line with the responses on mid-life and other scheduled overhauls When viewed in total the timing and cost of major vehicle component replacements are such that component replacement costs peak in cycles throughout the life of the vehicle with minor cost peaks occurring roughly every three years and major peaks every six years4 (The six-year peak corresponds closely to the drive train rebuild see Figure 7-6 in Chapter 7) As discussed in more detail in Chapter 7 these cost cycles help to define the logical retirement points throughout a vehiclersquos life Specifically an operator will only perform a major life-extending rehabilitation if the operator intends to operate the vehicle for an additional three to six years Otherwise the decision to undertake the life-extending rehab is not cost effective
4 The actual timing depends on average fleet mileages maintenance practices duty-cycles and other factors
Federal Transit Administration 45
Useful Life of Transit Buses and Vans Chapter 5 Final Report Industry Outreach
Component Determinants of Vehicle Useful Life When asked to consider which components drive or define the useful life of the vehicle as a whole several of the agencies identified the condition of structural members including the impact of corrosion as the key driver of total vehicle useful life Two agencies (Frederick and Montgomery) stated that specific or individual components are not the direct drivers on vehicle retirement decisions but the general conditions of the vehicle (maintainability reliability of components etc) Boston reported its retirement decisions are age-based and not component-based and also stated that components are not expected to last beyond 12 years
Besides structural members other components listed as important to the vehicle replacement decision include the electrical system suspension exterior and floors Conversely among the components listed as having no impact on retirement decisions include doors brakes windows and wheel chair lifts
Other Issues Impacting Useful Life
Survey respondents were also asked to consider issues suspected of having indirect impact on the useful life of buses and vans such as procurement policies and other federal regulations
Procurement Processes The agencies were asked to report the procurement process typically used and any effects this process has on the expected useful life of vehicles Most of the agencies reported using a best value request-for-proposal process based on price and other factors These agencies feel this process is better than low-bid as higher quality products are expected or can be negotiated
The transit agencies interviewed universally agreed that using a low-bid procurement approach negatively affected the bus useful life To mitigate this some agencies have taken a much more rigorous approach to specifying bus structure life requiring finite element analysis of the structure shaker table tests or strain gage testing in the agencyrsquos operating environment However even those agencies that did not detail bus structure requirements acknowledged that it was important to state minimum bus life requirements in their specification Agencies reported that low-bid procurements resulted in buses that were lower in quality and designed to just fulfill the minimum bus specifications used in that procurement In the interviews one agency noted that manufacturers have only two options to reduce their pricemdashone is to use lower costlower quality components and the other is lower paidless skilled labor in vehicle assembly With all of the North American bus manufacturers struggling financially agencies feel that manufacturers have adopted both approaches
All agencies agreed that the bus structure is the key determinant of bus life The other bus components and systems can be replaced as long as the main structure can continue in service Negotiated procurements instead of low bid can benefit an agency and get additional features such as stainless steel that are advantageous in extending the life of the structure However those agencies that are using a best-value negotiated procurement approach are not doing so primarily to extend bus useful life The main motivations for a negotiated procurement are to get the best mix of desirable features and highest reliability for the agency to reduce operating costs
Federal Transit Administration 46
Useful Life of Transit Buses and Vans Chapter 5 Final Report Industry Outreach
Buy America Regulations Agencies were also asked if Buy America regulations have affected the quality andor useful service life of vehicles Two of the agencies who responded to this question stated that these requirements do in fact have an impact specifically on how the limited market impedes the implementation of the latest design features or technologies Boston reported that the reduction of minimum life of heavy-duty vehicles to eight years would assist in fulfilling this provision differently while Austin reported that useful life is dependent on the procurement process of the agency WMATA staff also noted that this regulation can limitaffect how a manufacturer develops structure (the largest component manufactured abroad and hence budget constrained to meet the Buy America requirements) Given that structure is typically the largest component ultimately defining the total useful life of the vehicle a less expensive (lower quality) structure will result in a lower life expectancy vehicle This regulation does not directly affect three of the agencies (Toronto Frederick and Montgomery) while responses were not received from the remaining agency (New York)
Bus Testing Program Another indirect factor that may potentially affect the purchasing and retiring of vehicles is the Bus Testing Program conducted at Altoona PA Five of the respondent agencies reported using the bus testing results in the procurement process to establish performance requirements This included reviewing the testing results in writing specifications evaluating bids and discussing purchases with vendors However these agencies recommended that the actual test results would provide the agencies with more information to evaluate vehicles in the procurement process One respondent was fairly critical of the value of the testing program itself suggesting that competition between vendors is a more effective (and less expensive) means of ensuring product quality and longevity
ldquoWhite Bookrdquo Procurement Guidelines The survey also asked respondents about the influence of the ldquoWhite Bookrdquo procurement guidelines on vehicle durability and expected service life Five of the agencies agreed that the procurement guidelines should be adapted to include alternative service-life options to reflect differences in vehicle designs One agency noted the importance of recognizing the difference in the strain applied to urban heavy duty-cycle vehicles as compared to other service environments (10-year urban vs 15-year suburban) while another agency reported using more arduous specifications in its procurement than those in the guidelines The agencies were also asked whether they would consider the use of design specifications for a 10shyyear and a 15-year vehicle if retirement at those ages were allowed by FTA policy Table 5-6 summarizes the responses to these questions
Table 5-6 illustrates a split in whether agencies would consider the change in design specifications As expected those agencies that would find the 10-year bus design specification a positive change (Boston and Los Angeles) also have expressed difficulty in maintaining vehicles past the current 12-year minimum and support the shortening of minimum service life These two agencies are characterized as heavy metropolitan areas and as such tend to be more severe on vehicles In contrast agencies that would consider the 15-year and not the 10-year design specifications (Washington and Toronto which also have tough urban operating environments) already have policies in place to retire vehicles at that age and beyond
Federal Transit Administration 47
Useful Life of Transit Buses and Vans Chapter 5 Final Report Industry Outreach
Table 5-6 Design Specifications of 10- and 15-year bus
Vehicle Category Number of Agencies Notes
Would you consider the use of design specifications for a 10-year bus Yes 2 If the bus components remained at 12-years
Do not necessarily agree funding should be tied with age No 2 Board policy does not allow lower minimum age
Maybe 1 No answer provided 4
Would you consider the use of design specifications for a 15-year bus Yes 3 Already used by agency
Work on specifications for longer-life bus needed No 3 Too long would not hold up in urban environment
No answer provided 3
The respondentsrsquo lack of experience with lighter-duty vehicles limited the review of whether agencies would consider different service-life options for medium and light-duty buses and vans Only two agencies responded to this survey question Austin stated that the market for light-duty vehicles is as it should be while Boston would like to see a change in service-life options for smaller vehicles Jefferson County one of the few respondents with a good understanding of light-duty vehicle characteristics already uses more stringent retirement ages for the smaller vehicle types including a target retirement age of 9 for ldquo7-yearrdquo vehicles a target retirement age of 8 for ldquo5-yearrdquo vehicles and a target retirement age of 5 for ldquo4-yearrdquo vehicles
Used Bus Disposal Under current regulations operators are required to compensate the federal government if a transit bus is retired and sold prior to meeting the FTA retirement minimum After that point in time the operator can retire the vehicle and sell it either as a used vehicle or for scrap value If the book value of a bus being sold is more than $5000 then FTA requires the agency to reimburse them (in practice the amount of the reimbursement is subtracted from the agencies next available FTA funding certification for the purchase of new buses)
Most agencies reported selling their used vehicles in bulk for their salvage value with the sale price based on the quantity and the condition of the vehicles sold and with scrap value ranging from roughly $3000 to just $50 per bus If the bus is in good shape upon retirement agency maintenance staff will typically scavenge the functioning parts and the bus will be left in poor condition to be sold for less than $500 In some cases the retired vehicles are sold either to other transit operators or to non-transit entities Agencies indicated that these sale prices are typically in the low thousands Regardless of how the vehicles are disposed the funds obtained from bus sales or salvage represent only a small fraction of the original purchase price and the funds received from these sales are generally deposited in the agencyrsquos general fund (and hence not used specifically for the purchase of new vehicles) Agencies reported that given the low dollar amounts involved sale and salvage value funds do not play any role in agenciesrsquo vehicle retirement decisions
Federal Transit Administration 48
Useful Life of Transit Buses and Vans Chapter 5 Final Report Industry Outreach
Other Procurement Issues
The last section of the survey asked respondents to reiterate any difficulties in the procurement of vehicles and in maintaining them past their minimum service life As previously reported most agencies have had to retire vehicles prior to their scheduled retirement age These vehicles were reported to have high maintenance costs and the most common way to deal with them was to lighten their duty cycle while two of the agencies reported retiring vehicles due to outdated components
Interest in a ldquoLemon Lawrdquo Respondents were asked whether they would be interested in the creation of ldquolemon lawrdquo providing agencies with an opportunity to retire problem vehicles prior to meeting the service-life minimums without financial penalty The question did not specify how that option would be structured or what standards would be applied in identifying a ldquolemonrdquo vehicle With the exception of New York who did not respond to this question all of the agencies agreed that a potential ldquoLemon Lawrdquo consideration within the FTA service-life policy is a very desirable option However the agencies expressed concern over the enforcement of such options the performance measures used to justify early retirement (the suggestion was that these should be established based on a vehiclersquos performance industry-wide not within a single agency) and the quality aspects from the manufacturersrsquo and suppliersrsquo side Table 5-7 summarizes the individual agenciesrsquo responses
Table 5-7 Responses to Exceptions to FTA Guidelines
Agency Consideration and Potential Constraints to ldquoLemon Lawrdquo
FTA Demonstration Program or Waiver Aspect
Washington Good though difficult to enforce Should be industry-wide finding of poor performance (not just agency with poor procurement) Agency to decide optimum retirement Ensure funding of remaining years is rolled
Good help industry move forward and introduce new technologies
Toronto Yes as corrosion and structural problems made it difficult to maintain vehicles to 12 years
Procurement of lease of prototypes of buses from different manufacturers to test before selection
Montgomery Good idea (No response given) Boston Yes with constraint that manufacturers ensure integrity
and durability (maintain quality with minimal maintenance) No interest in program
Los Angeles Yes if necessary Option should not be used if normal warranty period is complete andor operating cost is substantially different from rest of agencyrsquos fleet
Yes
Frederick Yes with conditions of applicability defined Suggest option only to limited and serious conditions
Not applicable as a smaller agency with limited staff and capabilities
Austin Yes if dealt with bus supplier Yes Jefferson Yes good idea Not helpful for smaller agencies
Federal Transit Administration 49
Useful Life of Transit Buses and Vans Chapter 5 Final Report Industry Outreach
Useful Life Waiver for New Technology Demonstration Programs Table 5-7 also summarizes the agenciesrsquo responses regarding interest in and proposals of an FTA demonstration program or waiver aspect to test alternatives concerning service-life requirements The objective would be for FTA to help encourage agencies to test and adopt new technology vehicles with the guarantee that the agency can retire test vehicles before the service-life minimums have been met if the technology proves problematic
Summary Agency Outreach
It is important to note that a survey of nine agencies is not a statistically representative sample however the surveyed agencies provide valuable insight on the effects of and recommendations to the current FTA service-life policy Due to the limited sample size the initial findings presented in this section can be strengthened with further investigation
Of the nine agencies responding to the survey seven have a policy on minimum retirement life not imposed by FTA This policy is imposed by either the state or the agency itself and is typically more stringent than the current FTA minimum of 12 years for heavy-duty larger buses Moreover all of the respondent agencies are retiring their vehicles one to five years past the FTA retirement minimums and one to three years past their own agency-imposed (typically more stringent) retirement minimums Retirements past the planned retirement age have mainly been driven by the limited availability of capital funding while early retirements have been caused by high maintenance costs or equipment update It is important to note that these high maintenance needs are primarily linked to agencies with heavy to severe duty cycles in large metropolitan areas such as Boston New York and Los Angeles
Agencies recognize the importance of maintenance and overhauls specifically mid-life in order to reach and keep vehicles past their scheduled retirement age However the timing and extent of these maintenance needs are also limited by the availability of capital funding Moreover major mid-life life-extending overhauls are only performed by a relatively small number of the nationrsquos largest transit operators
Given these observations it is clear that the current FTA retirement minimums are not constraining the retirement decisions of most transit operators Indeed the retirement ages for the majority of the vehicle retirements documented by this study would not be altered by modest changes (eg plusmn one year) to the current FTA minimums In fact several retirement decisions may not be impacted by the removal of the FTA minimums Key exceptions here are New York and Boston New York actually changed its policy to not purchase vehicles with federal funds after having to retire vehicles early and reimburse FTA part of the purchase price Boston would prefer an eight-year minimum retirement to maintain higher quality and avoid the major capital expense of a mid-life overhaul With these exceptions the greatest impact of the current retirement minimums occurs when operators find themselves with problem vehicles struggling to meet the FTA minimums In these instances agencies are forced to absorb the cost of maintaining the vehicles place these vehicles on reduced service requirements andor seek FTA approval for early retirement
Federal Transit Administration 50
Useful Life of Transit Buses and Vans Chapter 5 Final Report Industry Outreach
Despite these observations many of the agencies recommended several changes to the current FTA policy such as the potential inclusion of rehabilitation costs as a reimbursable cost and the provision of flexibilityoptions to agencies in vehicle retirement Agencies also expressed interest in the potential introduction of a ldquoLemon Lawrdquo allowing early retirement of problem vehicles without financial penalty Interest in lowering the minimum retirement age was only considered desirable by some agencies as long as the quality of the vehicle is unchanged (ie not reduced to a less durable less expensive vehicle) The benefits of this change would include the reduction in maintenance costs and the ability to implement and keep up with the latest vehicle technologies On the other hand extending the minimum retirement age was not considered desirable to agencies expressing concerns over the expected decrease in quality of service to passengers and the increase in maintenance costs
Vehicle Manufacturer Response
The research team developed an interview guide to assess the current experience of vehicle manufacturers with the FTA service-life requirements Questions covered areas such as the effects of FTA requirements and regulations customer (transit operator) useful life expectations and life expectancy of vehicle components While a total of nine different North American vehicle manufacturers were contacted for this study only three manufacturers provided responses and completed the interview guide Table 5-8 lists these three vehicle manufacturers and the title of the key contact for their organization
Table 5-8 List of Vehicle Manufacturer Respondents
Bus Manufacturer Contact Title Interview Guide
Response Received and Completed
Orion Director of Engineering Yes Optima Bus Corp Marketing and Sales Manager Yes Millenium Transit President Yes
This section synthesizes the responses received in a narrative or tabular format Not all of the vehicle manufacturers responded to every question A complete summary of all vehicle manufacturer responses to the interview guide is provided in Appendix B
General Vehicle Useful-Life Expectations
The three vehicle manufacturers that responded to the interview guide surveyed currently manufacture different models of heavy-duty vehicles with lengths of 30 to 40 feet and capacities ranging from 23 to 47 passengers Although one of the manufacturers did not provide a detailed listing of its vehicle offerings all of the manufacturers are in the heavy-duty 12-year minimum vehicle market Both of the manufacturers reporting details of their current models stated a minimum life of 12 years although Orion reports its vehicles have a life expectancy of 18 years while Optima reports its vehicles have a life expectancy of 12 years All three manufacturers market their vehicles based on FTA service-life categories
Federal Transit Administration 51
Useful Life of Transit Buses and Vans Chapter 5 Final Report Industry Outreach
The manufacturers sell vehicles that are not subject to the Bus Testing Regulation such as Orionrsquos Sprinter van which is typically purchased by smaller agencies with local money The other two manufacturers did not detail specific vehicle models but Millennium reported that buses sold in Canada (although the same bus) are not subject to these regulations and Optima has been granted a waiver for additional testing on one of its current models
With regard to expected service life characteristics requested by their customers Orion Bus Industries is the only manufacturer to report specific requirement characteristicsmdashCanadian operators look for 18-year service life vehicles with longer warranty periods and extensive resistance to corrosion for those operators in the Eastern part of Canada where vehicles are affected by the high-salt environment The other two manufacturers stated simply that agencies are looking for durable vehicles that will last and exceed the minimum retirement ages However these manufacturers report that the vehicle retirement age is largely dependent on each individual agencyrsquos annual mileage operating environment (severity) agency maintenance practices and quality of service standards
This opinion regarding the impacts of operating environment and duty cycle on the conditionlife of vehicles is also reflected in the manufacturersrsquo responses to recommending a mid-life overhaul Two of the manufacturers reported that they could not recommend specific mid-life overhauls because the vehiclersquos conditions and the need for a mid-life overhaul depend on each operatorrsquos specific annual mileage environmentduty-cycle and maintenance practices The other manufacturer reported neither recommending nor participating in fleet rehabilitations as these activities offer no benefits to their business Among the components listed as typically needing replacement are the engine transmissions suspensions and axle Optima is the only manufacturer that reported providing a recommended component maintenancereplacement schedule which is included in this report as Appendix D This manufacturer also reported that the approximate cost of replacement of those four components listed above is $18000 per vehicle
FTA Minimum Service-Life Requirements
All of the manufacturers stated that they are impacted by the FTArsquos current minimum retirement ages and that the 12-year minimum age is a benchmark in this heavy-duty market Design specifications are driven by the demand of vehicles that will last up to and beyond this 12shyyear500000-mile benchmark such as the use of stainless steel or aluminum instead of mild steel to meet the corrosion requirements (as reported by Millennium) The manufacturers also structure their marketing strategies around this minimum retirement age (ie clearly stating the minimum life standard their vehicles have been tested to meet) which they believe affects the overall demand for their vehicles the relationship with their customers and the sales of vehicle parts One manufacturer specifically stated that a change in the 12-year minimum would directly impact its demand for vehicles and its competing markets (heavy-duty vs light-duty market)
The argument that reductions in FTArsquos minimum life requirements would directly result in accelerated vehicle sales and hence a significantly deeper more sustainable bus market should be tempered by the understanding that very few operators retire their vehicles right at the service-life minimums due to funding limitations (as shown in Chapter 4 and the preceding section of
Federal Transit Administration 52
Useful Life of Transit Buses and Vans Chapter 5 Final Report Industry Outreach
this chapter) To be clear a reduction in the FTA minimums would yield some additional sales at the margin but the increases would not be significant as most operators do not retire their vehicles until two or more years after the 12-year minimum has been reached In contrast increases to the service-life minimums by two or more years would likely result in a perceptible decrease to annual vehicle sales (see Figure 4-1)
The primary vehicle component listed by all of the manufacturers as being impacted by the FTA requirements is the structure andor chassis which is expected to last the 12 years without major failures as it cannot be rebuilt or replaced Other components listed include the engine body axles suspension and transmission However these were not considered significant to the life of the structurechassis in determining vehicle useful life
As previously noted the only market of customers requesting vehicles with expected life values different than FTA minimums is the Canadian market where vehicles are specified for 18-year service life Orion also reported that some of its customers ask for a 15-year design life for the chassis or other components such as CNG tanks with a service life of 15 to 20 years
The survey also asked manufacturers about recommendations or changes to the current FTA minimum ages None of the manufacturers provided or recommended specific changes and in fact Millennium reiterated that any changes to these minimums would have negative impacts to its current market However two of the manufacturers (Orion and Optima) stated that the FTA minimum retirement ages are arbitrary because they are driven by the FTA Altoona Bus Testing classifications and manufacturers are able to choose the category under which to test their bus Thus there is the potential of buses claiming a false durability of 12 years Recommendations in this area would include revising regulations to a less arbitrary more objective intense testing and providing more detailed reports of the testing results (passfail failure types etc)
Vehicle Life Classification
Another section of the survey reviewed the current FTA classifications by vehicle type and intended duty cycle as they relate to the FTA minimum retirement ages and examined the potential of other alternatives With regard to the appropriateness of the current FTA classifications Orion stated that this classification conflicts with EPA definitions and that the categories are not definite enough (weight classes are too loose) Optima reiterated that the minimum retirement ages are based on the FTA Altoona Bus Testing requirements which make vehicle classification arbitrary as manufacturers choose the category to test under and vehicles receive this classification regardless of length of time to complete or how it holds up In Optimarsquos opinion manufacturers can test buses at the highest possible classification to give them a marketing edge in spite of the testing results on quality or durability In short the manufacturers generally had few concerns with the current categories but some manufacturers had significant concerns with how those categories are applied in practice particularly in relation to the bus testing program
Vehicle manufacturers were also asked their opinion on potential longer-life and shorter-life vehicle options Table 5-9 summarizes their responses Two of the three manufacturers (Millennium and Optima) do not believe a longer-life more durable vehicle can be manufactured
Federal Transit Administration 53
Useful Life of Transit Buses and Vans Chapter 5 Final Report Industry Outreach
because more durable components cannot be produced If such a vehicle were manufactured it would be heavier (increased GVW) more expensive and likely less economical (fuel efficiency purchase price) The option of a less durable less expensive vehicle also received differing interest although the main characteristic and challenge to manufacturing this type of vehicle would be the decrease in component quality (ie having to rely on lower-cost components) One manufacturer expressed concerns about the feasibility of manufacturing a safe shorter life vehicle option that was ldquocost-neutralrdquo (as compared to existing 12-year models) The concern being that the required reductions in structural cost to make the vehicle cost competitive may also lead to structural issues Optima stated that another vehicle option for FTA to consider is the new hybrid electric vehicle with diesel or gasoline engines powering electric motors
Table 5-9 Opinions on Alternative Set of Vehicle Life Spans
Vehicle Life Orion Millennium Optima Longer-life more durable vehicle
Interest characteristics of
vehicle
Yes ndash would have to be more resistant to corrosion and heavier
No ndash already build most durable buses out there
No ndash components would not survive longer life duty cycle also important in affecting retirement
Challenges Encouraging modular design Rebuild cycles would affect supply of parts
Supporting technologies for long periods of times
Cannot increase life expectancy of components Higher price vehicles
Shorter-life less durable vehicles Interest
characteristics of vehicle
Yes (cater to different needs of transit operators) ndash lighter weight lower-cost components
No ndash eliminating options low-cost components
Not part of market niche
Challenges Establishing market Getting cost reductions from components not structure
Not part of market niche
Vehicle Components
This section of the survey summarized the manufacturersrsquo experience with individual components and their relationship to the expected service life of vehicles All of the manufacturers agreed that the life expectancy and maintainability of vehicle components affect the service life and vehicle retirement decision with the main component being the structure andor chassis As previously reported manufacturers expect these components to endure without major failures in order for vehicles to reach the FTA minimum retirement ages Millennium also listed the engine transmission and axles as vehicle components that also impact service life On the other hand vehicle components not affecting service life included seats radios fare boxes glasswindows and other destination announcement systems However two of the manufacturers listed that the life expectancy of engines and brakes are driven by other markets besides the bus industry
Federal Transit Administration 54
Useful Life of Transit Buses and Vans Chapter 5 Final Report Industry Outreach
Table 5-10 summarizes the design challenges to vehicle components reported by the manufacturers in the construction of vehicles with increased life expectancy and of vehicles with decreased life expectancy
As expected the responses from this section are in line with those reported in previous sections of the survey on the overall life expectancy of vehicles The FTA minimums impact the design specifications of vehicles especially the structure andor chassis which is a primary driver of retirement decisions because it cannot be economically rebuilt or replaced The manufacturing of longer-life vehicles is limited by the life expectancy of components as they are currently not built to last longer or have replacementmaintenance schedules in line with the expected life of the vehicle Conversely manufacturing shorter-life vehicles would involve lower-cost lighter-duty components (such as those in the truck and automotive industry)
Table 5-10 Component Challenges to Vehicle Options
Component Challenges Orion Millennium Optima
Longer-life vehicle No challenges ndash 18-year bus already built
Warranty on engines and batteries remains unchanged
Obsolescence of parts Affected components chassis engines transmissions electronic systems HVAC systems and others
Shorter-life vehicle Take out cost with reduced service life smaller engines lighter axles
Lighter-duty components mild steel structure
Downgrade of design need for change in industry mindset for lower-life vehicles
Summary Vehicle Manufacturers
It is important to note that the three vehicle manufacturers surveyed are not a statistically representative sample however they do provide valuable insight on the effects of and recommendations to the current FTA policy on useful life of buses and vans Due to the limited sample size the findings presented in this section could be strengthened with further investigation
The general observation is that vehicle manufacturers have built their manufacturing practices and marketing strategies around the current FTA minimum retirement ages specifically the use of the 12-year minimum retirement age as a benchmark in the heavy-duty vehicle market
These manufacturers tend to design vehicles with a structurechassis expected to last and exceed the 12-year minimum without major failures and with the expectation that other components such as the engine transmission and axle follow good maintenance practices to reach these minimum retirement ages The manufacturers also recognize that the needs of operators differ (18-year minimum in Canada higher corrosion rate etc) and that the operating environment and duty cycle play an important role in the vehiclersquos retirement age
Federal Transit Administration 55
Useful Life of Transit Buses and Vans Chapter 5 Final Report Industry Outreach
Changes to the current FTA minimums and classifications are closely tied to the life expectancy of vehicle components Longer-life vehicles would require more durable components which at this time are not available by component manufacturers and shorter-life vehicles would entail the use of lower-cost perhaps lower-quality components with lower durability expectations
Private Operators Response
The research team developed an interview guide to assess the current experience of private operators with vehicle retirement ages and the FTA service-life guidelines Questions covered areas such as factors in retirement decisions experience with customers (transit operators) and life expectancy of vehicle components Table 5-11 provides the list of private operators and the title of the key staff contacted
Paul Revere Transportation Company provides charters sedan service and shuttle service throughout the New England area Notably it currently has contracts with
bull Massachusetts Port Authority (MassPORT) to operate the Boston Logan Airport shuttle buses which provide service through the airport (terminals satellite parking and public transportation stations)
bull Massachusetts Bay Transportation Authority (MBTA) as the private bus carrier of Route 712 and 713 in the Winthrop area
bull Medical Academic and Scientific Community Organization Inc providing shuttle service between several medical and scientific-research-related locations throughout the Boston area
Table 5-11 List of Private Operators Contacted and Respondents
Private Operator Contact Title Response to
Interview Guide Received and
Completed
Paul Revere Transportation Company LLC
Director of Operations Director of Maintenance Yes
Abersquos Transportation Operations Manager Yes Hertz Rent-a-Car Director Operationrsquos Technology Yes
Abersquos Transportation provides charter limousine and sedan service and shuttle buses throughout the Washington metropolitan area including airport transportation sightseeing tours and company contracts (service to and from office locations and Metro stations) Hertz provides several rental services including rental-car services at airport locations where it operates vans and shuttle buses between terminals and at locations on the outskirts of the airport
This section synthesizes the responses received in a narrative or tabular format Not all of the private operators responded to every question
Federal Transit Administration 56
Useful Life of Transit Buses and Vans Chapter 5 Final Report Industry Outreach
Fleet Characteristics
The three private operators surveyed operate a variety of vehicle types in terms of manufacturer size and capacity and duty cycle As a sample set Abersquos Transportation operates Ford cutaways Paul Revere operates a number of Neoplan CNGs Neoplan Diesels and MCII Diesels and Hertz operates different sizes of Gillig low-floor clean-burning diesels
All operators stated performing regular maintenance on their fleets Table 5-12 summarizes specific maintenance tasks provided by operators
Table 5-12 Regular Maintenance Schedule
Private Operator Maintenance Notes Paul Revere Transportation Company LLC
bull Heavy-duty buses are inspected after 12000 miles
bull Light-duty buses are inspected at 3000 to 4000 miles
bull Exterior and applied panels replaced as necessary (typically 4 to 5 years)
Maintain minimummaximum spare parts in stock based on experience
Abersquos Transportation bull Oil change every 3000 miles (manufacturerrsquos recommendation)
bull Front brake pads changed every 10000 rear brake pads changed every 17000 miles (longer for larger 7-year vehicles)
bull Front tires changed every 10000 miles rear tires changed every 12000 miles
bull Transmission fluids changed every 50000 miles
bull Ford 60 - Warranty of 36000 miles on transmission 100000 miles on engine
bull International 3500 ndash Warranty of 150000 miles on transmission and engine
bull Inspection on all vehicles when washed (1 to 2 timesweek)
Hertz Rent-a-Car Preventive maintenance performed regularly ndash initially according to manufacturerrsquos recommendation but now adjusted based on historical data
Comprehensive maintenance program Maintenance performed by in-house mechanics
Vehicle Retirement
The private operators were asked to provide information on the expected useful life of their vehicles as well as the drivers behind the retirement decision In general the operators stated an expected vehicle life based on the manufacturerrsquos recommendation with the options to extend it through transfers to lower-frequency routes or rehabilitation programs
Paul Revere Transportation provided the following detailed information on the scheduled life and rehabilitation of most of its fleet vehicles
bull 40-foot Neoplan CNG Scheduled life of 12 years with an engine rehabilitation at 75 years
bull Medium-duty Passenger Vans Scheduled life of 115000 miles (approximately four to five years)
Federal Transit Administration 57
Useful Life of Transit Buses and Vans Chapter 5 Final Report Industry Outreach
bull 35-foot RTS Diesel Scheduled life of five to six years
bull MCII Diesel Scheduled life of 700000 miles
Paul Revere Transportation also stated that structural rehabilitation andor bodywork on its 40shyfoot Neoplan CNGs would be performed if the vehicle has a minimum of 12 years and is planned for use after end of contract for other tasks This operator also stated inspection work is performed on its passenger vans every 5000 miles due to the large impact from weather
Abersquos Transportation noted that its smaller cutaways are typically operated on main routes for three years although it would transfer these vehicles to low-frequency routes after the three-year mark if their conditions remained acceptable The goal is to keep the larger cutaways for six years although the vehicles continue operations for an additional year if they remain in excellent conditions The vehicles do not undergo any overhauls and are traded in after retirement
Hertz indicated an expected useful life of 12 years based on the bus manufacturersrsquo design to the federal regulation Hertz also stated performing one overhaul on the transmission andor motor in order to extend the vehiclesrsquo life beyond design life The cost of this overhaul is approximately $20000 to $30000
All of the operators stated vehicle maintenance requirements as one of the main factors behind the decision to retire vehicles Table 5-13 summarizes the other factors in retiring vehicles reported by each operator
Table 5-13 Retirement Factors
Private Operator Key Factors in Retirement Paul Revere Transportation Company LLC
bull Age of vehicle ndash Contracts with customers are often aligned with expected useful life (contract length equal to full or half of the expected life)
bull Physical condition and quality of service bull Duty cycle bull Vehicle maintenance requirements
Abersquos Transportation bull Increase in required maintenance cost bull Physical condition of vehicles (customer comfort)
Hertz Rent-a-Car bull Perform a return-on-investment analysis of life-cycle costs to trade-off rising maintenance costs as vehicles get older and the purchasing options of new vehicles
bull Operating conditions (frequency)
Purchase Considerations
The private operators were also asked to provide information on their vehicle procurement process and vehicle purchasing decisions As expected none of the three operators surveyed use a low-bid process and they are mainly focused on customer service and reliability All of the operators stated they are willing to pay more for the best technology available for example luxury models better fuel economy computer-aided dispatch or vehicle location electronics
Federal Transit Administration 58
Useful Life of Transit Buses and Vans Chapter 5 Final Report Industry Outreach
Paul Revere Transportation is the only operator surveyed that provides service under a contract with a transit agency As such this operator stated that it considers meeting FTA specifications and testing requirements for reliability when purchasing vehicles Paul Revere also based the length of its contract with these agencies on the expected life of the vehicles For example one of its current contracts with MASCO is for six years for which it operates a 12-year bus In this case the firm will not include the purchase of new vehicles in its expected re-bid
Summary Private Operators
It is important to note that the three private operators surveyed are not a statistically representative sample Due to the limited sample size the initial findings presented in this section can be strengthened with further investigation
Overall the private operators are not affected by the FTA service-life policy and evaluate the useful life of a vehicle based on the manufacturerrsquos recommendation vehicle physical condition and maintenance requirements These private operators also apply regular maintenance practices on their vehicles with rehabilitations andor overhauls of the larger-size vehicles planned at near the vehiclersquos mid-life age
The main factor for retiring vehicles for these operators is the increased cost in required maintenance and the level of service to customer (comfort and reliability) None of the operators use a low-bid procurement process when purchasing vehicles They consider the higher costs to purchase vehicles with the latest technologies in fuel use emissions andor vehicle location to provide a higher level of customer service
Federal Transit Administration 59
Useful Life of Transit Buses and Vans Chapter 6 Final Report Engineering Analysis
CHAPTER 6 ENGINEERING ANALYSIS
This chapter provides further evaluation of bus useful life from a bus engineering perspective To a large extent this section represents a continuation of the agency outreach analysis from the previous chapter as it is primarily based on the results of both the original agency interviews (see Appendix A) as well as the findings from the second round of agency interviews this time more closely focused on vehicle engineering-related issues (see Appendix C) A key objective of this section is to highlight the fact that bus useful life is largely determined by the useful life of the vehicle structure The chapter is also intended to provide an assessment of how transit agencies expect differences in service environment and vehicle characteristics (such as new vehicle designs propulsion systems and advanced technologies) to impact vehicle useful life In most cases transit agency interview participants have reported that while they have reason to expect some new technologies and vehicle designs may have minor impacts on expected useful life most of these new designs and technologies have not been utilized for a sufficient period of time to observe any material impact on actual service life
Transit Agency Participants ndash Follow-Up Interviews
Much of the analysis in this section of the report is supported by both the results of the initial agency interviews (as considered in the previous chapter) as well as the results of follow-up interviews completed with a slightly different sample of transit operators (to ensure broader representation for the study) but also with some of the same operators as in the initial sample (because of their familiarity with topics of specific interest such as CNG buses) The specific sample of seven transit operators included in the follow-up interviews is presented in Table 6-1 In contrast to the initial interviews which included agency staff with differing backgrounds (eg bus operations directors general managers and vehicle engineering staff) the follow-up interviews were directed specifically towards agency bus engineering staff The intention of these follow-up interviews was to obtain a more in-depth perspective on engineering issues with useful life implications (eg the adoption of new technologies)
Table 6-1 Agencies Responding to Detailed Interview Guide Operator Type Fleet Size
(2005 NTD) Harris County Metro Houston TX Major Urban 1400 Buses 229 Vans LA MTA Los Angeles CA Major Urban 2815 Buses MUNI San Francisco CA Major Urban 894 Buses WMATA Washington DC Major Urban 1467 Buses 378 Vans CATS Charlotte NC Medium Urban 321 Buses 170 Vans Lane Transit District Medium Urban 147 Buses 92 Vans Golden Gate Transit San Francisco CA Suburban 321 Buses 46 Vans
Federal Transit Administration 60
Useful Life of Transit Buses and Vans Chapter 6 Final Report Engineering Analysis
Useful Life of Transit Vehicle Chassis and Components
This section reviews the useful life characteristics of bus and van structures and components Rather than single unified objects buses and vans represent assemblies of numerous components Hence the useful life properties of the vehicle as a whole are likewise determined by the components from which the vehicle is constructed This last statement is true from two differing perspectives First the life-cycle cost characteristics of transit vehicles are determined by the life-cycle costs of the components from which the vehicle is constructed As shown in the next chapter the overlap of these componentsrsquo life cycles (some of which last the full life of the vehicle and others which are replaced one or more times over the life of the vehicle) can be used to determine the financially optimal point of retirement Second from an engineering perspective vehicle useful life is ultimately determined by those components with the longest overall life and primarily the chassis and structure to which all other components are attached
The following sub-sections consider the useful life characteristics of the primary components of bus and van types within each of the five FTA service-life categories
StructureChassis
Four- and Five-Year Vehicles Small buses are built on van and cutaway van chassis mass-produced by light-duty automotive manufacturers The chassis are made from two C-channel frame rails attached by a series of steel cross-members The chassis supports all major components including the suspension axle brakes wheels tires engine transmission fuel system and electrical system Van bodies and cabs are mounted to the frame rails with bolts and rubber isolators The vanchassis are designed to last the full service life of the vehicle (ie 4 or 5 years) and are not overhauled The cost of the vanchassis ranges between $20000 and $30000
Seven-Year Vehicles Vehicles within the 7-year service-life category include buses and trolleybus built on cab and stripped chassis The chassis are mass-produced by heavy truck manufacturers The chassis are made from two C-channel frame rails attached by a series of steel cross-members The chassis supports all major components including the suspension axle brakes wheels tires engine transmission fuel system and electrical system Passenger bodies and cabs are mounted to the frame rails with bolts and rubber isolators The chassis are designed to last the full 7-year service life and are not overhauled The cost of the vanchassis ranges between $30000 and $40000
Ten- and Twelve-Year Buses Heavy-duty small and large buses are built on custom designed or stripped chassis The chassis designs include integral structure chassis unit body monocoque or semi-monocoque chassis and some body-on-frame construction types depending on the manufacturer The chassis are made of mild or stainless steel and aluminum alloy from welded tube sections andor stamped structural panels The chassis supports all major components including the suspension axle brakes wheels
Federal Transit Administration 61
Useful Life of Transit Buses and Vans Chapter 6 Final Report Engineering Analysis
and tires engine and transmission fuel system HVAC and electrical system The chassis of a body-on-frame design (10-year buses) are not overhauled but may be repaired during the life of the vehicle The custom designed chassis are designed to last the full 12-year service life and are overhauledrepaired as necessary The cost of a typical midlife overhaul of the heavy-duty custom chassis ranges from $7000 to $14000
Table 6-2 StructureChassis Characteristics
Component 4- and 5-Year Vans and Buses 7-Year Bus 10-Year Bus 12-Year Bus
Structure Chassis
Type Van and van cutaway
Cab and stripped chassis
Body on frame construction
Integrated structure chassis unit body monocoque or
semi-monocoque chassis
Useful Life At least 4 to 5 years At least 7 years or 200000 miles
At least 10 years or 350000 miles
At least 12 years or 500000 miles
Rehabilitated No No No Yes Many agencies do not perform a scheduled rehab but will repair as needed
Body
Four- Five- and Seven-Year Vehicles The 4- and 5-year small bus bodies are mounted to cutaway van chassis and designed and built by a second-stage manufacturer The 7-year medium-duty bodies are mounted to a cab and stripped chassis and are also designed and built by a second-stage manufacturer A second-stage manufacturer is a manufacturer that receives an incomplete rolling chassis or van and adds necessary components that complete the vehicle and ready it for its intended market The bodies built for small and medium-duty buses are designed specifically for the transit and shuttle bus markets and feature transit style windows destination sign wheelchair lift and a separate passenger compartment air conditioning system The bodies are constructed from steel tubes and use either fiberglass or metal for the exterior skin The 4- and 5-year small bus bodies are attached to the cutaway van chassis and integrated with the driverrsquos cab The 7-year medium duty bodies are attached to the cab and stripped chassis and integrated with the operatorrsquos cab The cab houses the dashboard driver interfaces and driverrsquos seats The bodies for each of these vehicle categories are designed to last the full service life of the vehicle (ie 4 5 and 7 years respectively)
Ten- and Twelve Year Vehicles The bodies of 10-year heavy-duty small transit buses are built by two methodsmdasheither as an integral part of the chassis structure or as a separate body mounted on a chassis The bodies of heavy-duty 12-year transit buses are an integral part of the chassis structure The bodies of both vehicle categories are constructed from steel tubes or panels and use either fiberglass or metal for its exterior skin which may or may not be a stressed structural element of the design (ie add structural support to the vehicle) As the body of the heavy-duty buses is typically an integral part of the chassis it is designed to last the full service life of the vehicle with repairs and overhauls as necessary The cost of a typical midlife overhaul of the body is $14000
Federal Transit Administration 62
Useful Life of Transit Buses and Vans Chapter 6 Final Report Engineering Analysis
Table 6-3 Body Characteristics
Component 4- and 5-Year Vans and Buses 7-Year Bus 10-Year Bus 12-Year Bus
Body
Type Mounted to cutaway van chassis
Attached to the cab and stripped chassis
Either integrated with chassis or separate and
bolted to the chassis Integral part of the
chassis
Useful Life At least 4 to 5 years At least 7 years 200000 miles
At least 10 years 350000 miles
At least 12 years 500000 miles
Rehabilitated No As needed Yes Yes Many agencies do not perform a scheduled rehab but will repair as needed
Interior
Four- Five- and Seven-Year Vehicles The interior of 4- and 5-year small bus bodies and 7-year medium-duty bus bodies use plywood for the floors covered with a rubber flooring material Interior walls and headliner are covered with lightweight paneling which is finished off with vinyl or carpeting Small and medium-duty buses use fabric-covered seats that mount to the floor structure Transit authorities typically do not refurbish the interior of small or medium-duty buses but replace worn components on an as-needed basis
Ten- and Twelve-Year Vehicles The interiors of 10- and 12-year heavy-duty transit buses use plywood for the floors covered with a rubber flooring material Interior walls and headliner are covered with lightweight paneling which is finished with vinyl or carpeting Heavy-duty transit buses use fabric-covered solid plastic or stainless steel seats that mount to the sidewalls andor floor structure Transit authorities typically do not refurbish the interior of 10-year heavy-duty buses but replace worn components on an as-needed basis For 12-year vehicles operators typically spend roughly $13000 over the life of the vehicle on interior replacements (either as a comprehensive overhaul or on an as-needed basis)
Table 6-4 Interior Characteristics
Component 4- and 5-Year Vans and Buses 7-Year Bus 10-Year Bus 12-Year Bus
Interior
Type Plywood flooring w
carpeting light weight vinyl paneling
fabric seats
Plywood flooring w rubber covering light weight vinyl paneling
fabric seats
Plywood flooring w rubber covering light weight vinyl paneling fabric or solid plastic
seats
Plywood flooring w rubber covering light weight vinyl paneling fabric or solid plastic
seats Useful Life At least 4 to 5 years At least 7 years 7 to 10 years 7 to 10 years Rehabilitated As needed As needed As needed Yes
Many agencies do not perform a scheduled rehab but will repair as needed
Federal Transit Administration 63
Useful Life of Transit Buses and Vans Chapter 6 Final Report Engineering Analysis
Interior Climate Control
Typical heavy-duty 10- and 12-year vehicles and many 7-year vehicles have heating ventilation and air conditioning (HVAC) units that are mounted on the rear of the bus or the roof The units range in size from 80000 to 115000 btu HVAC system are typically repaired or replaced as needed during the life of the 10-year vehicles HVAC system are typically overhauled during midlife rehabilitations of 12-year heavy-duty transit buses while systems for 7- and 10-year vehicles typically last the service life of the vehicle The cost for overhauling the HVAC units including interior vents and panels is approximately $10000 In contrast most 4- and many 5shyyear vehicles have heating and cooling systems that are integrated with the body (as in private vehicles) and last the full service life of the vehicle
Table 6-5 Climate Control Characteristics
Component 4- and 5-Year Vans and Buses 7-Year Bus 10-Year Bus 12-Year Bus
Interior Type Body integrated Roof Mounted Roof Mounted Roof Mounted Useful Life Life of Vehicle Life of Vehicle 6 to 7 years 6 to 7 years Rehabilitated No No Sometimes Yes
Many agencies do not perform a scheduled rehab but will repair as needed
Electrical Systems
Many heavy-duty 10- and 12-year transit vehicle manufacturers use Programmable Logic Control (PLC) technologies which allow for multiplexing Multiplexing systems use a single wire databus for communication among major components in a bus The use of a single wire reduces the number of dedicated wires and relays and therefore reduces the overall weight and complexity of the vehiclersquos electrical system and wiring harnesses Heavy-duty transit vehicle electrical systems typically offer extensive diagnostic capability The use of the PLC provides for easier diagnosis of sub-systems using software on laptop PCs The electrical system is repaired as necessary over the life of a 10-year vehicle In contrast electrical systems for 12-year vehicles are frequently overhauled at midlife Typically a midlife overhaul of the electrical system costs $4000 on a 12-year vehicle In contrast most 4- 5- and 7-year vehicles have wiring harness electrical systems (as found in private vehicles) and last the full service life of the vehicle
Table 6-6 Electrical System Characteristics
Component 4- and 5-Year Vans and Buses 7-Year Bus 10-Year Bus 12-Year Bus
Electrical System Type Wiring harness Wiring harness Multiplexing system Multiplexing system Useful Life Life of Vehicle Life of Vehicle Life of Vehicle Life of Vehicle Rehabilitated As needed As needed As needed Yes
Many agencies do not perform a scheduled rehab but will repair as needed
Federal Transit Administration 64
Useful Life of Transit Buses and Vans Chapter 6 Final Report Engineering Analysis
Propulsion System
Four- and Five-Year Vehicles There are two types of internal combustion engines for full-size vans and cutaway van chassismdashspark ignition (gasoline) and compression ignition (diesel) The gasoline engines are designed and manufactured by the van and chassis manufacturer The engines typically have 6 8 or 10 cylinders ranging in displacement from 46 liters to 80 liters The engines are similar to those offered in full-size pickup trucks and sport utility vehicles (SUVs) Gasoline engines in this operating environment have a service life of 125000 to 175000 miles Diesel engines are options on these vehicles at a $4000 premium The diesel engines provide superior durability and fuel economy and with a service life of 250000 to 300000 miles typically outlast the vehicle
The transmissions are designed and built in-house by the vanchassis manufacturer The transmissions in operation today have both four and five speeds which includes overdrive Transmissions are sized to accommodate the input torque of the engine Transmission can be expected to last 75000 to 100000 miles in transit service The transmissions are similar to those used in full-size pickup trucks and SUVs
In this service-life category performing a mid-life rehabilitation on the bus is uncommon However engines and transmissions are overhauled on an as-needed basis Cost for overhauling an engine and transmission is $4000 and $2000 respectively
Seven-Year Vehicles Medium-duty buses are powered solely by diesel engines The engines can be designed and built by the chassis manufacturer or purchased from a dedicated diesel engine manufacturer such as Cummins or Caterpillar The engines typically have 6 cylinders and 60 to 70 liters of displacement and the cylinders are arranged in an inline configuration Inline configuration is naturally balanced and provides minimal vibration Diesel engines in this class typically last the busrsquos life with a service life of 200000 to 300000 miles For medium-duty buses Allison transmission is the dominate transmission provider The chassis volumes are not sufficient to warrant chassis manufacturers to design their own transmission Heavy-duty transmission vendors from Europe have yet to challenge Allison in this bus service-life category In the category performing a mid-life rehabilitation on the bus is uncommon However engines and transmissions are overhauled on an as-needed basis
Ten-Year Vehicles Nearly all of the internal combustion engines used in heavy-duty small transit buses are compression ignition (diesel) although there are some CNG and diesel hybrid powertrains in service The engines typically have four six or occasionally eight cylinders ranging in displacement from 60 liters to 80 liters in capacity The engines are similar to those offered in class 7 tractors and straight trucks and heavy duty pick-up trucks Diesel engines in this operating environment have a service life of approximately 200000 to 300000 miles The diesel engines are supplied to the chassis manufacturer by a diesel engine manufacturer according to the customerrsquos specifications The major diesel engine suppliers to the heavy-duty small transit industry include Cummins and International CNG versions can increase the cost of a transit bus by $50000 Diesel engines can last the entire service life of the vehicles or may be replaced during the service life (depending on the service characteristics of the operator)
Federal Transit Administration 65
Useful Life of Transit Buses and Vans Chapter 6 Final Report Engineering Analysis
The major supplier of heavy-duty small transit bus transmissions is Allison The transmissions in operation today have both four and five speeds Transmissions are sized to accommodate the input torque of the engine Transmission can be expected to last to 150000 miles in transit service and hence will likely require an overhaul during the life of the vehicle
Table 6-7 Propulsion System Characteristics
Component 4- and 5-Year Vans and Buses 7-Year Bus 10-Year Bus 12-Year Bus Propulsion System Engine
Type Gasoline and diesel engines Diesel engines Diesel with some CNG and hybrid
Diesel with some CNG and hybrid
Useful Life Gas 125000 to 175000 miles Diesel200000 to 300000 miles
200000 to 300000 miles
200000 to 300000 miles
200000 to 300000 miles
Rehabilitated Rare As needed Yes Yes Propulsion System Transmission Type Automatic Manual Automatic Automatic Automatic
Useful Life 75000 to 100000 miles
100000 to 150000 miles 150000 miles 150000 miles
Rehabilitated As needed As needed Yes Yes Many agencies do not perform a scheduled rehab but will repair as needed
Twelve-Year Vehicles Nearly all of the internal combustion engines used in heavy-duty transit buses are compression ignition (diesel) although there are CNG and diesel hybrid powertrains in service The engines have four six or occasionally eight cylinders ranging in displacement from 80 liters to 140 liters The engines are similar to those offered in class 8 tractors and straight trucks The diesel engines are supplied to the chassis manufacturer by a diesel engine manufacturer according to the customerrsquos specifications CNG versions can increase the cost of a transit bus by $60000 and hybrid powertrains can add $150000 to the price of the vehicle Diesel engines have a service life of 250000 to 300000 miles and are typically overhauled or replaced on the vehicle
The transmissions are purchased by the chassis manufacturer according to the customerrsquos specifications The transmissions in operation today have both four and five speeds Transmissions are sized to accommodate the input torque of the engine Transmissions can be expected to last to 150000 miles in transit service
In this service-life category performing a mid-life rehabilitation on the bus is common and typically includes the powertrain However engines and transmissions are also overhauled on an as-needed basis Cost for overhauling an engine and transmission is approximately $35000 including engine compartment accessories such as mounts and emission control devices
Federal Transit Administration 66
Useful Life of Transit Buses and Vans Chapter 6 Final Report Engineering Analysis
Axles and Differentials
Four- Five- and Seven-Year Vehicles The axles and differentials used on small buses are exclusively built for the vanchassis manufacture by Tier 1 suppliers The axles are designed to accommodate the load rating of the vehicle Most rear axles for this vehicle weight class use a floating design in which the load on the axle is carried by the axle housing and not the axle shafts The differential provides the final gear reduction and transmits power from the powertrain to the wheels Properly maintained axles and differentials will perform for many years without major maintenance Transit service is hard on axles and differentials and it is not uncommon to have to replace the bearings on the axle shafts or the differential itself This type of maintenance is not scheduled and is performed on an as-needed basis Overhauling a rear axle can cost upward to $1500
Depending on vehiclersquos loading rating the front axle and suspension uses either a solid axle design with coil leaf or torsion bar mechanical springs or an independent suspension with either a coil or torsion bar mechanical spring Independent suspensions provide superior ride comfort but have more bushings associated with them requiring periodic replacement Front-axle and suspension systems are inspected regularly with repairs performed on an as-needed basis
Ten- and Twelve-Year Vehicles Ten- and twelve-year heavy-duty buses use axles and differentials from the trucking industry although there are transit bus specific axles used especially in low-floor applications where the front axle by necessity must be a low profile design Rear axles of low-floor designs can also be of a low profile design but this is only required in a full low-floor type of design compared with the more common partial low-floor design Heavy-duty small transit buses use two axles and are rated for a GVW of 26000 to 33000 pounds with the front typically rated at 10000 and the rear at 20000 pounds Large heavy-duty transit buses use two axles (3 for an articulated bus) and are rated for a GVW of 36000 to 40000 pounds The maximum axle weight allowed is typically 18000 front and 22000 rear depending on the state As delivered large heavy-duty transit bus front axles are rated for 13000 pounds and rear axles are typically rated for 26000 pounds Rear axles for this vehicle weight class use a fully floating design in which the suspension loads on the axle are carried by the axle housing and not the axle shafts Here again it is not uncommon to have to replace the bearings on the axle shafts or the differential itself and this type of maintenance is not scheduled it is performed on an as-needed basis and can be expected at least once during the vehicle life Rear suspensions are most commonly air springs or occasionally solid leaf springs
The front axle and suspension is generally a solid axle design with coil springs air springs or occasionally an independent suspension with air springs Independent suspensions provide superior ride comfort but have more bushings associated with them requiring periodic replacement Front axle and suspension systems are inspected regularly with repairs performed on an as-needed basis Overhauling heavy-duty axles can cost $9000 and suspensions roughly $4600 per rebuild
Federal Transit Administration 67
Useful Life of Transit Buses and Vans Chapter 6 Final Report Engineering Analysis
Table 6-8 Axles and Differentials Characteristics
Component 4- and 5-Year Vans and Buses 7-Year Bus 10-Year Bus 12-Year Bus
Type Floating rear solid or torsion front w leaf
suspension
Floating rear solid front w leaf suspension
Floating rear solid front w coil springs air
springs
Floating rear solid front w coil springs air
springs Useful Life Life of Vehicle Life of Vehicle 6 to 7 years 6 to 7 years Rehabilitated As needed As needed As needed As needed
Many agencies do not perform a scheduled rehab but will repair as needed
Brakes
Four- Five- and Seven-Year Vehicles Four- and five-year small buses are equipped with hydraulic brake systems featuring drum brakes on the rear and disc brakes on the front axles Medium-duty 7-year buses are typically equipped with hydraulic brake systems with either drum or disc foundation brakes Higher-capacity vehicles are equipped with pneumatic brake systems because of limitation on the boiling point of hydraulic fluid In transit service brakes are inspected on scheduled intervals based on either vehicle mileage or time Brake life is dependent on the duty cycle and can range between 15000 and 30000 miles Rebuilding the brakes can cost upwards of $400 per axle
Table 6-9 Brakes Characteristics
Component 4- and 5-Year Vans and Buses 7-Year Bus 10-Year Bus 12-Year Bus
Brakes
Type Hydraulic drum rear brakes and disc front
brakes
Pneumatic drum rear brakes and disc
front brakes
Pneumatic drum rear brakes and disc front
brakes
Pneumatic drum rear brakes and disc front
brakes
Useful Life 15000 and 30000 miles
15000 and 30000 miles
15000 and 30000 miles
15000 and 30000 miles
Rehabilitated Yes Yes Yes Yes
Ten- and Twelve-Year Vehicles Ten- and twelve-year heavy-duty transit buses are equipped with air brake systems featuring drum or disc brakes on the front and rear axles Heavy-duty vehicles are equipped with pneumatic brake systems because of limitation on the boiling point of hydraulic fluid In transit service brakes are inspected on scheduled intervals based on either vehicle mileage or time Brake life is dependent on the duty cycle and can range between 15000 and 30000 miles Rebuilding the brake system can cost $5000 including actuators linings and drums
Wheelchair Lifts
Conventional high-floor buses use wheelchair lifts to meet ADA requirements Low-floor designs also use some form of boarding aid for wheelchair passengers such as an air-driven boarding ramp and kneeling system The ramps are located on the inside of the bus at the front entrance door and are operated by the driver These boarding aids use interlocks that prevent the
Federal Transit Administration 68
Useful Life of Transit Buses and Vans Chapter 6 Final Report Engineering Analysis
bus from moving with a deployed wheelchair lift or ramp These systems are repaired as required during the life of the vehicle Typical overhaul cost for wheelchair lifts at midlife of a 12-year vehicle ranges from $12000 to $20000 with ramps costing relatively less depending on the complexity of the mechanism
Table 6-10 Wheelchair Lifts and Ramps Characteristics
Component 4- and 5-Year Vans and Buses 7-Year Bus 10-Year Bus 12-Year Bus
Type Lifts and Ramps Lifts Lifts Lifts Useful Life Life of Vehicle 6 to 7 years 6 to 7 years 6 to 7 years Rehabilitated As needed As needed As needed As needed
Summary
Figure 6-1 summarizes the results of this sub-section Specifically the figure presents the expected service lives of all major component groupings for a 12-year bus Here component groupings have been placed into three categories acting as rough prioritizations of vehicle replacement and rehabilitation importance These include (1) replacements required to keep vehicles fully operable (2) replacements to ensure vehicle operation remains safe and (3) replacementrehabilitation activities to maintainimprove vehicle esthetics (or general quality of service) Note here that relatively few vehicle components typically last the full ldquoservice liferdquo of the vehicle For 12-year vehicles this includes the structure (the component to which most other components are attached) exterior (panels or ldquoskinrdquo) and the electrical system This summary presentation helps to emphasize the fact that the vehicle structure the skeleton to which all other components are attached is the single most important vehicle component that defines the overall useful life of the entire vehicle Given this importance the next sub-section will further review the vehicle frame
Federal Transit Administration 69
Useful Life of Transit Buses and Vans Chapter 6 Final Report Engineering Analysis
Figure 6-1 Component Expected Life 12-Year Bus
Structure
Electrical System
Fuel System
Engine
Axles and Differential
Transmission
Suspension
Brakes
Tires
Wheelchair Lift
Radio and Public Address System
Hubs
Air System
Exterior
Windows
Interior Climate Control
Interior
Destination Signs
16 Expected Component Life (Years)
Vehicle Structure ndash A Second Look
This section provides further consideration of vehicle structure As noted above vehicle structure defines the useful life of the vehicle as a whole more than any other single vehicle component This is because the structure is the backbone to which all other vehicle components are ultimately attached Should the structure wear out or fail due to the influences of corrosion or a significant accident then the life of the vehicle is essentially at an end In contrast other vehicle components can be replaced as needed when they fail or become obsolete This even includes components that can be challenging to replace such as electrical systems which may require significant dismantling of the vehicle prior to removal and replacement Even the vehicle exterior (eg the panels making up the ldquoskinrdquo of the vehicle) which also tends to last the expected service life of the vehicle can be replaced as needed over the life of the vehicle Replacing the structure however would require the removal of all other components and then the complete reassembly of the vehiclemdashan improbable task
As the Chapter 2 analysis makes clear the structure of the 12-year bus (and some 10-year buses) is really only the bus and van structure developed solely for the transit market with the structures for all remaining bus and van types developed with other user applications in mind such as school buses motor homes courtesy vehicles and family vans Given that structure defines vehicle useful life more than any other component and that 12-year vehicle structures are the only structures designed specifically for transit use (and transit is the largest purchaser) the 12shy
Operability
Safety
Esthetics
0 2 4 6 8 10 12 14
Federal Transit Administration 70
Useful Life of Transit Buses and Vans Chapter 6 Final Report Engineering Analysis
year structure is the single component where FTA and the transit industry are in the best position to alter both component life and vehicle useful life simultaneously
The following sub-sections consider the useful life of vehicle structure from two different perspectives The first is the impact of service environment which is a primary determinant of structure service life and a factor that many transit operators would like to include along with service years and miles in assessing FTArsquos minimum service-life requirements The second is consideration of how different structure designs impact the useful life of transit buses For the most part the discussion in the section is limited to 12-year buses
Service Environment
All of the agencies interviewed for this study including those participating in both the initial and follow-up reviews acknowledged that service environment is one of the most significant factors that impacts the useful life of the bus structure This was recognized by agencies whether they considered their own service environment as less the same as or more severe than the national average
Agencies who noted that their service environment was the same as or less severe than the average did comment that buses that see high passenger load rates and are subjected to more severe service wear out faster This is intuitive and most agencies can proactively address this by rotating their buses so that the vehicles get equal exposure to the high service routes in order to balance overall fleet life However this is not always possible One agency noted that they exclusively used 60-foot articulated buses on specific high demand routes These buses experienced much higher wear and required more maintenance This agency attributed the higher maintenance requirement to the more demanding service environment served by the 60-foot bus rather than to the complexity of the articulated vehicle
The variability in service environment and its impact on bus useful life implies that a standard replacement age may not be appropriate for all transit agencies A bus structure built to survive the standard 12 years in an average North American city will not last 12 years in a harsher New York City or Boston environment Conversely a bus structure built to survive 12 years in either of these northeastern cities will be over-designed for the average US transit agency The bus structure will survive in excess of 12 years but it is a heavier and stronger structure The additional weight of the structure results in lower passenger capacity higher fuel consumption and greater wear on suspension and braking components Many of the agencies interviewed (including TTC NYCT and MBTA) have strengthened their specifications to include structural validation requirements in order to ensure they are purchasing buses that will survive for their desired (eg 12 year or longer) useful life within tough operating environments
TTC and NYCT working with Bodycote (formerly Ortech) developed an evaluation process to pre-qualify bus structures using a shaker table test The shaker table can be used to simulate the bus in the agencyrsquos actual operating environment The shaker table consists of four hydraulic posts that attach to the busrsquos wheel ends The hydraulic posts input loads into the busrsquos structure based on accelerometer data collected from actual routes The dynamic test can simulate 500000
Federal Transit Administration 71
Useful Life of Transit Buses and Vans Chapter 6 Final Report Engineering Analysis
miles of actual operation in a matter of weeks The actual stresses and failures that a bus structure would experience in service can be found over the course of the test
Using a similar methodology the stresses imparted into the bus structure can be measured in service and used to calculate ldquodamage factorsrdquo for the structure Instead of testing a completed bus on a shaker table this method can be used to predict useful life This approach has been applied by the MBTA on all of their recent bus procurements Each bus design was outfitted with a few dozen to a couple of hundred strain gauges and road tested in both loaded and unloaded conditions The strainstress data gathered from these tests was then extrapolated over the required 500000-mile useful life of the bus By comparing this information with known fatigue curves for standard welded joint classes the expected life of the bus structure can be determined In addition any locations that may have a lower than required life can be identified and redesigned prior to full bus structure production
Based on the interviews with transit agencies it is clear that service environment has a significant impact on bus structure useful life However because of the wide range in service environments throughout the country agencies with the most severe service environments have found it necessary to emphasize bus structure validation as part of their evaluation process If all agencies are required to get 12 years of useful life from their buses this will result in the average agency purchasing a vehicle that is over-designed for their needs at a higher cost with operating penalties of increased weight andor reduced passenger capacity
Severity and Minimum Service-life requirements Finally the question then arises as to whether the service environment should be includedmdash along with minimum service years (eg 12 years) and service miles (eg 500000 miles)mdashin the definition of FTArsquos expected minimum service-life requirements In other words should agencies operating in severe service environments be subject to less restrictive minimum service-life requirements as compared to those in less severe environments (eg 10 years versus 12 years for a large heavy-duty bus) While many of the interview respondents support the lesser restriction it is not clear how this service environment adjustment would be implemented in practice For example how would service environment severity be measured and where does the boundary between severe and not severe lie Presumably this would require some type of index incorporating measures of average passenger loadings street ldquoroughnessrdquo road salt utilization and perhaps local topography (ie for presence of steep grades) Alternatively agencies could lobby for a severity rating that FTA would then need to agree to
At the same time FTA would also need to conduct some analyses to determine how the minimum age and mileage requirements should best be altered to reflect these differences For example for large heavy-duty buses should the service-life requirements be 10 years for high-severity environments 12 years for average severity environments and 14 years for low-severity environments or some other set of ages
Another option would be to maintain the current 12-year and 500000-mile requirements and then somehow adjust funding levels to reflect the needs for a stronger structure for more severe operating environments To a limited extent this is already the case as (1) formula funding is already tied to ridership (thus accounting for rider impacts if not street roughness impacts) and
Federal Transit Administration 72
Useful Life of Transit Buses and Vans Chapter 6 Final Report Engineering Analysis
(2) FTA funds 80 percent of the vehicle cost including 80 percent of the higher cost for vehicles with stronger structures
In summary while it is very clear that service environment severity is a primary determinant of vehicle useful life it is not as clear how this factor could be represented in FTArsquos minimum service-life requirements While it is possible in theory to develop measures to capture and reflect differences in service environment severity (eg an index of service severity) selection development and reporting of these measures would require some research and would still require identification of a clear (but arbitrary) cut-off point between the severe and less severe environment types
Construction Type
The method in which transit buses are designed and constructed has an impact on their useful life The most popular method of construction used today for 12-year service life buses is an integral body and chassis constructed from square tubing This construction method uses hundreds of varying sizes of square tubes that are welded together to form the sidewalls roof and floor structures The sections are brought together and welded creating an integral bus body and chassis There are thousands of welds in a completed bus structure and the welds are subject to fatigue Buses that use this construction method are commonly referred to in the industry as ldquostickrdquo buses European bus designs heavily influenced this construction method New Flyer Orion NABI and Neoplan all employ this type of construction
The advantage of this construction method is that very little tooling and few machines if any are used in fabricationmdashthus minimizing expenses related to introducing a new bus design Disadvantages include the fact that the buses are very labor intensive to build and early versions suffered from structural design deficiencies corrosion problems and general quality control issuesmdashleading in turn to useful life issues Many transit authorities stayed with the proven General Motors RTS design last manufactured by NovaBus and Flxiblersquos Model 870 both of which were high-floor designs With the advent of low-floor buses however even the most loyal RTS operators were forced to procure stick busesmdashthe more effective design for vehicles of this type Most manufacturers have addressed the issues previously associated with stick buses by treating the tubes with corrosion-resistant coatings employing stainless steel improving quality control and strengthening the design such that newer designs are expected to have better useful life expectancies as compared to earlier models
Low-Floor Designs
Low-floor buses entered the market in the early to mid-1990s These buses feature a dropped front axle that enabled the floor to be lower and thereby eliminated the need for entry steps They also eliminated the need for wheelchair lifts which were problematic to maintain In the US market the low-floor bus standardized around a configuration featuring a low floor that ran from the front of the bus to just aft of the rear door After which two steps are required to reach the rear platform The raised rear platform provides sufficient space under the floor for a conventional rear axle and powertrain
Federal Transit Administration 73
Useful Life of Transit Buses and Vans Chapter 6 Final Report Engineering Analysis
Most of the 40-foot transit buses sold today are of the low-floor design Interview participants stated that it is too early to tell whether the low-floor design will impact vehicle longevity but did note that this design is more susceptible to roadside damage and salt spray (because the floor structure is closer to the ground) Furthermore the front suspension travel is reduced due to space limitation which may result in greater loads imparted into the bus structure with possible long-term service life ramifications Some interview participants felt that the service life of low-floor buses would be less than that of high-floor buses although they are capable of meeting minimum service-life requirements Others responded that the service life should be similar
Articulated Bus Designs
Articulated buses were introduced in the US market in the 1980s by European manufacturers Two configurations were sold In one configuration commonly referred to in the industry as a ldquopusherrdquo the engine resides in the rear of the second module or ldquotrailerrdquo similar to a conventional 40-foot bus The other design referred to as a ldquopullerrdquo houses the engine below the floor of the forward module or ldquotractorrdquo The added complexity of articulated buses increased their maintenance costs which can reduce their useful service life Only a few large transit authorities operate articulated buses in significant numbers Transit authority responses did indicate issues with articulated buses but these issues were primarily vendor-specific and not necessarily typical of this vehicle type
The advent of bus rapid transit (BRT) has renewed interest in articulated buses These latest designs feature low floors stylistic front ends pusher powertrain layouts and in some cases doors on both sides of the vehicle It is premature to comment on the durability of the latest generation of articulated buses however features such as doors on either side would be expected to challenge the structural integrity of the bus and could negatively affect its useful life
Bus Durability and New Technologies
Promoting research into advanced designs and technologies has always been an FTA interest and a transit industry strength In the 1990s FTA performed research on battery electric hybrid electric alternative fueled fuel cell and composite material buses This research has led to some useful-life impacts on the grantees For example the composite structures can certainly provide a minimum 12-year life and likely more These may be of interest to agencies looking for longer-life vehicles However the cost of the composite buses has limited their competitiveness within the low-bid procurement process
The following subsections consider the useful life implications of two types of new vehicle technologiesmdashalternative fuel and new electronics technologies
Alternative Fuels and Hybrid Propulsion Systems
The use of new fuels and propulsion systems in transit has historically affected the reliability and (in some cases) useful life of transit buses Early compressed and liquefied natural gas engines for example were sensitive to fuel quality and the energy content of the fuel because their mechanical fuel injection systems were not sophisticated enough to adjust for these differences
Federal Transit Administration 74
Useful Life of Transit Buses and Vans Chapter 6 Final Report Engineering Analysis
and often led to engine damage Newer electronically controlled engines have solved issues associated with changes in fuel content
Natural gas engines operate with a lower compression ratio The lower ratio results in smaller forces on the pistons pistons rod crankshaft and crankshaft bearings theoretically extending the life of the lower half of the engine The high combustion temperatures associated with spark-ignited engines negatively affect the upper half of the engine Taken together CNG engine should have similar life to that of diesels which is approximately 300000 miles
Survey responses from transit authorities found modern CNG engines to be durable and reliable Some transit authorities commented on the increased maintenance requirements due to the added components such as the spark plugs and ignition systems Transit authoritiesrsquo current concern with CNG buses is their higher curb weights CNG buses weigh approximately 3000 lbs more than their diesel counterpart The added weight is associated with the high-pressure cylinder storage tanks that make up the fuel storage system Some transit authorities expressed concern that the added weight negatively affects the useful life of transit bus structures Hence while the engine life of CNG vehicles may be comparable to that of traditional diesel engines the higher CNG engine weight may have negative useful life impacts on vehicle structures The agency respondents stated that this has yet to be proven
Diesel hybrid electric propulsion systems are the latest technology employed on transit buses Hybrid propulsion systems feature a diesel engine generator electric traction motor power electronics and batteries The batteries are capable of storing energy from regenerative braking and using it later to propel the bus NYCT was the first transit authority to purchase diesel hybrid electric buses in 1998 Since that time the technology has developed additional suppliers have entered the market and the technology has gained widespread acceptance Diesel hybrid electric buses have proven successful in terms of reliability and maintainability and the regenerative braking feature has significantly reduced brake maintenance
Diesel hybrid electric propulsion systems have two issues that may impact bus useful life The first issue is the life expectancy of the batteries There are currently two battery types being used on transit busesmdashlead-acid and nickel metal hydrides Neither is capable of meeting the minimum life expectancy of a transit bus both will need to be replaced one or more times throughout the vehicle life cycle Transit authorities will have to decide whether it makes economic sense to install new batteries at a significant expense into an older bus or retire and buy new The second issue deals with weight The weight of the batteries and associated components is approximately 1500 pounds While not as significant as the weight with CNG buses the additional weight increases roof loads onto the structure and may impact useful life Here again the actual impact on vehicle useful life will not be known until these buses begin to reach their mid and later service years
New Electronics Technologies
Over the past decade transit operators have added an ever-increasing number of new electronics technologies to their bus vehicles including automatic vehicle location automatic passenger counters on-board cameras vehicle diagnostics adaptive signal timing and communication
Federal Transit Administration 75
Useful Life of Transit Buses and Vans Chapter 6 Final Report Engineering Analysis
control voice annunciation and others In many instances agencies will not allow their buses to pullout for daily revenue service unless these systems are fully functioning (in some cases for liability concerns) However as each new technology is added to the bus and as more of these technologies are deemed critical to service operations the probability of one ore more technologies failing steadily increases leading to a potential need for increased spare ratios Of greater concern to agencies is the fact that the likelihood of these technologies failing is expected to increase further as vehicles age leading to potentially serious fleet reliability issues for aging fleets (or an increased need for vehicle electronics overhauls after mid life) Once more the ultimate impact on vehicle useful life will not be known until these technologies have been in service for many more years
Life-Extending Practices
Life-extending practices employed by transit authorities include the use of corrosion-resistant materials preventative maintenance programs and mid-life overhaul programs Many transit authorities specify corrosion-resistant materials when procuring buses These include the use of protected carbon steel and stainless steel The interior of the tubes are treated with an interior rust inhibitor while the undercarriage is also treated with an undercoating Corrosion-resistant metals rust inhibitors and undercoating are imperative to ensuring a long useful life
Similarly preventative maintenance programs are key to ensuring minimum life requirements are satisfied Operating buses with worn or bad suspension bushing for example increases the loads imparted into the busrsquos structure and ultimately shortens the useful life of the bus Typical preventative maintenance programs might include a 3000-mile minor mechanical and 12000shymile major mechanical and inspection
In addition to preventative maintenance programs some of the nationrsquos largest transit authorities perform mid-life overhauls after roughly seven years of service The overhaul programs are extensive and result in the rebuilding or replacing of a majority of components on the bus The work can be performed in-house or by an outside contractor Transit authorities that engage in mid-life overhaul program typically extend the service life to 15 years
Vehicle Emissions
An additional consideration with respect to bus and van useful life and FTArsquos minimum service-life requirements is vehicle emissions of nitrogen oxides (NOx) and particulate matter (PM) First although it is difficult to obtain empirical data on the matter it is generally believed that vehicle engines emissions gradually worsen over the life of the vehicle as the condition of the engine continually declines (even with rebuilds) Second and more importantly emissions levels for new heavy-duty transit buses have been decreasing steadily over time as newer cleaner burning engines are developed (see Figure 6-2) Either way it is clear that any reduction in actual vehicle service life (ie earlier fleet retirements) can help accelerate the replacement of older vehicles (and engines) with newer vehicles with cleaner burning engines yielding a clean air benefit to society However as has been noted many times throughout this report FTArsquos current minimum life requirement is not binding for most transit operatorsmdashand hence any relaxation of that requirement would not yield an appreciable reduction in transit fleet particulate
Federal Transit Administration 76
Pre-19
87
1987
-1990
1991
-93
1994
-95
1996
-98
1999
-02 20
03
2004
-06 20
07
2008
+
Useful Life of Transit Buses and Vans Chapter 6 Final Report Engineering Analysis
emissions (See Financial Impact of Earlier or Later Bus Retirement in the next chapter which estimates the small number of vehicles likely to be retired earlier with a reduction in FTArsquos minimum service-life requirements) Moreover it has not been shown that the benefits of this emissions reduction would offset the increased capital cost for accelerated vehicle replacement Finally even if more agencies were responsive to a reduction in FTArsquos minimum service-life requirements the emissions benefit from accelerated retirement would be short-lived As shown in Figure 6-2 new engines are now nearing zero-emissions levels for NOx and PM Once all of the older ldquodirtierrdquo vehicles are retired the benefit of accelerated retirement disappears
Figure 6-2
Heavy Duty Transit Buses NOx and PM Emissions by Model Year
0
5
10
15
20
25
NO
x (g
mi)
000 005 010 015 020 025 030 035 040 045
PM (g
mi) NOx
PM
Source California Air Resources Board Urban Diesel Transit Bus Emissions Inventory
Vehicle Reliability
The impact of age on a busrsquos useful life varied by transit agency and was primarily influenced by the agencyrsquos maintenance practices and service environment While all agencies reported that buses became less reliable with age it was noted that the extent of unreliability and deterioration could be controlled andor mitigated by improved maintenance In general agencies that followed a rigorous preventative maintenance regime reported that they saw minimal deterioration of the bus over the 12-year expected life Agencies that performed primarily corrective maintenance reported that older buses became less and less reliable and more and more expensive to maintain
Federal Transit Administration 77
Useful Life of Transit Buses and Vans Chapter 6 Final Report Engineering Analysis
National Bus Condition Assessment
From 1999 to 2002 FTArsquos Office of Budget and Policy completed a series of physical condition inspections for a large sample of US transit buses This study evaluated the physical condition of close to 900 transit buses and vans at more than 40 different transit properties The purpose of these inspections was to develop bus vehicle decay curves to simulate the nationrsquos current and future bus replacement needs within FTArsquos TERM
The bus physical condition data collected for this effort provide valuable information on (1) the expected physical condition of US transit buses throughout the vehicle life cycle and (2) a clear understanding of how the physical condition of transit buses of the same age varies across bus models and transit properties The results of this condition assessment provide a valuable means to understand both the consequences of the existing minimum service-life requirements (eg the expected physical condition of a 40-foot transit bus at age 12) as well as the consequences of changing that policy (eg how increasing or decreasing the minimum retirement age would impact the physical condition of the nationrsquos bus transit fleets) This section provides an overview of FTArsquos bus condition assessment program and its findings as they relate to FTArsquos minimum life requirements
National Bus Condition Assessment ndash Overview
The national bus condition assessment evaluated the current physical condition of 895 transit buses and vans located at 77 facilities from 43 different US transit properties In practice each assessment consisted of a detailed on-site evaluation of the current physical condition of several vehicles of each sub-fleet located at each sample agency maintenance facility For bus vehicles the assessment included a detailed inspection of the vehicles interior exterior chassis and understructure and engine compartment This visual inspection data was then combined with agency maintenance hours road call fluid analysis (eg oil sample) and other data to yield a comprehensive evaluation of each vehicles overall physical condition
The primary goal of the national bus condition assessment was to provide FTA with this snap shot of the current physical condition of the nations bus fleet and related maintenance assets This national condition evaluation is significant as it provides a critical measure of the quality and safety of transit service currently provided to the nations bus riders At the same time by revealing the distribution of physical conditions of the nations bus fleets (eg across vehicle ages) the assessment also provides a realistic basis for evaluating the nations immediate vehicle and facility replacement needs This analysis of the FTA service-life policy used this bus condition assessment to help establish an engineering basis to the minimum useful-life service measures of age and miles
A secondary project goal for the national bus assessment was to develop improved asset decay curves of bus vehicles and bus facilities for FTAs TERM TERM itself is designed to predict current physical conditions and long-term capital needs for the US transit industry Given these capabilities TERM is also the primary analytical tool used by FTA to prepare its condition and needs estimates for the biennial US DOT report to Congress In developing those estimates TERM uses statistical decay curves to model the life cycle of all transit asset types including bus
Federal Transit Administration 78
Useful Life of Transit Buses and Vans Chapter 6 Final Report Engineering Analysis
vehicles and related facilities These condition decay relationships were used in this contribution to the useful-life analysis
Considerable care was taken to ensure that the vehicles and transit agencies included in the inspection process yielded a representative sample of the nations bus fleet and agencies as a whole This objective was achieved by first examining both the overall characteristics of the nations bus fleets and related facilities and the prime determinants of the physical decay processes for these asset types (eg variations in passenger loadings average miles per year per vehicle and climate) The sample of assets for inspection was then selected to ensure a representative sample based on these national characteristics and one with sufficient data points to permit comprehensive statistical analysis of the asset decay process for buses and facilities This representative sample is equally important to this engineering analysis of the useful life of buses and vans
Overview of Key Results
The national bus condition assessment yielded several significant results regarding the physical condition and asset decay characteristics of the nations bus vehicles These include the following
1 The rate of decay for bus vehicles appears to fall into three distinct regimes over the asset life cyclemdashbeing highest over the first five years of revenue service slowing markedly between the ages of 5 through 14 and then accelerating again as the vehicle approaches retirement These observed regimes are consistent with the known service and rehabilitation practices of US transit operators throughout a typical vehicle life cycle In general most transit agencies obtain their highest revenue mileage and conduct the least amount of rehabilitation activities over the initial years of vehicle revenue service (ie producing a high decay rate) Between the ages of 5 and 14 (approximately) vehicles see less revenue service and begin to undergo multiple small rehabilitation activitiesmdashreducing the rate of decay Finally the value of maintaining a low-service vehicle approaching retirement declines continuously after the age of 14 leading to significant reductions in rehabilitation activity and consequently a rapid increase in the rate of decay
2 On average agencies pursuing aggressive preventive maintenance programs tended to experience lower overall maintenance costs superior bus conditions (a lower rate of deterioration) and extended vehicle life In contrast agencies focused primarily on corrective maintenance tended to exhibit poorer overall conditions higher maintenance costs and higher vehicle failure rates
3 Overall the primary contributors to vehicle decay were high utilization rates salt-related corrosion (highest in regions using road salt andor adjacent to salt water) and weak preventive maintenance Many vehicles also suffered from the effects of vandalism
4 While the national condition inspections covered all bus and vehicle types the inspection effort was concentrated on 12-year buses Consequently the data quality is highest for this vehicle type and much of the analysis that follows relate specifically to findings for the 12shyyear vehicle type
Federal Transit Administration 79
Useful Life of Transit Buses and Vans Chapter 6 Final Report Engineering Analysis
Vehicle Condition Rating Criteria
The condition rating criteria used in the bus condition engineering analysis is based on a five-value measurement of every detailed component and element within each bus (Table 6-11) The 1 to 5 condition rating scale used here is derived directly from that used by FTA to report asset conditions for all transit asset types at the national level Every component was assessed in this process based on a detailed valuation description of the five measures for each component5
These component condition ratings were subsequently entered into a national bus condition assessment database and the overall physical condition of that vehicle calculated as the weighted average of the condition ratings across all vehicle components The component weights assigned for this calculation are equal to each components estimated percentage contribution to the total life-cycle capital cost of the vehicle (including the components purchase price capital maintenance and rehabilitation and replacement costs as applicable)
The condition assessment engineers observed a broad variation in the rate of vehicle decay across the transit agencies participating in the study For example on average 40-foot buses were observed to take 84 years to decay from condition 50 (excellent) to condition 30 (adequate) However this decline took only 51 years for the lowest ranked operators included in the study For the highest ranked operators this decay process required 135 yearsmdashone year past the FTAs minimum retirement age
Table 6-11 Vehicle Condition Rating System
Rating Condition Description 50 Excellent No visible defects near new condition 40 Good Some (slightly) defective or deteriorated component(s) 30 Adequate Moderately defective or deteriorated component(s) 20 Fair Defective or deteriorated component(s) in need of replacement 10 Poor Critically damaged component(s) or in need of immediate repair
Bus Vehicle Conditions
Figure 6-3 provides a scatter plot of the observed vehicle conditions for the 895 transit buses and vans Specifically each point represents the weighted average condition value for a single vehicle based on the assessed condition of that vehicles constituent components As expected vehicle conditions decline significantly over the life of the vehiclemdashstarting in excellent condition (5) and deteriorating to marginal or poor condition (2 or 1 approximately) over a 10- to 20-year period
5 For more information about the TERM model or details of the bus condition assessment process please reference ldquoStatus of the Nationrsquos Highways Bridges and Transit Conditions and Performancerdquo and the ldquoTransit Economic Requirements Model Users Guiderdquo
Federal Transit Administration 80
Useful Life of Transit Buses and Vans Chapter 6 Final Report Engineering Analysis
Figure 6-3
Bus Physical Condition Versus Age
10
15
20
25
30
35
40
45
50 Ph
ysic
al C
ondi
tion
Full Bus (12 yr) Small Bus (7-10 yr) Vans (4 yr)
0 1 2 3 4 5 6 7 8 9 10 11 12 13 14 15 16 17 18 19 20 21
Vehicle Age (Years)
This figure also reveals broad variation in the rate at which vehicles deteriorate For example while most 12-year vehicles tend to remain in the good through excellent range (ratings 35 to 5) during the first two years of revenue service several vehicles appear to fall quickly below this level This rapid rate of decline was typically the result of very high service levels high passenger loadings accidents and in a few instances vandalism At the same time many 12-year vehicles were in adequate (condition 3) or better condition well past the FTAs 12-year minimum retirement age These well-preserved vehicles were typically the product of strong preventive maintenance programs milder operating environments and lighter duty cycles Relatively few 12-year vehicles had an overall condition rating less than 20 (although many individual vehicle components were assigned a condition rating of 1) This result reflects transit agency reticence to place a vehicle in active service if it has deteriorated such that it represents a safety hazard has poor reliability or provides poor service quality
Implications for FTArsquos Minimum Service-life Policy Part 1
For this review of FTArsquos minimum service-life policy an overall vehicle condition rating of 20 means a reasonable floor beneath vehicles should not generally be permitted in service In other words an overall condition of 20 helps to establish a maximum replacement life point (not a minimum) By inference then vehicles with ages equal to FTArsquos minimum retirement age (or mileage) should have overall condition ratings that are greater than 20 Specifically this minimum retirement age should optimally occur after a vehicle type has declined below a condition rating of 30 (ie adequate) but before it reaches an overall condition of 20 (substandard)
Federal Transit Administration 81
Useful Life of Transit Buses and Vans Chapter 6 Final Report Engineering Analysis
Average Vehicle Condition by Age 12-Year Vehicles
Figure 6-4 illustrates the change in average vehicle conditions by vehicle age for the full sample of 12-year vehicles once the scatter plot data presented above are ldquosmoothedrdquo to better capture the rate of vehicle decay for different bus populations6 Inspection of this smoothed average graph reveals several significant features First as expected average vehicle physical conditions tend to decline as vehicle age increases Second the rate of decline is not constant but varies over time In particular the rate of decline appears to fall into three distinct regimes over the asset life cyclemdashbeing highest from procurement through age 5 (approximately) slowing markedly from age 5 to 14 and then accelerating again after age 14 Finally the rate of decline decreases slowly from year to year within each regime appearing to follow an exponential decay process within each regime period
Figure 6-4
Average Bus Conditions by Age (Smoothed)
10
15
20
25
30
35
40
45
50
0 1 2 3 4 5 6 7 8 9 10 11 12 13 14 15 16 17 18 19 20 Vehicle Age
Con
ditio
n
Sample Average Top Quartile Agencies Bottom Quartile Agenices
As shown in Table 6-12 the observed deterioration regimes are entirely consistent with the known service maintenance and rehabilitation practices of US transit operators throughout a typical vehicle life cycle In general most transit agencies obtain the highest revenue mileage from bus vehicles during their initial years of service (ages zero through five approximately) During this period the vehicles require the least maintenance and provide the highest quality service to transit patrons in terms of comfort cleanliness and reliability The lower rate of
6 Specifically Figure 6-4 presents a smoothed average of the data points first presented in Figure 1-2 The smoothed average was calculated by first computing the observed average condition rating value at each vehicle age These observed average age values were then smoothed such that the smoothed average value for age t was set equal to the observed average values for ages t t-1 and t+1 (ie Smoothed AverageAge t = 13AverageAge t-1 + AverageAge t + AverageAge t+1)
Federal Transit Administration 82
Useful Life of Transit Buses and Vans Chapter 6 Final Report Engineering Analysis
capital maintenance and high rate of utilization combine to produce the highest rate of asset decay during this time period
Table 6-12 12-Year Vehicle Decay Rate Regimes
Age Regime Vehicle Ages Rate of Decay Agency Practices
Like New 0 to 5 Highest bull High annual mileage bull Minimalno rehabilitation (near new condition)
Mature 5 to 14 Moderate bull Reduced annual mileage bull Significant rehabilitation activity (engine rebuilds
mid-life overhauls)
Old 14 + Moderate Increasing
bull Low annual mileage bull Significant reduction in maintenance and
rehabilitation activity (nearing retirementmdashallowed to deteriorate)
Between the ages of 5 and 14 (approximately) vehicles begin to undergo more or less continuous capital maintenance and rehabilitationmdashincluding engine and transmission rebuilds upholstery replacement exterior painting and other component replacement activities These capital maintenance activities occur regardless of whether there is an overhaul process or scheduled or unscheduled component replacements Most agencies pursue these activities on an as-needed basis throughout this time period with very few agencies conducting a more or less complete vehicle overhaul at a single point in time Furthermore the actual level of maintenance and rehabilitation pursued during this period varies widely across agencies
During this period a typical vehicles overall condition rating will actually fluctuate up and down (eg pass above and then decay below the smoothed average line in Figure 6-3) as various rehabilitation activities are completed and the asset decay process begins again Regardless of the level of rehabilitation pursued these activities tend to reduce the rate of asset decay At the same time the level of annual service mileage derived from these vehicles tends to decrease over this period as operators focus service on newer fleet vehicles The combined increase in rehabilitation activity and decrease in annual service miles serve to decrease the rate of vehicle decay This emphasizes the necessity of rehabilitation activities regardless of whether they are part of an overhaul program scheduled in an organized replacement process or completed as failures necessitate on an unscheduled basis (unusual) In addition this pattern may support the exclusion of rehabilitation costs from a new federal reimbursable expensemdashan option that was considered in the initial hypotheses of potential service-life options
Finally most agencies begin to retire vehicles past the age of 12 or 14 years As vehicles approach retirement their annual miles of revenue service decrease significantly in favor of younger vehicles (tending to decrease the rate of asset decay) However the value of fully maintaining a low-service vehicle approaching retirement declines continuously during this time period leading to significant reductions in rehabilitation activity and consequently a significant increase in the rate of vehicle decay It should be noted however that several agencies operated vehicles in adequate (condition 3) or better condition well past the FTAs 12-year minimum retirement age Service-life options in this extended-life time period (beyond 12 years) has very little interest based on historical usage experience
Federal Transit Administration 83
Useful Life of Transit Buses and Vans Chapter 6 Final Report Engineering Analysis
Variation in Vehicle Decay Rates across Transit Agencies 12-Year Vehicles
Figure 6-3 provides the upper and lower bounds demonstrating the (smoothed) average condition values for those sample agencies with the highest and lowest overall condition ratings While these bounds do not fully explain the wide variation in 12-year vehicle conditions they do point to significant differences in the rate of vehicle decay across US transit operators (see Table 6-13)
Table 6-13 Average Number of Years to Attain Different Condition Ratings
Condition Rating
Years to Attain Condition Rating Bottom Quartile
Agencies Average Top QuartileAgencies
50 00 00 00 45 10 12 14 40 20 24 29 35 33 40 70 30 51 84 135 25 136 157 NA 20 189 200 NA
Note None of the agencies with average fleet conditions ranking in the top quartile operated vehicles older than age 16
For example 12-year vehicles operated by the lowest ranked transit agencies typically decline from Excellent to Good (ie from condition rating 5 to 4) in only two years However for the highest ranked agencies vehicles appear to decay more slowly and take an additional year to reach condition 4 Similarly while vehicles operated by the lowest ranked operators typically take five years to decline to Adequate (condition 3) vehicles operated by the top ranked agencies do not attain this rating until after age 13 over one year past the FTAs minimum 12shyyear retirement age
Implications for FTArsquos Minimum Service-life Policy Part 2
The agency analysis presented above demonstrates that even the bottom quartile agencies can easily attain FTArsquos current 12-year minimum retirement age for 40-foot buses without concern for operating vehicles into the lower engineering condition values of 25 to 20 (As discussed above an overall condition of 20 represents an overall vehicle condition that corresponds to the concept of a maximum retirement age or better yet a minimum acceptable service condition) This implies that a lower minimum life option may not be necessary or appropriate given the current bus design standards and operating conditions
Correlation with Vehicle Life-Cycle Cost Analysis
Chapter 7 of this report reassesses the bus condition information considered here There the life-cycle cost analysis is used to identify financially optimal retirement ages for all transit bus and van vehicle types The financially optimal retirement ages are then mapped to the corresponding
Federal Transit Administration 84
Useful Life of Transit Buses and Vans Chapter 6 Final Report Engineering Analysis
expected physical condition for vehicles of the optimal retirement age This correlation of engineering condition and life-cycle cost analyses is intended to provide an absolute answer to the optimal retirement age question (based on financial considerations) combined with an understanding of the physical condition implications of the identified optimal age (including expected levels of service reliability service quality and vehicle safety)
Federal Transit Administration 85
Useful Life of Transit Buses and Vans Chapter 7 Final Report Life-Cycle Cost Analysis
CHAPTER 7 LIFE-CYCLE COST ANALYSIS
This chapter presents the results of a minimum life-cycle cost analysis of the useful life of transit buses and vans This analysis considers all of the capital or non-recurring costs associated with vehicle acquisition as well as the recurring costs of vehicle operations maintenance and rehabilitation The objective of this analysis is to identify the point in the asset life cycle at which total life-cycle costs are at their lowest or are ldquominimizedrdquo From a financial perspective the minimum life-cycle cost point represents the optimal vehicle retirement age This minimum life-cycle cost analysis is presented first for the mainstay vehicle of the transit fleetmdashthe 40-foot heavy-duty ldquo12-yearrdquo bus The process is then repeated for each of the other transit bus and van categories Prior to presenting this analysis the chapter first identifies several of the primary determinants to life-cycle costs and life expectancy (including annual vehicle mileage average operating speed and agency rehabilitation practices) and then presents the full range of variation in these determinants across the nationrsquos bus transit operators
Later towards the end of the chapter the results of the life-cycle cost analysis are combined with the vehicle physical condition analysis from the last chapter The objective is to provide the reader with some understanding of a vehiclersquos expected physical condition at the financially optimal retirement point (in other words while the retirement point may be financially optimal is the vehiclersquos physical condition still acceptable to riders and operators) Finally this chapter concludes with an analysis of the potential loss of ridership and related fare revenues associated with increasing failure rates of an aging fleet Together the combined results of these differing analytical perspectives (cost physical condition and failure rates) help define the optimal useful-life periods for each bus and van vehicle category
Data Sources and Caveats
The cost and timing of rehabilitation activities used for the analysis were obtained from agencies and vehicle manufacturers that participated in the interview process for this study However the response rate for the cost data portion of the interview guide was low with few agencies responding fully Additional cost data were obtained from prior studies including a 2002 Booz Allen Hamilton analysis of 30 small and medium-sized bus operators in Illinois While the data obtained are of good quality and reported costs are comparable across all data sources the overall sample size is small Future life-cycle studies may wish to improve on the statistical reliability of the analysis by devoting additional resources to expanded data collection and a larger sample size Data on the average annual vehicle mileages were obtained from NTD
Key Determinants of Life-Cycle Costs
Life-cycle costs and vehicle life expectancy can vary significantly across transit operators even for operators using the same vehicle type under similar vehicle maintenance regimes Hence it is important to consider these factors when conducting a life-cycle cost analysis intended to represent the experience of the nationrsquos transit operators as a whole Towards this end this section identifies three key determinants of vehicle life-cycle costs (and life expectancies)mdash
Federal Transit Administration 86
Useful Life of Transit Buses and Vans Chapter 7 Final Report Life-Cycle Cost Analysis
annual vehicle mileage average operating speed and agency rehabilitation practices The section then goes on to discuss how these determinants vary across the nationrsquos transit fleets providing the full range of experience that needs to be reflected in the life-cycle cost analysis The analysis here is focused on the 12-year vehicle type but was also completed for the 10- 7- 5- and 4-year vehicle categories (see below)
Fleet Operating Conditions Annual Mileage and Operating Speed
The rate of vehicle wear is determined by a variety of factors including annual mileage average operating speed and passenger loadings In general higher annual mileages increase the rate of vehicle deterioration Similarly decreasing bus operating speeds are typically an indication of heavier duty-cycles (more frequent stops and starts) leading to a reduced life expectancy for drive trains brakes and other vehicle components Variations in annual mileages and operating speeds also have an impact on both the timing of fleet rehabilitation activities (eg drive train replacements) and annual operating and maintenance costs (higher annual mileage vehicles generally require higher maintenance and consume more fuel per mile than lower mileage vehicles of the same age) Hence an effective analysis of vehicle life-cycle costs must consider the range of annual mileages and service operating speeds experienced by US transit operators
Figure 7-1 shows the distribution of annual vehicle mileages for 12-year transit buses based on 2004 NTD data This chart shows a range of annual bus vehicle mileages with most US vehicles traveling between 25000 and 45000 miles each year The average annual mileage across all of the nationrsquos transit motor buses is just under 37000 miles The life-cycle cost analysis below will examine three specific annual vehicle mileage casesmdash25000 35000 and 45000 miles per year
Figure 7-1 Average Annual Miles
Distribution of US Transit Bus Vehicles
10000 15000 20000 25000 30000 35000 40000 45000 50000 55000 60000 65000
Average Annual Miles Per Fleet Vehicle
Average annual vehicle mileage tends to be highest during the earlier years of a vehiclersquos life (when utilization of the vehicle is highest) and then tends to decline as the vehicle ages (and is
00
20
40
60
80
100
120
140
160
Num
ber o
f Veh
icle
s (th
ousa
nds)
Federal Transit Administration 87
Useful Life of Transit Buses and Vans Chapter 7 Final Report Life-Cycle Cost Analysis
applied to lower demand routes) This characteristic is shown for the 12-year bus type in Figure 7-2 Once again analysis of life-cycle costs needs to reflect natural variations in the rate of vehicle utilization throughout a vehiclersquos life to accurately determine the timing of rehabilitation activities
Figure 7-2 Average Annual Milage 40 Foot Bus
00
50
100
150
200
250
300
350
400
450
500
Mile
s pe
r Yea
r (th
ousa
nds)
1 2 3 4 5 6 7 8 9 10 11 12 13 14 15 16 17 18 19 20
Vehicle Age
Finally Figure 7-3 shows the distribution of average operating speeds for 12-year transit buses Based on this data the average operating speed for 12-year transit buses is roughly 13 miles per hour with a range of between 8 and 20 miles per hour (although there is a small number of operators with average operation speeds outside of these boundaries) The life-cycle cost analysis presented below will utilize these minimum maximum and average operating speed values in defining the cost characteristics of the nationrsquos fleets of 12-year vehicles Similar bounds for annual vehicle mileage and operating speeds were developed for the life-cycle cost analyses of the 10- 7- 5- and 4-year bus and van vehicle categories (see below) As noted earlier in this report differences in average operating speed can be used as a proxy to account for differences in the total service hours (and the condition impacts of differences in hours) of transit vehicles with similar life-to-date service miles (Note Agencies can and do measure life-to-date vehicle mileage but currently have no means to measure life-to-date hours)
Fleet Rehabilitation Practices
In addition to variations in annual vehicle mileages and mean operating speeds transit agencies also employ differing life-cycle vehicle rehabilitation practices for their fleets This analysis will consider two specific cases The first case considers those agencies that undertake an extensive mid-life overhaul of their fleet vehicles In addition to the typical drive train replacement (engine and transmission replacement occurring every 250000 miles on average) extensive overhauls also include some body work exterior repainting replacement of most or all interior upholstery window and floor replacements technology upgrades etc The practice of conducting major mid-life overhauls is typically confined to the nationrsquos largest and highest ridership bus operators
Federal Transit Administration 88
Useful Life of Transit Buses and Vans Chapter 7 Final Report Life-Cycle Cost Analysis
00
20
40
60
80
100
120
Num
ber o
f Veh
icle
s (T
hous
ands
)
(eg New York City Transit New Jersey Transit and WMATA) but is relatively uncommon for most other operator sizes Where utilized major mid-life overalls of 12-year vehicles typically occur when the vehicle is six to seven years in age and are expected to provide several years of additional service life
Figure 7-3 Average Operating Speed
Distribution of US Bus Vehicles
80 90 100 110 120 130 140 150 160 170 180 190 200
Average Operating Speed (mph)
The second case considered here is intended to represent those operators that do not perform a major coordinated mid-life overhaul (most of the nationrsquos bus operators and roughly three-quarters of the nationrsquos bus vehicle fleet) For these operators replacement and rehabilitation of worn vehicle components is an ongoing continuous process performed on an as-needed basis In reality there is likely a continuum of rehabilitation practices between these two extremes However examination of these two limiting cases will effectively convey the relevant range of life-cycle cost issues between them
Life-Cycle Cost Analysis
The preceding analysis is intended to provide an understanding of the range of operating characteristics and rehabilitation practices that together are believed to drive differences in life-cycle costs and vehicle life expectancy across the nationrsquos transit operators Using that analysis this section develops a detailed life-cycle cost analysis of the 12-year 40-foot vehicles that constitute the bulk of the nationrsquos bus transit fleets This analysis is then used to identify that point in the vehicle life cycle when the sum total of all annualized costs (capital operating maintenance and rehabilitation) is minimized This minimum life-cycle cost point represents a financially optimal age to retire and replace a vehicle in effect providing a measure of ldquoeconomic useful liferdquo (as distinguished from an engineering useful life or other measure) As expected the point at which life-cycle costs are minimized can vary appreciably given differences in annual mileages average operating speeds and rehabilitation practices
Federal Transit Administration 89
Useful Life of Transit Buses and Vans Chapter 7 Final Report Life-Cycle Cost Analysis
Specifically this analysis considers the following life-cycle costs
bull Acquisition Cost and Disposal Value This includes purchase cost plus related procurement costs as well as the expected sale price or scrap value of the used vehicle
bull Expected Component Replacements and Mid-Life Overhaul Costs This includes the cost of all expected component replacements and rebuilds naturally occuring over the life of a vehicle (eg drive train rebuild) as well as the cost of any additional planned mid-life overhaul activities (if any) These costs are oriented toward the larger component replacement rebuild or rehabilitation needs and exclude the cost of minor vehicle repairs Examples include
ndash Engine and transmission rebuilds
ndash Other expected component replacements (eg brakes tires batteries suspension etc)
ndash Mid-life overhaul costs (eg repainting replacement of flooring upholstery windows body work etc)
bull Operating and Maintenance Costs This includes the cost of fuel preventative maintenance programs and all labor and parts for minor repairs as required to maintain vehicles in good working order
The following sub-sections provide an analysis of the expected annual cost of these different cost types throughout the vehicle life cycle beginning with a discussion of expected component replacement and mid-life overhaul costs
Expected Component Replacement and Mid-Life Overhaul Costs
Figure 7-4 presents the distribution of expected major component replacement and mid-life overhaul costs over a potential 20-year life cycle for a 40-foot transit bus (hence it excludes the cost of vehicle acquisition and all other vehicle operating and maintenance costs) The chart assumes a vehicle that averages 35000 miles per year over the full life cycle The chart also considers the two cases of (1) those agencies that complete an extensive mid-life overhaul and (2) those agencies that do not complete a mid-life rebuild but carry out their major component replacements on a continuous as-needed basis The analysis also assumes that the number of times a given replacementrebuild activity is performed depends on the vehiclersquos age at the time of retirement For example if engine rebuilds occur on roughly a six-year cycle (every 210000 miles) then this activity will occur once for a vehicle retired before 12 years twice for a vehicle retired before 18 years and 3 times for a vehicle retired at age 20 or later Similarly it is assumed that agencies currently pursuing a major mid-life rebuild program at vehicle age 7 (for example) would want to repeat the process again at age 14 if the vehicle was expected to operate well past that age
In reviewing Figure 7-4 it is easy to identify the timing of major vehicle replacement activities In particular the timing of the 7-year major mid-life overhaul (and its potential repetition at age 14) stands out clearly These investments include the cost of engine and transmission rebuilds repainting significant rehab and replacement of vehicle interiors (flooring upholstery and windows) bodywork as needed some electrical work and other upgrades In contrast the midshylife peaks for those agencies that do not perform a major mid-life overhaul are significantly
Federal Transit Administration 90
Useful Life of Transit Buses and Vans Chapter 7 Final Report Life-Cycle Cost Analysis
lower (fewer rehab activities equate to lower costs) but also have higher cost peaks for the intervening years (as some replacement activities tend to be more spread out) The smaller peaks primarily represent replacement of those components having shorter expected lives including tires brakes and batteries
Figure 7-4
Life Cycle Cost Profile Major Component Replacements and Overhauls
Maj
or C
ompo
nent
Rep
lace
men
ts a
nd O
verh
aul C
osts
$140000
$120000
$100000
$80000
$60000
$40000
$20000
$0
(Assumes 35000 miles per year)
Major Mid-Life Overhaul (40ft)
Continuous Rehabilitation (40 ft)
Optional (Rehab activities not
performed within 1 to 3 years of retirement)
1 2 3 4 5 6 7 8 9 10 11 12 13 14 15 16 17 18 19 20
Vehicle Age (years)
From the viewpoint of evaluating FTArsquos service-life policy the key point to note is that whether or not an agency conducts a major mid-life overhaul there are major cost cycles that are repeated throughout a vehiclersquos life cycle which are roughly concurrent with drive-train rebuilds (eg the cost peaks at roughly ages 6 to 7 and 12 to 14 in Figure 7-4) These major cycles help guide agency rehab-replacement decisionsmdashspecifically agencies will only complete a major vehicle rehabilitation initiative if they intend to keep that vehicle in service for at least three to five years after these improvements have been made For example in the case of a heavy-duty vehicle approaching 12 years in age an agency will only reinvest in that vehicle (eg rebuildreplace the engine and transmission) if the agency intends to obtain an additional three to five years of revenue service from that vehicle Otherwise these rehabilitation activities will be avoided (to save cost) and the vehicle will be retired after the minimum retirement requirements have been satisfied To summarize vehicle rehab and replacement decisions are determined by the timing of the vehiclersquos major reinvestment cycles with the timing of these cycles determined by annual vehicle mileage average operating speed and environment and agency maintenance practices
Minimum Life-Cycle Cost Analysis
Figure 7-4 above profiles the expected annual expenditures on component replacements and midshylife overhaul activities for heavy-duty vehicles for each year in the asset life cycle (including several years beyond the industry average retirement ages) In contrast the objective of this analysis is to identify that point in the asset life cycle at which the annualized value of all life-
Federal Transit Administration 91
Useful Life of Transit Buses and Vans Chapter 7 Final Report Life-Cycle Cost Analysis
cycle costsmdashincluding acquisition costs component replacement costs mid-life overhaul costs and operations and maintenance (OampM) costsmdashare minimized This minimum life-cycle cost analysis is depicted graphically in Figure 7-5 Specifically the cost values in this chart provide a measure of the average cost of ownership for a 40-foot vehicle at each vehicle age7 For example if a heavy-duty vehicle were retired at age 5 the annualized cost would be roughly $115000 (at that point regardless of whether the owner agency performs a mid-life rehab or not) Somewhere between the ages of 8 and 10 this annualized cost drops below $100000 reaching a cost minimum around a vehicle age of 14
Figure 7-5 Minimum Life Cycle Cost Profiles Including Vehicle Acquisition Major
Component Replacement Overhaul and OampM Costs
Tota
l Ann
ualiz
ed L
ife C
ycle
Cos
ts
$200000
$180000
$160000
$140000
$120000
$100000
$80000
$60000
(Assumes 35000 miles per year)
Major Mid-Life Overhaul (40 ft)
Continuous Rehabilitation (40 ft)
Minimum Life Cycle Costs
1 2 3 4 5 6 7 8 9 10 11 12 13 14 15 16 17 18 19 20
Vehicle Age (years)
The determinants for the shape of the cost curve in Figure 7-5 including the ldquoUrdquo shaped minimum are as follows First as the number of years of ownership increase a vehiclersquos acquisition cost becomes spread over an increasing number of years thus reducing the average annualized capital cost of ownership It is this decreasing annualized capital cost (the largest of all vehicle life-cycle costs) that accounts for the downward sloping curve through age 14 At the same time increasing vehicle age is also accompanied by increasing operating and maintenance costs (vehicles require more frequent repairs as they age) an effect that is captured by the slow rise in costs that becomes apparent in this chart after vehicle age 14 (Note At age 14 in this chart the savings from spreading capital costs over a greater number of service years is overtaken by the increase in annual OampM costs) Together the combined impacts of decreasing annualized capital costs and increasing operating costs as vehicle age increases yields a ldquoUrdquo shaped curve with a cost minimum Finally the bumps in this curve around ages six and seven
7 More precisely annualized cost is not the actual cost divided by the number of years of service (eg acquisition cost vehicle age) Rather annualized cost represents the stream of annual payments the net present value of which are equivalent to the initial investment cost Specifically the annualized cost of the vehicle acquisition cost for any age is given by
minus Vehicle Age )(Acquisition Cost ) (i (1minus (1+ i) ( ))
Federal Transit Administration 92
Useful Life of Transit Buses and Vans Chapter 7 Final Report Life-Cycle Cost Analysis
capture the cost of major component replacement and overhaul activities (eg drive train replacement) costs that become less apparent at later vehicle ages as they are also spread over an increasing number of years of service
This brief discussion is intended to provide a high-level overview of the application of minimum life cycle analysis to transit buses and vans A more detailed explanation and analysis can be found in Appendix D (minimum life-cycle cost methodology) Appendix E (details of the life-cycle cost analysis for heavy-duty vehicles) and Appendix F (transit vehicle life-cycle cost data)
Minimum Life-Cycle Cost Analysis Results 40-Foot Buses
The results of the minimum life-cycle cost analysis for 40-foot heavy-duty buses is presented in Table 7-1 Each row provides the age and mileage at which the minimum life-cycle cost point is reached depending on (1) the average annual vehicle mileage and (2) whether or not the vehicle undergoes agency performs a major mid-life overhaul (versus ldquocontinuous rehabilitationrdquo) For each of these six cases the minimum life-cycle cost is attained at or after the current FTA 12shyyear minimum (see below) For the single case where the cost minimum occurs right at the 12shyyear age (ie vehicles with 45000 annual miles) the cost minimum is attained at 540000 miles thus exceeding the 500000-mile minimum requirement Recall here that the average annual vehicle mileage for 40-foot buses is just over 35000 miles
Table 7-1 Minimum Life-Cycle Cost Replacement Ages
40-Foot 12-Year500000-Mile Bus
Annual Vehicle Mileage
Agency Performs Major Mid-Life Overhaul
Agency Performs Continuous Vehicle Rehabilitation
Minimum Life-Cycle Cost Age
Minimum Life-Cycle Cost Mileage
Minimum Life-Cycle Cost Age
Minimum Life-Cycle Cost Mileage
25000 16 400000 17 425000 35000 14 490000 14 490000 45000 12 540000 12 540000
The analysis in Table 7-1 considers the minimum life-cycle cost for three specific annual vehicle mileagesmdash25000 35000 (the national average) and 45000 annual vehicle miles Figure 7-6 provides the ages and life-to-date mileages at which life-cycle costs are minimized for vehicles traveling between 20000 and 70000 miles annually The solid bars and left-side axis present the ages at which life-cycle costs are minimized for this range of annual vehicle mileages The solid line and right-hand axis present the life-to-date mileages at which life-cycle costs are minimized
Review of Figure 7-6 suggests that from a cost-effectiveness perspective FTArsquos current retirement minimums (for large buses) of 12 years or 500000 miles represent reasonable choices For all annual vehicle mileages the minimum cost point is attained at either an age or mileage that exceeds one or both of the FTA minimums for these measures In all cases the difference between one and both of the current FTA minimum requirements also provides some
Federal Transit Administration 93
Useful Life of Transit Buses and Vans Chapter 7 Final Report Life-Cycle Cost Analysis
margin for the early retirement of vehicles with reliability problems For example vehicles traveling an average of 40000 miles per year could reach their cost minimums at age 13 and a LTD (life to date) mileage of 520000 miles Hence this provides a ldquomarginrdquo of one year or 20000 miles of optimal service beyond the FTA minimum for an average vehicle or the option to reduce service life by these amounts for less reliable vehicles Moreover this difference between the 12-year and 500000-mile minimum is smallest (while still providing a meaningful early retirement margin) for vehicles that average between 30000 and 45000 miles of travel per year Together these vehicles account for more than 70 percent of the nationrsquos large buses
Figure 7-6
Age and Mileage at Which Life-Cycle Cost Is Minimized (Single Mid-Life Rehabilitation or Single Drive Train Replacement)
20
20000 25000 30000 35000 40000 45000 50000 55000 60000 65000 70000
Average Annual Mileage
Age Minimum Life Cost is Attained Life to Date Miles Minimum Life Cost is Attained
FTA Mileage Minimum
FTA Age Minimum
Average Annual Mileage
700000
18 600000
16
500000 14
12 400000
10
300000 8
6 200000
4 100000
2
0 0
Vehi
cle
Age
Life
-Cyc
le C
ost I
sM
inim
ized
(Yea
rs)
Vehicle LTD M
iles Life-Cycle
Cost Is M
inimized
Other Bus and Van Types
The preceding analysis has focused entirely on the life-cycle cost attributes of a standard 12shyyear 40-foot bus This section provides a summary analysis of all remaining bus and van types (with their current FTA retirement minimums) including bull Articulated buses (12-year 500000-LTD-mile minimum) bull Heavy-duty small buses (10-year 350000-LTD-mile minimum) bull Medium-duty small buses (7-year 200000-LTD-mile minimum) bull Light-duty mid-size buses and vans (5-year 150000-LTD-mile minimum) bull Light-duty small buses and vans (4-year 100000-LTD-mile minimum)
This analysis is founded on both data collected for this study as well as data available from similar analyses (including an analysis of small and medium-sized bus operators located in downstate Illinois) Again while these data sources have provided good quality vehicle
Federal Transit Administration 94
Useful Life of Transit Buses and Vans Chapter 7 Final Report Life-Cycle Cost Analysis
purchase and rehabilitation cost data the sources lack depth It is recommended that future useful-life studies devote increased resources to ensure a more robust data sample
Articulated Buses
Table 7-2 presents the ages and LTD mileages at which life-cycle costs for articulated buses reach their minimum Here each row provides the age and mileage at which the minimum life-cycle cost point is reached depending on the average annual vehicle mileage and on whether or not the agency performs a major mid-life overhaul (versus ldquocontinuous rehabilitationrdquo) Overall the minimum cost ages and mileages as well as the optimal overhaulrebuild assumptions are the same for articulated buses as that found for 40-foot buses
Table 7-2 Articulated Bus (60 Foot) ndash Minimum Life-Cycle Cost Replacement Ages
Annual Vehicle Mileage
Agency Performs Major Mid-Life Overhaul
Agency Performs Continuous Vehicle Rehabilitation
Minimum Life-Cycle Cost Age
Minimum Life-Cycle Cost
Mileage Minimum Life-Cycle Cost Age
Minimum Life-Cycle Cost
Mileage
25000 19 475000 17 425000 35000 14 490000 14 490000 45000 12 540000 12 540000
Figure 7-7 Age and Mileage at Which Life-Cycle Cost Is Minimized
Articulated Bus
Age
Life
-Cyc
le C
ost I
s
Min
imiz
ed (Y
ears
)
18
16
14
12
10
8
6
4
2
0
FTA Mileage Minimum
FTA Age Minimum
Average Annual Mileage 600000
500000
400000
300000
200000
100000
0
LTD Miles Life-C
ycle Cost Is M
inimized
25000 35000 45000
Average Annual Mileage Age Minimum Life Cost is Attained Life to Date Miles Minimum Life Cost is Attained
Figure 7-7 charts the results from Table 7-2 along with the current FTA minimum age and mileage requirements This chart suggests that FTArsquos current age and mileage minimums are appropriate when assessed from the viewpoint of minimizing total life-cycle costs This is based on the fact that (1) all vehicles regardless of annual average mileage attain their minimum life-cycle point at an age or LTD mileage that exceeds the existing FTA minimums and (2) in all
Federal Transit Administration 95
Useful Life of Transit Buses and Vans Chapter 7 Final Report Life-Cycle Cost Analysis
cases the current FTA age and mileage minimums provide a margin for early retirement of problem vehicles (ie vehicles with above average expenses andor reliability issues) Note that the national average annual mileage for US articulated buses is 31900 miles per year
Heavy-Duty Small Buses (10-year 350000-LTD-mile minimum)
Table 7-3 presents the ages and LTD mileages at which life-cycle costs for small heavy-duty buses reach their minimum Similarly Figure 7-8 charts the results from Table 7-3 along with the current FTA minimum age and mileage requirements This analysis again suggests that FTArsquos current age and mileage minimums are appropriate when assessed from the viewpoint of minimizing total life-cycle costs Again all vehicles regardless of annual average mileage attain their minimum life-cycle point at an age andor LTD mileage that exceeds the existing FTA minimums and in all cases the current FTA age and mileage minimums provide a margin for early retirement of problem vehicles The national average annual mileage for US heavy-duty small buses is 35400 miles per year
Table 7-3 10-Year Heavy-Duty Small Bus ndash
Minimum Life-Cycle Cost Replacement Ages
Annual Vehicle Mileage
Agency Performs Continuous Vehicle Rehabilitation
Minimum Cost Age Minimum Cost Mileage
Full Drive Train Replacement
25000 12 300000 No 35000 11 385000 Yes 45000 11 495000 Yes
The analysis selects the minimum cost age and mileage for that drive train replacement option (ie replace or do not replace) that provides the lowest minimum total life-cycle cost
Figure 7-8 Age and Mileage at Which Life-Cycle Cost Is Minimized
Heavy-Duty Small Buses
0
2
4
6
8
10
12
14
Age
Life
-Cyc
le C
ost I
sM
inim
ized
(Yea
rs)
0
100000
200000
300000
400000
500000
600000
LTD Miles Life-Cycle
Cost Is Minim
ized
FTA Mileage Minimum
FTA Age Minimum
Average Annual Mileage
25000 35000 45000
Average Annual Mileage Age Minimum Life Cost is Attained Life to Date Miles Minimum Life Cost is Attained
Federal Transit Administration 96
Useful Life of Transit Buses and Vans Chapter 7 Final Report Life-Cycle Cost Analysis
Medium-Duty Small Buses (7-year 200000-LTD-mile minimum)
Table 7-4 presents the ages and LTD mileages at which life-cycle costs for small medium-duty buses reach their minimum while Figure 7-9 charts these results along with the current FTA minimum age and mileage requirements As with the larger vehicle types this analysis finds that (1) all vehicles regardless of annual average mileage attain their minimum life-cycle point at an age andor LTD mileage that exceeds the existing FTA minimums and (2) in all cases the current FTA age and mileage minimums provide a margin for early retirement of problem vehicles
Table 7-4 7-Year Medium-Duty Small Bus ndash
Minimum Life-Cycle Cost Replacement Points
Annual Vehicle Mileage
Agency Performs Continuous Vehicle Rehabilitation
Minimum Cost Age Minimum Cost Mileage
Full Drive Train Replacement
25000 9 225000 No 35000 8 280000 Yes 45000 7 315000 Yes
The analysis selects the minimum cost age and mileage for the drive train replacement option (ie replace or do not replace) that provides the lowest minimum total life-cycle cost
Figure 7-9 Age and Mileage at Which Life-Cycle Cost Is Minimized
Medium-Duty Small Bus
0
1
2
3
4
5 6
7
8
9
10
Age
Life
-Cyc
le C
ost I
sM
inim
ized
(Yea
rs)
0
50000
100000
150000
200000
250000
300000
350000
LTD Miles Life-Cycle
Cost Is Minim
ized
FTA Mileage Minimum
FTA Age Minimum
Average Annual Mileage
25000 35000 45000
Average Annual Mileage Age Minimum Life Cost is Attained Life to Date Miles Minimum Life Cost is Attained
One difference here is the fact that minimum life-cycle cost points for all three of the annual vehicle mileage groupings considered here (25000 35000 and 45000 miles per year) meet or exceed both the current FTA minimum age requirement and the current minimum LTD mileage requirement Despite this observation there does not appear to be significant justification for revising the existing FTA minimums (ie using minimum life-cycle cost as a criterion) The national average annual mileage for medium-duty small buses is 32800 miles per year
Federal Transit Administration 97
Useful Life of Transit Buses and Vans Chapter 7 Final Report Life-Cycle Cost Analysis
Light-Duty Mid-Size Buses and Vans (5-year 150000-LTD-mile minimum)
Table 7-5 presents the ages and LTD mileages at which life-cycle costs for light-duty mid-size buses and vans reach their minimum while Figure 7-10 charts the results for these vehicles along with their current FTA minimum age and mileage requirements (Note here that the annual vehicle miles of travel groupings have all dropped by 5000 miles as compared to the prior charts reflecting the lower average annual mileages for light-duty vehicle types)
Table 7-5 5-Year Light-Duty Mid-Size Buses and Vans ndash Minimum Life-Cycle Cost Replacement Points
Annual Vehicle Mileage
Agency Performs Continuous Vehicle Rehabilitation
Minimum Cost Age Minimum Cost Mileage
Full Drive Train Replacement
20000 7 140000 No 30000 6 180000 No 40000 5 200000 No
This analysis selects the minimum cost age and mileage for the drive train replacement option (ie replace or do not replace) that provides the lowest minimum total life-cycle cost
Figure 7-10 Age and Mileage at Which Life-Cycle Cost Is Minimized
Light-Duty Medium-Size Buses and Vans
0
1
2
3
4
5
6
7
8
Age
Life
-Cyc
le C
ost I
sM
inim
ized
(Yea
rs)
0
50000
100000
150000
200000
250000
LTD Miles Life-Cycle
Cost Is Minim
ized
FTA Mileage Minimum
FTA Age Minimum
Average Annual Mileage
20000 30000 40000
Average Annual Mileage Age Minimum Life Cost is Attained Life to Date Miles Minimum Life Cost is Attained
As before this analysis finds that (1) all vehicles regardless of annual average mileage attain their minimum life-cycle point at an age andor LTD mileage that exceeds the existing FTA minimums and (2) in all cases the current FTA age and mileage minimums provide a margin for early retirement of problem vehicles Compared to the vehicle types considered above one difference here is that the minimum cost ages and mileages for all vehicle types (based on this analysis) are associated with the scenario where there is no engine replacement over the life of
Federal Transit Administration 98
Useful Life of Transit Buses and Vans Chapter 7 Final Report Life-Cycle Cost Analysis
the vehicle (in contrast for the vehicle types considered above the lowest life-cycle cost points for vehicles with average and higher annual mileages were associated with the full drive-train replacement option) The national average annual mileage for light-duty mid-size buses and vans is 29500 miles per year
Light-Duty Small Buses and Vans (4-year 100000-LTD-mile minimum)
Table 7-6 presents the ages and LTD mileages at which life-cycle costs for light-duty small buses and vans reach their minimum while Figure 7-11 charts this information along with the FTA minimum age and mileage requirements Again this analysis finds that (1) all vehicles regardless of annual average mileage attain their minimum life-cycle point at an age andor LTD mileage that exceeds the existing FTA minimums and (2) in all cases the current FTA age and mileage minimums provide a margin for early retirement of problem vehicles Each of the three vehicle mileage examples (20000 30000 and 40000 per year) has minimum life-cycle cost mileages that exceed the FTA minimum retirement requirement of 100000 LTD miles The national average annual mileage for light-duty small buses and vans is 28500 miles per year
Table 7-6 4-Year Light-Duty Small Buses and Vans ndash
Minimum Life-Cycle Cost Replacement Points Annual Vehicle Mileage
Agency Performs Continuous Vehicle Rehabilitation
Minimum Cost Age Minimum Cost Mileage Full Drive Train Replacement
20000 6 120000 No 30000 5 150000 No 40000 4 160000 No
This analysis selects the minimum cost age and mileage for that drive-train replacement option (ie replace or do not replace) that provides the lowest minimum total life-cycle cost
Figure 7-11 Age and Mileage at Which Life-Cycle Cost Is Minimized
Light-Duty Small-Size Buses and Vans
0
1
2
3
4
5
6
7
Age
Life
-Cyc
le C
ost I
s M
inim
ized
(Yea
rs)
0
20000
40000
60000
80000
100000 120000
140000
160000
180000
200000
LTD Miles Life-C
ycle Cost Is M
inimized
FTA Mileage Minimum
FTA Age Minimum
Average Annual Mileage
20000 30000 40000
Average Annual Mileage Age Minimum Life Cost is Attained Life to Date Miles Minimum Life Cost is Attained
Federal Transit Administration 99
Useful Life of Transit Buses and Vans Chapter 7 Final Report Life-Cycle Cost Analysis
Life-Cycle Cost Analyses of Changes to FTArsquos Service-life Policy
In addition to identifying the financially optimal retirement point for each bus and van category a related study objective was to consider other potential financial implications of or changes to FTArsquos minimum service-life policy Specifically this includes finding answers to the following questions
bull How would an increase or decrease in FTArsquos minimum service-life requirements impact transit industry finances including annual replacement expenditures and agency operating costs
bull How does the continuing addition of new technologies affect the financially optimal useful life
The following sub-sections consider each of these questions
Financial Impacts of More and Less Frequent Bus Replacement Industry Perspective
This sub-section seeks to answer the first question from the perspective of the transit industry as a whole Specifically how would an increase or decrease in FTArsquos minimum service-life requirements affect vehicle replacement at the industry level The analysis first considers the case of a two-year reduction in the FTA minimum service-life requirements for large heavy-duty buses (ie from 12 to 10 years) and then repeats this analysis for a two-year increase in the minimum age requirements for that vehicle type (from 12 to 14 years) The impact of these changes from the agency perspective is considered in the next sub-section
Reduction in Minimum Life from 12 to 10 Years As discussed in prior sections of this report very few of the nationrsquos transit operators are likely to reduce their current vehicle retirement ages if FTA were to reduce the current retirement minimums by one or two years This is because the vast majority of the nationrsquos operators retire their heavy-duty buses two to four years after the retirement minimums have been reached due to financial constraints Hence any reduction in FTArsquos minimum useful life would only impact those few operators whose retirement decisions are in fact constrained by the existing service-life policy and the resulting industry-wide cost impact of that change would be very small
To emphasize this point refer back to Figure 4-1 Based on the analysis presented there roughly 6 percent and potentially as much as 10 percent of all retirements for heavy-duty buses occur right at vehicle age 12 This translates to an average of roughly 200 to 300 vehicle retirements per year for which the time of retirement is potentially constrained by FTArsquos minimum life requirements Suppose now that the minimum retirement age for heavy-duty buses was reduced two years (ie from 12 to 10 years) Assuming that all vehicles currently retired right at the current 12-year minimum shifted to the new 10-year minimum (an unlikely event as some of these operators will also face funding constraints or state and local minimum life requirements) then the long-term average annual replacement rates for these operators would increase from 200 to 300 vehicles annually to 240 to 360 vehicles annually an increase of 40 to 60 additional
Federal Transit Administration 100
Useful Life of Transit Buses and Vans Chapter 7 Final Report Life-Cycle Cost Analysis
vehicles per year8 Given that deliveries of new buses have averaged roughly 3000 per year over the past decade and the industryrsquos estimated total vehicle production capacity of 7500 to 10000 vehicles the addition of 40 to 60 additional new vehicles resulting from a two-year reduction in the heavy-duty vehicle minimum life requirement is far from significant
Increase in Minimum Life from 12 to 14 Years In contrast an increase in the minimum retirement age would force about 825 annual vehicle retirements (roughly 20 percent of the total) to be postponed by one or two years Assuming that all vehicles currently retired at age 12 or 13 would now be retired at the new 14-year minimum the long-term average annual replacement rates for these operators would decrease from roughly 825 vehicles annually to roughly 700 vehicles annually a decrease of 125 vehicles per year9
Once again the impact of this change on an industry that delivers roughly 3000 per year is not significant It is critical to understand however if the minimum life were extended past 14 years of age (eg to ages 15 16 or more) the impact on the industry would quickly become very significant particularly for vehicle manufacturers
Financial Impacts of More and Less Frequent Bus Replacement Agency Perspective
Consider the impact now from the viewpoint of an individual transit operator that currently retires its vehicles at 12 years of age and would reduce that retirement age to 10 years if permitted by FTA policy Here earlier vehicle retirement would increase that agencyrsquos vehicle-related capital costs but would also reduce the agencyrsquos operating costs (as newer vehicles require less maintenance) What then would be the net impact of this two-year reduction in FTArsquos replacement age minimum for operators of this type Table 7-7 answers this question using the life-cycle cost analysis discussed in the preceding sections of this chapter Specifically this analysis shows the annualized costs of capital and major component replacement costs and operating and maintenance costs for retirement at ages 12 and 10 and the differences in these costs As expected earlier retirement increases annualized capital and component costs and decreases annualized operating costs The net impact is a $3600 increase in annualized costs from retiring at age 10 versus age 12 Roughly speaking this implies that the total annual cost of vehicle operationsmdashincluding capital major component replacement and OampM costs (and taking discounting into effect)mdashwould be roughly $3600 higher for agencies retiring their vehicles at age 10 than for those retiring their vehicles at age 12 This amounts to more than a four percent increase in annual vehicle-related costs
8 This analysis excludes the initial ldquobumprdquo in vehicle replacements of roughly 400 to 600 vehicles that would occur in the first year the policy took effect
9 This analysis excludes the initial postponement of roughly 800 or more vehicles that would occur in the first two years the policy took effect
Federal Transit Administration 101
Useful Life of Transit Buses and Vans Chapter 7 Final Report Life-Cycle Cost Analysis
Table 7-7 Annualized Vehicle Costs ndash Large Heavy-Duty Bus
Per Vehicle Impact of Reducing Vehicle Retirement Age from 12 to 10 Years
Cost Element Annualized Costs for Retirement at Age 12 Age 10 Change
Capital Costs and Major Component Replacement Costs $60700 $66300 + $5600
Operating and Maintenance Costs $27000 $25000 - $2000 Total $87700 $91300 + $3600
Assumes vehicle averaging 35000 miles per year
What then would be the impact of increasing the minimum retirement age for heavy-duty vehicles from 12 to 14 years (for example) The answer to this question is addressed in Table 7-8 Later retirement decreases annualized capital and component costs and increases annualized operating costs The net impact is a $2800 decrease in annualized costs from retiring at age 14 versus age 12 Roughly speaking this implies that the total annual cost of vehicle operations would be roughly $2800 lower for agencies retiring their vehicles at age 14 than for those retiring their vehicles at age 12 This amounts to more than a three-percent drop in annual vehicle-related costs
Table 7-8 Annualized Vehicle Costs ndash Large Heavy-Duty Bus
Per Vehicle Impact of Increasing Vehicle Retirement Age From 12 to 14 Years
Cost Element Annualized Costs for Retirement at Age 12 Age 14 Change
Capital Costs and Major Component Replacement Costs $60700 $55700 - $5000
Operating and Maintenance Costs $27000 $29200 + $2100 Total $87700 $84900 - $2800
Assumes vehicle averaging 35000 miles per year
Impact of New Bus Technologies on the Financially Optimal Retirement Age
The next question to be addressed is How does the continuing addition of new technologies affect the financially optimal useful life In considering this question it is important to understand that any increase in vehicle capital costs will tend to increase the financially optimal retirement age while any increase in operating and maintenance costs will tend to decrease the optimal retirement age The net change depends on which of these two impacts is larger This interaction is presented in Figure 7-12
With respect to new technologies such as AVL APCs voice annunciation security cameras and collision avoidance systems the increase in vehicle purchase price is dependent on which specific technologies are included in a new bus specification Adding most or all of these components can be expected to increase the price of the bus by roughly $30000 to $50000 Assuming these technology components have life cycles comparable to that of the bus itself yields a roughly 10-percent to 15-percent increase in the annualized vehicle capital cost In the absence of any change to operating costs the life-cycle analysis shows that this increase does not
Federal Transit Administration 102
Useful Life of Transit Buses and Vans Chapter 7 Final Report Life-Cycle Cost Analysis
impact the optimal vehicle retirement age In fact vehicle capital cost needs to increase by up to $200000 to alter the financially optimal retirement age by even one year (upward)10
Figure 7-12 Impact of Changes in Capital and Operating Costs on Minimum Life-Cycle Cost
Increase in Purchase and Operating Costs
$000
$050
$100
$150
$200
$250
100000 200000 300000 400000 500000 600000 700000 800000 Vehicle Age
Cos
t Per
Mile
Capital OampM
Change in Optimal Useful Life
Increase in Vehicle Purchase Cost
$000
$050
$100
$150
$200
$250
100000 200000 300000 400000 500000 600000 700000 800000 Vehicle Age
Cos
t Per
Mile
Capital (Old) Capital (New) OampM Costs
Increase in Optimal Useful Life
Increase in Purchase Cost
Increase in Vehicle Operating Costs
$000
$050
$100
$150
$200
$250
100000 200000 30 0 700000 800000 Vehicle Age
Cos
t Per
Mile
0000 400000 500000 60000
Capital OampM Costs (Old) OampM Costs (New)
Decrease in Optimal Useful Life
Increase in OampM Costs
Similarly operators investing in these new technologies now anticipate increased costs to maintain these new systems (either directly by operator staff or through vendor maintenance agreements) Even if it is assumed that these costs add 20 percent to annual vehicle OampM costs (a rather conservative assumption) there is still no impact on the optimal retirement ages identified earlier in this chapter However the key unknown in this analysis is how these operating costs change with time Most agencies anticipate that these new technologies will begin to fail at an increasing rate as the vehicle approaches 12 or more years of revenue service With multiple systems in place these failures may have significant impacts on an agencyrsquos ability to make their peak-period pullout requirements However none of these systems has been in place for a sufficiently long time to have reliable cost data for these systems at the more advanced bus ages (ie age 12 or higher) It can be noted however that based on the cost analysis performed for this study vehicle OampM costs would need to increase by more than one-third before the cost impact of these new technologies would alter the financially optimal retirement age by even one year (downward)
10 This because of the very flat shape of the annualized capital cost curve
Federal Transit Administration 103
Useful Life of Transit Buses and Vans Chapter 7 Final Report Life-Cycle Cost Analysis
Vehicle Physical Condition versus Minimum Cost Retirement Age
Heavy-Duty Large Buses
The analysis above considers the point in the asset life cycle at which annualized life-cycle costs are minimized This provides an assessment of useful life based entirely on cost effectiveness and hence without reference to vehicle condition or quality of service In contrast to this approach Figure 7-13 presents measures of vehicle physical condition (and by association vehicle quality of service ldquoesthetic qualityrdquo reliability and potentially safety) as a function of vehicle age for medium- to large-size transit buses (ie 35 to 60 feet) This bus condition-decay curve was developed for FTArsquos TERM model and the details of this process were presented at the end of the last chapter The scale ranges from a perfect score of 50 (excellent) to 40 (good) 30 (adequate) 20 (substandard) and 10 (poor) In practice most agencies retire their large buses somewhere between the conditions 20 to 30
Within Figure 7-13 the solid center line represents the average physical condition of vehicles with roughly 35000 in annual mileage (and average maintenance practices) The upper line represents the projected condition of vehicles with lesser mileage (25000 miles per year) while the lower dotted line represents those with above-average mileage (45000 miles per year) Unlike the minimum life-cycle cost analysis above there is no obvious point at which vehicles should be retired Rather vehicle decay is a gradual decline in physical condition where the selection of a specific retirement point is necessarily arbitrary
Figure 7-13
Bus Physical Condition Versus Age 50
45
40
35
30
25
20
15
10
35000 miles per year
25000 miles per year
45000 miles per year
Vehicle Condition at Minimum Life-Cycle Cost
0 1 2 3 4 5 6 7 8 9 10 11 12 13 14 15 16 17 18 19 20 21
Vehicle Age (Years)
Phys
ical
Con
ditio
n
Federal Transit Administration 104
Useful Life of Transit Buses and Vans Chapter 7 Final Report Life-Cycle Cost Analysis
However when the minimum life-cycle ages are plotted on Figure 7-13 (as red circles) these retirement points are located at reasonable condition valuesmdashafter vehicle condition begins to decline below ldquoadequaterdquo (30) but before the vehicle attains the ldquosubstandardrdquo designation (20) The lower condition value for vehicles with higher mileages (ie condition of the 35000 annual mileage vehicle at minimum life-cycle cost is higher than that of the 45000 annual mileage vehicle) is a reflection of the higher LTD mileages attained by these vehicles at the minimum cost points (ie 425000 miles for vehicles traveling 25000 miles per year 490000 miles for vehicles traveling 35000 miles per year and 540000 miles for vehicles traveling 45000 miles per year)
For the viewpoint of reconsidering vehicle useful life and FTArsquos minimum life requirements this cross-referencing of the minimum life-cycle cost and condition model approaches suggest that the minimum life-cycle cost ages (and mileages) represent reasonable optimal retirement ages (both in terms of cost-effectiveness and retirement occurring at a reasonable condition value) More importantly these optimal retirement ages (and some mileages) occur after the current FTA-required retirement minimums of 12 years or 500000 miles is satisfied Conversely the current FTA retirement minimums provide some margin for the early retirement of lower-reliability vehicles
All Bus and Van Categories
Figure 7-14 identifies the condition values at which all bus and van vehicle categories attain their minimum life-cycle cost based on total LTD mileage (and not age) As with Figure 7-13 this chart also indicates the differing condition values at the minimum cost point within a given vehicle type (eg heavy-duty small bus) Specifically the blue circles indicate the mileage and condition at which minimum life-cycle cost is attained for vehicles with low average annual mileage for that specific vehicle type The yellow and red circles capture the same mileages and conditions for vehicles with average and high annual mileages respectively
As in Figure 7-13 the minimum life-cycle cost points for the three average annual mileage scenarios all occur at condition values less than adequate but typically well above substandard Hence all these retirement points are ldquologicalrdquo in that they occur after the vehiclersquos condition has begun to show signs of age but before the vehicle begins to experience significant quality of service reliability or potential safety issues (as is expected for vehicles with condition ratings less than 20 or ldquosubstandardrdquo) Again it is important to emphasize that the points represented here are founded on the objective of minimizing total life-cycle cost In practice different transit operators or the federal and state governments may wish to target useful-life standards based on other objective criteria (eg a minimum quality of service)
Federal Transit Administration 105
Useful Life of Transit Buses and Vans Chapter 7 Final Report Life-Cycle Cost Analysis
Figure 7-14
Condition At Which Minimum Life-Cycle Cost is Attained
10
15
20
25
30
35
40
45
50
0 100000 200000 300000 400000 500000 600000 700000
Life-to-Date Miles
Phys
ical
Con
ditio
n
Heavy-Duty Large Bus (12 year)
Heavy-Duty Small Bus (10 year)
Medium-Duty and Purpose Built (7 year)
Light-Duty Mid-Size BusVan (5 year)
Light-Duty Small Bus Van (4 year)
Excellent
Good
Adequate
Substandard
Poor
= Low annual milage vehicle
= Average annual milage vehicle
= High annual milage vehicle
Condition at Which Minimum Life-Cycle Cost is Attained For
Vehicle Age Service Reliability and Ridership
While transit riders are known to have a clearly stated preference for newer cleaner transit vehicles the study team was unable to identify any empirically based studies providing a quantitative relationship between vehicle age (or condition) and vehicle ridership This despite the very extensive literature on the responsiveness of travel demand to many different factors (including elasticities for service price service frequency and travel time and cross elasticities for gas and differences in travel time) Hence while the qualitative response to newer vehicles is well documented (ie riders prefer newer vehicles and state that they are more apt to use transit given a newer cleaner fleet) the quantitative ridership response to changes in fleet age or condition are not well documented Given the lack of information on this subject the study has focused on the direct ridership impacts of decreasing vehicle reliability with vehicle age as a means of addressing the issue of the ridership response to changes in vehicle condition
Road Calls
As bus vehicles age the probability of mechanical failures increases leading ultimately to increased service disruptions for system riders Figure 7-15 demonstrates the relationship between vehicle age and the number of road calls per vehicle mile (the inverse of mean distance between failures) for full-size transit buses This relationship was developed using actual road call data from a sample of five US transit operators11 Each point on this chart represents the average failure rate (over a 12-month period) for all vehicles in a given sub-fleet for one of these operators For this analysis a road call was defined as an in-service failure causing a vehicle to
11 At the request of these operators their names have been excluded from this presentation
Federal Transit Administration 106
Useful Life of Transit Buses and Vans Chapter 7 Final Report Life-Cycle Cost Analysis
be pulled from service (and hence resulting in a service disruption for system riders) The estimated relationship clearly captures the increasing likelihood of in-service failures as bus vehicle age increases The surrounding data points similarly capture the wide variability in vehicle reliability resulting from both differences in the inherent reliability of different vehicle models differences in service environment and differences in vehicle maintenance practices
Figure 7-15
Road Calls Per Mile (Agency Sub-Fleets)
00000
00001
00002
00003
00004
00005
00006
0 2 4 6 8 10 12 14 16 18 20 Vehicle Age (Years)
Roa
d C
alls
Per
Mile
As with the presentation of declining condition above this analysis does not suggest a specific point in the asset life cycle at which bus vehicles should be retired (note also that the repair costs associated with these in-service failures are already captured in the minimum life-cycle cost analysis above) However this analysis does emphasize the negative service reliability implications of increasing fleet age
Vehicle Age Reliability and Ridership
As transit buses age their appearance and ride quality typically decline with potential negative impacts for system ridership (ie some riders may select an alternative to buses if bus vehicle condition falls below some acceptable threshold) Unfortunately no prior research has been identified that assesses the impact of fleet age on system ridership12 However from the relationship presented in Figure 7-15 it is clear that increasing vehicle age does lead to an increased frequency of road calls and consequently to service disruptions for the sub-group of riders impacted by those road calls Figure 7-16 uses the vehicle age and road calls relationship presented in Figure 7-15 to estimate the annual number of riders directly impacted by bus service failures for agencies with fleets of various sizes (ie 100 500 and 1000 buses) These
12 The study team conducted a statistical analysis specifically for this project comparing average vehicle loadings with average fleet age using NTD data to determine whether increasing average fleet has any impact on system ridership This analysis did not identify a statistically significant relationship between these two measures
Federal Transit Administration 107
Useful Life of Transit Buses and Vans Chapter 7 Final Report Life-Cycle Cost Analysis
calculations assume an average annual vehicle mileage for these fleets of 35000 miles per bus They also assume an average bus passenger load of 68 riders (hence on average 68 riders are directly impacted by each road call or service disruption event)13 This chart shows that increasing fleet age clearly has a significant impact on the number of riders experiencing a road call event especially for the nationrsquos larger operators
Figure 7-16 presents the total number of riders impacted by road calls for differing average fleet ages However we must also address the incremental impact of a one-year increase in average fleet age Table 7-9 presents this incremental ridership impact for a range of fleet sizes and annual vehicle mileages per vehicle As expected the incremental numbers of riders impacted by road calls from increasing fleet age is highest for the larger transit operators and those with the highest annual mileage per vehicle
Figure 7-16
Number of Riders Impacted By Road Calls by Average Fleet Age
0
10000
20000
30000
40000
50000
60000
70000
80000
90000
100000
0 1 2 3 4 5 6 7 8 9 10 11 12 13 14 15 16 17 18 19 20
Average Fleet Age (Years)
Ave
rage
Ann
ual N
umbe
r of R
ider
s Im
pact
ed b
y B
us R
oad
Cal
ls
100 Vehicle Fleet 500 Vehicle Fleet 1000 Vehicle Fleet
Table 7-9 Incremental Increase in Annual Number of Riders Impacted By Road Calls from One-Year Increase in Average Fleet Age
Annual Vehicle Mileage Fleet Size 100 Vehicles 500 Vehicles 1000 Vehicles 25000 miles 225 1120 2245 35000 miles 320 1610 3220 45000 miles 565 2823 5645
The final consideration here is the ridership impact of declining service reliability with increasing fleet age If it is assumed that road call andor service disruption events motivate riders to abandon buses in favor of an alternative mode perceived to be more reliable (eg auto) then the numbers in Table 7-9 estimate the maximum potential ridership loss from an increase in
13 The average passenger load of 68 persons represents the average for all US bus fleets reporting to NTD
Federal Transit Administration 108
Useful Life of Transit Buses and Vans Chapter 7 Final Report Life-Cycle Cost Analysis
service failures due to a one-year increase in average fleet age However in most transit markets a significant proportion of bus riders have no viable alternative to bus and hence are unlikely to discontinue bus use after having experienced a road-call event Hence it can be assumed that the actual loss in ridership resulting from increasing in-service failures with increasing fleet age is much smaller than that presented in the table above
From the viewpoint of FTArsquos minimum service life policy the implications are as follows First it has been noted repeatedly throughout this report that very few agenciesrsquo retirement decisions are constrained by the current FTA minimums (retirements that generally occur two or more years after the retirement minimums have been satisfied and the timing of which has been determined by funding constraints) Given this situation it is unlikely that a decrease in the FTA retirement minimums would impact service reliability service quality ridersrsquo transit experiences or actual ridership levels In contrast an increase in the FTA retirement minimums would begin to constrain the vehicle retirement decisions of some transit operators by forcing them to maintain their transit vehicles for a longer period of time (see Figure 4-1) In this case the increase to the minimum retirement ages would negatively impact service quality service reliability riderrsquos transit experiences and potentially actual ridership levels
Federal Transit Administration 109
Useful Life of Transit Buses and Vans Chapter 8 Final Report Prior Useful-life reviews
CHAPTER 8 PRIOR BUS USEFUL-LIFE REVIEWS
This section reviews the results of prior useful-life research conducted by FTA and the Transit Cooperative Research Program (TCRP)
Initial Policy Statement ndash FTA Circular 90301
On June 17 1985 FTA (at that time UMTA) issued a change to its FTA Circular 90301 that incorporated the service-life policy for transit buses This marked the official public announcement of the FTArsquos position on the issue which required transit authorities to operate heavy-duty transit buses for a minimum of 12 years or 500000 miles with a maximum fleet-wide spare ratio of 20 percent FTA officials interviewed during the development of this study stated that the 12-year service-life requirement was not based on any detailed study Rather it was selected based on industryrsquos operating experience or ldquorules of thumbrdquo in maintaining heavy-duty transit buses
1985 Inspector General Statement
The 12-year requirement announced in the FTArsquos circular was not without controversy Later that same year the Inspector General (IG) unsuccessfully challenged the minimum service life policy attempting to increase the service life from 12 to 15 years and increase the spare ratio from 20 to 30 percent
1988 Useful Life of Transit Vehicles Study
In 1988 the FTA sponsored a study entitled ldquoUseful Life of Transit Vehiclesrdquo (UMTA-IT-06shy0322-88-1) This study focused primarily on the mechanical or engineering life of transit buses It excluded other factors such as the economic life ridership impacts and technological obsolescence of the vehicle The engineering analysis was focused on the life expectancy of the vehicle and components and not on any measure of vehicle condition
The key findings of this study were that the availability of capital funds and the FTA 12-year minimum were the main drivers of bus replacement decisions that the average age of retirements was over 16 years and that spare ratios of 20 percent were achievable with good maintenance Recommendations included increasing the minimum requirements to at least 14 years (600000 miles for commuter buses) allowing justified exceptions to the policy and developing a funding policy that encourages the extension of buses beyond their minimum life requirements
The earlier finding that the availability of capital funds is a key driver of fleet retirement decisions is consistent with the findings presented in this report In contrast while the 1987 study identified the 12-year minimums as a primary driver of replacement decisions for heavy-duty vehicles agencies participating in this study rarely referred to the minimums as a decision driver Rather for the current study agency participants suggested that replacement decisions were driven more by funding availability maintenance requirements and quality of service issues
Federal Transit Administration 110
Useful Life of Transit Buses and Vans Chapter 8 Final Report Prior Useful-life reviews
1988 Transit Capital Investment to Reduce Operating Deficits ndash Alternative Bus Replacement Strategies Study
In 1988 a study entitled ldquoTransit Capital Investments to Reduce Operating Deficits ndash Alternative Bus Replacement Strategiesrdquo (National Cooperative Transit Research and Development Program (NCTRP) Report No 15) surveyed several transit agencies to identify the major factors in current and planned bus replacement decisions The survey found that the availability of federal funds and vehicle age are among the top considerations while operating and maintenance cost reductions are typically not considered a driver for vehicle replacement At that time the average planned replacement age for heavy-duty buses for agencies participating in this study was 16 Funding constraints were a major factor in the plans to maintain vehicles in service for this length of time
The 1988 NCTRP Report also looked at the relationship between vehicle age and various components of operating and maintenance costs such as fuel and lubrication engine repairs AC and brakes A key objective of this study was to develop a methodology to incorporate operating costs in vehicle replacement decisions This is based on the studyrsquos hypothesis that the timing and extent of maintenance work affects the retirement age of a vehicle and the retirement decision affects the need for major work The actual study analysis was limited by data availability although the researchers did find a strong correlation between vehicle age and vehicle maintenance and rehabilitation costs The methodology developed by this study was designed to guide transit managers in evaluating the trade-offs between continuing to operate an existing vehicle ldquoas isrdquo replacing it or significantly rehabilitating it
1995 Bus Industry Summit
On September 22 1995 FTA convened a Bus Industry Summit to identify and discuss industry concerns related to FTArsquos bus service-life policy The summit yielded a broad diversity of opinions on vehicle useful life and several suggestions on how FTA might consider altering its service-life requirements For example many summit participants suggested that FTArsquos 12-year service-life standard for 40-foot buses should be reexamined These discussions included suggestions to both lengthen and shorten the minimum service-life requirement
bull 8-Year Bus Some manufacturers suggested moving to an 8-year service-life minimum It was suggested that this would ensure that the latest technological advances could be introduced sooner leading to cleaner lighter safer and more fuel-efficient buses It would also expand the size of the overall market potentially increasing the viability of the domestic transit bus market
bull General Reduction in Service Life Some agency representatives concurred with the general objective of a reduced service-life requirement under the expectation that this would enhance the vehicle thus driving down the base vehicle process and accelerating the adoption of new technologies The anticipated results were improved service quality and a stabilized vehicle market
Federal Transit Administration 111
Useful Life of Transit Buses and Vans Chapter 8 Final Report Prior Useful-life reviews
bull 15-Year Bus FTA staff noted that the US DOT Inspector General considered a 15-year service-life standard because of the lessened need for federal capital funds
bull 18-Year Bus A bus builder noted that Ontario Canada has an 18-year standard with a substantial overhaul scheduled for year 12 The practice of extending vehicle useful life to 18 years or more through enhanced initial design and materials specifications improved maintenance practices and application of more extensive and frequent vehicle rebuild programs has spread throughout Canada due to the lack of national capital funding for bus replacement
bull Flexible Policy Some participants argued that national policy should be flexible and should not be based on a one size fits all service-life standard They argued that a single standard cannot consider differences in ndash Climatic and demographic circumstances ndash Budgetary constraints and priorities of transit operators ndash Overall operating expenses ndash Maintenance practices and maintenance management systems ndash The types of operating systems on buses ndash Rebuilding and replacement policies
These varied responses show that there was no clear consensus among the Bus Industry Summit participants on an optimal minimum service-life policy Also in addition to these suggested changes in overall vehicle useful life it was also pointed out that useful-life issues directly impact decisions concerning the approach to warranty programs Maintenance management systems and rebuilding schedules are also impacted
Overall the meeting highlighted the need for analysis that would consider all of the factors that bear on the relative costs and benefits of moving to an alternative service-life standard For example maintenance and fuel costs the impact on service quality for riders early deployment of new safety efficiency and technical features the health of the bus manufacturing industry and funding impacts on a longer-term basis must be examined when considering changes in current replacement parameters based on a specified useful life
1997 Useful Life of Heavy-Duty Transit Buses Study
In 1997 the FTA sponsored a second study entitled ldquoUseful Life of Heavy-Duty Transit Busesrdquo (TCRP Project J-6 Task 15) This study was commissioned based on feedback from industry received during the FTA-sponsored Bus Industry Summit meeting (see above) This study expanded on the 1988 study by addressing variables such as operating environment regulations technology maintenance practices and operating economics
The purpose of this special study was to review relevant data in order to make recommendations on the appropriateness of the current service-life standard for heavy-duty transit buses The effort included an analysis of factors that impact vehicle life including the operating environment (eg climate terrain annual bus mileage average operating speed and urban suburban or rural)
Federal Transit Administration 112
Useful Life of Transit Buses and Vans Chapter 8 Final Report Prior Useful-life reviews
requirements mandated by the ADA Clean Air Act Amendments and others and the introduction of new technologies (eg alternative fuels advanced electronics)
This study identified duty cycle as likely the most important variable affecting vehicle life with the life of buses decreasing as the severity of the duty cycle increases The study suggested that average operating speed could be used as a proxy for duty cycle severity in future useful-life analyses14 Recommendations included changes to the current service-life policy to consider the total age of the fleet (and not the age of the individual vehicles) and the type of service the vehicle is operated under FTArsquos age and mileage standards were not changed following this study
Other Studies
The following are descriptions of several additional studies that have addressed the issue of transit vehicle useful life
bull In 1995 the New York Metropolitan Transportation Authority Office of the Inspector General published a report evaluating the then-perceived deterioration in the condition of New York City Transitrsquos bus fleet At that time one-third of the fleet was over the 12-year minimum retirement age and older buses were experiencing significant corrosion and parts failures The report attributed the poor conditions to the failure of management to establish and enforce preventive maintenance procedures and poor capital planning to purchase new vehicles and operate and maintain older age vehicles Recommendations emphasized the need for adequate maintenance and inspection policies especially targeted to buses over 12 years of age
bull In 2004 a group of university researchers led by Li et al developed a model to explore the contribution of preventive maintenance to vehicle condition Vehicle condition ratings (or the probability of a vehicle being at a condition rating) were calculated based on the vehiclersquos age mileage and amount of maintenance spending The decision analysis model evaluated the benefitcost ratio of the expected gain from extended life that would result from specific maintenancerepair actions and the associated costs The model developed in this study introduced a quantitative measurement of the expected benefits of maintenance actions on the vehicle life cycle The analysis clearly indicated a relationship between vehicle condition useful life and preventive maintenance practices
bull The 1988 Pennsylvania Department of Transportation (PennDOT) ldquoHandbookrdquo is a guide to assist transit agencies purchasing small transit vehicles The handbook contains information on the characteristics of small transit vehicles PennDOT procurement procedures and optional equipment with technical specifications and costs The expected life reported for standard vans body on chassis vehicles and small buses is 3 to 5 years 5 to 7 years and 10 to 15 years respectively all depending on a number of factors such as operating environment and preventive maintenance programs
14 Note that the analysis in Chapter 7 uses average agency operating speed as a cost driver for OampM costs However this study was unable to demonstrate quantitatively a relationship between decreasing operating speed and decreasing vehicle life expectancy
Federal Transit Administration 113
Useful Life of Transit Buses and Vans Chapter 8 Final Report Prior Useful-life reviews
bull The Small Transit Vehicle economics (STVe) model was developed by a group of university researchers and is designed to support decision-makers purchasing small transit vehicles The model provides an economic evaluation of various types of vehicles given the inputs of operating conditions such as type of service and capacity Types of vehicles listed in Table 8-1 are categorized based on characteristics that affect capital maintenance and operating costs The vehicle categories presented in the table and the expected useful lives for each of these categories are all roughly similar to those currently used by FTA
Table 8-1 Small Transit Vehicle Economics Model
Category Description Approx Seating Capacity
Expected Life+
1 Van 10 ndash 11 4 2 Van Cutaway Single Wheel 13 4
3G Van Cutaway Dual Wheel Gasoline 18 5 3D Van Cutaway Dual Wheel Diesel 18 5 4 Purpose Built Front Engine 22 6 5 Purpose Built Rear Engine 22 7 6 Medium-Duty Low-Floor Front Engine 20 7 7 Heavy-Duty Low-Floor Front Engine Varies 12 8 30 ft Heavy-Duty Bus Varies 12
+ As considered in the STVe model
Comparisons of Past Studies with This Report
Largely the findings of the studies sited above appear to be consistent with the findings reported elsewhere in this report Key common findings between this and prior studies include
bull Transit buses (heavy-duty buses in particular) generally have many years of valuable service life well after the service minimum age has been reached Also operators generally retire their vehicles well past this point in time
bull Vehicle retirement decisions are driven less by the service-life minimums than they are by funding availability maintenance requirements and quality of service issues
bull Economic and engineering analyses suggest that the current FTA service-life minimums are generally appropriate for each of FTArsquos five minimum service-life categories (ie there is no clear need to change the categories or the service-life minimums for each category)
bull Duty cycles (as measured by the average operating speed proxy) are a key driver of vehicle useful life especially for vehicles operated in fixed-route service
bull There are diverse opinions among industry representatives as to the preferred useful life of heavy-duty (ie 12-year) transit vehicles ranging from 8 to 15 years or more
bull There is value in having some flexibility in the application of the service-life minimums to reflect differences in agency service environments and to address the issue of problem vehicles
Federal Transit Administration 114
Useful Life of Transit Buses and Vans Chapter 8 Final Report Prior Useful-life reviews
Other Considerations
In addition to the considerations outlined above review of FTArsquos minimum service-life policy for transit buses and vans can also gain perspective from a brief review of this subject from different perspectives To that end the following sub-sections consider bus useful life from the viewpoints of the New Starts cost-effectiveness evaluation and the experience of Canadian transit agencies operating essentially the same transit buses as their American counterparts but for several additional years of useful life
New Starts Program Impacts
For FTArsquos New Starts program asset useful life values including those for transit vehicles are used to determine the total annualized cost of proposed New Starts investments New Starts projects with low annualized capital costs tend to have more favorable cost effectiveness and net benefit measures relative to those with higher annualized capital costs Hence revisions to FTA minimum service-life standards (the standards also used to annualized vehicle costs for New Starts investments) can have the potentially unexpected impact of lowering or increasing the cost-effectiveness measures for New Starts investments with bus or van components (eg BRT investments) Longer useful life results in increased years that vehicle capital costs will be spread over within the annualized cost calculation thus reducing the projectrsquos cost-effectiveness measure (increasing net benefits)
Note that this issue has already arisen with respect to some BRT designs intended to have a useful life of approximately 18 years Assigning an 18-year minimum useful life value to these vehicles (versus the current 12-year value for large buses) would make these vehicles more competitive with similar rail investments
The Canadian Experience
As already noted Canadian transit authorities do not receive bus replacement funding assistance from their national or provincial governments Because of this Canadian transit agencies tend to operate their buses longer and maintain a larger spare fleet than their US counterparts It is not clear how the service life of Canadian buses is influenced by the lack of Canadian federal assistance versus the fact that these operators have no spare ratio maximum Either way Canadian transit agencies have been operating transit buses with similar designs to US buses for 15 years on a consistent basis and have extended them to the 18-year range through enhanced designs and more extensive component replacement programs
Canadian agencies have also conducted cooperative research efforts into bus designs and the available means to extend useful life through more aggressive design specifications The results of these approaches are evident in the extended useful bus life for these operatorsrsquo vehicle fleets However the extent to which this longer vehicle life is driven by differences in bus design is not fully clear given that these agencies have higher spare ratios providing them with a larger pool of buses to draw from when problems are encountered within an aging fleet The conclusion then
Federal Transit Administration 115
Useful Life of Transit Buses and Vans Chapter 8 Final Report Prior Useful-life reviews
is that vehicle life can be prolonged significantly from the current FTA minimums for large buses The uncertainty is the full costs and service quality implications of extending vehicle life beyond 15 to 16 years
Case Study ndash US versus Canadian Useful Life
The transit bus industries in Canada and the United States use virtually identical vehicles and the services provided are very similar In both countries the majority of agencies are municipal Interestingly three of the six largest North American transit bus manufacturers are Canadian or have significant Canadian-based manufacturing facilities
Table 8-2 Geographic Locations of Major North American Bus Manufacturers
Manufacturer Head Office Canadian Facilities American Facilities
New Flyer Winnipeg MB Winnipeg MB St Cloud MN Crookston MN
Nova Bus St-Eustache PQ St-Francois-du-lac PQ NA Orion Bus Mississauga ON Mississauga ON Oriskany NY
NABI Anniston AL NA Anniston AL Gillig Hayward CA NA Hayward CA
Millennium Roswell NM NA Roswell NM
While there is significant Canadian content in the manufacturing and assembly of the buses the majority of the major components going into the final product specifically the high-dollarhighshyvalue items such as engines transmissions axles and HVAC are all supplied by non-Canadian companies and are almost exclusively US companies In addition exporting to the United States is critical for both New Flyer and Orion who have large US facilities in order to meet the Buy American requirements
Despite the similarities in the vehicles manufactured in the United States and Canada there is a significant difference in agency requirements for useful life As just noted Canadian agencies expect an 18-year useful life versus 12 years in the United Statesmdasha 50-percent increase above the US requirement Other distinguishing characteristics between the US and Canadian markets are reflected in the higher usage and productivity of urban transit in Canada Canadian transit use per capita is 150 percent of the US use (144 billion trips versus 917 billion trips) Of these trips it is estimated that 75 percent are made by bus in Canada compared to just over 60 percent in the United States Government funding (from all levels combined) on a per-capita basis is less than 80 percent of the US level
The buses used in the United States and Canada are virtually identical in design and purchased using similar specifications and procurement approaches Regardless Canadian agencies expect the vehicle to have an 18-year life From our interviews with agencies and manufacturers there are two leading factors driving this difference in expected bus life
1 Federal capital funding for transit is non-existent in Canada Other than intercity rail all transit funding in Canada is a provincial responsibility
Federal Transit Administration 116
Useful Life of Transit Buses and Vans Chapter 8 Final Report Prior Useful-life reviews
2 Provinces have not established long-term funding allocations While annual operating budgets are supplemented there is not an established formula for capital vehicle replacements similar to the FTA
The US agencies interviewed have adapted to the FTArsquos 12-year useful life for transit buses primarily because it is tied to the FTArsquos 80-percent funding Agencies have adjusted their internal funding and planned vehicle replacement schedules to match the established FTA funding streams In Canada where there is no established funding formula for vehicle purchases agencies must plan to keep their vehicles longer Agencies have therefore focused on an 18-year vehicle life
Federal Transit Administration 117
Useful Life of Transit Buses and Vans Chapter 9 Final Report Conclusions
CHAPTER 9 KEY FINDINGS AND RECOMMENDATIONS
Key Findings
Following are key findings from this study
Review of FTArsquos Current Service-life categories
The review of FTArsquos minimum service-life requirements yielded the following key findings
bull The current service-life category groupings are appropriate The study found that the current categories represent logical groupings of vehicles having broadly similar characteristics in terms of construction methods size weight passenger capacities cost manufacturers and customer bases A possible exception here is for 4-year and 5-year vehicles built using cutaway chassis where there is a significant degree of overlap between the two age categories in terms of construction type sizes and manufacturers
bull Transit has little ability to alter bus and van useful-life characteristics cost-effectively Given transitrsquos small share of the vehicle and component markets (typically less than one percent) the transit industry has little ability to influence component useful-life characteristics in a cost-effective manner A key exception here is the structure of 12-year buses To the extent that 12-year bus structures are designed specifically for transit use the transit industry has some leverage to influence this componentrsquos design and durability characteristics
Review of Procurement Regulations with Potential Useful-Life Implications
While many federal regulations (eg Buy America Bus Testing ADA and EPA) and industry procurement practices (third-party contracting) are believed to have potential useful-life implications these implications are generally considered minor relative to the issues of annual mileage new vehicle designs changing life-cycle economics and other drivers of useful life
Analysis of Actual Retirement Ages Using NTD Vehicle Data
The study used NTD data to determine how recent actual retirement ages for transit buses and vans compare with FTArsquos current minimum service requirements for transit buses and vans to determine whether these requirements are affecting the vehicle retirement decisions of the nationrsquos transit operators
bull Most buses and vans retired well after the minimum service age requirement is satisfied On average transit buses and vans are retired between one to three years after their minimum service-life requirement has been satisfied (Table 9-1) In addition a significant proportion of buses and vans remain in service at least one year past the retirement minimum (eg 20 percent of heavy-duty 12-year buses) and with many still in service three or more
Federal Transit Administration 118
Useful Life of Transit Buses and Vans Chapter 9 Final Report Conclusions
years past the minimum requirement (eg one in ten ldquo12-yearrdquo buses in active service are age 15 or older)
Table 9-1 Minimum Versus Average Retirement Age by Vehicle Category
Vehicle Category Minimum Retirement
Age Average Retirement
Age (Years) Share of Active Vehicles that are
One or more years past the retirement minimum
Three or more years past the retirement minimum
12-Year Bus 151 19 9 10-Year Bus 7 4 7-Year Bus 82 12 3
5-Year Bus Van 59 23 5 4-Year Van 56 29 10
Average retirement age estimates for these vehicle categories suffer from small sample issues
bull Minimum service age does not constrain agency vehicle retirement decisions Relatively few transit buses and vans are retired right at the minimum service age requirement Hence the current retirement minimums are not constraining the vehicle retirement decisions of the vast majority of the nationrsquos bus and van operators This indicates that any reduction to the current minimum age requirements (eg from 12 to 10 years for a ldquo12-year busrdquo) would not result in a significant increase in the rates of retirement for the five service-life categories
Industry Outreach
Representatives of local transit operators vehicle manufacturers and private bus fleet operators were interviewed to assess their current experiences with bus and van useful life The following are key findings from this industry outreach process
bull Actual retirement ages generally exceed both FTA minimums and agency service-life policies The actual timing of vehicle retirement for all nine agencies typically occurs between one to four years after the FTA minimum has been reached (but can occur as late as vehicle age 20) Moreover for most agencies the recent actual retirement ages also exceed the planned or policy retirement age Hence it is clear that FTArsquos current minimum service-life requirement is not actively constraining these agenciesrsquo retirement decisions
bull Capital funding availability is the primary determinant of retirement age Limited capital funding was cited as the primary reason why the timing of actual vehicle retirements has exceeded the planned and policy retirement age (and FTA service minimums) Because of this the average fleet age is more likely to be impacted by the increased availability of federal funding than by any relaxation in the minimum service-life requirements Other decision factors included service reliability vehicle condition vehicle maintenance physical and local environmental conditions procurement process and duty cycle (operating speed mainly)
bull Only large agencies operating in severe environments perform scheduled mid-life overhauls Only the larger urbanized agencies interviewed (Massachusetts Bay Transportation Authority New York City Transit Toronto Transit Commission and Washington Metropolitan Area Transit Authority) perform comprehensive ldquomid-liferdquo
Federal Transit Administration 119
Useful Life of Transit Buses and Vans Chapter 9 Final Report Conclusions
overhauls of their heavy-duty cycle vehicles stating that these overhauls are required to obtain full service lives given the tough service environments in which they operate In contrast none of the other agencies interviewed (including Los Angeles Metropolitan Transportation Authority and Houston Metro) regularly complete a mid-life overhaul with most suggesting it is not cost effective for them
bull Most agencies reported not being impacted by FTArsquos service-life requirements Most interviewed agencies stated that their vehicle retirement decisions are not significantly impacted by FTArsquos service-life minimums (these decisions are constrained more by capital funding availability)
bull Extending the service-life requirements would hurt many agencies Conversely most if not all of the agencies reported that they would be negatively impacted if current FTA minimum service lives were extended These negative impacts include a decrease in quality of service (higher rate of failures aesthetic of vehicles reliability) an increase in maintenance costs (between 10 to 50 percent higher) and less leeway to retire ldquoproblemrdquo vehicles
bull Agencies support development of a ldquolemon lawrdquo and a technology demonstration option Interview respondents supported development of a ldquolemon lawrdquo and a technology demonstration option The lemon law concept would permit early retirement of problem vehicles without penalty to the agency Under the technology demonstration concept a grantee could request a similar release from the service-life policy for FTA-approved tests of new vehicle technologies
bull Most agencies were not interested in more or less durable heavy-duty vehicles Most agencies stated that they were not interested in a more durable vehicle (ie with a more expensive heavier weight longer life expectancy structure) This is due to concerns over the cost effectiveness weight and rider comfort for this option All nine agencies also expressed significant concerns with a less durable vehicle (ie with a cheaper lighter weight lower life expectancy structure) There were concerns regarding the expected inability to survive the required duty cycles and the relationship with a decrease in quality and an increase in procurement efforts
Engineering Analysis
The engineering analysis provides further evaluation of bus useful life from a vehicle engineering perspective The following are key findings
bull Useful life is ultimately determined by the life of the vehicle structure Vehicle structure defines the useful life of the vehicle as a whole more than any other single vehicle component Should the structure wear out or fail due to corrosion or a collision then the life of the vehicle is essentially at an end
bull Service environment is a key determinant of structure useful life Many interview participants clearly indicated that service environment is a key determinate of structure (and hence vehicle) useful life Because of this several agencies expressed the desire that FTA revise the service-life requirements definition to include service environment severity along with service years and miles (eg 12 years or 500000 miles)
Federal Transit Administration 120
Useful Life of Transit Buses and Vans Chapter 9 Final Report Conclusions
bull ldquoStick busrdquo and low-floor vehicles may have shorter useful life Interview participants suggested that stick bus (structures constructed using hundreds of welded tubes) and low-floor designs (which use stick construction) may have shorter useful life as compared to traditional designs Interview participants stated that it is too early to tell whether this is in fact the case
Economic Analysis
The economic analysis identified the age for all vehicle categories at which total life-cycle costsmdashincluding all capital operating and maintenance costsmdashare minimized (reflecting the impact of differences in mileage) This analysis identifies a financially optimal retirement point for the vehicle
bull The minimum cost retirement points all occur at or after the FTA minimum service life From a cost-effective perspective FTArsquos current service-life minimumsmdashincluding both the minimum years and miles requirementsmdashrepresent reasonable choices For each service-life category the minimum cost point is attained at either an age or mileage that exceeds one or both of the FTA minimums for these measures
bull Reducing heavy-duty vehicle service life from 12 to 10 years would only have a minimal impact on vehicle sales Assuming all vehicles currently retired right at the current 12-year minimum shifted to a new 10-year minimum the long-term average annual replacement rates for these operators would increase from 200 to 300 vehicles to 240 to 360 vehicles annually or 40 to 60 additional vehicles per year The addition of 40 to 60 additional new vehicles is unlikely to yield a significant boost to the small domestic bus market
Recommendations
Based on the findings above it is recommended that the FTA consider the following
bull Maintain the current service-life minimums Few buses and vans are currently retired right at FTArsquos current service-life minimums Rather the vast majority of these vehicles are retained in service for at least one year (4- and 5- years vehicles) and as many as three or more years (eg for 12-year vehicles) after the minimum service requirements have been met indicating that these vehicles have some service life remaining beyond the minimums Moreover the current service-life age andor mileage minimums for all vehicle types occur before the minimum life-cycle cost points for these vehicles are reached Hence the current service-life minimums clearly meet the joint objectives of (1) ensuring that buses and vans purchased using federal dollars remain in service for most of their useful life (2) of providing agencies some flexibility in determining when their vehicles will be retired and (3) of helping to minimize life-cycle costs In this sense the current service-life minimums really are just that the minimum ages at which vehicles can be retiredmdashnot a recommended retirement age or a measure of actual expected useful life The current minimum service-life requirements should be maintained
bull Maintain the current service-life categories Similarly the segmentation of transit bus and van types into the current five service-life categories reflects actual similarities in vehicle
Federal Transit Administration 121
Useful Life of Transit Buses and Vans Chapter 9 Final Report Conclusions
structures designs components costs origin markets manufacturers and end users These current categories should be maintained
bull Review the service-life minimums and service-life categories regularly The analysis of recent changes in vehicle designs the adoption of new technologies and the introduction of new vehicle types (eg stainless steel BRT vehicles) highlight the fact that the useful-life characteristics of transit buses and vans are subject to change For this reason FTA should review the minimum life requirements and service-life categories on a regular basis (eg every 5 to at most every 10 years)
bull Consider adoption of a ldquolemon lawrdquo This law would define circumstances under which ldquoproblemrdquo vehicles could be retired early without financial penalty
bull Consider adoption of a technology demonstration option Similar to the ldquolemon lawrdquo this option would define circumstances under which agencies could retire vehicles purchased to test new technologies (with FTArsquos prior agreement) early again without financial penalty The intention would be to encourage test and adoption of new but potentially unreliable technologies expected to benefit the entire transit industry
bull Restrict the service-life categories in which vehicles are tested In recent years some manufacturers have successfully lobbied to have their vehicles tested in a more durable category than would appear warranted by their vehiclersquos general characteristics (eg testing a bus with 10-year characteristics as a ldquo12-yearrdquo bus) The result has been service reliability issues and in some instances early retirement for the purchasing agencies when the tested vehicles were not found to have the expected durability Thus FTA may wish to more tightly control which categories vehicles are eligible to test in based on some combination of characteristics (eg gross vehicle weight seating capacity) but with the potential for special waivers to test in a different category so as not to stifle innovation (Manufacturers should be required to provide reasonable justification as to why their vehicles should be tested in the higher durability category)
bull Modify the NTD reporting requirements to better document actual vehicle retirement age and each vehiclersquos assigned service-life category The analysis used in this study to determine actual vehicle retirement ages relied on cross comparisons of NTD data from multiple reporting years to identify when specific vehicle sub-fleets have been retired FTA should modify NTD to track the actual age of vehicle retirements thus significantly improving FTArsquos ability to track and monitor any trends in vehicle retirement ages Similarly NTDrsquos vehicle documentation should also include the service-life category to which each vehicle has been assigned (again to facilitate monitoring of the retirement ages for each service-life category)
bull Conduct a study to evaluate the sensitivity of bus ridership to changes in vehicle age and condition A key objective of this study was to consider how bus ridership might change (increase) in response to a reduction in the average age of the nationrsquos bus fleets (eg with the introduction of a new shorter lived heavy-duty transit vehicle) However while review of the existing literature provides numerous references to the sensitivity of ridership to changes in fares and service frequency no literature references were identified that provide a quantitative link between ridership and fleet age or condition In the absence of solid empirical data linking ridership and fleet age any analysis of this relationship can only be
Federal Transit Administration 122
Useful Life of Transit Buses and Vans Chapter 9 Final Report Conclusions
based on conjecture and limited anecdotal evidence For this reason it is recommended that FTA conduct a study to evaluate the sensitivity of bus ridership to changes in vehicle age and condition Given the availability of good-quality route-level ridership data (from electronic fare boxes and APCs) this study could easily be conducted using a sample of US transit operators using before and after comparisons of which older sub-fleets have been replaced by new (or newer) vehicles
Federal Transit Administration 123
1
Useful Life of Transit Buses and Vans Final Report Bibliography
BIBLIOGRAPHY
The following documents have been used as project resources
Books papers technical reports
Federal Transit Administration 1988 ldquoUseful Life of Transit Vehiclesrdquo UMTA-IT-06-0322-88shy1 Washington DC US Department of Transportation
This study focused primarily on the mechanical or engineering life of transit buses It excluded other factors such as the economic life ridership impacts and technological obsolescence of the vehicle
Abrams E and E Hide 1997 ldquoUseful Life of Heavy-Duty Transit Busesrdquo TCRP Project J-6 Task 15 Washington DC Transportation Research Board
This task reviews FTA guidelines on the minimum useful life of 12 years or 500000 miles of operation for heavy-duty buses The study expanded on the 1988 study and includes an analysis of factors that impact vehicle life (operating environments mandated requirements and new vehicle technologies) and makes recommendations on the appropriateness of the current service-life standards
American Public Transportation Association 1997-2002 ldquoStandard Bus Procurement Guidelinesrdquo
This is a comprehensive set of industry-wide purchase standards with both technical specifications and procurement guidelines for transit buses
Booz Allen Hamilton 2005 ldquoManaging Capital Costs of Major Federally Funded Public Transportation Projectsrdquo TCRP Project No G-07 Washington DC Transportation Research Board (TRB)
This report examines the strategies tools and techniques to better estimate contain and manage major transit capital projects Nine case study projects were examined in detail to provide insight into various project management approaches Major cost drivers considered in this analysis were initial inflation scope changes and schedule changes
Yang F L Yu G Song W Wang and W Pei 2004 ldquoVehicle Age Distribution Model and Application for Beijing Chinardquo Washington DC Annual Meeting of the TRB
This paper proposes a survival probability-based model to calculate and forecast the area-specific vehicle age distributions which uses the total number of registered vehicles (not distinguished by years) and the total number of newly registered vehicles or the number
Federal Transit Administration 124
Useful Life of Transit Buses and Vans Final Report Bibliography
of scrapped vehicles (the most recent year) The model is designed for areas where historical vehicle registration records are incomplete or unavailable
Li Q H Zhao and Y Xingping 2004 ldquoDecision Making Modeling for Rural and Small Urban Transit Asset Managementrdquo Washington DC Annual Meeting of the TRB
This paper describes the framework of a transit asset management system and discusses the methodologies developed to assist agencies in foreseeing the transit deterioration process The study explores the contribution of preventive maintenance costs to the vehicle condition ratings The optimization procedures developed help allocate sufficient funding to sustain future well-being of transit vehicles The concept of extended life (payoff for maintenance actions) of transit vehicles is introduced to provide a structure for the management decision-making process
KFH Group Inc 2000 ldquoAnalyzing the Costs of Operating Small Transit Vehiclesrdquo TCRP Report 61 Washington DC Transportation Research Board
This report serves as a user guide to the accompanying Small Transit Vehicle economics model which is designed to provide support to transit planners and other decision-makers on the purchase of small transit vehicles for different services and operating environments The user guide also discusses qualitative and non-financial factors that influence the size of vehicles to be purchased
Schneck D C and R S Laver 1995 ldquoTransit Capital Cost Indexrdquo Washington DC Annual Meeting of the TRB
This study presents the results of research aimed at improving the estimation of future capital costs for light and heavy-rail fixed guideway projects The research produced a set of cost indices for a broad range of project elements comparing these cost indices with broader measures of inflation and suggesting how they should be incorporated into cash flow projections for proposed fixed guideway projects
Pennsylvania Department of Transportation (PennDOT) Bureau of Public Transportation 1988 ldquoHandbook for Purchasing a Small Transit Vehiclerdquo Urban Mass Transportation Administration Washington DC US Department of Transportation
This handbook was developed to assist Pennsylvania grantees in the vehicle procurement process The first part of the handbook contains information on the characteristics of small transit vehicles objective criteria for selection and PennDOT procurement procedures while the second part provides a list of optional equipment and features with their technical specifications and approximate costs
Metropolitan Transportation Authority Office of the Inspector General 1995 ldquoIs New York City Transitrsquos Bus Fleet Too Old to Provide Reliable and Safe Bus Servicerdquo TRA 4506-4 ISNYC 94-79636 New York NY New York State Library
Federal Transit Administration 125
Useful Life of Transit Buses and Vans Final Report Bibliography
This document reviews the conditions and problems of the New York City Transit bus fleet which at the time had one-third of its buses over the 12-year retirement criterion Age-related safety performance and structural deficiencies are examined The report offers a number of recommendations to restore the fleet to a state of good repair and monitor the condition of its overage vehicles
Hemily B and R King ldquoThe Use of Small Buses in Transit Servicerdquo TCRP Synthesis Report 41 Washington DC Transportation Research Board
This research explores the use of small buses (30 feet or less) in the transit industry The study included a survey of North American transit agencies using small buses transit agencies that do not have small buses and bus manufacturers Results from this research were related to the fleet composition with respect to small buses the wide variety of vehicle models and service categories and overall experiences and most common areas of concern for transit agencies regarding small buses
2 FTA and agency reports
Federal Transit Administration 2006 ldquoNon-Rail Vehicle Market Viability Studyrdquo MI-26-7008shy051 Washington DC US Department of Transportation
Federal Transit Administration 1988 ldquoUseful Life of Transit Vehiclesrdquo UMTA-IT-06-0322-88shy1 Washington DC US Department of Transportation
Federal Transit Administration 1998 ldquoUrbanized Area Formula Programrdquo Circular C90301C Washington DC US Department of Transportation
Federal Transit Administration 1995 ldquoFinal Report Bus Industry Summit Proceedingsrdquo Washington DC US Department of Transportation
Federal Transit Administration ldquoBuy America Requirements ndash Surface Transportation Assistance Act of 1982rdquo 49 CFR 661 Washington DC US Department of Transportation
Federal Transit Administration ldquoBus Testing Regulationrdquo 49 CFR 665 Washington DC US Department of Transportation
Americans with Disabilities Act of 1990 United States Public Law 101-336
3 Internet sources
Altoona Bus Research and Testing Center lthttpwwwvsspsuedubtrchtmgt (January 16 2006)
American City amp County ldquoPublic TransitCommission Uses Third Party for Bus Procurementrdquo lthttpwwwamericancityandcountycommaggovernment_commission_uses_thirdindexhtmlgt (January 13 2006)
Federal Transit Administration 126
U F
seful Life of Transit Buses and Vans inal Report Bibliography
This article describes the bus procurement process taken by the Metropolitan Transit Commission (MTC) in St Cloud MN
Hubbard D 2005 ldquoIf It Makes It Here It Can Make It Anywhererdquo BUSRide Magazine lthttpswwwbusridecom200507If_it_makes_it_here_it_can_make_it_anywhere_aspgt (January 16 2006)
This article is about the Altoona Bus Research and Testing Center (ABRTC)
Goby D 2004 ldquoThe Environment and New Bus Service Liferdquo School Transportation News lthttpwwwstnonlinecomstnbusmaintenanceschoolbustechniciangoby_buslife0404htmgt (January 16 2006)
This is an opinion article on the environmental impacts of school buses with six- to eight-year service life compared to longer (10 to 15 year) service life
Federal Transit Administration 127
Useful Life of Transit Buses and Vans Appendix A Final Report Summary of Transit Agency Survey
APPENDIX A SUMMARY OF TRANSIT AGENCY SURVEY
Issue Area WMATA (Washington)
Toronto Transit
Montgomery Co Ride-On
New York City Transit MBTA (Boston) LA MTA
(Los Angeles) Frederick Co Capital Metro (Austin TX)
Jefferson Transit
General Experience - Federal Funding
Use Federal funding to purchase buses and vans (yn) Yes Limited
Few (some State funded - which is partially funded with federal sources most are from County
No use MTANY State Capital Funds Yes Yes Yes Yes Yes
Percent of fleet purchased using Federal funds 100
Limited diesel hybrid support on a demonstration basis (150 buses) - 13 city 13 province and 13 federal Rest of fleet is funded by agency or city Not given 0 100 Not stated
25-30 Other funding sources State and Local 99 95
General Experience - Service-life policy (Heavy-Duty Vehicles)
Have policy in place State or agency
Yes ndash imposed by WMATA board Yes
State (more stringent than FTA) and County policies
Not stated (use average age of fleet to make sure garages have equal distribution - not for policy)
Yes (use average age of fleet) Yes
Follow State policy which is similar to FTA (see table) Yes Yes
Planned agency policy retirement age
15 years for 40-foot
18 years at 40-45000 annual
12 for County funded none stated for State funded
12 years as an objective 12 years
13 years or 500000 miles (not given)
ldquo12-yearrdquo bus retirement target is age 15 ldquo7-yearrdquo is age 9 5-year bus target is age 8 and 4-year is age 5
Preferred retirement age from the viewpoint of agency staff
5 years due to funding limitationsconst raints
18 year can extend to 20-24 to correspond with procurement cycle
Same as FTAMD 12 years 8 years
12 years (Budget)
Yes FTAMTA minimums Maintaining vehicles for longer period is too expensive
Same as scheduled
Same as scheduled
Federal Transit Administration 128
Useful Life of Transit Buses and Vans Appendix A Final Report Summary of Transit Agency Survey
Issue Area WMATA (Washington)
Toronto Transit
Montgomery Co Ride-On
New York City Transit MBTA (Boston) LA MTA
(Los Angeles) Frederick Co Capital Metro (Austin TX)
Jefferson Transit
Do actual retirement ages differ from the scheduled retirement age
Difficulties with Thomas SLFs (scheduled at 12 failing at 10-11)
States NO but CNG buses had to be retired at 12-years due to high maintenance
Close to minimum life budget not a problem (delay usually due to procurement process)
Yes 13-15 years due to lack of funding (structural rebuild and re-power program to extend)
Yes Actual exceeds scheduled due to other funding priorities Use average age of fleet Target is 8 years for fleet average age unable to meet this because of limited funding
Yes due to budget and legal consent degree obligations
Yes but retirement was within 1-2 years for minimums Minibuses (retired at 6 years 145000 miles) were very old Cutaways (retired 6 years 210000 miles) very old No
Yes Prior to 4 years ago no established replacement schedule existed
Examples of recent sub-fleet retirements
Group of 1983 MAN artics operated barely 11-12 years (12-year sched) and 400k-500k miles (600k sched) All other groups retired at scheduled miles or more
Group of 1984 30-ft TMCs (retired 1999 - 15 years Expensive to maintain Group of 1989 30-ft Gilligs (retired 20012002 - 12 years) had been re-engined 19921993 no lift poor ac expensive maintenance drivers hated
Group of 1987 RTS (20-30k miyr retired 2006) kept in reserve fleet while other vehicles were in overhaul Group of 1990 RTS (retired 2006 360-380k miles total) 1990 RTS not sent through re-power program no engine replacement wo failure
Retired 032006 heavy duty Schedule 8 Actual 16 Retired 1205 heavy duty Scheduled 8 Actual 17 Retired 1204 heavy duty Schedule 8 Actual 18 Retired 1203 heavy duty Scheduled 8 Actual 19
1991 Orions (retired at 14 years) -replacement decision driven by increasing maintenance -does not use mileages Goshen coach (retired at 6 years averaged 150000 miles) Vehicles could not stand up to fixed route services
(1) 30 1993 TMC CNG (retired 032005) -Retired 6 month early due to CNG equip outdated 1986 Gilligs Phantoms (retired 92005) - kept for contingency and for use by local PD
1984 35 Foot Orion (retired June 2006) age 22 years and with over 800000 miles 1985 Orion (retired August 2006) age 21 years and with 892625 miles
Drivers of Retirement Policy
In order of priority Capital funding vehicle maintenance other-ridership physical conditionQOS
Agency Duty Cycle (need to specify vehicles to operate with heavy-duty) and Capital Funding (mainly the LACK of alternative funding option) Does not use average fleet age or percent over age due to lack of funding
Physical CondQOS agency duty cycle (which is lowmoderate) veh Maintenance cap funds
(1) Cap Funds (2) ConditionQOS (3) Maintenance (4) Duty Cycle (5) WeatherRoad (6) FTA reqs
Availability of capital funding FTA minimum requirements
ConditionQOS Maintenance Capital Funding FTA ages
FTA retirement ages OTHER MD MTA procurement cycle is slow (Frederick purchases most vehicles through the state) Significant lag between replacement order and vehicle delivery state rarely provides as many vehicles as requested
Maintenance Capital Funding FTA minimums (QOS can be attained independent of age)
Physical condition duty-cycle maintenance requirements and capital funding availability
Federal Transit Administration 129
Useful Life of Transit Buses and Vans Appendix A Final Report Summary of Transit Agency Survey
Issue Area WMATA (Washington)
Toronto Transit
Montgomery Co Ride-On
New York City Transit MBTA (Boston) LA MTA
(Los Angeles) Frederick Co Capital Metro (Austin TX)
Jefferson Transit
General Experience - Mid-Life Overhaul
Perform mid-life overhaul (yn) Yes
Yes at 6 and 12 years With further decline in provincial funding revise overhaul program established at 9-10 years
No tried back in 19921993 and found not cost effective Not effective likely due to easy duty (larger buses maintained by County)
Yes planned but not always done - last up to 15 years When not done rehab activities are as needed or on component basis Yes
Sometimes (no due to funding and manpower)
No Frederick is small agency only perform basic vehicle maintenance on-site Enginetransmis sion replacements are contracted out No other scheduled rehab performed
No on an as-needed basis No
Components included in overhaul cost of overhaul
Engine and major components (transmission brakes ac) avg $110kvehicle
Engine transmission plus extensive other components avg $100kbus NA
Power plant paint suspension transmission some structural $100-120k per bus Mini-overhaul 3-4 years paint interior brakes suspensions shocks airbags) = $30-40k Geared towards performance not extension gain in reduction of corrective maintenance and road incidents
Rebuild power plant AC brakes steering axels body and frame air tanks limited wiring Avg cost of $173000 bus NA NA NA
Overhaul on Vehicle types All 40-ft buses All 40-ft buses NA Heavy-duty Heavy-duty 40-ft fixed route NA NA NA
Additional years
Gets vehicles from 12 to 15 years additional 150k miles
Extends 12-15-year bus to 18 years NA
3-4 years if necessary to keep past 12 years but done as corrective maintenance and keep incidents to minimum 6 years NA NA NA NA
Federal Transit Administration 130
Useful Life of Transit Buses and Vans Appendix A Final Report Summary of Transit Agency Survey
Issue Area WMATA (Washington)
Toronto Transit
Montgomery Co Ride-On
New York City Transit MBTA (Boston) LA MTA
(Los Angeles) Frederick Co Capital Metro (Austin TX)
Jefferson Transit
Coordination of overhaul timing with expected life of major components (eg drive train replacement)
Coordinate with those that fail 6-8 years looking into additional smaller overhauls (39 and 12)
With extension of major overhaul to 9-10 year doing more componentmini overhauls during other years Components with separate replacement cycles (brakes steering suspension) are on an ongoing basis (vs one major overhaul) affects availability for service NA
Follow strategy of preventive maintenance Use overhauls plus campaigns to do most maintenance as schedule (vs corrective)
6-year midlife ensures continued performance of all components and subsystems
NA budget is major factor in whether midlife overhaul is performed NA NA NA
FTA Minimum Service-life policy
Impact of current FTA policy on retirement decisions (yn)
No however later in interview agency states some difficulty in reaching 12-year retirement age - did not retired but lighten duty
No (Canadian no life constraint)
Used as basis for policy schedule and actual retirement No impact
12-year minimums result in 6-year midlife rehab at considerable capital expense
Budget does not allow MTA to retire at 12 MTA attempts to retire at 13 yrs
Submits vehicle replacement requests to MD MTA as vehicles meet minimums State requirements for smaller vehicles are slightly more strict
No negative impact
No Vehicles exceed the FTA minimums in terms of both age and miles Staff viewed this as a ldquopositiverdquo for the current service-life minimums
Would you retire earlier than the FTA minimums if you could
No agency retires later (15 years) due to Board policy
No funding to do so Have kept vehicles longer than desired -would prefer to retire at 15 but no funding requires extending to 18 and further for procurement cycles Have retired buses earlier than preferred (no
No impacts from retirement ages
No impact exception of FTA funded 19831984 Grumman that could not handle NY duty and street conditions Reimbursed FTA for portion (80) - reason for use of State and City funds now Early
Earlier 8-year replacement would eliminate 6-year midlife rehab and ensure latest technology Have not retired earlier than FTA mins
Early possible but budget constraint Budget has forced longer service than desired due to absent fundingbudget Metro might entertain using shorter design lives Has retired early (fire and beyond
In general NO Current minimums are appropriate Would not retire sooner but do like to retire close to minimum ages for maintenance issues (not QOS) Exceptions are Goshen and Thomas SLF
Would not retire earlier in absence of requirements and has not forced vehicles pass desired age Have retired prior to FTA minimum (1993 TMC - due to CNG outdated) FTA approved early retirement
No vehicles still have yearsmiles of remaining useful life after minimums have been attained
Federal Transit Administration 131
Useful Life of Transit Buses and Vans Appendix A Final Report Summary of Transit Agency Survey
Issue Area WMATA (Washington)
Toronto Transit
Montgomery Co Ride-On
New York City Transit MBTA (Boston) LA MTA
(Los Angeles) Frederick Co Capital Metro (Austin TX)
Jefferson Transit
FTA requirement) due to high failure rates and maintenance
retirement affected other MTA projects and delayed procurements to refund those projects
economical repair)
which have provided problems Goshens keep longer than desired (are unreliable and unfit for fixed service)
Does your state have a minimum vehicle life policy No No
Yes same for larger vehicles more yearsmiles for smaller
Yes 7 years to cover all bus types No No
Yes (more strict than FTA minimums on smaller vehicles) Not stated
Yes same as FTA minimums
Recommendations
Options for agencies inclusion of rehab costs as reimbursable extended warranties as reimbursable
Suggest shorter useful life is NOT feasible for heavy-duty operations and procurement methods Minimum agemileage should be increased to 12151820 and 24 years FTA classification be revised for rehab costs to be included
No current minimums are appropriate Cannot judge appropriateness for smaller since they were recently purchased (previously contracted)
Makes sense to provide options mileage looks high on annual average should include rebuild costs as capital reimbursement (improve maintenance) stipulations on use of FTA funds for rebuild use testing to pre-qualify buses higher-level specs from ldquoWhite Bookrdquo
Reduce minimum agemileage to reduce maintenance costs Change 12-year 500000-mile category for 40-ft heavy duty to 8-year 300000 miles
Allow more discretion on buses not performing at optimum level In general age is acceptable No changes
Retirement minimums are OK extending them would be a problem due to increasing maintenance
No current minimums are appropriate
Maintain current policy
Vehicle Life Classes
Opinions on the usefulness and applicability of the current classification
FTA should provide options for each vehicle type make rehab and warranty reimbursable longer life
Mainly focus on heavy-duty buses maybe extend heavy-duty specs to smaller buses too No
Mileage seems high (calculate avg annual mileage and apply to each option consistently)
Useful but redefine to include 8-year 300000-mile heavy duty vehicles NA
Retirement minimums are OK extending them would be a problem due to increasing maintenance
No revisionsreducti onsincreases to minimums
They are good They allow for the purchase of a quality product and still provide reasonable replacement for high-volume
Federal Transit Administration 132
Useful Life of Transit Buses and Vans Appendix A Final Report Summary of Transit Agency Survey
Issue Area WMATA (Washington)
Toronto Transit
Montgomery Co Ride-On
New York City Transit MBTA (Boston) LA MTA
(Los Angeles) Frederick Co Capital Metro (Austin TX)
Jefferson Transit
shorter vehicles areas would be good but are the required components amp structure available
1st Option (more durable longer lasting vehicles)
Not right now possibly in future
BRT vehicles not considered yet have developed longer life vehicle specs with NYCT WMATA and MBTA focused on stainless steel structure composite panels and extensive rust protection
Only if other features come in not just for the sake of durability
Yes in terms of durability duty cycle places great strain on buses Stainless steel is key to this No
If such vehicles truly had an extended vehicle life METRO is very hard on vehicles and struggle to get past 12 yrs
No not appropriate for market concern of increasing maintenance costs and decreased reliability and service quality Yes
No We are not in a high-volume service corridor and a longer life vehicle would only put us behind in technological advancements that are of benefit for safety and operating costs
2nd Option (less durable shorter life vehicles)
Interesting but do not see benefits Component life is typically 6-8 yrs - would have to be in this range
No do not believe can handle heavy-duty cycles
Skeptical that vehicle can be constructed with cost savings to make it cost effective option Concern over increase of cost and effort of procurement process
Would not apply to NYCT duty cycles
No Looking for same heavy-duty vehicle with an 8 year minimum life requirement
Metro is hard on vehicles could work if vehicles were suitably durable
No current agemileage requirements are preferred Concern reduced life = reduce safetyreliability durability Consider life expectancy of vehicle structure and components
No revisionsreducti onsincreases to minimums
Our experience with shorter-life medium duty equipment has been negative Increased operating and repair costs for the agency more service disruptions and increased passenger dissatisfaction
3rd Option (allow agencies to replace vehicles as needed relying upon funding formula constraints to limit fleet
Currently done by agency (15-year major overhaul -considering mini overhauls in between) Would not do
Does not affect agency (Canadian) but
Yes but concern about
Should be done as an industry to cause a change in life
If funding match were changed to 5050 6040 7030 8020 9010hellipbased on equipment age mileage it would encourage prudent maintenance and vehicle
replacement activities)
anything different
believe this is best way
capabilities of other agencies No objection Reasonable
expectancy of buses
replacement practices
Federal Transit Administration 133
Useful Life of Transit Buses and Vans Appendix A Final Report Summary of Transit Agency Survey
Issue Area WMATA (Washington)
Toronto Transit
Montgomery Co Ride-On
New York City Transit MBTA (Boston) LA MTA
(Los Angeles) Frederick Co Capital Metro (Austin TX)
Jefferson Transit
4th Option (consisting of up to three different options of minimum retirement ages mileages for each vehicle category plus pre-defined rehabilitation requirements for each option)
Interesting but not appropriate to 40-ft and with agency policies would not alter procurement decisions would probably require incentive
No only do longer life durable procurements (no impacts to current procurement decisions) Heavy-duty 10-year option not useful - others OK (no experience with light-duty) Agency would require additional federalprovincia l funding
Interesting but skeptical Rehab provisions are of no interest (no rehab performed) Concern over capacity of rehab vendors to meet increased demand and how rehab would be monitored and approved by FTA
Yes like idea of options within consistent structure Procurement decisions not affected - would like to consider 15-18 year options Suggestion to reduce annual miles
No but suggest 8-year option
Yes alter procurement by more evaluation of trade-offs (age vs operating costs) Need to consider impact of sustaining vehicles on emissions Challenge Need to have good understanding of how increased age decreases QOS Incentives could encourage our procurement decisions to look at alternative procurement scenarios
Like having more options Interest in having rehab option but concern how smaller agencies might implement option (do not do rehabs typically contracted out) Who would perform rehabs and to what level General interest in longer more reliable vehicles no interest in short life (perceived as cheaper componentsreli abilitysafety)
No low pricebid not conducive to best value for rolling stock
No The mileages are too high for replacement the percentage of match funds We would be always running older behind the technological curve coaches
Effects of earlier bus replacement
No price benefits with shorter life components do not allow for shorterlonger life sourcing of parts for older vehicles is a BIG issue (longer life would increase problem)
Potentially more inventory control issues Vague answer
Reduced maintenance costs fuel costs midlife rehab costs emissions and increased customer satisfaction No negative impacts
Shortens time to adopt new techn (improved passenger amenities efficientlower emissions) Faster replacement means passengers benefit from newer equipment
Cheaper buses = cheaper components = decreased reliability
Federal Transit Administration 134
Useful Life of Transit Buses and Vans Appendix A Final Report Summary of Transit Agency Survey
Issue Area WMATA (Washington)
Toronto Transit
Montgomery Co Ride-On
New York City Transit MBTA (Boston) LA MTA
(Los Angeles) Frederick Co Capital Metro (Austin TX)
Jefferson Transit
Extend Minimum Life Additional costs including maintenance
Little effect on current costs (policy is already at 15) some financial impacts from procurements that couldnt make 15 year Maintenance expenses would increase because of increase in mean distance between failures
Increased need for mini overhauls of components slightly increase - planned component overhauls helping to maintain reliability and cost increases
Increased maintenance cost and demand more durable vehicles from manufacturers
Maintenance expenses would increase approx 8 per year
Addition of mid-life overhaul program higher rate of catastrophic failures and corresponding operating costs Costs increase Mid-life overhaul $50-$100k plus 10-50 higher maintenance cost (higher component and structural failures) Reliability reduced by 10-25
Increased maintenance expenses Passenger complaints also an issue (80 are work trips 50 are captive riders)
Higher maintenance costs (corrosion could cause additional costs) Running repair costs could go up 10-15 plus paint cosmetic and corrosion repair to be evaluated for feasibility
Would limit ability to purchase replacement coaches when funding was available could force us to use antiquated less passenger friendly equipment and limit our ability to expand future service maintenance costs would increase
EnergyEmissions impacts of earlier bus replacement
Slight increase in emissions but larger increases from newer engine performance Slight reductions in energy efficiency from original engine performance but larger reductions from newer engine performances
Have not seen increase or decrease emissions not changing energy nearly the same no decline in performance
EnergyEmissio ns would increase by 8 a year
Difficult to quantify Energy efficiency No unless significant breakthrough in engine efficiency
No on emissions No on energy newer engines are getting less mpg
New technology is leading the charge to produce emissions free vehicles Not all older fleets will be able to retrofit to current and future EPA requirements
Federal Transit Administration 135
Useful Life of Transit Buses and Vans Appendix A Final Report Summary of Transit Agency Survey
Issue Area WMATA (Washington)
Toronto Transit
Montgomery Co Ride-On
New York City Transit MBTA (Boston) LA MTA
(Los Angeles) Frederick Co Capital Metro (Austin TX)
Jefferson Transit
Other options for FTA to consider
Consider an 8-year minimum life option for heavy-duty larger buses keep same level of quality (no decrease in quality) Would improve customer satisfaction reliability maintenance latest technologies emissions fuel economy educated workforce positive community perception
Other options Large regional transit agencies should be allowed to use proposed pooled procurement approach This allows for 90 reimbursement They would have to allow other regional operators to piggy-back on those procurements
Supports development of more durable better quality 10-year bus (30-ft Orions are too large for downtown) desire for sturdydurable short vehicle capable of extended heavy duty
No impact on performance maintenance plans would be tailored to bus needs
Base FTA replacement schedules on serviceagency type urban rural or non-profit high-volume or low-volume Based on these criteria use variable agency match as the incentive to regulate quality maintenance and vehicle life
Vehicle Components ndash Impacts of Life Expectancy
Is maintainability life expectancy of vehicle components a key retirement driver
Structural members determine life (reason to retire early) - everything else is replaceable (choice is replace vs maintain)
Yes CNG buses had to be retired at 12 due to high maintenance -dont know for hybrids (expect same as diesel) AC drives rebuild every 5 years on hybrids Expect 500k miles on engine Structural corrosion is limited by stainless steel composite panels and rust prevention efforts
No although concerns of general maintainability are a factor
No Retirement is aged-based not component-based No component is durable beyond expected 12-years Yes
Increasing maintenance and decreasing reliability is primary concern of age
Yes if corrosion is bad then consider early replacement Yes
Federal Transit Administration 136
Useful Life of Transit Buses and Vans Appendix A Final Report Summary of Transit Agency Survey
Issue Area WMATA (Washington)
Toronto Transit
Montgomery Co Ride-On
New York City Transit MBTA (Boston) LA MTA
(Los Angeles) Frederick Co Capital Metro (Austin TX)
Jefferson Transit
Components important to replacement decisions
Heavy-Duty Electrical system (tends to go at 15) Engine and transmission the most expensive
Body structure panels corrosive protection drive train and suspension on low-floor vehicles
Components changed on correctivefailure basis Engines transmission alternators starters AC compressors air compressors fuel injectors AVL assemblies
Interviewees area not capable of answer general sense that no parts in particular cause problems but typically a range of components become less reliable
Structure axes exterior skin floor corrosion Other issues typically resolved with proper maintenance
Body condition (ie leaking excessive corrosion) power plant electronics failure structural wear and integrity
Components with no impact on retirement decisions
Doors brakes controls windows bumpers and interior replaced on a corrective basis Doors brakes and controls below that expected
Brakes seats stanchions suspension steering transmission paint flooring signage and wheelchair lifts
Other Issues affecting Procurement Process
Current procurement policy for your agency
Best value negotiated based on price and other factors (low bid no good = lower quality)
Low bid with tight specifications and brand requirements No bids have been fully compliant Needed to negotiate relative compliance to specs Tight specifications focused on body undercarriage and panels are more important in procurement
RFP - price is only 10 of evaluation great emphasis on quality (evaluated by quality selection committee) Low-bid
IFB amp RFP More advanced vehicles are usually purchased via negotiated procurement Believe procurement process has an effect on quality and expected life of bus
Purchase through the state (MD MTA) Have piggy backed some procurements with other counties (low bid) Best value RFP
Piggy-back on existing FTA approved bids
Federal Transit Administration 137
Useful Life of Transit Buses and Vans Appendix A Final Report Summary of Transit Agency Survey
Issue Area WMATA (Washington)
Toronto Transit
Montgomery Co Ride-On
New York City Transit MBTA (Boston) LA MTA
(Los Angeles) Frederick Co Capital Metro (Austin TX)
Jefferson Transit
Impact of procurement methods on useful life
Big impact on useful life due to higher quality product received (vs low bid = lower quality)
Impacts on longer-life requirements
Precludes known quality components No impacts
Best value as lowest bid does not always mean best value as the life expectancy could be worse Believes procurement process has impact on quality and expected life of bus
Yes If the bid options necessary for our service conditions are not available and yet we need to purchase the vehicle that vehicle will be retired at the FTA minimum as opposed to exceeding the FTA replacement criteria
Suggestions
Enhance standard bus procurement guidelines to include performance-based specs and include more optionsalternati ves Current specs are too prescriptive
If there was a good way to accurately estimate vehicle life cycle costs for certain vehicles especially composite vehicles
Proviso for small agencies to add options necessary to their service area or require RFP agencies to include in bids as many allowable options as possible It is not unusual to see a large agency produce specs with only their agency needs in mind and attach no options lists
Federal Transit Administration 138
Useful Life of Transit Buses and Vans Appendix A Final Report Summary of Transit Agency Survey
Issue Area WMATA (Washington)
Toronto Transit
Montgomery Co Ride-On
New York City Transit MBTA (Boston) LA MTA
(Los Angeles) Frederick Co Capital Metro (Austin TX)
Jefferson Transit
Impact of Buy America on useful life
Yes structural members drive useful life and Buy America does limitaffect how a manufacturer develops structure Buy America also limits design improvements due to limited marketcompetiti on for change
No requirements in Canada but do limit European content to 20 due to their use of low-carbon steel Have restricted use of frame design and manufacture from European suppliers
Only applies to state-funded vehicles (which is a minority)
Reduce heavy-duty to 8 years
Somewhat true Most Buy America compliant bus manuf build their bus structures outside of US though dont know whether this has a qualitative impact Given how small the US bus industry has become the current provisions may be restricting how quickly US Transit Properties can adopt the latest international technologies
Not qualified to answer (purchase through state)
Useful life is dependent upon procuring agency to know what they need and how to maintain
The Buy-America requirements increase the cost of a vehicle without necessarily increasing its useful life Lowering the Buy-America percentage will allow manufacturers to produce vehicles at a lower cost with the same or better quality Example Mercedes-Benz
Altoona Testing - Use of Testing Results
Yes use them but not rigorous enough Results included in price and other factor measurements for bid (weighed) More agencies should use results recommend providing actual test results (vs passfail)
Yes use the bus testing results in the evaluation and require the New York drive files from the B-35 bus route shaker test Not directly
Yes new purchasing is a in-houseconsultan t function consultants use Altoona when advising clients or writing specs Data could be organized to establish quality ratings as a guide in achieving minimum life requirements Suggestion Expand Altoona testing to include quality rating system for buses
Yes reports are reviewed and discussed with vendors prior to all new bus deliveries
Not qualified to answer (purchase through state)
Yes testing is required by APTA guidelines More testing as in Altoona will provide better information for agencies (but who will pay)
The Altoona testing is done in such a manner that it is of no practical value to maintenance personnel or to operations for passenger safety Competition between manufacturers is the best for achieving a quality long-life product Altoona simply adds costs passed on to the transit system
Federal Transit Administration 139
Useful Life of Transit Buses and Vans Appendix A Final Report Summary of Transit Agency Survey
Issue Area WMATA (Washington)
Toronto Transit
Montgomery Co Ride-On
New York City Transit MBTA (Boston) LA MTA
(Los Angeles) Frederick Co Capital Metro (Austin TX)
Jefferson Transit
ldquoWhite Bookrdquo
Adapt guidelines to reflect alternative useful life options
Very good idea guidelines should be performance-based and offer alternativesopti ons for each components include extended warranties as just warranties Need to develop plans to respond to many design exceptions
Yes and use more onerous specs from Toronto NYCT
See similar options for mediumlight duty Yes
Only if there was an understanding that 10 years in heavy urban transit can be far more severe than 15 in suburban
Not qualified to answer (purchase through state)
Yes as long as todays 12-year do not become tomorrows 10-year
Would you consider using design specification for an FTA approved 10 year bus
No due to 15-year Board policy If policy changes then maybe for limited specialty fleet like downtown circulators No
If bus components remained at 12-year level
Yes but not necessarily agree that a 15-year bus for suburban use got more funding than a 10-year bus for urban use Maybe
Would you consider using design specification for an FTA approved 15 year bus
Yes this way now would appreciate more work on bus specs for longer life buses
Already use No experience in medium or light duty but sounds ok No
I have yet to see a bus that will hold up well to 15 years service in heavy duty urban environment
No 15 years is too long Yes
Would you consider similar useful life Do not use No the light-options for medium except for No experience duty market is and light vehicles paratransit but sounds ok Yes Not applicable OK
Federal Transit Administration 140
Useful Life of Transit Buses and Vans Appendix A Final Report Summary of Transit Agency Survey
Issue Area WMATA (Washington)
Toronto Transit
Montgomery Co Ride-On
New York City Transit MBTA (Boston) LA MTA
(Los Angeles) Frederick Co Capital Metro (Austin TX)
Jefferson Transit
Use of useful life exempt FTA demonstration programs to advance adoption of new technologies
Good idea to help move state of industry forward use to introduce new technologies
Alternatives of interest to TTC are procurement of prototype buses from several manufactures to test in service before selection of supplier This is similar to NYCT program Also maybe lease buses to test new manufacturer or model in operations before authorizingappr oving for bid
RideOn is too small not in-depth experience with maintenance No Yes
No as a smaller agency small staff limited resources limited capability to support technologies Yes No
Bus Procurement Difficulties
Difficulties keeping a vehicle in service through the minimum life requirement
Yes used vehicles for lighter duty shorter service spans then moved to spare and contingency until 12-year
Yes 150 Orion 6 CNG buses that were unreliable and high maintenance Retired at 12-years trouble getting to that 12 years
Yes premature failure of cradles and frames
Yes Methanol TMC buses in 1992 need to be converted to diesel to run reliably
Goshens and Thomas SPFs found to be unreliable for fixed route now use for limited service on lower duty cycles or low ridership routes This increases service hours of more reliable vehicles
Yes TMC CNG buses (outdated CNG) No
Requested waiver from the service-life policy
Yes but rejected Not applicable No
Not in recent memory except for a handful of accident buses No No
Federal Transit Administration 141
Useful Life of Transit Buses and Vans Appendix A Final Report Summary of Transit Agency Survey
Issue Area WMATA (Washington)
Toronto Transit
Montgomery Co Ride-On
New York City Transit MBTA (Boston) LA MTA
(Los Angeles) Frederick Co Capital Metro (Austin TX)
Jefferson Transit
Reaction to creation of a Lemon Law for problem vehicles
Good concept difficult to qualityenforce Suggest for this to work there should be an industry-wide finding of poor performance (not just agency) - exclude them from counting against spare fleet allow agency to decide optimum retirement and ensure remaining years funding rolled into next procurement (perhaps with higher local funding reqs)
Yes Had New Flyer and Icarus artic space frame corrosion problem and structural failures that had to be expensively maintained to make 12-years Great
Yes under constraint that manufactures should be compelled to ensure the structural integrity and durability of bus frames with min maintenance requirements over the min life of the vehicle
Yes if it were necessary Option should not be used 1) following completion of normal warranty period 2) when the annual operating cost or fleet reliability are substantially different than the rest of an agencys fleet
Yes but need to define conditions under which it would be applicable Suggest really only apply to limited and fairly serious conditions OwnSelf problems not sufficiently problematic to warrant use of option
Yes if responsible party (bus supplier) is dealt with Yes
Other Suggestions and or Comments
Policies need to consider difference between large urban operators and small suburban or rural operators
Federal Transit Administration 142
Useful Life of Transit Buses and Vans Appendix B Final Report Summary of Vehicle Manufacturer Survey
APPENDIX B SUMMARY OF VEHICLE MANUFACTURER SURVEY
Issue Area Orion Bus Industries Millennium Transit Optima Bus Corporation
General Life Expectations
Current buses manufactured
Two models 30-40 length 44-47 passengers Minimum life 12 years Expected 18 years Altoona tested No inventory provided
Three models (1) Opus Under 30 305 length 23-27 passengers Minimum scheduled manuf estimated life of 12 years (2) Opus Under 35 35 length 31 passengers Minimum scheduled and manuf estimated life of 12 years (3) American Heritage Streetcar 2875 length 28 passengers Minimum scheduled and manuf estimated life of 12 years
Marketing based on FTA categories (yn) Yes
Yes vehicles in 12-year service-life category tested and sold Yes
Vehicles not subjected to Bus Testing Regulation
Yes the Sprinter Van bought by smaller agencies with local money
Yes and No Same buses are sold in Canada which do not have to meet regulation (sell based on service record)
Yes FTA granted waiver to perform additional testing on Opus Under 35 vehicles
Specific expected-life characteristics
18-year vehicles in Canada Agency customers ask for longer warranty period and extensive corrosion resistance in Eastern part of country (high salt environment)
No transit operators want buses that hold-up (argue their environment is the most severe) Not all 12-year buses created equal (New York does not purchase Bluebirds tested at 12-year does not hold up to NY environment)
Yes request from agency customers is for heavy-duty transit buses normally aligned with FTA minimums However they may choose to keep vehicles in service longer Primary determinants of vehicle retirement age operating environment and duty cycle maintenance needs above 12-year age
Recommendation of mid-life overhaul (yn)
Do not recommend on chassis Cannot predict future condition of vehicle depends on duty environment maintenance etc
Do not recommend or get involved No benefits to manufacturer if agency does or does not perform overhaul - overhaul funds go to component vendors
Recommend following vehicle and component maintenance schedule Need for mid-life overhaul dependent on duty cycle of vehicle
Components included in overhaul recommendation
No on chassis Engine and transmission should be replaced Manufacturer provides few unique parts for overhaul most parts are purchased directly from vendor
Provide few unique parts for overhaul but most parts are purchased directly from vendors
Engines transmission suspension and axle (approx cost of overhaul or update is a little over $18k)
FTA Minimum Requirements
Impacts by FTA minimums (design driver)
Yes especially the 12-year category Category fundamentally drives design 12-year is heavy-duty benchmark
Buses built to meet FTA service-life requirements Impacts would be from changes (1) sell less buses if increased to 15 years and (2) be put in competition with lighter-bus manufacturers if requirements decreased to 8 years Corrosion requirements dictate use of stainless steel and aluminum instead of mild steel
Yes design and durability affected by minimums Compete in heavy-duty market thus need to design for 12-year500000-mile vehicles Build relationship with agency as vehicles sold approach minimum ages Also affects sales of parts after components fail past warranty period but before reaching minimum age Drive design by specifying service-life requirements to component suppliers chassis and body durability and testing requirements of category establish engineering design levels for load stress and fatigue criteria
Federal Transit Administration 143
Useful Life of Transit Buses and Vans Appendix B Final Report Summary of Vehicle Manufacturer Survey
Issue Area Orion Bus Industries Millennium Transit Optima Bus Corporation
Vehicles or components affected
Components not replaceable or cannot be rebuilt - such as chassis
Structure required to last 12 years without class 1 or 2 failures Warranty periods depends on component manufacturers Engine manufacturers charger higher for 12-year warranty (ie price of 4 engines)
Chassis body axles suspension engine transmission floor crash worthiness and air conditioner
Customer requests different than FTA minimums
Canada requests 18-year vehicles Others want a 15-year life for chassis CNG tanks with 15 to 20-year service life No No
RecommendationsChang es to current FTA minimums
There has been debate over 12-year build vehicles not durable enough (ensure testing is within right category) Altoona testing should be more (stress the durability more) and have more of a passfail aspect
No changes Lower minimums would put company in competition with smaller-bus manufacturers Increase of service life would result in less vehicles sold Do not believe longer more durable bus can be manufactured Already build most durable buses out there
No changes recommended to current minimums Classifications should be revised if tied directly to Altoona Bus Testing and monitorregulation should be revised (less arbitrary subjective method) FTA minimum retirement ages are arbitrary classifications driven by Altoona testing Testing not always reliable benchmark as manufacturers choose category to test under Vehicles are also not given rating Testing not monitored by FTA or governing body In the eyes of the industry Altoona bus testing drives life expectancy of buses although transit operators cannot review testing reports Bus testing reports should be a determining factor because it gives insight into durability and reliability (failure types problems etc)
New Vehicle Life Classes
Current usefulnessapplicability of vehicle classification
Categories are not definite enough They conflict with EPA definitions and weight classes are too loose It is what it is
Minimum retirement age based on Altoona Bus Testing no passfail assignment manufacturers choose classification to test under Vehicles are given classification when it completes test regardless of length of test time or durability This gives marketing edge which forces manufacturers to test at highest possible classification regardless of vehicles quality or durability
Option 1 Longer-life vehicles
Interest in manufacturing Yes No do not believe more durable buses can be manufactured
No components would not survive longer minimum retirement ages In most cases component manufacturers cannot produce more durable components Also duty cycle plays a key role in retirement decisions Larger specialized BRT vehicles would more likely have strenuous duty cycle affecting ability to meet longer-life requirement
Characteristics
Characteristics would include being inherently resistant to corrosion and have a higher GVW (over 33000 lbs category)
Component suppliers would have to provide longer more durable components Longer-life vehicle would be heavier (heavy-duty parts or higher-cost materials) would reduce fuel economy and would increase purchase price
Federal Transit Administration 144
Useful Life of Transit Buses and Vans Appendix B Final Report Summary of Vehicle Manufacturer Survey
Issue Area Orion Bus Industries Millennium Transit Optima Bus Corporation
Challenges
Challenges would be to encourage a modular design (beneficial to operators) Same bus in different lengths the weight class is the discriminator Rebuild cycles would create problems with part availabilities such as engine parts
Could not support todays technology for long periods (engines software)
Cannot increase life-expectancy of components increase purchase price
Option 2 Shorter-life vehicles
Interest in manufacturing Yes - the need of transit operators differ especially duty cycles and suburbanurban areas
No focus is on 12-year buses Less desirable would mean eliminating options use of mild steel less expensive components European design methodology previously used for low-floor bus - did not pass testing Not our market niche
Characteristics Lighter weight lower-cost components lower expectation of durability maybe lighter duty engine
Truck engines and axles cheap seats medium heavy-duty engines Not our market niche
Challenges Establishing market for these vehicles Getting cost out from components not structure Not our market niche
Other options None None
New vehicle types hybrid electric Properties diesel or gasoline engine that rotates a generator providing electric power to electric mothers through either batteries or ultra-capacitors to an electric motor driving the rear wheels
Vehicle Components
Effects of maintainabilitylife-expectancy of vehicle component on service life
Structure dictates life of vehicle - retirement comes as structure cannot be economically repaired Yes specifically the major component systems
Yes maintainability and availability of parts plays a key role in retirement decision Another driver of retirement is the perception of ridership and willingness to ride older vehicles (vs newer vehicles that may attract more riders)
Components that impact service life Structure chassis
Engine (CNGs do not last as long as diesel) transmission destination signs axles HVAC CNG tanks
No specific components listed Overall maintainability and quality of vehicle impacts retirement decision
Components that do not impact service life Wear items glass moving parts wiring harness
Seats hand rail-stanchions radios destination signs fare box windows - changed as needed
Customers have transferred the following items from 15-year old vehicles to new vehicles in all of our models fare boxes radios and voice announcement systems
Challenges to vehicle components with longer vehicles
No challenges to longer-life vehicles - already build 18-year vehicles
Challenges to longer-life no change to engine warranty by engine manufacturers batteries on hybrids
Parts becoming obsolescent as a driving factor Challenges of longer-life vehicles to the following components affect all models engine transmissions axles lack of stainless steel chassis suspension package fiberglass components electronic systems (including wiring) HVAC system brakes air system alternators and doors (and door controls)
Federal Transit Administration 145
Useful Life of Transit Buses and Vans Appendix B Final Report Summary of Vehicle Manufacturer Survey
Issue Area Orion Bus Industries Millennium Transit Optima Bus Corporation
Challenges to vehicle components with shorter vehicles
Challenges to shorter-life vehicles take out cost with reduced service life smaller engines lighter axle rating
Challenges to shorter-life vehicles de-rating components (use lighter-duty components from automotive industry) mild steel structure (if benign operating environment was certain)
Downgrade of design of each vehicle Vehicles have been designed for 12-year500000-miles mindset of industry demand for this vehicle type would have to change if life expectancy decreased No specific components stated
Component life-expectancy driven by other markets Yes - axles brakes engines (but not transmission)
Yes - engine transmission HVAC (by refrigerator truck market) axles (drop axles not specific to bus market - off road is larger market)
Federal Transit Administration 146
Useful Life of Transit Buses and Vans Appendix C Final Report Engineering Interviews
APPENDIX C ENGINEERING INTERVIEWS
Questions
Service-life policy and T
How does your agency define the useful life
CATS (Charlotte NC)
argets
By age and then mileage
Golden Gate Transit (San Francisco CA)
Useful life is determined primarily by age but GGT will keep buses longer if condition is good
Harris County Metro (Houston TX)
Useful life is FTA 12 year
LA MTA (Los Angeles CA)
The MTA uses the FTA definition of useful life 500000 miles 12 years 40000 milesyear
Lane Transit District (Eugene OR)
LTD defines useful life according to FTArsquos service life criteria
MUNI (San Francisco CA)
Muni uses 12 years as economic useful life of buses Munirsquos buses are often in service for up to 16 years
WMATA (Washington DC)
FTA and APTA New Bus Procurement Guidelines
Does your agency have a target useful life for your standard 40 foot transit buses What is it for smaller buses
Target is for 12 years but can get 15 years from heavy-duty buses The target is 5 years150000 miles for cutaways
Target is 12 years Buses are typically in-service for 14 years OTR coaches are kept for 16 years Target is 12 years
13 years or 500000 miles
LTD targets 15-year service life Smaller buses are replaced at 7-year Same as above Policy is 15 years
Life Extending Practices What are they
What life extending practices does your agency utilize if any
MTA uses an extensive maintenance program to maintain its fleet of 2400 buses Nothing on structure
Midlife overhauls of engines flooring and other components as needed fleet wide campaigns as necessary (battery replacement etc)
Preventive maintenance (PM) and Vehicle overhaul (VOH) programs
Preventive maintenance
PMs are done by mileage at 6K and 12K As the Gillig Phantoms aged they were required to have a 3K PM due to engine issues
Rigorous PM program which includes engine oil and transmission fluid analysis at each oil change interval providing early warning of problems
Mid-life overhauls interiors suspension paint engine Basic
Daily ndash pretrip 3000 mile ndash Minor mechanical 12000 mile - Major mechanical PM inspections 18-day interior housecleaning
Specify corrosion resistant structure materials (aluminum stainless steel)
New bus specification are for a stainless steel structure
Do not spec entire stainless steel bus but will specify at critical areas such as power train mounting locations
Do not spec stainless steel
None Eugene doesnrsquot have issues with corrosion
Buses speced to be built with corrosion resistant materials but allow the bus builder to specify brand
Stainless steel amp protected carbon steel
Specify undercoating
Undercoating is included in specification None
Interior tube rust inhibitor Tectyl 506 Waxoy or equal Undercarriage Tectyl 127 CG or equal
Federal Transit Administration 147
Useful Life of Transit Buses and Vans Appendix C Final Report Engineering Interviews
Questions CATS (Charlotte NC)
Golden Gate Transit (San Francisco CA)
Harris County Metro (Houston TX)
LA MTA (Los Angeles CA)
Lane Transit District (Eugene OR)
MUNI (San Francisco CA)
WMATA (Washington DC)
Warranty What are your warranty requirements for a 40rsquo transit bus
Engine
2 year standard warranty (new spec calls for 5 year extended warranty)
5 year extended warranty
2 year standard warranty METRO does not use extended warranties as FTA does not fund
2 year standard warranty
Standard 2-year On new engine designs LTD purchases extended 5-year warranties
5 years 300000 miles
Transmission
1 year standard warranty (new spec calls for 5 year extended warranty)
5 year extended warranty
2 year standard warranty
2 year standard warranty Same as engine
5 years 300000 miles
If more than 10 failure rate considered fleet
Bus structure 12 year corrosion warranty
2 year standard warranty
defect per specification
40rsquo bus ndash 12 years 500000 miles
Procurement and Legislation
Do you think the low bid process has impacted the expected useful life of transit buses and vans
CATS does not use low bid they use a Best Value negotiated procurement
Yes ndash bus builders must use lower costlower quality materials to compete andor use lower costless qualified labor to assemble bus GGT has used a negotiated procurement on their last vehicle purchase
Yes ndash they had a very bad experience with Neoplan which was a low bid procurement
Yes absolutely The MTA has been burned by low bid processes
Not if you have a tight specification If your specification is tight the manufacturer can not substitute inferior quality parts that could cause service life issues
Muni uses negotiatedbest value method In past electric trolley bus fleet procurement the low bid winner was an Eastern European manufacturer that typically had shorter life spans than North American customer expectations
Yes Negotiated procurements give more flexibility to acquire more reliable components and system
Do you think the Buy America ACT in any way impacts the expected useful life of transit buses and vans
Limits choices especially for BRT type vehicles However this is not a current concern for CATS No
No ndash does not impact useful life
No negative impact LTDrsquos challenge is complying with the regulation in performing inspections and assuring component content source
There is not enough background data to know this
EPA Emissions
CATS stated that this is a good thing It has not influenced early retirement of buses but has required retrofits to older buses
CARB regulations more stringent than EPArsquos Resulted in small California transit bus engine market of only 400 engines per year making these engines an expensive
MTA operates in the most restrictive regulatory environment State EPA audits emissions twice per year
Diesel particulate filters on 2004 engine plugging prematurely causing excess back pressure This back pressure is expected to reduce life of the engine Too early to tell how much
Federal Transit Administration 148
Useful Life of Transit Buses and Vans Appendix C Final Report Engineering Interviews
Questions CATS (Charlotte NC)
Golden Gate Transit (San Francisco CA)
Harris County Metro (Houston TX)
LA MTA (Los Angeles CA)
Lane Transit District (Eugene OR)
MUNI (San Francisco CA)
WMATA (Washington DC)
FTA ADA
Has impacted facilities but not vehicles No None
On a recent bus procurement an ADA compliant wheelchair ramp was mechanically inferior to manufacturersquos standard ramp because the cables were tested and found more likely to fail in service
FTA Bus Testing Regulation No
Good requirement Helps assure the availability of quality products
Impact of Service Environment Vehicle Structure on Useful Life
Have you had any issues in meeting the FTA 12 year minimum life requirement
Have not had an issue with 40rsquo buses No
Engine cradles with NABI buses were a problem ndash but were addressed by the manufacturer
No as long as maintenance is performed the MTA meets the 12 year life
No issues with meeting 12-year life No
Aggressive PMrsquos and mid-life overhaul programs have allowed us to meet minimum life requirements for transit buses
What is the primary determinant of the useful life of the structure (service environment age mileage) Mileage
Service environment A unique Californian impact is the requirement to recycle bus wash water ndash this was found to be corrosive to the buses
Service environment Buses on demanding service routes get beat up much more quickly than buses of similar age or mileage
1) Construction 2) Environment The MTA operates in a harsh environment Every street has manhole storm drains that beat up the fleet on a daily basis
Age mileage repair costs and safety issues
Munirsquos severe service environment (ie the topography)
Service environment age and mileage plus life extending practices
To what extent does was your service environment the cause of early vehicle retirement
Charlottersquos service environment not a major determinant of useful life
GGT replaces buses at 12-14 years this is not necessarily because they are worn out
Results in cracking body loosening of panels more rattles
The environment is a key factor in the life of the fleet
It doesnrsquot Mild temperature
Early failures are sometimes seen around the interfaces between suspension and frame or axle and suspension if not properly designed for the Muni topography
Service environment causing early retirement of the vehicle is highly unlikely
Do you consider your service environment more severe average or less severe than the national average
Less severe to average (roads are in good shape do not use salt no snow)
Less severe to average Average
More severe The buses are abused by the environment loads and service demands Less severe
Severe Muni topography is unique and requires structure development is necessary and limited to a certain extent by foreign or domestic suppliers
Average to more severe due to winter salting of road surfaces
Federal Transit Administration 149
Useful Life of Transit Buses and Vans Appendix C Final Report Engineering Interviews
Questions CATS (Charlotte NC)
Golden Gate Transit (San Francisco CA)
Harris County Metro (Houston TX)
LA MTA (Los Angeles CA)
Lane Transit District (Eugene OR)
MUNI (San Francisco CA)
WMATA (Washington DC)
Different designs Low Floor or Articulated Do you expect the Only expect 12 years Too early to tell Low useful life of low-floor from low floor buses Have not run the low floor buses require vehicles to be less but could get 15 floor artics long more frequent Hope and expect the than or greater than years from high floor enough to form an replacement of same based on standard buses buses opinion No No issues suspension parts testing and analysis Equal to standard bus
What about articulated vehicles Na
Recently purchased some New Flyer articulated buses Too early to tell Same as above Equal to standard bus
What about for smaller cutaway and body on frame constructed buses
Had a 5-year target but high mileage and demanding service made it difficult to achieve
METRO Lift vans were originally purchased to keep for 3 years ndash will keep for 5 years No data
Muni does not employ these types of buses
Plannedscheduled overhauls
Do you perform a major mid-life rehab No
No Repair replace components as needed
No Buses are fixed when broken
Sometimes (no due to funding and manpower)
No LTD has studied but decided it wasnrsquot worth doing
No (just drive train) Flooring and other components as necessary
Mid life overhauls are performed to standard 40rsquo 12-year bus at the 4 and 8-year interval
Do you perform engine transmission overhauls at regular intervals
No Replace with rebuilt engine transmission as needed Typically swap out an engine at 200000-300000 miles (6-9 years)
GGT performs regular oil and fluid analysis for engines and transmissions to identify pending enginetransmission problems
No Will replace as needed A bus will go through 2-3 engines and 3-4 transmissions over its life Engines 250000
Yes Engine 350k miles Trans 250k miles Yes Midlife
Engine and transmission overhauls are performed to standard 40rsquo 12-year bus at the mid-life vehicle overhaul
Reliability of vehicles as age increases
How significant are reliability issues as your vehicles approach the end of their useful life
CATS is a young agency and it does not have long term service experience
GGT has not seen a deterioration of vehicle reliability as vehicles age This attributed to the PM program
Will see vehicles become more expensive to run as they age
If the fleet is maintained the life can be achieved
Maintenance requirements do go up as age of vehicle increases
It varies from fleet type to fleet type
Vehicles approaching the end of their useful life are less reliable and more costly to maintain depending on the life extending practices employed
Do you have quantitative measures of reliability versus vehicle age
Quarterly audits are performed that sample 25 of the fleet
METRO tracks operating costs not necessarily reliability Buses are replaced when they are considered too expensive to operate
No In process of switching to a new maintenance management system Yes
No quantitative measures of vehicle reliability vs age are employed at this time
Federal Transit Administration 150
Useful Life of Transit Buses and Vans Appendix C Final Report Engineering Interviews
Questions CATS (Charlotte NC)
Golden Gate Transit (San Francisco CA)
Harris County Metro (Houston TX)
LA MTA (Los Angeles CA)
Lane Transit District (Eugene OR)
MUNI (San Francisco CA)
WMATA (Washington DC)
Have you encountered issues sourcing replacement components for older buses
Yes ndash this is always an issue
Yes ndash can no longer get parts for Neoplans and have problems sourcing parts for European OTR coaches In contrast older RTS buses kept in service for up to 18 years
Yes Example Detroit Diesel has gone out of the transit bus business Parts are no longer available
No Oldest buses are 1991 Gilligs Parts are available
Yes This happens often with non-US supplied parts or if the bus builder or supplier goes out of business
New vehicle procurement contracts contain provisions that ensure support from the OEM for the life of the vehicle for items such as replacement parts
Alt-Fuels and Hybrid Vehicles
Has the useful life of alt fuels vehicles been less than standard diesel vehicles
CATS has two Allison hybrids There is concern that the extra weight may impact structure life
NA Will begin testing ethanoldiesel blend this year
No longer operate alternate fuel vehicles due to fueling station issues
Too early to tell The CNG buses require 30 more manpower to maintain Na Too early to tell
We anticipate their useful life to be equal to standard bus
Alternatively how does their long-term maintainability compare with standard diesel vehicles
The hybrid buses have very low maintenance Both buses have exceeded 50 longer brake life and may also achieve longer oil change intervals NA Na
Too early to compare Anticipate Muni may have to spend more time maintaining batteries Equal to standard bus
New Technologies (AVL AVM APCs Multiplexing collision avoidance cameras)
How do you expect the long-term performance of vehicles with new technologies will compare with older less technology oriented vehicles
Will take more resources to maintain buses with additional equipment which will impact vehicle life if maintenance resources switched from vehicle PM to maintaining new technology
Too early to tell Think of this type of equipment as separate from the bus Upgrades are necessary as the equipment ages independent of the bus age Equal to standard bus
Alternatively how do you expect their long-term maintainability to compare to standard vehicles with less equipment
All of these systems result in higher electrical loads on the bus It is expected that there will be electrical system problems previously not seen on standard buses with less equipment
Maintaining new technologies is a challenge The staff are not trained on maintaining new technologies
The more high tech features a bus has the more failures are experienced For example a new fleet of electric trolley buses had significantly higher failure rates (lower mean distances between failures) Equal to standard bus
Federal Transit Administration 151
Useful Life of Tran Final Re
sit Buses and Vans Appendix C port Engineering Interviews
Questions CATS (Charlotte NC)
Golden Gate Transit (San Francisco CA)
Harris County Metro (Houston TX)
LA MTA (Los Angeles CA)
Lane Transit District (Eugene OR)
MUNI (San Francisco CA)
WMATA (Washington DC)
Do you think reliability with these vehicles as they age will lead to the need for a greater spare fleet
Anticipate that all these additional systems will have an impact on long-term life of electrical system due to the additional loads (have not had good reliability with cameras) Bus radio is the system that will keep a bus from going into service
No Currently buses are not held out of service if these systems (ie cameras) are not working
These technologies will increase maintenance costs but will not impact useful life
This may be an issue Too early to tell Yes
No at this time we do not anticipate the need for a greater spare fleet due to reliability issues
Federal Transit Administration 152
Useful Life of Transit Buses and Vans Appendix D Final Report Minimum Life-Cycle Cost Methodology
APPENDIX D MINIMUM LIFE-CYCLE COST METHODOLOGY
Chapter 7 presents the results of life-cycle cost analyses for each of the existing FTA minimum service-life categories This appendix presents the methodology behind that analysis Specifically this discussion includes
bull Adjustment of participant agency supplied life-cycle cost data to reflect differences in annual fleet mileage
bull Calculation of annualized cost factors
bull Calculation of annualized vehicle acquisition major component replacements and vehicle rehabilitation costs
bull Regression analysis and annualization of OampM costs
bull Calculation of total annualized costs
Conversion of Participant Life-Cycle Costs to Reflect Differences in Annual Mileage
Agencies and vehicle manufacturers participating in this study supplied life cycle costs for major component replacements and rehabilitations of their transit vehicles (see Appendix E) Note however that the agencies providing data have annual mileages that are close to the national average (ie about 37000 miles annually for a 12-year bus) Hence while the timing of major component replacements for these agencies is representative of industry averages they are not representative of agency fleets with lower or higher average annual mileages (eg 25000 or 45000 miles per vehicle per year respectively) As discussed in Chapter 6 agencies with lower annual fleet mileages per vehicle will be able to ldquostretch-outrdquo their major component replacement cycles while agencies with high annual mileages per vehicle will need to accelerate those cycles relative to operators with average fleet mileages
Therefore to conduct analyses considered representative of the nationrsquos full distribution of transit fleet mileages the life-cycle cost data were adjusted to replicate the annual mileage of three separate annual vehicle mileage groups 25000 miles 35000 miles and 45000 miles This adjustment was completed by first converting each componentrsquos reported replacement age to a replacement mileage value based on the annual vehicle mileage of the operator supplying the data (ie multiply annual mileage by the component replacement age) Next the replacement mileage values for each major component were used to determine the number of years that component would remain in service for fleets of varying annual average vehicle mileages For example if bus engine was determined to have roughly 250000 miles between rebuilds operators with only 25000 miles in annual service only need to rebuild this engine in (250000 miles) (25000 miles per year) = 10 years In contrast an agency operating its vehicles 45000 miles each year will need to rebuild the engine in roughly 55 years
Federal Transit Administration 153
Useful Life of Transit Buses and Vans Appendix D Final Report Minimum Life-Cycle Cost Methodology
Calculation of Annualized Cost Factors
Next all vehicle costsmdashincluding the cost of vehicle acquisition major component replacements rehabilitation activities and operating and maintenance (OampM) costsmdashneed to be converted to an annualized basis Annualizing tells us what the cost of each item would be on a per year basis if maintained in service for x years Here the value of the annualized cost can be calculated for any value of x allowing determination of the annualized cost if the vehicle is owned for a period of time including 1 year 2 years 12 years 18 years or more
Table D-1 The factor for annualizing any cost is given by the Annualization Factors (70) following Annualization
Years Factor 1Years minustAnnualized Cost Factor= (i (1minus(1+ i) )) 1 1070 1000
2 0553 0500 Here t is the number of years a component or 3 0381 0333
4 0295 0250 vehicle is expected to remain in service and i is the 5 0244 0200 discount rate (set to 7 percent for this analysis in 6 0210 0167 compliance with OMB guidance) Note that the 7 0186 0143
value of the annualized cost factor declines as the 8 0167 0125 number of service years for a component increases 9 0153 0111 (ie as the cost of that component is spread over an 10 0142 0100 increasing number of service years) The values for 11 0133 0091 the annualized cost factor at different years of 12 0126 0083
13 0120 0077 service are presented in Table D-1 (for the sake of 14 0114 0071 comparison Table D-1 also includes the value of 15 0110 0067 1years a frequently used but imprecise means of 16 0106 0063 estimating annualized cost) 17 0102 0059 18 0099 0056
Calculation of Annualized Vehicle 19 0097 0053 20 0094 0050 Acquisition Major Component
Replacement and Rehabilitation Costs
Next these annualized cost factors were used to estimate the annualized value of all vehicle costs excluding OampM costs This was merely a matter of annualizing the costs of vehicle acquisition major component replacement and rehabilitation activities using the annualization factors This calculation is presented below The double summation represents the discounted cost of all components (x) replaced as of vehicle age t The value Annualized Vehicle Cost t then provides a vehiclersquos total annualized cost value were that vehicle to be retired at age t (excluding OampM costs which are considered next)
minustAnnualized Vehicle Costt = (Vehicle Acquisition Cost+sumsumComponentCostxt )(i (1minus(1+ i) ))
Federal Transit Administration 154
Useful Life of Transit Buses and Vans Appendix D Final Report Minimum Life-Cycle Cost Methodology
Regression Analysis and Annualization of OampM Costs
To this point the analysis has excluded all vehicle OampM costs (eg fuel preventive maintenance and corrective maintenance) As noted in Chapter 6 OampM costs tend to increase overtime as vehicles age (ie as smaller parts begin to fail more regularly and fuel economy tends to decrease) The first step for this analysis was to develop regression models to model increasing OampM costs with increasing vehicle age Unfortunately this study did not have the resources required to conduct a detailed primary data collection effort of OampM costs by vehicle age for all five minimum service-life categories (and across multiple operators) For this reason members of the study team drew upon an earlier analysis completed for a group of over 40 different small and medium sized bus operators based in Illinois Together these Illinois operators use each of the bus and van types represented by FTArsquos five minimum service-life categories and have multiple years of cost records for their vehicle fleets
Analysis of Illinois OampM cost data yielded the following regression model of OampM cost per mile at vehicle life-to-date (LTD) mileage x for 40-foot buses (t-stats in parenthesis)
Cost per mile at LTD mileage x = -0783 + 401E-07( LTD Miles) ndash 00317(Operating Speed) (-941) (511) (-527)
The results of this model are presented in Figure D-1
Figure D-1 Life Cycle Cost Profiles Annualized OampM Costs
(35000 miles per year 40 Ft bus)
$0
$5000
$10000
$15000
$20000
$25000
$30000
$35000
$40000
$45000
$50000
Ann
ualiz
ed V
ehic
le O
ampM
Cos
ts
Low Speed (8 mph) 35000 miles per yr
Medium Speed (12 mph) 35000 miles per yr
High Speed (20 mph) 35000 miles per yr
1 2 3 4 5 6 7 8 9 10 11 12 13 14 15 16 17 18 19 20
Vehicle Age (years)
Finally the equation above provides the cost per mile at different LTD mileages However to calculate the annualized values of OampM costs at age t these LTD mileage based costs must be summed across the full life of the vehicle through age t discounted and then annualized
Federal Transit Administration 155
Useful Life of Transit Buses and Vans Appendix D Final Report Minimum Life-Cycle Cost Methodology
Calculation of Total Annualized Costs
Once OampM costs are added to the mix the final calculation of total annualized cost is given by
minustAnnualizedVehicle Costt = (Vehicle Acquisition Cost+sumsumComponentCostxt + LTD O amp M Costs)(i (1minus (1+ i) ))
This analysis was then used to calculate total annualized cost at each age to determine the specific vehicle age at which life-cycle costs for each vehicle type are minimized
Federal Transit Administration 156
Useful Life of Transit Buses and Vans Appendix E Final Report Heavy-Duty Vehicle Life-Cycle Cost Analysis
APPENDIX E HEAVY-DUTY VEHICLE LIFE-CYCLE COST ANALYSIS
Chapter 7 provides a high-level minimum life-cycle cost analysis for heavy-duty 12-year transit buses The presentation there is indented to provide the reader with a high-level overview of that analysismdashyielding an understanding of the results but without focusing on the details of the analysis In contrast this appendix reproduces much of that presentation this time providing an understanding of the details behind that analysis (including application of the minimum life-cycle cost analysis as presented in Appendix D)
Heavy Duty Vehicle Life-Cycle Cost Analysis
Using the analysis of national differences in operating characteristics and rehabilitation practices as presented in Chapter 6 this appendix develops a detailed life-cycle cost analysis of the 12shyyear 40-foot vehicles that constitute the bulk of the nationrsquos bus transit fleets This analysis is then used to identify that point in the vehicle life cycle when the sum total of all annualized costs (capital operating maintenance and rehabilitation) is minimized This minimum life-cycle cost point represents a financially optimal age to retire and replace a vehicle in effect providing a measure of ldquoeconomic useful liferdquo (as distinguished from an engineering useful life or other measure) As expected the point at which life-cycle costs are minimized can vary appreciably given differences in annual mileages average operating speeds and rehabilitation practices
Specifically this analysis considers the following life-cycle costs
bull Acquisition Cost and Disposal Value Purchase cost plus related procurement costs as well as the expected sale price or scrap value of the used vehicle
bull Expected Component Replacements and Mid-Life Overhaul Costs This includes the cost of all expected component replacements and rebuilds that naturally occur over the life of a vehicle (eg drive train rebuild) as well as the cost of any additional planned mid-life overhaul activities (if any) These costs are oriented toward the larger component replacement rebuild or rehabilitation needs and exclude the cost of minor vehicle repairs Examples include ndash Engine and transmission rebuilds ndash Other expected component replacements (eg brakes tires batteries suspension) ndash Mid-life overhaul costs (eg repainting replacement of flooring upholstery windows
bodywork)
bull Operating and Maintenance Costs Includes the cost of fuel preventative maintenance programs and the cost of all labor and parts for minor repairs as required to maintain vehicles in good working order
Federal Transit Administration 157
Useful Life of Transit Buses and Vans Appendix E Final Report Heavy-Duty Vehicle Life-Cycle Cost Analysis
The following sub-sections provide an analysis of the expected annual cost of these different cost types throughout the vehicle life cycle beginning with a discussion of expected component replacement and mid-life overhaul costs
Expected Component Replacement and Overhaul Costs
Figure E-1 presents the distribution of expected major component replacement and overhaul costs over a potential 20-year life cycle for a 40-foot transit bus (hence it excludes the cost of vehicle acquisition and all other vehicle operating and maintenance costs) The chart assumes a vehicle that averages 35000 miles per year over the full life cycle The chart also considers the two cases of (1) those agencies that complete an extensive mid-life overhaul and (2) those agencies that do not complete a mid-life rebuild but carry out their major component replacements on a continuous as-needed basis The analysis also assumes that the number of times a given replacementrebuild activity is performed depends on the vehiclersquos age at the time of retirement For example if engine rebuilds occur on roughly a six-year cycle (every 210000 miles) then this activity will occur once for a vehicle retired before 12 years twice for a vehicle retired before 18 years and 3 times for a vehicle retired at age 20 or later Similarly it is assumed that agencies currently pursuing a major mid-life rebuild program at vehicle age 7 (for example) would want to repeat the process again at age 14 if the vehicle was expected to operate well past that age
Figure E-1
Life Cycle Cost Profile Major Component Replacements and Overhauls
Maj
or C
ompo
nent
Rep
lace
men
ts a
nd O
verh
aul C
osts
$140000
$120000
$100000
$80000
$60000
$40000
$20000
$0
(Assumes 35000 miles per year)
Major Mid-Life Overhaul (40ft)
Continuous Rehabilitation (40 ft)
Optional (Rehab activities not
performed within 1 to 3 years of retirement)
1 2 3 4 5 6 7 8 9 10 11 12 13 14 15 16 17 18 19 20
Vehicle Age (years)
In reviewing Figure E-1 it is easy to identify the timing of major vehicle replacement activities In particular the timing of the seven-year major mid-life overhaul (and its potential repetition at age 14) stands out clearly These investments include the cost of engine and transmission rebuilds repainting significant rehab and replacement of vehicle interiors (flooring upholstery and windows) bodywork as needed some electrical work and other upgrades In contrast the mid-life peaks for those agencies that do not perform a major mid-life overhaul are significantly
Federal Transit Administration 158
Useful Life of Transit Buses and Vans Appendix E Final Report Heavy-Duty Vehicle Life-Cycle Cost Analysis
lower (fewer rehab activities equate to lower costs) but also have higher cost peaks for the intervening years (as some replacement activities tend to be more spread out) The smaller peaks primarily represent replacement of those components having shorter expected lives including tires brakes and batteries
From the viewpoint of evaluating FTArsquos service-life policy the key point is that whether or not an agency conducts a major mid-life overhaul there are major cost cycles that are repeated throughout an vehiclersquos life cycle which are roughly concurrent with drive-train rebuilds (eg the cost peaks at roughly ages 6 to 7 and 12 to 14 in Figure E-1) These major cycles help guide agency rehab-replacement decisionsmdashspecifically agencies will only complete a major vehicle rehabilitation initiative if they intend to keep that vehicle in service for at least three to five years after these improvements have been made For example in the case of a heavy-duty vehicle approaching 12 years in age an agency will only reinvest in that vehicle (eg rebuildreplace the engine and transmission) if the agency intends to obtain an additional three to five years of revenue service from that vehicle Otherwise these rehabilitation activities will be avoided (to save cost) and the vehicle will be retired after the minimum retirement requirements have been satisfied To summarize vehicle rehab and replacement decisions are determined by the timing of the vehiclersquos major reinvestment cycles with the timing of these cycles determined by annual vehicle mileage average operating speed and environment and agency maintenance practices
Finally the difference in the timing of the ldquomid-liferdquo activities as presented in Figure E-1 is an artifact of the particular operating characteristics maintenance practices and service performance standards of the sample of agencies that provided data for this study In other words it should not be expected that all major mid-life overhauls only occur at age seven (they may happen earlier or later depending on differences in average annual mileage rehab policies funding availability and other factors) Similarly those agencies that perform more continuous rehabs do not all concentrate their ldquomid-liferdquo activities at age six Rather these activities are ldquospread outrdquo over multiple years Again the exact timing of these activities can and do occur at differing times for different agencies depending on differences in annual mileages rehabilitation practices and operator finances
Figure E-2 highlights how differences in annual vehicle mileages can impact the timing and cost of component replacement and overhaul activities Specifically this example presents the expected life-cycle cost profile for agencies performing major mid-life rebuilds but with fleet vehicles traveling an average of 45000 35000 or 25000 miles per year As expected vehicles traveling fewer miles per year require less frequent component replacements (and hence lower average annual costs) while higher mileage vehicles have more frequent component replacement needs This same analysis is repeated for those agencies that do not perform major mid-life rehabs in Figure E-3
Federal Transit Administration 159
Useful Life of Transit Buses and Vans Appendix E Final Report Heavy-Duty Vehicle Life-Cycle Cost Analysis
Figure E-2 Life Cycle Cost Profiles Major Component Replacements and Overhauls
(Agenices Performing Major Mid-Life Overhauls)
1 2 3 4 5 6 7 8 9 10 11 12 13 14 15 16 17 18 19 20
Vehicle Age (years)
Annualized Acquisition Major Component Replacement and Overhaul Costs
The analysis next adds the cost of vehicle acquisition to the component and mid-life rehabilitation costs considered above (operating and maintenance costs are considered shortly) All of these costs are then annualized over different time periods The combined annualized costs are presented in Figure E-4 The cost values in this chart provide a measure of the average cost of ownership for a 40-foot vehicle at each vehicle age15 As the number of years of ownership increase the vehiclersquos acquisition cost is spread over an increasing number of years thus reducing the average annualized cost of ownership (leading to the downward sloping curve) The bumps in this curve capture the timing of major component replacement and overhaul activities (costs that also decrease on an annualized basis as vehicle age increases as these costs are spread over increasing years of service)
$0
$20000
$40000
$60000
$80000
$100000
$120000
$140000
$160000
$180000
Maj
or C
ompo
nent
Rep
lace
men
ts a
nd O
verh
aul C
osts
Major Mid-Life Overhaul (40ft) 45000 miles per yr
Major Mid-Life Overhaul (40ft) 35000 miles per yr
Major Mid-Life Overhaul (40ft) 25000 miles per yr
Optional (Rehab activities not
performed within 1 to 3 years of retirement)
15 More precisely annualized cost is not the actual cost divided by the number of years of service (eg acquisition cost vehicle age) Rather annualized cost represents the stream of annual payments the net present value of which are equivalent to the initial investment cost Specifically the annualized cost of the vehicle acquisition cost for any age is given by
minus Vehicle Age )(Acquisition Cost ) (i (1minus (1+ i) ( ))
Federal Transit Administration 160
Useful Life of Transit Buses and Vans Appendix E Final Report Heavy-Duty Vehicle Life-Cycle Cost Analysis
Figure E-3 Life Cycle Cost Profiles Major Component Replacements and Overhauls
(Agenices Performing Continuous Rehabilitations) $120000
Continuous Rehab (40ft) 45000 miles per yr
Continuous Rehab (40ft) 35000 miles per yr
Continuous Rehab (40ft) 25000 miles per yr $100000
$80000
Optional (Rehab activities not
performed within 1 to 3 $60000 years of retirement)
$40000
$20000
$0
1 2 3 4 5 6 7 8 9 10 11 12 13 14 15 16 17 18 19 20
Vehicle Age (years)
Figure E-4 Life Cycle Cost Profiles Vehicle Acquisition Major Component
Replacements and Overhaul Costs (excludes OampM costs) (Assumes 35000 miles per year)
$140000
$120000 Major Mid-Life Overhaul (40ft)
Continuous Rehabilitation (40 ft) $100000
$80000
$60000
$40000
$20000
$0 1 2 3 4 5 6 7 8 9 10 11 12 13 14 15 16 17 18 19 20
Vehicle Age (years)
Figure E-5 reproduces the analysis in Figure E-4 for those agencies that do pursue comprehensive mid-life overhauls but this time for the three annual mileage groupings including 45000 35000 or 25000 miles Figure E-6 does the same for agencies that perform vehicle rehabilitation on a more continuous basis Both of these charts capture the increase in annualized cost as annual vehicle miles increase the higher annualized costs for those agencies pursuing
Tota
l Ann
ualiz
ed C
osts
M
ajor
Com
pone
nt R
epla
cem
ents
and
Ove
rhau
l Cos
ts
Federal Transit Administration 161
Useful Life of Transit Buses and Vans Appendix E Final Report Heavy-Duty Vehicle Life-Cycle Cost Analysis
extensive mid-life overhauls and the overall flattening of the annualized cost curves as the number of years of service approaches and surpasses 12 years
Figure E-5 Life Cycle Cost Profiles Vehicle Acquisition Major Component
Replacements and Overhaul Costs (excludes OampM costs) (Agencies that Perform Major Mid-Life Overhauls)
$140000
$120000
$100000
$80000
$60000
$40000
$20000
$0
Tota
l Ann
ualiz
ed C
osts
To
tal A
nnua
lized
Cos
ts
Major Mid-Life Rebuild (40ft) 45000 miles per yr
Major Mid-Life Rebuild (40ft) 35000 miles per yr
Major Mid-Life Rebuild (40ft) 25000 miles per yr
1 2 3 4 5 6 7 8 9 10 11 12 13 14 15 16 17 18 19 20
Vehicle Age (years)
Figure E-6
Life Cycle Cost Profiles Vehicle Acquisition Major Component Replacements and Overhaul Costs (excludes OampM costs)
(Agencies that Perform Continuous Rehabilitation) $140000
$120000
$100000
$80000
$60000
$40000
$20000
$0
Continuous Rehab (40ft) 45000 miles per yr
Continuous Rehab (40ft) 35000 miles per yr
Continuous Rehab (40ft) 25000 miles per yr
1 2 3 4 5 6 7 8 9 10 11 12 13 14 15 16 17 18 19 20
Vehicle Age (years)
Federal Transit Administration 162
Useful Life of Transit Buses and Vans Appendix E Final Report Heavy-Duty Vehicle Life-Cycle Cost Analysis
$0
$5000
$10000
$15000
$20000
$25000
$30000
$35000
$40000
$45000
$50000
Ann
ualiz
ed V
ehic
le O
ampM
Cos
ts
Low Speed (8 mph) 35000 miles per yr
Medium Speed (12 mph) 35000 miles per yr
High Speed (20 mph) 35000 miles per yr
Annualized Operating and Maintenance Costs
The analysis above considers all life-cycle costs excluding basic operating and maintenance (OampM) costs (ie the cost of fuel and corrective and preventive maintenance) As described above vehicle OampM costs tend to increase as the total number of vehicle miles increase OampM costs also tend to be higher for fleets operating in more congested urban areas and hence experiencing heavy-duty cycles Figure E-7 presents estimates of changes in annual vehicle operating and maintenance costs based on data obtained from a sample of bus operators throughout the State of Illinois
Figure E-7 Life Cycle Cost Profiles Annualized OampM Costs
(35000 miles per year 40 Ft bus)
1 2 3 4 5 6 7 8 9 10 11 12 13 14 15 16 17 18 19 20
Vehicle Age (years)
Total Annualized Life-Cycle Costs
Finally this section combines all of the prior annualized costsmdashincluding the costs of vehicle acquisition major component replacement major overhaul (if any) and operations and maintenance (OampM) costsmdashinto a single annualized cost measure The analysis then considers the annualized vehicle costs and minimum cost replacement points for the following combinations of operator characteristics
bull Performance of major mid-life overhaul yes or no
bull Differing annual average mileages 25000 35000 and 45000 miles per year
bull Number of overhauls (for agencies performing major mid-life overhauls) or drive train rebuilds (for agencies performing continuous rehabilitation) over the life of the vehicle including No overhaul (or drive train rebuild) one overhaul (or drive train rebuild) and multiple overhauls (or drive train rebuilds)
This represents a total of 18 different scenarios for analysis
Federal Transit Administration 163
Useful Life of Transit Buses and Vans Appendix E Final Report Heavy-Duty Vehicle Life-Cycle Cost Analysis
Agencies Performing Major Mid-Life Overhauls
Figure E-8 presents the total life-cycle cost profile (including annualized acquisition component replacement vehicle overhaul and OampM costs) for an agency that (1) performs a major mid-life overhaul and (2) operates its fleet vehicles an average of 35000 miles per year (roughly the national average) The three lines in the chart consider the differing options of (1) performing no mid-life overhaul (including no mid-life drive train rebuild) (2) performing one mid-life overhaul (the standard) and (3) performing two ldquomid-liferdquo overhauls (the second to extend vehicle life toward 20 years)
Figure E-8 Total Life Cycle Cost Profiles
Tota
l Ann
ualiz
ed L
ife C
ycle
Cos
ts
$200000
$180000
$160000
$140000
$120000
$100000
$80000
$60000
$40000
$20000
$0
Major Mid-Life Overhaul 35000 miles per yr
No Overhaul
One Overhaul Only
Multiple Overhauls
End of useful life
1 2 3 4 5 6 7 8 9 10 11 12 13 14 15 16 17 18 19 20
Vehicle Age (years)
Note that the cost curve for the ldquono overhaulrdquo scenario has been cut off at age 8 while the curve for the ldquoone overhaul onlyrdquo curve has been cut off at vehicle age 15 These cut-off points reflect the assumption that agencies not performing an engine and transmission rebuild at approximately age six or seven cannot expect the vehicle to remain in reliable working order more than a few years (eg age eight) Similarly if the agency completed a major rebuild at age 7 an additional major rebuild will be required to maintain service quality beyond age 14 or 15 The results in Figure E-8 suggest that total annualized life-cycle costs are (1) minimized at different vehicle ages for the three major overhaul options (none one or two) and (2) are lowest for the one-overhaul option and highest for the two-overhaul option Table E-1 presents the cost minimum amounts and ages for these three alternatives
Federal Transit Administration 164
Useful Life of Transit Buses and Vans Appendix E Final Report Heavy-Duty Vehicle Life-Cycle Cost Analysis
Table E-1 Life-Cycle Cost Minimums Major Mid-Life Overhauls ndash 35000 Annual Miles
Number of Overhauls Annualized Life-Cycle Cost Minimum ($2006)
Vehicle Age at Cost Minimum (years)
No Overhaul $99000 Between 7 to 8 One Overhaul $91000 Between 14 to 15 Multiple Overhauls $96000 13
This option does not make logical sense as the minimum cost point is reached before the second major rehabilitation
Both the chart and table indicate that the one-overhaul option is the optimal choice from a cost perspective and that this minimum cost point is reached at roughly age 14 to 15 or two to three years after the current FTA service-life minimum for this ldquo12-yearrdquo vehicle type In contrast the multiple-overhaul option is not cost effective relative to either the no- or one-overhaul options (as its cost minimum is both higher and earlier than the one-overhaul alternative and prior to the second overhaul) Overall the annualized cost differences between each option are clear but not significantly different (ie the most expansive no-overhaul option is roughly 10 percent more than the least expensive one-overhaul option)
Figure E-9 Total Life Cycle Cost Profiles
Major Mid-Life Overhaul 45000 miles per yr
1 2 3 4 5 6 7 8 9 10 11 12 13 14 15 16 17 18 19 20
Vehicle Age (years)
The analysis above suggests that life cycle costs for a 40-foot vehicle averaging roughly 35000 miles per year and receiving a major mid-life overhaul occurs roughly around age 14 or 15 or two to three years after the current FTA minimum of 12 years Note here that 35000 annual miles is roughly the national average for this vehicle type
For vehicles with lower or high average annual mileages Figure E-9 considers the life-cycle cost profiles for the 45000 annual mile scenario and Figure E-10 for the 25000 annual mile scenario
$0
$20000
$40000
$60000
$80000
$100000
$120000
$140000
$160000
$180000
$200000
Tota
l Ann
ualiz
ed L
ife C
ycle
Cos
ts
No Overhaul
One Overhaul Only
Multiple Overhauls
End of useful life
Federal Transit Administration 165
Useful Life of Transit Buses and Vans Appendix E Final Report Heavy-Duty Vehicle Life-Cycle Cost Analysis
Figure E-10 Total Life Cycle Cost Profiles
Major Mid-Life Overhaul 25000 miles per yr
1 2 3 4 5 6 7 8 9 10 11 12 13 14 15 16 17 18 19 20
Vehicle Age (years)
High Annual Mileage (45000 per year) Figure E-9 considers the case of an agency that does perform an extensive mid-life overhaul with fleet vehicles traveling an average of 45000 miles per year In this case the one-overhaul option is clearly the most cost effective (Table E-2) In this case the cost minimum is reached somewhere between 11 and 12 years of vehicle life and close to 500000 miles In contrast neither the multiple major overhaul nor the no-overhaul options appear while the no-overhaul option being (marginally) the most expensive
Table E-2 Life-Cycle Cost Minimums Major Mid-Life Overhauls ndash 45000 Annual Miles
$0
$20000
$40000
$60000
$80000
$100000
$120000
$140000
$160000
$180000
$200000
Tota
l Ann
ualiz
ed L
ife C
ycle
Cos
ts
No Overhaul
One Overhaul Only
Multiple Overhauls
End of useful life
Number of Overhauls Annualized Life-Cycle Cost Minimum ($2006)
Vehicle Age at Cost Minimum (years)
No Overhaul $115000 7 One Overhaul $108000 Between 11 and 12 Multiple Overhauls $114000 Between 10 and 11
Low Annual Mileage (25000 per year) Figure E-10 considers an agency that does perform an extensive mid-life overhaul but with fleet vehicles traveling an average of 25000 miles per year In this case the no-overhaul option is the most cost effective (Table E-3) but only marginally more so as compared to the one-overhaul option
Table E-3 Life-Cycle Cost Minimums Major Mid-Life Overhauls 25000 Annual Miles
Number of Overhauls Annualized Life-Cycle Cost Minimum ($2006) Vehicle Age at Cost Minimum
No Overhaul $74000 10 One Overhaul $78000 17 Multiple Overhauls $79000 19
Federal Transit Administration 166
Useful Life of Transit Buses and Vans Appendix E Final Report Heavy-Duty Vehicle Life-Cycle Cost Analysis
As will be shown later when considering those agencies that do not perform a major-mid-life overhaul (ie those that perform continuous rehabilitations) agencies with lower annual mileage per fleet vehicle may be better off performing less than the full overhaul and retiring their 12shyyear fleet vehicles some time after ages 14 or 15 (Note here that this and all other scenarios were evaluated based on the data obtained for this study In reality it is not certain that there are any agencies with low annual miles per vehicle that actually perform a full life-extending overhaul)
Summary Agencies Performing Major Mid-Life Overhauls
In summary for those agencies that do perform major life-extending rehabilitations the one-overhaul option appears to be the most cost effective for most operators (ie those with average or higher annual mileage) From a cost-effective perspective those with lower mileage (ie less than or equal to 25000 miles annually) are likely best off performing a scaled-down rehabilitation around age 9 and then operating the vehicle past age 14 (this scenario will be considered in greater depth in the following section under the ldquocontinuousrdquo rehabilitation agency discussion) The multiple-overhaul option was not found to be cost effective within the scenarios considered here (in all cases this option experiences its cost minimum before a second rehabilitation is undertaken) Finally while the one-overhaul option generally appears to be the most cost effective the total life-cycle cost difference between this and the no-overhaul option (on an annualized basis) was not found to be more than 10 percent
Implications for Useful Life Agencies Performing Major Mid-Life Overhauls
When evaluated solely in terms of cost-effectiveness vehicles with average mileages of between 35000 and 45000 miles per year reach their minimum annualized life-cycle cost after the FTArsquos current 12-year minimum retirement age (ie 14 years for vehicles with 35000 annual miles and 12 years for vehicles with 45000 annual miles) Assuming agencies with lower mileages choose to avoid the more-extensive mid-life rehabilitation in favor of the less-expensive continuous rehabilitation (as discussed below) these agencies reach their minimum annualized life-cycle cost between ages 14 and 16 (depending on the rehabilitation activities completed)
Agencies Practicing Continuous Rehabilitation
The preceding analysis considered those agencies that undertake major life-extending overhauls some time near the mid-point of a vehiclersquos expected useful life (examples include New York City Transit New Jersey Transit and WMATA) These agencies are characterized by above-average duty cycles high ridership and highly congested urban environmentsmdashfactors that require more significant rehabilitation activities to ensure reliable operability and quality of service over the vehiclersquos life In contrast most US transit operators (in particular the smaller and mid-size operators) do not perform a single major mid-life overhaul Rather these agencies complete rehabilitation activities on an as-needed or continuous basis Moreover these agencies will ultimately perform many if not most of the same rehabilitation activities as those agencies that do complete a major overhaul but not in a single coordinated event In other words these operators tend to spread their rehabilitation activities throughout the vehiclersquos life cycle
Federal Transit Administration 167
Useful Life of Transit Buses and Vans Appendix E Final Report Heavy-Duty Vehicle Life-Cycle Cost Analysis
Rehabilitation Assumptions Once again agencies performing continuous vehicle rehabilitation complete many of the same rehabilitation activities as those conducting a full mid-life overhaul The following are key examples of rehabilitation activities not typically performed by continuous rehabilitation operators chassis or structural element refurbishment or reconstruction (not related to a significant accident) major body work complete refurbishment of vehicle interior replacement of fare collection equipment interior climate control replacement and electrical system upgrades16
Similar to the analysis above this analysis of the continuous rehabilitation operators does assume that operators make a determination of how many major rehabilitation cycles their vehicles undergo throughout the vehiclersquos life cycle Specifically the analysis considers the options of (1) one drive train rebuild (2) multiple drive train rebuilds or (3) no drive train rebuild Despite its name the ldquono drive train rebuildrdquo scenario considered here does assume one transmission rebuild three or four years into the vehicle life cycle However this is the only drive train rehabilitation activity assumed under the ldquono drive train rebuildrdquo scenario
Average Annual Mileage (35000 per year) Figure E-11 presents the total life-cycle cost profile (including annualized acquisition component replacement vehicle overhaul and OampM costs) for an agency that (1) performs continuous vehicle rehabilitation and (2) operates its fleet vehicles an average of 35000 miles per year (roughly the national average)
Figure E-11 Total Life Cycle Cost Profiles
Continuous Rehabs 35000 miles per yr
1 2 3 4 5 6 7 8 9 10 11 12 13 14 15 16 17 18 19 20
Vehicle Age (years)
16 In practice the complete list of rehabilitation activities performed over a vehiclersquos life cycle can vary significantly across agencies Hence some ldquocontinuous rehab agenciesrdquo may perform one or more of the rehabilitation activities excluded from this analysis of this agency ldquotyperdquo Moreover continuous rehab agencies will sometimes need to perform some of these activities on a periodic basis due to extenuating circumstances (eg problem vehiclescomponents or accident repairs) The intention here is to group operators into two basic types those that do and those that do not perform major mid-life overhauls In reality there is a range of rehabilitation practices each particular to the specific needs objectives and management practices of the nationrsquos many bus operators
$0
$20000
$40000
$60000
$80000
$100000
$120000
$140000
$160000
$180000
$200000
Tota
l Ann
ualiz
ed L
ife C
ycle
Cos
ts
No Drive Train Rebuild
One Drive Train Rebuild Only
Multiple Drive Train Rebuilds
End of useful life
Federal Transit Administration 168
Useful Life of Transit Buses and Vans Appendix E Final Report Heavy-Duty Vehicle Life-Cycle Cost Analysis
Table E-4 shows that in this case the one-drive-train rebuild option is clearly the most cost effective Similar to the above the multiple-drive-train rebuild scenario experiences its cost minimum prior to the second rebuild event thus negating any logic to multiple rebuilds In contrast the no-drive-train rebuild scenario does not provide sufficient time to distribute vehicle acquisition costs over sufficient years to compete with the one-rebuild option This option is roughly 15 percent more costly as compared to the one-drive-train rebuild option
Table E-4 Life-Cycle Cost Minimums Continuous Rehabilitation ndash 35000 Annual Miles
Number of Overhauls Annualized Life-Cycle Cost Minimum ($2006) Vehicle Age at Cost Minimum
No Drive Train Rebuild $97000 7 One Drive Train Rebuild $85000 14 Multiple Drive Train Rebuilds $94000 11
High Annual Mileage (45000 per year) Figure E-12 considers the case of an agency performing continuous rehabilitations with fleet vehicles traveling an average of 45000 miles per year Here again the one-drive-train rebuild option is easily the most cost effective occurring at roughly age 14 This option is roughly 15 percent more cost effective as compared to the no-drive-train rebuild option
Table E-5 summarizes the life-cycle cost analysis and the results of the minimum-cost values for each of the high-mileage scenarios presented in Figure E-12 For this higher-mileage scenario the one-rebuild option is necessary to reach the 12-year life and provides the lowest minimum life-cycle cost
Figure E-12 Total Life Cycle Cost Profiles
Continuous Rehabs 45000 miles per yr $200000
$180000
$160000
$140000
$120000
$100000
$80000
$60000
$40000
$20000
$0
Tota
l Ann
ualiz
ed L
ife C
ycle
Cos
ts
No Drive Train Rebuild
One Drive Train Rebuild Only
Multiple Drive Train Rebuilds
End of useful life
1 2 3 4 5 6 7 8 9 10 11 12 13 14 15 16 17 18 19 20
Vehicle Age (years)
Federal Transit Administration 169
Useful Life of Transit Buses and Vans Appendix E Final Report Heavy-Duty Vehicle Life-Cycle Cost Analysis
Table E-5 Life-Cycle Cost Minimums Continuous Rehabilitation ndash 45000 Annual Miles
Number of Overhauls Annualized Life-Cycle Cost Minimum ($2006)
Vehicle Age at Cost Minimum
No Drive Train Rebuild $114000 6 One Drive Train Rebuild $98000 12 Multiple Drive Train Rebuilds $113000 9
Low Annual Mileage (25000 per year) Figure E-13 considers the case of an agency performing continuous rehabilitation with fleet vehicles traveling an average of 25000 miles per year In this case the one-drive train rebuild option is marginally more cost effective as compared to the no-rebuild option Once again the multiple-rebuild option makes little sense with the cost minimum attained just prior to the second engine rebuild event
Table E-6 summarizes the life-cycle cost analysis and the results of the minimum-cost values for each of the high-mileage scenarios presented in Figure E-13 For this higher-mileage scenario the one-rebuild option is necessary to reach the 12-year life and also provides the lowest minimum life-cycle cost
Figure E-13 Total Life Cycle Cost Profiles
Continuous Rehabs 25000 miles per yr $200000
$180000
$160000
$140000
$120000
$100000
$80000
$60000
$40000
$20000
$0
Table E-6 Life-Cycle Cost Minimums Continuous Rehabilitation ndash 25000 Annual Miles
Tota
l Ann
ualiz
ed L
ife C
ycle
Cos
ts
No Drive Train Rebuild
One Drive Train Rebuild Only
Multiple Drive Train Rebuilds
End of useful life
1 2 3 4 5 6 7 8 9 10 11 12 13 14 15 16 17 18 19 20
Vehicle Age (years)
Number of Overhauls Annualized Life-Cycle Cost Minimum ($2006)
Vehicle Age at Cost Minimum
No Drive Train Rebuild $76000 9 One Drive Train Rebuild $72000 17 Multiple Drive Train Rebuilds $78000 17
Federal Transit Administration 170
Useful Life of Transit Buses and Vans Appendix E Final Report Heavy-Duty Vehicle Life-Cycle Cost Analysis
Summary Agencies Performing Continuous Vehicle Rehabilitation
In summary for those agencies that do perform vehicle rehabilitations on a continuous as-needed basis the one-overhaul option appears to be the most cost effective for operators high average and low annual mileages (with the advantage being only marginal for lower mileage operators) The multiple-overhaul option was not found to be cost effective within the scenarios considered here (in all cases this option experiences its cost minimum before a second rebuild is undertaken) Finally the one-drive-train rebuild option was found to have roughly a 15-percent cost advantage over the other options for operators with 35000 or more in annual mileage This advantage was only a little more than 5 percent for agencies with 25000 in annual mileage
Implications for Useful Life Agencies Performing Continuous Rehabilitation
When evaluated solely in terms of cost-effectiveness vehicles with average annual mileages of 25000 35000 and 45000 miles per year reach their minimum annualized life-cycle cost on or after FTArsquos current 12-year minimum retirement age (ie 17 years for vehicles with 25000 annual miles 14 years for vehicles with 35000 annual miles and 12 years for vehicles with 45000 annual miles)
Summary Minimum Life-Cycle Cost Values and Ages
Tables E-7 and E-8 respectively identify the minimum annualized life cycle cost values and the ages at which these cost minimums are attained (by annual vehicle mileage) Each table highlights the cost minimum values and ages for each annual mileage group
Table E-7 Minimum Life-Cycle Cost Values ($2006)
Annual Vehicle Mileage
Agency Performs Major Mid-Life Overhauls
Agency Performs Continuous Vehicle Rehabilitation
No Overhaul
One Overhaul
Multiple Overhauls
No Drive Train Replacement
One Drive Train
Replacement
Multiple DriveTrain
Replacements 25000 $74000 $78000 $79000 $76000 $72000 $78000 35000 $99000 $91000 $96000 $97000 $85000 $94000 45000 $115000 $108000 $114000 $114000 $98000 $113000
Note Differences in costs between agencies that do and do not perform major mid-life overhauls reflect both (1) differences in rehabilitation activities performed and (2) differences in the cost data provided by those agencies participating in this study
With one exception minimum life-cycle cost is attained at or after the current FTA 12-year minimum The exception is those agencies with 25000 average annual miles that ordinarily perform a major life-extending rehabilitation (As noted above it is unlikely that agencies would pursue this option as with only 25000 miles per year it is likely more cost-effective to perform a less extensive rehabilitation around year 10 and then operate the vehicle until age 14 or later)
Federal Transit Administration 171
Useful Life of Transit Buses and Vans Appendix E Final Report Heavy-Duty Vehicle Life-Cycle Cost Analysis
Table E-8 Minimum Life-Cycle Cost Ages
Annual Vehicle Mileage
Agency Performs Major Mid-Life Overhauls
Agency Performs Continuous Vehicle Rehabilitation
No Overhaul
One Overhaul
Multiple Overhauls
No Drive Train Replacement
One Drive Train
Replacement
Multiple DriveTrain
Replacements 25000 10 17 19 9 17 17 35000 9 14 13 7 14 11 45000 7 12 11 6 12 9
Higher-Mileage Vehicles
The vehicles with 45000 miles experience their cost minimum at 12 years When converted to miles this equates to 540000 miles (12 X 45000) by the age of retirement Here again the life-cycle cost analysis results are in line with the current FTA minimum life requirements of 12 years or 500000 miles Hence although the age at which the minimum life-cycle cost value is attained continues to decline as average annual mileage increases these operators can take advantage of FTArsquos current minimum 12-year or 500000-mile-of-service option to ensure retirement at the minimum life-cycle cost point Hence based on this cost-effectiveness assessment the current minimum-life mileage requirement of 500000 appears reasonable
Generalized Analysis
The analysis above considered the minimum life-cycle cost for three specific annual vehicle mileages 25000 35000 (the national average) and 45000 Figure E-14 provides the ages and LTD mileages at which life-cycle costs are minimized for vehicles traveling between 20000 miles and 70000 miles annually Here the solid bars and left-side axis present the ages at which life-cycle costs are minimized for this range of annual vehicle mileages The solid line and right-hand axis present the LTD mileages at which life-cycle costs are minimized
Review of E-14 suggests that from a cost-effective perspective FTArsquos current retirement minimums (for large buses) of 12 years or 500000 miles represent reasonable choices For all annual vehicle mileages the minimum cost point is attained at either an age or mileage that exceeds one or both of the FTA minimums for these measures In all cases the difference between one and both of the current FTA minimum requirements also provides some margin for the early retirement of vehicles with reliability problems For example vehicles traveling an average of 40000 miles per year could reach their cost minimums at age 13 and an LTD mileage of 520000 miles Hence this provides a ldquomarginrdquo of one year or 20000 miles of optimal service beyond the FTA minimum for an average vehicle or the option to reduce service life by these amounts for less reliable vehicles Moreover this difference between the 12-year and 500000shymile minimum is smallest (while still providing a meaningful early retirement margin) for vehicles that average between 30000 and 45000 miles of travel per year Together these vehicles account for more than 70 percent of the nationrsquos large buses
Federal Transit Administration 172
Useful Life of Transit Buses and Vans Appendix E Final Report Heavy-Duty Vehicle Life-Cycle Cost Analysis
Figure E-14 Age and Mileage at Which Life-Cycle Cost Is Minimized
(Single Mid-Life Rehabilitation or Single Drive Train Replacement)
0
2
4
6
8
10
12
14
16
18
20 Ve
hicl
e A
ge L
ife-C
ycle
Cos
t Is
Min
imiz
ed (Y
ears
)
0
100000
200000
300000
400000
500000
600000
700000 Vehicle LTD
Miles Life-C
ycle C
ost Is Minim
izedAge Minimum Life Cost is Attained Life to Date Miles Minimum Life Cost is Attained
FTA Mileage Minimum
FTA Age Minimum
Average Annual Mileage
20000 25000 30000 35000 40000 45000 50000 55000 60000 65000 70000
Average Annual Mileage
Federal Transit Administration 173
Useful Life of Transit Buses and Vans Appendix F Final Report Agency Supplied Life-Cycle Cost Data
APPENDIX F AGENCY SUPPLIED LIFE-CYCLE COST DATA
The following are the contents of the life-cycle cost database created for this study using data supplied by the local transit operators and vehicle manufacturers responding to the study interview guide This information includes the expected cost and timing (in years) for replacement of all major vehicle components The cost data have been ldquopooledrdquo and averaged here to provide a more complete and representative set of vehicle life-cycle costs Given this pooling the tables below present cost data for three different ldquooperatorrdquo types bull Large operators that perform a major mid-life rehabilitations bull Operators that do not perform mid-life overhauls bull Vehicle manufacturers supplying life-cycle cost data
In the end the life-cycle cost data supplied by the vehicle manufacturers was not used for this study as it was found to differ significantly from the actual cost experiences of the nationrsquos transit operators Also the cost data supplied by agencies (including those that do and do not perform major rehab activities) is representative of agencies with average annual mileages of roughly 37500 annual miles (for those do perform major mid-life rehabilitations) and roughly 36000 miles (those than do not major mid-life rehabilitations) These cost data were then adjusted accordingly for the analyses presented in Chapter 6
Table F-1 Large Operator With Major Rehab
CompID Group Component Replacement
Cost Expected Life
(years) 1 Body Structure 14 2 Body Exterior and Applied Panels 3 Body Paint $250000 7 4 Body Interior 5 Body Floor $220000 7 6 Body Steps and Stepwells $12000 7 7 Body Wheel Housings $172000 7 8 Body Exit Passenger Doors $300000 7 9 Body Service Compartment
10 Body Engine door Access Doors 11 Operating Components Doors $3800 7 12 Operating Components Windshield Wipers and Washers $19000 3 13 Operating Components Headlight Assy Lighting 14 Operating Components Dimmer switch Controls 15 Operating Components Speedometer Instruments 16 Interior Trim Panels 17 Interior Headlining
Federal Transit Administration 174
Useful Life of Transit Buses and Vans Appendix F Final Report Agency Supplied Life-Cycle Cost Data
CompID Group Component Replacement
Cost Expected Life
(years) 18 Interior Front End 19 Interior Rear End 20 Interior Passenger Info and Advertising 21 Interior One Seat Insert Passenger Seats $340000 7 22 Interior Driverrsquos Seat $135600 3 23 Interior Rubber Floor Covering 24 Windows Windshield $250000 14 25 Windows Driverrsquos Side Window $50000 14 26 Windows Side Windows $300000 14 27 Insulation Insulation 28 Ancillary Items Dash Panels 29 Ancillary Items Visors 30 Ancillary Items Chime Exit Signal 31 Ancillary Items Outside Mirrors $76000 3 32 Ancillary Items Inside Mirrors 33 Passenger Assists Front Doorway 34 Passenger Assists Vestibule 35 Passenger Assists Overhead 36 Passenger Assists One Set Insert Longitudinal Seats 37 Passenger Assists Rear Doorway 38 Bumpers Front Bumper $189300 7 39 Bumpers Rear Bumper $92300 7 40 Destination Signs Run Box Run Numbers $654500 7 41 Destination Signs Rear Route Route Numbers 42 Destination Signs Front Main Auxiliary Destination Sign 43 Destination Signs Fare Collection Device 44 Destination Signs Wheelchair Lift $1200000 7 45 Destination Signs Wheelchair Restraints 46 ITS Components AVL 47 ITS Components APC 48 ITS Components Others 49 Propulsion System Engine Mounts $50000 7 50 Propulsion System Accessories $200000 7 51 Propulsion System Pump Hydraulic Drive $120000 7 52 Propulsion System Engine $1294000 7 53 Propulsion System Radiator Cooling System $370000 3 54 Propulsion System Transmission $1164300 4 55 Propulsion System Muffler Cat Conv Exhaust System $430000 7 56 Propulsion System EGR Emissions Control Devices $190000 7 57 Propulsion System Reman Diff Axles and Differential $900000 7 58 Propulsion System Sway Bar Suspension 59 Propulsion System Air Springs 60 Propulsion System Shock Absorbers
Federal Transit Administration 175
Useful Life of Transit Buses and Vans Appendix F Final Report Agency Supplied Life-Cycle Cost Data
CompID Group Component Replacement
Cost Expected Life
(years) 61 Propulsion System Steering Gear 62 Propulsion System Steering 63 Brakes Brake Chamber Actuators 64 Brakes Rear Axel Set Friction Material 65 Brakes Hubs $280000 7 66 Brakes One Drums or Rotors 67 Brakes Compressor Air System $350000 3 68 Brakes Wheels 69 Brakes Tires $160000 3 70 Fuel System Fuel Tank 71 Fuel System Fuel Filler 72 Electrical Components Batteries 73 Electrical Components Master Battery Switch 74 Electrical Components Fire Detectors 75 Electrical Components Radio Noise Suppression 76 Interior Climate Control Master control ac heat Controls 77 Interior Climate Control Plenums and Vents 78 Interior Climate Control Filter Air Intakes 79 Interior Climate Control Radio amp Public Address System $800000 7 99 BodyStructure Other Overhaul Costs $700000 7 99 BodyBody Other Overhaul Costs $300000 7 99 Interior Other Overhaul Costs $824400 7 99 Fare Collection Other Overhaul Costs $500000 14 99 Suspension Other Overhaul Costs $460000 7 99 Brakes Other Overhaul Costs $500000 7 99 Fuel System Other Overhaul Costs $150000 7 99 Electrical Components Other Overhaul Costs $381000 3 99 Interior Climate Control Other Overhaul Costs $1000000 7
Table F-2 Mid to Large Operator No Major Rehab
CompID Group Component Replacement
Cost Expected
Life (years) 1 Body Structure 12 2 Body Exterior and Applied Panels $18026 12 3 Body Paint $300000 6 4 Body Interior 12 5 Body Floor 12 6 Body Steps and Stepwells 12 7 Body Wheel Housings 12 8 Body Exit Passenger Doors $174244 6 9 Body Service Compartment 12
10 Body Engine door Access Doors $235071 6
Federal Transit Administration 176
Useful Life of Transit Buses and Vans Appendix F Final Report Agency Supplied Life-Cycle Cost Data
CompID Group Component Replacement
Cost Expected
Life (years) 11 Operating Components Doors $33223 4 12 Operating Components Windshield Wipers and Washers $24706 1 13 Operating Components Headlight Assy Lighting $10828 1 14 Operating Components Dimmer switch Controls $8962 3 15 Operating Components Speedometer Instruments $10168 3 16 Interior Trim Panels 12 17 Interior Headlining 12 18 Interior Front End 12 19 Interior Rear End 12 20 Interior Passenger Info and Advertising 12 21 Interior One Seat Insert Passenger Seats $183680 6 22 Interior Driverrsquos Seat $223733 4 23 Interior Rubber Floor Covering 12 24 Windows Windshield $250000 12 25 Windows Driverrsquos Side Window $133421 12 26 Windows Side Windows $228184 12 27 Insulation Insulation 28 Ancillary Items Dash Panels $10288 12 29 Ancillary Items Visors $23234 6 30 Ancillary Items Chime Exit Signal $18756 6 31 Ancillary Items Outside Mirrors $40228 1 32 Ancillary Items Inside Mirrors $3655 6 33 Passenger Assists Front Doorway 12 34 Passenger Assists Vestibule 12 35 Passenger Assists Overhead 12 36 Passenger Assists One Set Insert Longitudinal Seats $4592 6 37 Passenger Assists Rear Doorway 12 38 Bumpers Front Bumper $109112 12 39 Bumpers Rear Bumper $139336 12 40 Destination Signs Run Box Run Numbers 1 41 Destination Signs Rear Route Route Numbers $422300 3 42 Destination Signs Front Main Auxiliary Destination Sign $607100 6 43 Destination Signs Fare Collection Device 44 Destination Signs Wheelchair Lift $2100000 12 45 Destination Signs Wheelchair Restraints $9544 6 46 ITS Components AVL 47 ITS Components APC 48 ITS Components Others 49 Propulsion System Engine Mounts $8896 3 50 Propulsion System Accessories 51 Propulsion System Pump Hydraulic Drive $105676 3 52 Propulsion System Engine $1932000 6 53 Propulsion System Radiator Cooling System $386500 6
Federal Transit Administration 177
Useful Life of Transit Buses and Vans Appendix F Final Report Agency Supplied Life-Cycle Cost Data
CompID Group Component Replacement
Cost Expected
Life (years) 54 Propulsion System Transmission $1823200 4 55 Propulsion System Muffler Cat Conv Exhaust System $274239 6 56 Propulsion System EGR Emissions Control Devices $39619 3 57 Propulsion System Reman Diff Axles and Differential $201475 6 58 Propulsion System Sway Bar Suspension $38222 4 59 Propulsion System Air Springs $11842 4 60 Propulsion System Shock Absorbers $11923 4 61 Propulsion System Steering Gear 62 Propulsion System Steering $99586 6 63 Brakes Brake Chamber Actuators $10972 3 64 Brakes Rear Axel Set Friction Material $14000 1 65 Brakes Hubs $89087 6 66 Brakes One Drums or Rotors $11000 1 67 Brakes Compressor Air System $100866 3 68 Brakes Wheels $16968 6 69 Brakes Tires $40000 05 70 Fuel System Fuel Tank $202708 6 71 Fuel System Fuel Filler $28828 12 72 Electrical Components Batteries $8935 2 73 Electrical Components Master Battery Switch $1624 6 74 Electrical Components Fire Detectors $45369 4 75 Electrical Components Radio Noise Suppression 76 Interior Climate Control Master control ac heat Controls $100000 6 77 Interior Climate Control Plenums and Vents 12 78 Interior Climate Control Filter Air Intakes $1066 1 79 Interior Climate Control Radio amp Public Address System $16423 4 99 BodyStructure Other Overhaul Costs 12 99 BodyBody Other Overhaul Costs $18026 12 99 Interior Other Overhaul Costs $300000 6 99 Fare Collection Other Overhaul Costs 12 99 Suspension Other Overhaul Costs 12 99 Brakes Other Overhaul Costs 12 99 Fuel System Other Overhaul Costs 12 99 Electrical Components Other Overhaul Costs $174244 6 99 Interior Climate Control Other Overhaul Costs 12
Table F-3 Vehicle Manufacturer Costs
Comp ID Group Component Replacement
Cost Expected
Life (years) 1 Body Structure 12 2 Body Exterior and Applied Panels $31000 12 3 Body Paint 12
Federal Transit Administration 178
5
10
15
20
25
30
35
40
45
Useful Life of Transit Buses and Vans Appendix F Final Report Agency Supplied Life-Cycle Cost Data
CompID Group Component Replacement
Cost Expected
Life (years) 4 Body Interior 12
Body Floor 12 6 Body Steps and Stepwells 12 7 Body Wheel Housings 12 8 Body Exit Passenger Doors 12 9 Body Service Compartment
Body Engine door Access Doors $240000 12 11 Operating Components Doors 12 12 Operating Components Windshield Wipers and Washers $55000 12 13 Operating Components Headlight Assy Lighting $15000 12 14 Operating Components Dimmer switch Controls
Operating Components Speedometer Instruments $27000 12 16 Interior Trim Panels 12 17 Interior Headlining 12 18 Interior Front End 12 19 Interior Rear End 12
Interior Passenger Info and Advertising $5000 12 21 Interior One Seat Insert Passenger Seats 12 22 Interior Driverrsquos Seat 12 23 Interior Rubber Floor Covering 12 24 Windows Windshield $72000 12
Windows Driverrsquos Side Window $51000 12 26 Windows Side Windows $63000 12 27 Insulation Insulation 28 Ancillary Items Dash Panels 12 29 Ancillary Items Visors $16000 6
Ancillary Items Chime Exit Signal 12 31 Ancillary Items Outside Mirrors $7000 12 32 Ancillary Items Inside Mirrors $3000 12 33 Passenger Assists Front Doorway 12 34 Passenger Assists Vestibule 12
Passenger Assists Overhead 12 36 Passenger Assists One Set Insert Longitudinal Seats 12 37 Passenger Assists Rear Doorway 12 38 Bumpers Front Bumper 12 39 Bumpers Rear Bumper 12
Destination Signs Run Box Run Numbers 12 41 Destination Signs Rear Route Route Numbers 12 42 Destination Signs Front Main Auxiliary Destination Sign 12 43 Destination Signs Fare Collection Device 12 44 Destination Signs Wheelchair Lift 12
Destination Signs Wheelchair Restraints 12 46 ITS Components AVL
Federal Transit Administration 179
Useful Life of Transit Buses and Vans Appendix F Final Report Agency Supplied Life-Cycle Cost Data
CompID Group Component Replacement
Cost Expected
Life (years) 47 ITS Components APC 48 ITS Components Others 49 Propulsion System Engine Mounts $6000 6 50 Propulsion System Accessories $280000 6 51 Propulsion System Pump Hydraulic Drive $67000 6 52 Propulsion System Engine $1700000 6 53 Propulsion System Radiator Cooling System 12 54 Propulsion System Transmission $1170000 6 55 Propulsion System Muffler Cat Conv Exhaust System $75000 12 56 Propulsion System EGR Emissions Control Devices $68500 12 57 Propulsion System Reman Diff Axles and Differential $300000 12 58 Propulsion System Sway Bar Suspension 12 59 Propulsion System Air Springs $27000 3 60 Propulsion System Shock Absorbers $26000 3 61 Propulsion System Steering Gear 62 Propulsion System Steering 12 63 Brakes Brake Chamber Actuators $14000 6 64 Brakes Rear Axel Set Friction Material $20000 3 65 Brakes Hubs $26000 12 66 Brakes One Drums or Rotors $25000 3 67 Brakes Compressor Air System 12 68 Brakes Wheels $23000 12 69 Brakes Tires $40000 05 70 Fuel System Fuel Tank 12 71 Fuel System Fuel Filler 12 72 Electrical Components Batteries $10000 3 73 Electrical Components Master Battery Switch $4000 12 74 Electrical Components Fire Detectors $21000 12 75 Electrical Components Radio Noise Suppression 12 76 Interior Climate Control Master control ac heat Controls $78000 12 77 Interior Climate Control Plenums and Vents 12 78 Interior Climate Control Filter Air Intakes $4000 05 79 Interior Climate Control Radio amp Public Address System 12 99 BodyStructure Other Overhaul Costs 12 99 BodyBody Other Overhaul Costs $31000 12 99 Interior Other Overhaul Costs 12 99 Fare Collection Other Overhaul Costs 12 99 Suspension Other Overhaul Costs 12 99 Brakes Other Overhaul Costs 12 99 Fuel System Other Overhaul Costs 12 99 Electrical Components Other Overhaul Costs 12 99 Interior Climate Control Other Overhaul Costs
Federal Transit Administration 180
Useful Life of Transit Buses and Vans Final Report Useful Life of Transit Buses and Vans Final Report
METRICENGLISH CONVERSION FACTORS
FedeFederal Tranral Transit Administrasit Administrationtion 181181
Useful Life of Transit Buses and Vans Final Report
NOTICE
This document is disseminated under the sponsorship of the United States Department of Transportation in the interest of information exchange The United States Government assumes no liability for its contents or use thereof
The United States Government does not endorse products or manufacturers Trade or manufacturersrsquo names appear herein solely because they are considered essential to the objective of this report
Federal Transit Administration
Useful Life of Transit Buses and Vans Final Report
FOREWORD
The Federal Transit Administration (FTA) sponsored this research to assess both the appropriateness of its existing minimum service-life policy for transit buses and vans and the need to change that policy The research evaluated the federal minimum service-life requirements based upon the actual experience of both transit operators and vehicle manufacturers The analyses in this research provide the transit industry and the FTA with a better understanding of (1) the current useful life of transit buses and vans (2) the appropriateness of FTArsquos minimum service-life policy and (3) the policyrsquos impact on transit vehicle life expectancies and vehicle retirement decisions at the agency level Actual ages of buses retired from service generally exceed FTA minimums Transit agencies interviewed cited availability of capital funds for bus replacement as the primary determinant of retirement age
Author Acknowledgements
This report was authored by Richard Laver Donald Schneck Douglas Skorupski Stephen Brady Laura Cham and Jeff Rankin of Booz Allen Hamilton Valuable insight and direction was provided by Henry Nejako John Bell and Nancy Ody of the FTA In addition the authors would like to thank the staff of those transit operators and vehicle manufacturers who graciously provided their time and input to this study and without whom the study would not have been possible
Federal Transit Administration
Useful Life of Transit Buses and Vans Final Report Table of Contents
Table of Contents
EXECUTIVE SUMMARY IV
Study Goals and Objectives iv Approach v Key Findings vi Recommendations xiii
CHAPTER 1 INTRODUCTION 1
Background 1 Study Objectives 2 Reasons for Reviewing the Service-Life Policy 3 What is Useful Life 4 Project Approach 8
CHAPTER 2 FTA SERVICE-LIFE CATEGORIES 10
Service-Life Category Descriptions 10 Implications for the Current Service-Life Categories 19
CHAPTER 3 LEGISLATION AND PROCUREMENT 23
FTA Service-Life Circulars and Regulations 23 Procurement Methods and Guidelines 25 Conclusions Impact of Regulations and Procurement Practices 26
CHAPTER 4 AVERAGE RETIREMENT AGES 27
Analysis of Actual Fleet Retirement Ages Using NTD Vehicle Data 27 Assessment of Existing Bus Type Categories Based on NTD Analysis 35
CHAPTER 5 INDUSTRY OUTREACH 37
Transit Agency Participants 37 Agency Interview Guide Responses 38 Vehicle Manufacturer Response 51 Private Operators Response 56
CHAPTER 6 ENGINEERING ANALYSIS 60
Transit Agency Participants ndash Follow-Up Interviews 60 Useful Life of Transit Vehicle Chassis and Components 61 Vehicle Structure ndash A Second Look 70
Federal Transit Administration i
Useful Life of Transit Buses and Vans Final Report Table of Contents
Bus Durability and New Technologies 74 Life-Extending Practices 76 Vehicle Emissions 76 Vehicle Reliability 77 National Bus Condition Assessment 78
CHAPTER 7 LIFE-CYCLE COST ANALYSIS 86
Data Sources and Caveats 86 Key Determinants of Life-Cycle Costs 86 Life-Cycle Cost Analysis 89 Other Bus and Van Types 94 Life-Cycle Cost Analyses of Changes to FTArsquos Service-life Policy 100 Vehicle Physical Condition versus Minimum Cost Retirement Age 104 Vehicle Age Service Reliability and Ridership 106
CHAPTER 8 PRIOR BUS USEFUL-LIFE REVIEWS 110
Initial Policy Statement ndash FTA Circular 90301 110 1985 Inspector General Statement 110 1988 Useful Life of Transit Vehicles Study 110 1988 Transit Capital Investment to Reduce Operating Deficits ndash Alternative Bus Replacement Strategies Study 111 1995 Bus Industry Summit 111 1997 Useful Life of Heavy-Duty Transit Buses Study 112 Other Studies 113 Comparisons of Past Studies with This Report 114 Other Considerations 115
CHAPTER 9 KEY FINDINGS AND RECOMMENDATIONS 118
Key Findings 118 Recommendations 121
BIBLIOGRAPHY 124
APPENDIX A SUMMARY OF TRANSIT AGENCY SURVEY 128
APPENDIX B SUMMARY OF VEHICLE MANUFACTURER SURVEY 143
APPENDIX C ENGINEERING INTERVIEWS 147
APPENDIX D MINIMUM LIFE-CYCLE COST METHODOLOGY 153
Conversion of Participant Life-Cycle Costs to Reflect Differences in Annual Mileage 153 Calculation of Annualized Cost Factors 154
Federal Transit Administration ii
Useful Life of Transit Buses and Vans Final Report Table of Contents
Calculation of Annualized Vehicle Acquisition Major Component Replacement and Rehabilitation Costs 154 Regression Analysis and Annualization of OampM Costs 155 Calculation of Total Annualized Costs 156
APPENDIX E HEAVY-DUTY VEHICLE LIFE-CYCLE COST ANALYSIS 157
Heavy Duty Vehicle Life-Cycle Cost Analysis 157 Summary Minimum Life-Cycle Cost Values and Ages 171
APPENDIX F AGENCY SUPPLIED LIFE-CYCLE COST DATA 174
METRICENGLISH CONVERSION FACTORS 181
Federal Transit Administration iii
Useful Life of Transit Buses and Vans Final Report Executive Summary
EXECUTIVE SUMMARY
The Federal Transit Administrationrsquos (FTArsquos) service-life policy for transit buses and vans establishes the minimum number of years (or miles) that transit vehicles purchased with federal funds must be in service before they can be retired without financial penalty The clear goal of this policy is to ensure that vehicles procured using federal funds remain in service for a substantial portion of their service life thus ensuring that federal taxpayers obtain an adequate return on their investment
Over time perception of these requirements has become less as a minimum service-life requirement (to ensure a reasonable return on federal dollars invested) and more as the actual useful life (a point at which the asset should be retired) Given this change in interpretation most industry experts commonly refer to a standard 40-foot bus as a ldquo12-yearrdquo bus and many transit authorities have adopted 12 years as their retirement policy for this vehicle type There is also a common perception within the industry that transit vehicle manufacturers especially those working under low-bid procurements now design their vehicles to meet but not exceed the 12shyyear minimum-life requirement Hence rather than defining a minimum life expectancy to ensure an adequate return on federal funds the FTArsquos service-life policy has become viewed as the FTArsquos and the industryrsquos expectation for the full service life of the vehiclemdasha view that may have impacted the actual life expectancy of the nationrsquos transit fleets
Table ES-1 Minimum Service-life categories for Buses and Vans
Category Typical Characteristics Minimum Life
Length ApproxGVW Seats Average Cost
(Whichever comes first)
Years Miles
Heavy-Duty Large Bus 35 to 48 ft and 60 ft artic
33000 to 40000 27 to 40 $325000 to
over $600000 12 500000
Heavy-Duty Small Bus 30 ft 26000 to 33000 26 to 35 $200000 to
$325000 10 350000
Medium-Duty and Purpose-Built Bus 30 ft 16000 to
26000 22 to 30 $75000 to $175000 7 200000
Light-Duty Mid-Sized Bus 25 to 35 ft 10000 to 16000 16 to 25 $50000 to
$65000 5 150000
Light-Duty Small Bus Cutaways and Modified Van 16 to 28 ft 6000 to
14000 10 to 22 $30000 to $40000 4 100000
Study Goals and Objectives
FTA established its minimum life requirements for transit buses and vans in 1985 At that time the requirements represented the consensus opinion of a broad range of industry representatives Since then the requirements have undergone only minimal changes and remain essentially unaltered The objective of this study is to reassess FTArsquos existing minimum-life policy given
Federal Transit Administration iv
Useful Life of Transit Buses and Vans Final Report Executive Summary
the actual experiences of both transit operators and vehicle manufacturers Key questions to be addressed by this review include
bull What are the actual ages (and mileages) at which operators are retiring their transit buses and vans and how do those ages compare to the FTA minimums
bull Do the current minimum age and mileage requirements meet the needs of all agency types
bull How do FTArsquos current retirement minimums affect the purchase and retirement decisions of the nationrsquos operators
bull How have changes in vehicle designs (eg low floor) and technologies (eg alternative fuels) affected the expected vehicle life
bull Should FTA consider changing the current minimums given the experience of the nationrsquos transit operators and manufacturers
This study seeks to provide answers to each of these questions with the ultimate objective of assessing both the appropriateness of FTArsquos existing minimum service life policy for transit buses and vans and any potential need to change that policy
Approach
To meet the needs of the study the study team completed the following eight independent analyses Each of these analyses aimed to provide a different perspective on (1) the current useful life of transit buses and vans (2) the appropriateness of FTArsquos minimum life policy and (3) the policyrsquos impact on transit vehicle life expectancies and vehicle retirement decisions at the agency level
bull Review of FTArsquos Current Service-life Categories The study reviewed the definitions and the characteristics of the vehicles found in each of the five existing service-life categories The objectives were to determine the appropriateness of the categories based on the similarities and dissimilarities of the vehicle types found in each category and to conduct a market analysis for each category (ie annual vehicle sales and transitrsquos share of those sales)
bull Review of Procurement Regulations with Potential Service-life Implications The study reviewed federal legislation and circulars to identify federal requirements potentially affecting either the useful life or vehicle retirement decisions of the nationrsquos operators of transit buses and vans This review included FTArsquos bus testing regulations the Americans with Disabilities Act (ADA) Buy America requirements the Standard Bus Procurement Guidelines and the Clean Air Act and its Amendments
bull Analysis of Actual Retirement Ages The study used National Transit Database (NTD) data to determine the actual ages at which US agencies are currently retiring each of the transit bus and van types This analysis was then used to compare the average retirement ages with the minimum FTA age requirements for each vehicle category to determine how these minimums may be impacting local operatorrsquos vehicle retirement decisions
bull Industry Outreach The study team conducted two sets of interviews with bus fleet managers vehicle engineers and procurement personnel from a sample of the nationrsquos large medium and small-sized bus and van operators The first set of interviews documented
Federal Transit Administration v
Useful Life of Transit Buses and Vans Final Report Executive Summary
industry concerns with the existing service-life policy and elicited suggestions on how or if that policy should be changed A second set of follow-up interviews focused on engineering specific issues such as the impact of new vehicle designs on expected vehicle life
bull Market Analysis Most transit bus and van components and many of the vehicles themselves are derived from the general truck and automotive market Market analysis provides a perspective on transitrsquos role and position within the broader truck and automotive market with emphasis on where transit has the ability to influence component and overall vehicle life expectancy
bull Engineering Analysis The engineering analysis examines the life expectancy of individual vehicle components and of the vehicle as a whole (ie the factors that determine overall vehicle useful life) This analysis then considers the appropriateness of the minimum life requirements for each vehicle category given the useful-life characteristics of each vehiclersquos component parts
bull Economic Analysis This analysis identifies that point in the life cycle of each bus and van type at which total life-cycle costs are minimized This point provides a financially logical age (mileage) at which to retire that vehicle The identified minimum cost replacement ages are then placed in context with the results of the engineering analysis The combination of these two perspectives helps illustrate factors that drive granteesrsquo vehicle retirement decisions
bull Review of Prior Useful-Life Studies The study reviewed prior useful-life studies completed by FTA and the American Public Transportation Association (APTA) with the objective of working to obtain more current answers to the same questions and to compare and contrast the findings of this study with those of prior efforts
Key Findings
Each of the eight independent analyses yielded insights into the useful life of transit buses and vans and FTArsquos minimum service-life policy Key findings from each of the various analyses performed for this study are outlined below
Review of FTArsquos Current Service-Life Categories
The review of FTArsquos minimum service-life requirements yielded the following key findings
bull Transit bus and van fleets are dominated by 12-year and 4-year vehicles Of the roughly 91000 transit buses and vans currently in service at US transit operators more than 70000 (about 78 percent) are 12-year vehicles about 16500 (18 percent) are 4-year vehicles and the remaining 5 percent are divided between the 10-year 7-year and 5-year vehicle categories
bull The current service-life category groupings are appropriate A key study objective was to assess the appropriateness of the existing service-life categories (ie whether these categories ldquomake senserdquo) The study found that the categories represent logical groupings of vehicles having broadly similar characteristics in terms of construction methods size weight passenger capacities cost manufacturers and customer bases (see Table ES-1 above) A possible exception here is with 4-year and 5-year vehicles built using cutaway chassis where
Federal Transit Administration vi
Useful Life of Transit Buses and Vans Final Report Executive Summary
there is a significant degree of overlap between the two age categories in terms of construction type sizes and manufacturers However the similarities are not adequate grounds for combining the two into a single ldquo4-to-5-yearrdquo vehicle category
bull The transit industry has little ability to alter bus and van useful-life characteristics cost-effectively Nearly half of the vehicle components for 12-year buses and most components for all other vehicle categories (including the vehicles themselves) are obtained from either the heavy-truck or automotive markets Given its small share of these markets (typically less than one percent) the transit industry has little ability to influence component useful-life characteristics in a cost-effective manner A key exception here is the structure of 12-year buses To the extent that 12-year bus structures are designed specifically for transit use the transit industry has some leverage to influence this componentrsquos design and durability characteristics (However given the manufacturersrsquo small annual order sizes and tight local agency capital budgets funding such innovation is challenging in practice) For most other components and vehicle types (eg minivans and cutaway chassis) the transit industry cannot significantly alter the useful-life characteristics without incurring the cost of customizing mass-produced items to meet transit-specific needs
Review of Procurement Regulations with Potential Useful-Life Implications
While many federal regulations (eg Buy America Bus Testing ADA Environmental Protection Agency) and industry procurement practices (third-party contracting) are believed to have potential useful-life implications these implications are generally considered to be minor relative to the issues of annual mileage new vehicle designs changing life-cycle economics and other drivers of useful life A key exception here is the low-bid procurement process which can yield vehicles with lower quality structures leading to reduced longevity To protect against this outcome agencies need to establish firm structural component requirements during the pre-bid stage to ensure the minimum-life requirements are attained
Analysis of Actual Retirement Ages
The study used NTD data to determine how recent actual retirement ages for transit buses and vans compare with the FTArsquos current minimum service requirements for transit buses and vans and whether these requirements affect the vehicle retirement decisions of the nationrsquos transit operators Table ES-2 summarizes this analysis
Table ES-2 Minimum versus Average Retirement Age by Vehicle Category
Vehicle Category Minimum Retirement
Age Average Retirement
Age (Years) Share of Active Vehicles That Are
One or more years past the retirement minimum
Three or more years past the retirement minimum
12-Year Bus 151 19 9 10-Year Bus 7 4 7-Year Bus 82 12 3
5-Year BusVan 59 23 5 4-Year Van 56 29 10
Average retirement age estimates for this vehicle category suffers from small sample issues
Federal Transit Administration vii
Useful Life of Transit Buses and Vans Final Report Executive Summary
The analysis yielded the following key findings
bull Most buses and vans are retired well after minimum service-age requirement is satisfied With one exception Table ES-2 shows that on average transit buses and vans are retired between one to three years after their minimum service-life requirement has been satisfied The exception is the 10-year bus category where small sample issues prevented determination of a reliable average retirement age value (hence it remains unclear how far past the minimum service-life requirement this vehicle type is typically retired) In addition Table ES-2 demonstrates that a significant proportion of buses and vans remain in service at least one year past the retirement minimum (eg 20 percent of heavy-duty 12-year buses) with many still in service three or more years past the minimum requirement (eg one in 10 ldquo12-yearrdquo buses in active service are age 15 or older)
bull Minimum service age does not constrain agenciesrsquo vehicle retirement decisions Based on this and other analyses conducted using NTD data it is clear that relatively few transit buses and vans are retired right at the minimum service age requirement Thus the current retirement minimums are not constraining the vehicle retirement decisions of the vast majority of the nationrsquos bus and van operators (a finding confirmed in the agency interviews described below) Given this observation it is also clear that any reduction to the current minimum-age requirements (eg from 12 to 10 years for a ldquo12-year busrdquo) would not result in any significant increase in the rates of retirement for the five service-life categories
Industry Outreach
The included interviews of representatives of local transit operators vehicle manufacturers and private bus fleet operators to assess their current experiences with bus and van useful life as well as FTArsquos minimum service-life requirements Questions covered areas such as vehicle replacement decisions alternatives to the current FTA policies maintenance practices and the impacts on service quality The following are key findings from this industry outreach process
bull Most agencies have vehicle service-life policies All nine of the agencies completing the detailed interviews reported having either a service-life policy or a planned retirement age for heavy-duty 12-year buses For four of the agencies the planned retirement age exceeds the FTA minimum of 12 years (with the Los Angeles County Metropolitan Transportation Authority at 13 years the Washington Metropolitan Area Transit Authority and Jefferson Transit at 15 years and the Toronto Transit Commission at 18 years)
bull Actual retirement ages generally exceed both FTA minimums and agency service-life policies The actual timing of vehicle retirement for all nine agencies typically occurs between one to four years after the FTA minimum has been reached (but can occur as late as vehicle age 20) Moreover for most agencies the recent actual retirement ages also exceed the planned or policy retirement ages Given these observations it is clear that FTArsquos current minimum service-life requirement for heavy-duty buses does not actively constrain the agenciesrsquo retirement decisions (as retirements occur after the minimum retirement age has been reached) None of the agencies reported having to take advantage of FTArsquos ldquolike-kind exchangerdquo provision permitting early retirement of specific vehicles
bull Capital funding availability is the primary determinant of retirement age Limited capital funding was cited as the primary reason that the timing of actual vehicle retirements
Federal Transit Administration viii
Useful Life of Transit Buses and Vans Final Report Executive Summary
has exceeded the plannedpolicy retirement age (and FTA service minimums) by all but one of the responding agencies Because of this the average fleet age is more likely to be impacted by the increased availability of federal funding than by any relaxation in the minimum service-life requirements Other decision factors included service reliability vehicle condition vehicle maintenance physical and local environmental conditions (salt intrusion) procurement process (low bid or negotiated) and duty cycle (mainly operating speed)
bull Only large agencies operating in ldquosevererdquo urban environments perform scheduled mid-life overhauls Only the larger urbanized agencies interviewed (Massachusetts Bay Transportation Authority New York City Transit Toronto Transit Commission and Washington Metropolitan Area Transit Authority) perform comprehensive ldquomid-liferdquo overhauls of their heavy-duty cycle vehicles stating that these overhauls are required to obtain service lives of 12 years or more given the tough service environments in which they operate In contrast none of the other agencies interviewed (including Los Angeles County Metropolitan Transportation Authority and Houston Metro) regularly complete a mid-life overhaul with most suggesting it is not cost effective for them
bull Most agencies have needed to retire vehicles early Most of the agencies have had to retire vehicles prior to their scheduled or desired retirement age The causes of these early retirements range from unexpected declines in vehicle condition high maintenance costs equipment upgrades or damage beyond repair Most agencies would support the introduction of a policy variance for particularly troublesome procurements but were equally concerned about how FTA could control the review and approval process
bull Most agencies have not been impacted by FTArsquos service-life requirements Most interviewed agencies stated that their vehicle retirement decisions are not significantly impacted by FTArsquos service-life minimums (the decisions are constrained more by capital funding availability) The agencies did suggest that more category options may be advantageous in the future to reflect differences in expected vehicle life as new vehicle designs and technologies are introduced (eg for bus rapid transit)
bull Extending the service-life requirements would hurt many agencies Conversely most (if not all) of the agencies reported that they would be negatively impacted if current FTA service-life minimums were extended These negative impacts include a decrease in service quality (eg higher failures rate vehicle aesthetic and reliability) an increase in maintenance costs (between 10 to 50 percent higher) and less leeway to retire ldquoproblemrdquo vehicles
bull Agencies support development of a ldquolemon lawrdquo and a technology demonstration option Interview respondents supported development of a ldquolemon lawrdquo and a technology demonstration option The lemon law concept would permit early retirement of problem vehicles without penalty to the agency All respondents agreed that this provision would need to clearly specify the conditions under which vehicles could be retired early andor define a clear FTA process for evaluating whether a vehicle is in fact a ldquolemonrdquo Under the technology demonstration concept a grantee could request a similar release from the service-life policy for FTA-approved tests of new vehicle technologies that would allow the agency to discontinue operation of the vehicle if the technology proved too problematic FTA could
Federal Transit Administration ix
Useful Life of Transit Buses and Vans Final Report Executive Summary
approve this on a selective basis through documentation of the demonstration results and industry dissemination
bull Most agencies are not interested in more or less durable heavy-duty vehicles Interview respondents were asked to consider their agencyrsquos interest in heavy-duty vehicles with longer shorter or other service-life characteristics They responded as follows
ndash More Durable (Longer Life) Heavy-Duty Vehicles Most agencies indicated that they were not interested in a more durable vehicle (ie with a more expensive heavier weight longer life expectancy structure) This is due to concerns over the cost effectiveness weight and rider comfort for this option Some agencies stated a more durable vehicle type might be considered if its components were equally durable
ndash Less Durable (Shorter Life) Heavy-Duty Vehicles All nine agencies expressed significant concerns with a less durable vehicle (ie with a cheaper lighter weight lower life expectancy structure) Concerns involved the vehiclersquos anticipated inability to survive the required duty cycles relationship with the expected life of components and decreased quality and the increase in procurement efforts
ndash Agency-Determined Retirement Age None of the agencies objected to the alternative option of allowing agencies to use their own judgment in determining vehicle retirement ages (ie drop all minimum life requirements and rely on funding constraints to ensure vehicles are retained for reasonable service lives) Based on the current actual retirement ages of the nine agencies few agency vehicles would be retired before the current FTArsquos current minimums (due to funding constraints)
Engineering Analysis
The engineering analysis provides further evaluation of bus useful life from a vehicle engineering perspective The following are key findings
bull Useful life is ultimately determined by the life of the vehicle structure Relatively few vehicle components typically last the full ldquoservice liferdquo of the vehicle For 12-year vehicles this includes the structure exterior and electrical system (see Figure ES-1) Vehicle structure as a whole defines the useful life of the vehicle more than any other single vehicle component The reason being that the structure is the backbone to which all other vehicle components are ultimately attached If the structure wears out or fails due to corrosion or a collision then the life of the vehicle is essentially at an end
bull Service environment is a key determinant of structure useful life In addition to vehicle age and service miles many interview participants clearly indicated that service environment is a key determinate of structure (and hence vehicle) useful life Vehicle structures that endure high passenger loads or operate in more severe service environments (eg rough urban roads) wear out faster Because of this several agencies expressed a desire for FTA to revise the service-life requirements definition to include service environment severity along with service years and miles (eg 12 years or 500000 miles) This desire was also identified in prior reviews of bus service life including the 1995 Bus Industry Summit
Federal Transit Administration x
Useful Life of Transit Buses and Vans Final Report Executive Summary
Figure ES-1 Component Expected Life 12-Year Bus
Structure
Electrical System
Suspension
Fuel System
Engine
Axles and Differential
Wheels and Tires
Transmission
Brakes
Wheelchair Lift
Radio and Public Address System
Hubs
Fare Collection Device
Air System
Body
Windows
Interior Climate Control
Interior
Destination Signs
Operability
Safety
Esthetics
0 2 4 6 8 10 12 14 16 Expected Component Life (Years)
bull ldquoStick busrdquo and low-floor vehicles may have a shorter useful life Interview participants suggested that stick bus (structures constructed using hundreds of welded tubes) and low-floor designs (which use stick construction) may have a shorter useful life as compared to traditional designs With the stick bus the thousands of welds that hold the structure together are more subject to corrosion and fatiguemdashan issue that manufacturers have largely addressed using corrosion-resistant coatings stainless steel and design strengthening Interview participants stated that it is too early to determine whether the low-floor design will impact vehicle longevity but noted that this design is more susceptible to road-side damage and salt spray (as the floor structure is closer to the ground)
bull New propulsion systems and electronics technologies may also impact useful life While engines for compressed natural gas and hybrid electric buses are expected to have similar useful lives compared to diesel these two engine types weigh more than diesel engines which may have an impact on structural wear (this has yet to be determined in practice) Similarly the rapid proliferation of new electronics technologies on buses (such as automatic vehicle location automatic passenger counters (APCs) on-board cameras and voice annunciation) may have implications for useful life as the presence of so many systems increases the likelihood of reliability issues Again the actual impact on useful life has yet to be determined in practice
Economic Analysis
For all vehicle categories the economic analysis identified the age at which total life-cycle costs including all capital operating and maintenance costs are minimized (reflecting the impact of differences in mileage) This analysis identifies a financially optimal retirement point for the vehicle Table ES-3 summarizes the results of this analysis
Federal Transit Administration xi
Useful Life of Transit Buses and Vans Final Report Executive Summary
Table ES-3 Minimum Life-Cycle Cost Replacement Ages and Mileages by Service-Life Category
Vehicle Type Category Annual Vehicle Mileage
Minimum Cost Age
Minimum Cost Mileage
Heavy-Duty Large Bus 12-Years 500000 Miles
25000 35000
17 14
425000 490000
45000 12 540000 Heavy-Duty Small Bus 10-Years 350000 Miles
25000 35000
12 11
300000 385000
45000 11 495000 Medium-Duty Small Bus 7-Years 200000 Miles
25000 35000 45000
9 8 7
225000 280000 315000
Light-Duty Midsize BusVan 5-Years 150000 Miles
20000 30000
7 6
140000 180000
40000 5 200000 Light-Duty Small BusVan 20000 6 120000 4-Years 100000 Miles 30000 5 150000
40000 4 160000 Note Shaded cells indicate where minimum cost point exceeds FTA age or mileage minimums
The following are key findings
bull The minimum cost retirement points all occur at or after the FTA minimum service life Table ES-3 suggests that from a cost-effective perspective FTArsquos current service-life minimums including both the minimum years and miles requirements represent reasonable choices For each service-life category the minimum cost point is attained at either an age or mileage that exceeds one or both of the FTA minimums for these measures In all cases the difference between one or both of the current FTA minimum requirements and the minimum cost age or mileage also provide some margin for the earlier retirement of vehicles with reliability problems This suggests that current age and mileage service-life minimums represent financially sound minimum-life choices
bull Reducing heavy-duty vehicles service life from 12 to 10 years would only have a minimal impact on vehicle sales At most 10 percent of all retirements for heavy-duty buses occur right at vehicle age 12 translating to an average of roughly 200 to 300 annual retirements potentially constrained by FTArsquos minimum-life requirements Assuming vehicles retiring at the current 12-year minimum shifted to a new 10-year minimum the long-term average annual replacement rates for these operators would increase from 200 to 300 vehicles to 240 to 360 vehicles annually or 40 to 60 additional vehicles per year Given that deliveries of new buses average roughly 3000 per year and the industryrsquos estimated total vehicle production capacity of 7500 to 10000 vehicles the addition of 40 to 60 new vehicles is far from significant Hence reducing useful life for heavy-duty vehicles by two years is unlikely to yield a significant boost to the small domestic bus market
bull Reducing heavy-duty service life from 12 to 10 years would have a minimal impact on ridership and service reliability Given that so few vehicle retirements are currently
Federal Transit Administration xii
Useful Life of Transit Buses and Vans Final Report Executive Summary
constrained by FTArsquos current service-life policy any reduction is unlikely to drive significant improvements in ridership levels or service reliability Note however that the relationship between vehicle condition and ridership is not well understood and FTA may wish to sponsor studies to better evaluate this issue
Recommendations
Based on the findings above it is recommended that FTA consider the following
bull Maintain the current service-life minimums Few buses and vans are currently retired right at FTArsquos current service-life minimums Rather the vast majority of these vehicles are retained in service for at least one year (4- and 5- years vehicles) and as many as three or more years (eg for 12-year vehicles) after the minimum service requirements have been met indicating that these vehicles have some service life remaining beyond the minimums Moreover the current service-life age andor mileage minimums for all vehicle types occur before the minimum life-cycle cost points for these vehicles are reached Hence the current service-life minimums clearly meet the joint objectives of (1) ensuring that buses and vans purchased using federal dollars remain in service for most of their useful life (2) of providing agencies some flexibility in determining when their vehicles will be retired and (3) of helping to minimize life-cycle costs In this sense the current service-life minimums really are just that the minimum ages at which vehicles can be retiredmdashnot a recommended retirement age or a measure of actual expected useful life The current minimum service-life requirements should be maintained
bull Maintain the current service-life categories Similarly the segmentation of transit bus and van types into the current five service-life categories reflects actual similarities in vehicle structures designs components costs origin markets manufacturers and end users These current categories should be maintained
bull Review the service-life minimums and service-life categories regularly The analysis of recent changes in vehicle designs the adoption of new technologies and the introduction of new vehicle types (eg stainless-steel bus rapid transit vehicles) highlight the fact that the service-life characteristics of transit buses and vans are subject to change For this reason FTA should review the minimum life requirements and service-life categories on a regular basis (eg every 5 to at most every 10 years)
bull Adoption of a ldquolemon lawrdquo This law would define circumstances under which ldquoproblemrdquo vehicles could be retired early without financial penalty
bull Adoption of a technology demonstration option Similar to the ldquolemon lawrdquo this option would define circumstances under which agencies could retire vehicles purchased to test new technologies (with FTArsquos prior agreement) earlymdashwithout financial penalty The intention would be to encourage test and adoption of new but potentially unreliable technologies expected to benefit the entire transit industry
bull Restrict the service-life categories in which vehicles are tested In recent years some manufacturers have successfully lobbied to have their vehicles tested in a more durable category than would appear warranted by their vehiclersquos general characteristics (eg testing a bus with 10-year characteristics as a ldquo12-yearrdquo bus) This has resulted in service reliability
Federal Transit Administration xiii
Useful Life of Transit Buses and Vans Final Report Executive Summary
issues and in some instances early retirement for the purchasing agencies when the tested vehicles were not found to have the expected durability Thus FTA may wish to more tightly control the categories in which vehicles are eligible to test based on some combination of characteristics (eg gross vehicle weight and seating capacity) but with the potential for special waivers to test in a different category so as not to stifle innovation (Manufacturers should be required to provide reasonable justification as to why their vehicles should be tested in the higher durability category)
bull Modify the NTD reporting requirements to better document actual vehicle retirement age and each vehiclersquos assigned service-life category The analysis used in this study to determine actual vehicle retirement ages relied on cross comparisons of NTD data from multiple reporting years FTA should modify NTD to track the actual age of vehicle retirements thus significantly improving FTArsquos ability to track and monitor any trends in vehicle retirement ages Similarly NTDrsquos vehicle documentation should also include the service-life category to which each vehicle has been assigned (again to facilitate monitoring of the retirement ages for each service-life category)
bull Conduct a study to evaluate the sensitivity of bus ridership to changes in vehicle age and condition A key objective of this study was to consider how bus ridership might change (increase) in response to a reduction in the average age of the nationrsquos bus fleets (eg with the introduction of a new shorter-lived heavy-duty transit vehicle) However while review of the existing literature provides numerous references to the sensitivity of ridership to changes in fares and service frequency no literature references were identified that provide a quantitative link between ridership and fleet age or condition In the absence of solid empirical data linking ridership and fleet age any analysis of this relationship can only be based on conjecture and limited anecdotal evidence For this reason the study team recommends that FTA conduct a study to evaluate the sensitivity of bus ridership to changes in vehicle age and condition Given the availability of good-quality route-level ridership data (from electronic fare boxes and APCs) this study could easily be conducted using a sample of US transit operators using before and after comparisons of which older sub-fleets have been replaced by new (or newer) vehicles
Federal Transit Administration xiv
Useful Life of Transit Buses and Vans Chapter 1 Final Report Introduction
CHAPTER 1 INTRODUCTION
Background
Transit agencies purchasing transit buses and vans using federal capital funds are required to keep these vehicles in service for a minimum period of time (years) andor number of miles prior to that vehiclersquos retirement to ensure effective use of federally funded assets This minimum service-life requirement differs based on bus and van size and other characteristics and is specified in FTA Circular 90301B The requirements currently recognize five different service-life categories (see Table 1-1)
Table 1-1 Minimum Service-Life Categories for Buses and Vans
Category Minimum Life
(Whichever comes first)
Years Miles Heavy-Duty Large Bus 12 500000
Heavy-Duty Small Bus 10 350000 Medium-Duty and Purpose-Built Bus 7 200000
Light-Duty Mid-Sized Bus 5 150000 Light-Duty Small Bus Cutaways and Modified Van 4 100000
The relative abundance of vehicles within these different categories varies significantly (see Figure 1-1) As might be expected 12-year buses account for more than three-quarters of all US transit buses and vans while 4-year vehicles account for nearly one-fifth of vehicles The remaining vehicle types including 10- 7- and 5-year vehicles collectively account for less than 5 percent (one in 20 vehicles) of the nationrsquos transit bus and van fleet The limited number of vehicles and relatively shallow depth of the market for 10- 7- and 5-year vehicles (roughly 4000 vehicles out of a total of more than 90000 transit buses and vans nationwide) make it difficult to effectively assess the actual useful-life characteristics of these less popular vehicle types In contrast agency and industry data sources have relatively good quality data on the useful-life experiences of the 12- and 4-year vehicle types
Since its inception several issues have been raised regarding FTArsquos minimum service-life policy These include the vehicle category definitions the use of vehicle age or miles (or hours) as the basis for defining service life and the potential for extended life cycles through life-extending overhauls More generally the question arises as to whether the current minimum life ages and mileages are appropriate given the experiences of the nationrsquos operators of transit buses and vans
Federal Transit Administration 1
Useful Life of Transit Buses and Vans Chapter 1 Final Report Introduction
Figure 1-1
Minimum Life Categories Shares of Nations Total Bus and Van Fleet
12 Year Buses
10 Year Buses and Vans
5 Year Buses and Vans 7 Year Buses
4 Year Van 18
and Vans 78
and Vans 11 2
Study Objectives
The aim of this study is to reassess FTArsquos existing minimum service-life policy (including both the actual minimum age and mileage requirements and the service-life categories into which bus and van vehicles are placed) based on the experiences vehicle retirement practices and life-cycle cost characteristics of the nationrsquos transit operators and vehicle manufacturers Key questions to be addressed by this review include the following
bull What are the actual ages (mileages or service hours) at which operators are retiring their transit buses and vans and how do those ages compare to the FTA minimums
bull Do the current minimum age and mileage requirements meet the needs of all agency types
bull How do FTArsquos current retirement minimums affect the purchase and retirement decisions of the nationrsquos operators
bull How has other federal legislation such as ldquoBuy Americardquo impacted vehicle bus and van useful life if at all
bull Should FTA consider changing the current minimums given the experience of the nationrsquos transit operators and manufacturers Alternatively how would an increase or decrease in the current minimum life requirements affect the fleet investment decisions of the nationrsquos transit operators
bull Are operators interested in procuring vehicles with shorter life expectancies than are permitted by the current policy (eg a cheaper and shorter life expectancy 40-foot bus)
bull How have changes in vehicle designs (eg low floor) and technologies (eg alternative fuels) affected the expected vehicle life
bull How do vehicle procurement policies impact expected vehicle life
Federal Transit Administration 2
Useful Life of Transit Buses and Vans Chapter 1 Final Report Introduction
This study seeks to provide answers to each of these questions with the ultimate objective of assessing both the appropriateness of FTArsquos existing minimum service-life policy for transit buses and vans and any potential need to change that policy
Reasons for Reviewing the Service-Life Policy
More than 20 years have passed since the adoption of FTArsquos minimum service-life guidelines Since that time the industry has undergone several significant changes many with potential implications for vehicle useful life Among these are the following
bull Operator Experience and Changing Economics The current minimum service-life requirements were developed based on the industryrsquos understanding of useful life as of 1985 With two decades of experience operating under these requirements operators have developed their own impressions and opinions as to how these requirements align with actual useful-life experience Moreover even if it is assumed that there have been no changes to the buses themselves (which of course there have been) changes to capital and operating costs as well as to vehicle utilization (passenger loads and duty cycles) will have yielded changes to both the economic and physical determinants of vehicle useful life
bull Impact of the Policy Itself It has been suggested that the presence of FTArsquos vehicle service-life policy has itself impacted actual useful-life expectations For example the combination of the low-bid and minimum life requirements may have yielded buses designed specifically to meet but not exceed the minimum life requirement (eg thus reducing the total expected useful life of a 40-foot bus from 14 to 16 years to say 12 years) Alternatively many manufacturers have lobbied to have their vehicles moved to a higher minimum age category (eg 10-year buses re-categorized to 12-years) as a means of expanding the potential market for their product There is now some evidence that this practice may have yielded buses that are capable of meeting the higher category bus testing requirements and yet not capable of meeting the service-life minimums once in service
bull New Vehicle Designs and Materials The past 20 years have seen the introduction of many new vehicle designs including increasing use of differing vehicle lengths (from 60 foot articulated to 30 foot sizes for 12-year buses and a similar range of sizes for 10-year 7-year and 5-year vehicles) low floor buses and ldquostickrdquo buses using a network of welded tubes in place of more traditional structures Each of these design variations especially those with changes of structural significance has implications for expected vehicle life
bull Alternative Fuels Operators have also increasingly adopted the use of alternative fuels vehicles including compressed natural gas (CNG) duel-fuel gas hybrid and potentially fuel cell vehicles Some of these are coming to the end of their first full life cycle thus providing an opportunity to assess their impact on vehicle useful life
bull New Technologies The past 5- to 10-year period has seen a significant increase in the number of new technologies installed on transit buses These include automatic vehicle location (AVL) automatic passenger counters (APCs) voice annunciation on-board cameras multiplexers and potentially collision avoidance systems Assuming many or all of these systems are expected to function before a vehicle can be released for revenue service each day the sheer proliferation of the technologies and the increasing likelihood that any
Federal Transit Administration 3
Useful Life of Transit Buses and Vans Chapter 1 Final Report Introduction
one of them will fail as the vehicle ages has significant implications for vehicle useful life From another perspective the increasing desirability of having the latest suite of technologies on each fleet vehicle can also drive down the useful life of transit vehicles with life here being determined more by technological obsolescence than by asset wear
bull Changes to the Domestic Manufacturing Market The combined influences of wide production variances Buy America provisions and the exit of several suppliers has significantly affected the long-term structure and viability of the domestic bus market The changes have yielded uncertainty regarding the future of exiting manufacturers and also impacted the availability of replacement parts for (and hence maintainability of) older fleet vehicles
bull Legislation In addition to Buy America provisions bus suppliers and purchasers are subject to a variety of additional federal requirements that may impact vehicle useful life Among these are the Bus Testing ADA and EPA emissions requirements
bull Procurement Strategies While transit operators continue to use a variety of vehicle procurement strategies the use of low-bid procurements in particular may have a negative impact on vehicle useful life Moreover as discussed elsewhere in this study the relatively small size of individual agency procurements (and the small size of the transit market in relation to the broader truck and automotive market) gives transit operators and the industry as a whole little ability to directly impact the useful-life characteristics of many bus and van types or their components
bull Desire to Increase Ridership Service Quality FTArsquos policy objective of increasing ridership might be served by accelerating the removal of older vehicles from service (thus improving the quality of service) As noted above such an accelerated replacement cycle could similarly quicken the adoption of new technologies further enhancing the rate of service improvement
Each of these considerations supports a reassessment of FTArsquos current minimum service-life requirements This study duly reviews each of these considerations
What is Useful Life
Before reviewing the study analyses and results it is helpful to first establish a working definition of useful lifemdasha concept that has different meanings to different users Useful life is typically defined as that age (ie number of years) after which an asset is no longer ldquofit for userdquo in the sense that it has become worn not fully operational unreliable andor does not otherwise deliver transit service of acceptable quality For mechanical assets such as transit vehicles the total utilization of that asset (eg life to date vehicle miles or hours) is equally important to age when establishing a minimum useful life Useful life based on asset utilization depends on the asset type its design specifications and the service it performs For transit buses and vans it is clear that total vehicle miles is in most instances a better measure of asset ware than vehicle age (with the latter frequently functioning as a rough proxy for the former) An empirical analysis of the relationship between useful life expectancy in years and vehicle life-to-date mileage for US transit buses is demonstrated in Chapter 7 (and repeated again later in the report using financial
Federal Transit Administration 4
Useful Life of Transit Buses and Vans Chapter 1 Final Report Introduction
analysis) These analyses underscore the importance of maintaining a combined age- and mileage-based FTA service-life policy
Engineering-Based Bus Conditions
For transit buses it is not sufficient to be merely ldquooperationalrdquo Rather transit patrons expect a vehicle that is reliable safe and offers reasonably comfortable travel The problem lies in identifying a specific point in the assetrsquos life (age or service miles) at which service quality safety or reliability is no longer acceptable In reality the decline in condition of a transit vehicle is a slow continuous process (excepting the impact of major overhauls) with no obvious point of retirement What is acceptable to one transit patron may not be to another
Figure 1-2 highlights both the absence of an obvious retirement age based on physical condition alone as well as the effect of vehicle use on vehicle condition In support of model development for the Transit Economic Requirements Model (TERM) FTA has conducted detailed physical condition inspections of more than 900 transit bus and van vehicles at more than 40 different transit agencies nationwide (each inspection is represented by a point in Figure 1-2) The sloping lines in Figure 1-2 represent vehicle decay curves developed using this data for the 12-year and 4-year service-life categories Here overall vehicle physical condition is measured on a scale of 5 (excellent) through 1 (poor) The trend lines capture the rate of vehicle decay
The inspections revealed both a slow decline in vehicle physical condition (and related service quality and reliability) with age and (for each age) a wide variation in condition driven primarily by differences in vehicle mileage and maintenance practices (captured here by the spread of vehicle condition observation points) but no obvious age or condition value for vehicle retirement Hence while these conditionage relationships are extremely valuable in understanding and predicting the rate of physical decay for transit vehicles they cannot be used to identify a specific desired retirement age or condition As a point of reference most transit operators replace their vehicles somewhere between condition 20 to 25 on this chart
Cost-Based Useful Life Analysis
In contrast to this condition-based approach vehicle cost analysis can be used to identify a specific vehicle retirement age (or service miles) at which average annual life-cycle costs for each vehicle type are minimized For example the ldquominimum life-cycle costrdquo approach employed in this report (see Chapter 7) compares the decline in purchase cost per service mile over the life of a vehicle with the corresponding increase in operating and maintenance costs (as well as periodic engine transmission and other rehabilitation activities) The period in time at which the sum of these annualized capital and operating costs is minimized represents the financially optimal point for vehicle retirement Unlike the engineering-based condition assessment this method identifies a specific optimal point in the asset life cycle for vehicle retirement However while the engineering-based assessment does not provide a specific useful-life age it does recognize declining service quality with age (which financial considerations alone do not) Table 1-2 outlines the tradeoff between these two approaches
Federal Transit Administration 5
Useful Life of Transit Buses and Vans Chapter 1 Final Report Introduction
Figure 1-2 Ph
ysic
al C
ondi
tion
Bus and Van Physical Condition Versus Age 50
Full Bus (12 yr)
Small Bus (7-10 yr)
Vans (4 yr)
Decay Curve - 12-Year Bus
Decay Curve - 4-Year Van
Excellent
45
40 Good
35
30 Adequate
25
Substandard 20
15
Poor 10
0 1 2 3 4 5 6 7 8 9 10 11 12 13 14 15 16 17 18 19 20 21
Vehicle Age (Years)
Table 1-2 Engineering Versus Economic Approaches to Identifying Useful Life
Approach Measures Service Quality
Identifies a Specific Useful-Life Value
Engineering Condition Based Yes No Economic Minimum Cost Replacement No Yes
Minimum Optimal Expected and Average Useful Life
Finally this study frequently makes the distinction between four different concepts of useful-life including optimal useful life expected (or planned) useful life minimum useful life and the current average retirement ages for US transit buses Table 1-3 presents these concepts and their definitions Understanding the differences in these definitions is important to understanding the analyses in the succeeding chapters of the report and also has importance to any potential changes to FTArsquos current service-life minimums These concepts are also illustrated graphically in Figure 1-3
The distinctions between the definitions in Table 1-3 are more than semantic Many within the transit industry equate FTArsquos 12-year minimum with the expected or desired useful life of a large transit bus (indeed many of the agencies participating in this study have set their agencyrsquos expected useful life values equal to the FTA minimum) This rather then viewing the 12-year minimum as a point at which some useful-life remains From the viewpoint of establishing policy it is recommended that FTA continue to establish its service-life minimum requirements such that some useful life does remain and yet the majority of useful life has been consumed Under these circumstances the expected average and optimal useful life values for each transit bus and van type should each occur after the service-life minimum (as is currently the case based on the results of this study) Maintaining this policy will ensure that (1)
Federal Transit Administration 6
t
Useful Life of Transit Buses and Vans Chapter 1 Final Report Introduction
tax payers derive good value from funds invested in transit buses (2) agencies with higher than average vehicle wear rate characteristics (ie their expected and optimal useful lives are lower than the average) will have some leeway for earlier retirement and (3) agencies with a ldquoproblemrdquo vehicle model will also have some leeway for earlier retirement (Chapter 5 considers provisions for more highly problematic vehicle models)
Table 1-3 Vehicle Useful Life Concepts
Useful Life Concept Definition Example Based on ldquo12-Yearrdquo Bus
Expected or Planned Useful Life The age at which transit operators plan to retire their transit vehicles
For many agencies this point is driven by policy and or funding
The age at which agencies ldquoexpectrdquo under the assumption that these availability and occurs at age 12 to or ldquoplanrdquo to retire their vehicles assets will be completely worn 15 Average Useful Life
The age at which agencies ldquodordquo retire their vehicles
The average age at which US transit operators ldquoactuallyrdquo retire their transit vehicles
Based on analysis of NTD data presented below the average retirement age is 151 years
Optimal Useful Life
The age at which agencies ldquoshouldrdquo retire their vehicles
The financially optimal point for vehicle retirement (ie the point at which life-cycle costs are minimized)
Based on the analysis in Chapter 7 this occurs between 12 to 14 years depending on annual mileage and other factors
Minimum Useful Life
The minimum age at which agencies are ldquoallowedrdquo to retire their federally funded vehicles without penalty
The minimum agemileage to retire a vehicle This point assumes that most vehicles still have additional years of useful and cost-effective service but that most of the assetrsquos value has been consumed
Currently set at 12 years
Figure 1-3 Minimum Life-Cycle Cost Curve
TToottaall
OOwwnneerr--sshhiipp
CCoossttss
AAvveerraaggee LLiiffee
EExxppeecctteedd LLiiffee
MMiinniimmuumm LLiiffee
CCoossttss LLoowweesstt CCoosstt
AAggee MMiilleess oorr HHoouurrss
AAnnnnuuaalliizzeedd CCaappiittaall
RReeppllaacceemmeenntt UUsseeffuull LLiiffee RRaannggee
MMaaiinntteennaannccee CC t
Federal Transit Administration 7
Useful Life of Transit Buses and Vans Chapter 1 Final Report Introduction
Finally the upcoming chapters of this report investigate and assess each of these differing useful life measures based on the survey responses vehicle retirement activities and life-cycle costs of US transit operators Specifically Chapter 4 documents average useful life of all transit bus and van categories based on actual vehicle retirements as obtained from FTArsquos National Transit Database (NTD) Next Chapter 5 documents the expected useful life of the nationrsquos transit buses based on agency responses to a survey conducted for this study Finally Chapter 7 estimates the optimal useful life based on a minimum life-cycle cost analysis of each bus and van type The study then compares and contrasts the assessed values for each of these differing measures of useful life with FTArsquos current service-life minimums to assess the appropriateness of those minimums and any potential need to change them
What About Vehicle Hours
Finally FTArsquos minimum service-life policy is currently defined in terms of both vehicle age and vehicle miles But what about vehicle hours As noted above vehicle miles generally provide a better measure of vehicle ware as compared to vehicle age However the number of hours of service can vary significantly between vehicles with the same life-to-date mileage Consider the contrasting cases of vehicles operated in slower moving central business district routes versus vehicles operated for higher-speed longer-distance commuter bus service A vehicle operated at a relatively slow operating speeds will have many more service hours (and likely poorer physical condition) than a similar vehicles with the same life-to-date miles but operated at higher speeds This suggests that vehicle hours should be included along with age and mileage as a minimum useful-life measure
The problem with adopting vehicle hours as a measure of useful life is the fact that unlike vehicle age and mileage which can be measured (with mileage based on hub meter readings) operators do not currently maintain records of life-to-date vehicle hours and have no existing means of doing so Hence to be used as a measure of minimum useful life these values would need to be estimated somehow most likely based on an agencies average operating speed The impact of average operating speeds (and by extension vehicle hours) on vehicle retirement age is considered in the life-cycle cost analysis discussed in Chapter 8
Project Approach
To meet the needs of the study the study team completed the following six independent analyses Each of these analyses aimed to provide a different perspective on (1) the current useful life of transit buses and vans (2) the appropriateness of FTArsquos minimum life policy and (3) the policyrsquos impact on transit vehicle life expectancies and vehicle retirement decisions at the agency level
bull Review of FTA Service-Life Categories The study provides descriptions of the types of vehicles found in each of FTArsquos five service-life categories This includes descriptions of the vehicle physical characteristics purchase costs common service applications primary manufacturers and annual units sold The analysis also considers the source markets for transit components including transit-specific and those components obtained from the
Federal Transit Administration 8
Useful Life of Transit Buses and Vans Chapter 1 Final Report Introduction
broader heavy-truck and automotive markets The market analysis is intended to provide perspective on transitrsquos role and position within the broader truck and automotive market with emphasis on where transit has the ability (or inability) to influence component and overall vehicle life expectancy
bull Review of Useful-Life Related Bus Procurement Regulations The study reviews federal legislation and circulars to identify federal requirements potentially impacting either the useful life or vehicle retirement decisions of the nationrsquos operators of transit buses and vans This review includes FTArsquos bus testing regulations the Americans with Disabilities Act (ADA) Buy America requirements the Standard Bus Procurement Guidelines and the Clean Air Act and its Amendments
bull Review of Actual Retirement Ages NTD data were used to determine the actual ages at which US agencies are currently retiring vehicles within each of FTArsquos service-life categories This analysis was then used to compare the average retirement ages with the minimum FTA age requirements for each of these vehicle types to determine how the current minimum retirement ages may be impacting local operatorrsquos vehicle retirement decisions
bull Industry Outreach The study team conducted two sets of interviews with bus fleet managers vehicle engineers maintenance staff and procurement personnel from a sample of the nationrsquos large medium and small-sized bus and van operators The first set of interviews were designed to document the industryrsquos concerns with FTArsquos current service-life policy to obtain agency perspective on how that policy impacts agency procurement decisions retirement decisions or the expected life of agency vehicles and to elicit suggestions on how or if that policy should be changed These interviews were also used to further document vehicle retirement ages (both agency policy as well as the actual retirement ages) and to obtain bus and van life-cycle cost data The second set of interviews consisted of follow-up questions to the original interviewsmdashwith greater focus on specific engineering issues such as the impact of new vehicle designs and technologies on expected vehicle life
bull Engineering Analysis The engineering analysis examines the life expectancy of transit buses and vans within each of the existing vehicle categories all from an engineering perspective (ie based on ability to maintain service reliability and safety) This analysis is completed both from the perspective of individual vehicle components and from that of the vehicle as a whole (ie the factors that determine overall vehicle useful life) The analysis then considers the appropriateness of the minimum life requirements for each vehicle category given the useful-life characteristics of each vehiclersquos component parts
bull Economic Analysis This analysis identifies that point in the life cycle of each bus and van type at which total life-cycle costs are minimized This point provides a financially logical age (or mileage) at which to retire that vehicle The identified minimum cost replacement ages are then placed in context with the results of the engineering analysis The combination of these two perspectives helps illustrate factors that drive granteesrsquo vehicle retirement decisions
Once again each of these analyses provides perspective on how the current FTA minimum life requirements compare with useful life as determined from actual vehicle retirement ages agency assessments of useful life and life-cycle cost analyses In turn these perspectives provide a vantage point from which to assess the merits of FTArsquos current retirement minimums
Federal Transit Administration 9
Useful Life of Transit Buses and Vans Chapter 2 Final Report FTA Service-Life Categories
CHAPTER 2 FTA SERVICE-LIFE CATEGORIES
This chapter provides a detailed review of each of the five service-life vehicle categories currently used by FTA The purposes of this chapter are threefold First the chapter provides the reader with a solid understanding of the characteristics of each of the five vehicle types This includes both the general physical differences between vehicles in the differing category types as well as differences in cost This background is critical for an effective understanding of the findings in the sections and chapters to follow
Second the detailed descriptions of each vehicle type and the components used in their manufacture also serve to emphasize the commonalities among vehicles in the same category and differences between vehicles in different categories Stated differently this review of the five categories and the vehicles in those categories demonstrate that FTA is well served by the five existing minimum service-life categories The exceptions are the 4-year and 5-year categories which have significant similarities to each other in terms of both general characteristics as well as the names of the manufacturers serving those markets
Third this chapter provides a market assessment for both vehicles and their components of all five FTA bus and van categories A primary objective here is to highlight the small size of the market for transit buses and vans relative to the auto and heavy-truck market from which most transit bus vehicle components and some bus and van vehicle types are derived Given this small market share the transit industry has little ability to impact the useful life of most transit vehicle types and components in a cost-effective manner For this reason the useful-life characteristics of transit buses and vans are largely determined by the wider truck and auto market and any significant attempts to increase or decrease the useful life of transit specific vehicles are also likely to have a negative impact on vehicle cost
This chapter is organized as follows bull Service-Life Category Descriptions
ndash Physical Description of Each Vehicle Type ndash Market Analysis of Vehicle Chassis and Components by Category
bull Implications for the Current Service-Life Categories
Service-Life Category Descriptions
Large Heavy-Duty Buses (12 Years 500000 Miles)
Approximately three in four rubber-tired transit vehicles are 12-year buses making this vehicle type the transit industryrsquos primary workhorse With a standard length of 40 feet (with variants ranging from 30 to 60 feet) a gross vehicle weight of roughly 33000 to 40000 pounds and an average seating capacity for about 40 passengers the 12-year bus is also the largest heaviest and biggest capacity rubber-tired vehicle serving the transit market
Federal Transit Administration 10
Useful Life of Transit Buses and Vans Chapter 2 Final Report FTA Service-Life Categories
Construction Vehicles in the 12-year category are typically built on integrated structure chassis unit body monocoque or semi-monocoque chassis Heavy duty chassis of the high-floor unit body type are built with substantial amounts of metal in under-structural bulkheads and sidewalls located at points of concentrated stress such as the front and rear suspension attach points passenger door openings and the engine cradle The size and thickness of these bulkheads and sidewalls results in a strong structure with a good margin for corrosion-related structural degradation and are a key factor in the overall longevity of this vehicle type
A less expensive type of construction is an integrated chassis composed of multiple tubing elements sometimes referred to as a ldquostick builtrdquo chassis These stick-built structures consist of an integrated floor roof and sidewall structure of Low-Floor Stick Chassis metal tubes welded together on which the major components are attached Low-floor buses typically use this type of construction as there is very little space under the floor for large structural elements The relatively small size of the structural elements of the low-floor bus provides less structure to bear the suspension and engine loads and reduces the tolerance of the structure to the effects of corrosionmdasha factor which may lead to shorted vehicle life expectancies for this vehicle type (this issue is discussed further in Chapter 6) Both traditional and stick-built structures are covered with outer panels composed of either stainless steel aluminum or composite materials
12-Year Vehicle Types High and Low Floor Vehicles Prior to the mid-1990s all 12-year buses were exclusively ldquohighshyfloorrdquo vehicles However in response to the ADA the industry developed low-floor buses that use ramps kneeling mechanisms or steps just a few inches above the curb or level with the curb for ease of entry Low-floor buses are available in every size of heavy-duty bus from short lengths to 60-foot articulated vehicles While the cost and most physical characteristics of high- and low-floor vehicles are similar some NABI Articulated Low-Floor Bus operators suspect that low-floor vehicles may have a lower expected life as compared to the traditional high-floor vehicle Chapter 6 Engineering Analysis addresses this possibility
Vehicle Lengths 12-year buses come in a variety of sizes ranging from 30 feet to 60 feet (articulated) buses Shorter 30- to 35-foot
Composite Monocoque Structure
Federal Transit Administration 11
Useful Life of Transit Buses and Vans Chapter 2 Final Report FTA Service-Life Categories
models are used on lower ridership routes andor on streets with limited maneuverability In contrast 60-foot articulated buses are used on high ridership corridors Articulated buses are available in both high- and low-floor configurations
Propulsion System Options Twelve-year vehicles are available with a wide variety of propulsion system options including diesel gas CNG electric and hybrid systems
Vehicle Costs Table 2-1 presents typical purchase costs for large heavy-duty 12-year buses
Table 2-1 Purchase Costs Large Heavy-Duty Buses (12-Year)
Model Type Cost
High-floor 40 foot $350000 Low-floor 40 foot $350000 40-foot Hybrid $500000 60-foot articulated $500000 Bus rapid transit $500000-$1M
12-Year Vehicle Market Unlike all other bus and van types the ldquo12-yearrdquo bus is manufactured almost exclusively for the transit market by a small number of specialized manufacturers Hence while this vehicle includes numerous components obtained from the heavy-truck market the chassis body and many key components of this vehicle type are manufactured specifically with the needs of the transit market in mind Of the roughly 3000 heavy-duty 12-year transit buses sold each year approximately 95 percent or more of these vehicles are destined for use in the transit market Most of the remaining vehicles are sold for applications similar to transit including shuttle buses at airport parking lots and at some national parks
While 12-year vehicles are manufactured specifically for transit and similar applications a large proportion of these vehiclesrsquo components including the engine transmission axels brakes suspension air compressors and power steering are derived from the significantly larger heavy-truck market In fact the total value of components derived from the heavy-truck market account for roughly 40 percent of the value of a new 40-foot bus In a sense transit bus manufacturers ldquoborrowrdquo these components from the much larger heavy-truck market (roughly 300000 heavy trucks are sold annually versus 3000 twelve-year buses) leading to significantly cheaper component prices than would be possible if they were manufactured solely for the 12-year vehicle market On the down side these components are designed with the heavy-truck market in mindmdashand not the specific needs of transit users Hence transit has little ability to influence the useful-life characteristics of these components in a cost-effective manner (ie as any transit ldquocustomizedrdquo components would be developed for a transit market that is one percent of the size of the truck market for which those components are currently manufactured)
In contrast the chassis body and several other components including the doors wheelchair lifts axles on low-floor buses destination signs and HVAC are manufactured solely for the transit
Federal Transit Administration 12
Useful Life of Transit Buses and Vans Chapter 2 Final Report FTA Service-Life Categories
market Table 2-2 summarizes the shares of 12-year vehicles and related vehicle components destined for the transit market
Manufacturers Vehicles in this category are built by a relatively small number of manufacturers that specialize in this vehicle type These include Gillig Millennium Transit North American Bus Industries (NABI) New Flyer Nova Bus and Orion
Table 2-2 Market Analysis 12-Year Bus Vehicles and Components
Vehicle Components Primary Market
Annual Units Sold
12-Year Vehicle Share of Market
Share of Vehicle Purchase Cost
Total Vehicle 12-Year Bus Transit 3000 95 or more NA Vehicle Components Chassis body doors wheelchair lifts low floor axles destination signs HVAC
Transit 3000 95 or more 60
Engine transmission axles brakes suspension air compressors and power steering
Heavy Truck 300000 1 40
Small Heavy-Duty Buses (10 Years 350000 Miles)
The 10-year service-life category represents the second-most durable buses used in transit Vehicles in the category average roughly 30 to 40 feet in length (with most in the 30-foot range) have gross vehicle weights of approximately 26000 to 33000 pounds and have seating capacity for between 26 to 35 passengers Vehicles in this category account for roughly one percent of the nationrsquos bus and van fleet
Construction This class of vehicles was initially served by body-on-frame manufacturers using construction methods similar to school buses These manufacturers build their vehicles using medium heavy-duty rear engine ldquostrippedrdquo chassis also used for both school buses and motor homes Many of these buses are built using stripped chassis manufactured by medium- and heavy-duty truck manufacturers (eg International Freightliner and GM) although some 10-year vehicle manufacturers produce their own chassis The 10-year transit vehicle manufacturer (eg Blue Bird Optima and Thomas Built) then adds a body and other components to complete construction of the 10-year bus
More recently small bus manufacturers have been adapting European designs for the North American bus market The European designs have narrower widths (some as narrow as 96 inches) than typical North American bus designs and are promoted as more maneuverable in tight urban and suburban operating areas The adapted European designs also incorporate aluminum integral structure unit body monocoque or semi-monocoque structures which is a
Federal Transit Administration 13
Useful Life of Transit Buses and Vans Chapter 2 Final Report FTA Service-Life Categories
departure from the typical steel or stainless steel in more traditional North American designs The vehicles are available in both low floor and high floor
Champion Heavy-Duty Small Bus Eldorado Heavy-Duty Small Bus
Vehicle Costs Table 2-3 presents typical purchase costs for small heavy duty 10-year buses
Table 2-3 Purchase Costs Small Heavy Duty Buses (10-Year)
Model Type Cost
Body on Frame (30-40 feet) $200000 - $250000 Integral Chassis (30-40 feet) $250000 - $325000
10-Year Vehicle Market Transit buses account for only a very small proportion of the body-on-frame vehicle market from which the 10-year bus is derived More accurately of the roughly 60000 vehicles manufactured using body-on-frame construction each year only 200 to 300 are finished as 10-year transit buses (ie the body is a passenger compartment intended for transit or similar applications) The vast majority are finished as school buses or motor homes (in fact many buses sold in the 10shyyear category are just modified school buses) Hence for most 10-year transit buses the primary transit-specific components are the body (including the interior) destination signs and fare collection equipment The majority of the vehiclersquos major components including the chassis engine transmission axles brakes and steering are derived from either the broader school bus or motor home market of the still larger heavy-truck market Table 2-4 presents a summary market analysis of the 10-year vehicles and their components
Manufacturers Vehicles in this category are built by a relatively small number of firms that generally specialize in the manufacture of school buses motor homes and small transit vehicles These include Blue Bird Corporation Optima Bus Supreme Corporation and Thomas Built buses
Federal Transit Administration 14
Useful Life of Transit Buses and Vans Chapter 2 Final Report FTA Service-Life Categories
Table 2-4 Market Analysis 10-Year Bus Vehicles and Components
Vehicle Components Primary Market Annual Units Sold
10-Year Vehicle Share of Market
Share of Vehicle Purchase Cost
Total Vehicle 10-Year Bus Transit 200 to 300 95 or more NA Vehicle Components Body doors destination signs Transit 200 to 300 95 or more 35 Chassis wheelchair lifts HVAC School bus and
motor home 60000 Less than 1 25
Engine transmission axles brakes suspension air compressors and power steering
Heavy-Truck 300000 Less than 1 40
Medium-Duty and Purpose-Built Buses (7 Years 200000 Miles) Medium-Duty Cab Chassis
The 7-year service-life category represents the mid-level in terms of bus durability and size Vehicles in the category average roughly 25 to 35 feet in length (with most in the 30-foot range) have gross vehicle weights of approximately 16000 to 26000 pounds and have seating capacity for between 22 to 30 passengers Vehicles in the 7-year category account for just over two percent of the nationrsquos bus and van fleet
The majority of buses in this category are purpose built using either a front-engine cab chassis or a stripped chassis both of which are manufactured by medium- and heavy-duty truck manufacturers (eg International Freightliner and Workhorse) A ldquofinal stagerdquo transit vehicle manufacturer (eg Champion Eldorado National and Goshen Coach) then adds a body and other components to complete construction of the 7-year bus
Purpose-Built Front-Engine Cab
Medium-Duty Cab Chassis Bus Cab chassis is a term the trucking industry uses to describe a chassis equipped with a complete operator cab The chassis has a conventional layout with an engine and transmission at the front and the chassis is available in varying wheelbases and lengths The cab chassis and chassis are sent incomplete to final stage manufacturers who mount custom bodies to the chassis rails These chassis are popular and used for school buses delivery trucks transit Medium-Duty Stripped Chassis and shuttle buses and recreational vehicles
Medium-Duty Stripped Chassis Stripped chassis are similar to cab chassis except that the chassis is supplied without a sheet metal cab The chassis is provided by the final stage manufacturer (eg a transit vehicle manufacturer) with an operatorrsquos platform that includes the instrument cluster and
Federal Transit Administration 15
Useful Life of Transit Buses and Vans Chapter 2 Final Report FTA Service-Life Categories
switch gear control pedals operator heating and air conditioning and an operatorrsquos seat The final stage manufacturer then builds a single body to place on top of the chassis that houses both the passenger section and operator station The stripped chassis enables a bus manufacturer to design a body configuration closer to that of an urban transit bus The front engine layout however dictates the locations of the entrance door to be behind the front axle and operator station Typically the body is equipped with a single door Front-engine chassis are popular because they are produced in large numbers for the trucking industry and hence are relatively affordable However the front-engine configuration compromises ride quality because of its heavily forward-biased weight distribution
Vehicle Costs Table 2-5 presents typical purchase costs for medium-duty 7-year buses
Table 2-5 Purchase Costs Medium-Duty Buses (7-Year)
Model Types Cost
Bus built on cab chassis $75000 Bus built on stripped chassis $100000 Trolleybus built on stripped chassis $175000
7-Year Vehicle Market As with the 10-year vehicle type vehicles in the 7-year category account for only a very small proportion of the medium-duty truck market from which they are derived Of the roughly 50000 vehicles manufactured by the medium-duty truck market each year only about 300 are finished as 7-year transit buses (ie the body is a passenger compartment intended for transit or similar applications) The remaining vehicles of this general type are completed for a broad array of different uses including airport and hotel courtesy vehicles ambulances moving vans medium-size trucks and motor homes Here again for most 7-year transit buses the primary transit specific components are the body (including the interior) doors destination signs and fare collection equipment The remaining major components including the chassis engine transmission axles and brakes are once again derived from a broader ldquonon-transitrdquo market Table 2-6 presents a summary market analysis of the 10-year vehicles and their components
Manufacturers The number of manufacturers that have developed transit vehicles in this category is larger than the 10-year and 12-year vehicle types These include Cable Car Classics Champion Bus Eldorado National Glaval Bus Goshen Coach Molly Corporation Starcraft Automotive Corporation Startrans Supreme Corp and Trolley Enterprises
Federal Transit Administration 16
Useful Life of Transit Buses and Vans Chapter 2 Final Report FTA Service-Life Categories
Table 2-6 Market Analysis 7-Year Bus Vehicles and Components
Vehicle Components Primary Markets Annual Units Sold
10-Year Vehicle Share of Market
Share of Vehicle Purchase Cost
Total Vehicle 7-Year Bus Transit 300 90 or more Na Vehicle Components Body doors destination signs wheelchair lifts Transit 300 90 or more 30
Chassis engine transmission axels brakes suspension air compressors and power steering HVAC
Medium-Duty Truck Market 50000 Less than 1 70
Light-Duty Vehicles (5 Years 150000 Miles and 4 Years 100000 Miles)
The 4- and 5-year service-life categories Automotive Minivan with Second-Stage Access Ramp represent the smallest buses used in transit and are typically built on cutaway van chassis or modified vans approximately 16 to 28 feet in length as characterized by FTA The majority of buses in this category are modified minivans modified and unmodified full-size passenger vans and specially built buses using cutaway chassis produced by automobile manufacturers In contrast to the 12- 10- and 7-year categories (which are more clearly defined from one another) the 4- and 5-year vehicle categories have a significant amount of overlap with each other in terms of both the vehicle characteristics and the manufacturers that serve these categories For this reason these two categories are presented together in this section Together the two categories account for more than 20 percent of all transit buses and vans (the vast majority of which are 4-year vehicles) Automotive Minivan with Second-Stage
Raised Roof and RampModified Minivans (4-year vehicle) The automotive minivan is a popular choice in serving vanpools and paratransit operations for transit authorities These minivans are the same vehicles popular with large families because of their efficient use of space low floor and sliding doors For use in the transit industry minivans are often modified by second-stage manufacturers and equipped with wheelchair ramps and raised roofs Installing a wheelchair ramp requires major modifications to provide sufficient height clearance for the wheelchair and its occupant
Modifications typically involve cutting and removing the floor structure between the front and rear axles and welding a custom floor constructed from rectangular tubes that is lower by as
Federal Transit Administration 17
Useful Life of Transit Buses and Vans Chapter 2 Final Report FTA Service-Life Categories
much as six inches from the existing structure The modified floor necessitates rerouting of the exhaust system brake lines and electrical harnesses While lowering the floor is an extensive modification it enables the use of a ramp rather than a wheelchair lift Another approach to integrating a wheelchair ramp into a minivan is to raise the roof and add a raised top This modification increases the height of the opening enabling the wheelchair and its passenger to enter the van without restriction In performing this modification critical structure such as the point where the pillars and the roof structure come together are retained Other than these noted access enhancements these vans are used as they are sold to the general market with no further modifications
Full-Size Passenger Vans (4-year vehicle) With Full-Size Van Modifications the advent of the minivan full-size vans have become less popular with large families but remain popular in commercial applications and in serving vanpool and paratransit operations for transit authorities Since 1996 all full-size vans use body-on-frame construction meaning that the body is a separate component and physically mounts to the frame with bolts and rubber isolating bushings similar to the method used for trucks Modifications to full-size vans are limited to raised roofs and the installed wheelchair lifts These types of modifications are typically supported by the van manufacturer
Buses Built on Cutaway Van Chassis (4- or 5-year vehicle) Cutaway Van Chassis Cutaway chassis is a term the vehicle industry uses to describe a full-size van with the section of the body behind the B-pillar or the area aft of the front passenger seats removed These chassis are manufactured primarily by the domestic auto manufacturers including Ford GM and DaimlerChrysler Final-stage manufacturers take these cab chassis mount specialty-built bodies to the frame rails and integrate them with the remaining front cab section In doing so final-stage manufacturers provide custom-made bodies that better meet the requirements of their customers or targeted industry (eg transit) For transit bodies are constructed from a variety of materials including steel aluminum and fiberglass
Example Passenger Body Note here that the distinction between the 4- and 5-year vehicles is not well defined A general rule in making the distinction between them is that the 5-year vehicles generally feature higher capacity truck axles with dual rear wheels (versus single for the 4-year vehicle) higher capacity springs and other suspension components a somewhat heavier-duty frame and frequently a slightly wider body These differences support high passenger capacities and some additional durability as compared to the 4-year models
Federal Transit Administration 18
Useful Life of Transit Buses and Vans Chapter 2 Final Report FTA Service-Life Categories
Van and cutaway van chassis manufacturers provide detailed guidelines on approved modifications to their products Following these guidelines prevents the final-stage manufacturer from having to re-certify to federal emissions and safety standards
Vehicle Costs Table 2-7 presents typical purchase costs for light-duty 4- and 5-year buses
Table 2-7 Purchase Costs Light-Duty Buses (4-Year and 5-Year)
Model Types Cost
Modified Mini-Van (paratransit) $30000-40000 ndash mini-van platform $20000-30000 Full-Size Van (van pool) $25000-30000 Small Bus Built on Cutaway Van Chassis $50000-65000 ndash Cutaway van chassis $20000-30000
4-Year and 5-Year Vehicle Market More so than any of the other vehicle categories transit has very little influence on the design and manufacture of vehicles in these two categories For example of the 11 million minivans sold each year roughly 3000 are purchased and modified for transit uses (less than 03 percent of the total market) Similarly of the 370000 cutaway chassis sold annually roughly 2500 are purchased and modified for transit uses (a 07-percent market share)
Manufacturers Ford Motor Company General Motors and DaimlerChrysler are the three manufacturers building selling vans and supplying vans and cutaway van chassis to second-stage manufacturers for final assembly for the transit industry The manufacturers modifying these vehicles for transit uses are largely the same as that for the 7-year vehicle category These include Braun Corporation Champion Bus Eldorado National Girardin Corporation Goshen Coach Mid Bus National Coach Corp Starcraft Automotive Corporation Supreme Corp Turtle Top and Vision Point Mobility
Implications for the Current Service-Life Categories
In addition to providing the reader with some familiarity of the five current service-life categories the preceding review also supports some critical assessments of FTArsquos existing service-life policy and the broader issue of useful life in general These include the following questions bull Do the existing service-life categories ldquomake senserdquo bull Should FTA restrict the service-life categories in which vehicles are tested bull What leverage does the transit industry have in influencing vehicle useful life bull Do the service-life categories require periodic review
The following sections address each of these questions
Federal Transit Administration 19
Useful Life of Transit Buses and Vans Chapter 2 Final Report FTA Service-Life Categories
Do the existing service-life categories ldquomake senserdquo
A key objective of this study was to review and assess the appropriateness of the five existing service-life categoriesmdashnot just from the viewpoint of the useful-life values themselves (eg 12- 10- and 7-years) but also examining whether the groupings of vehicles in these categories ldquomake senserdquo Based on the review above it is clear that the five existing service-life categories do represent logical groupings of vehicles having broadly similar characteristics in terms of construction methods size weight passenger capacities cost and manufacturers (the following chapters address the actual useful-life similarities of vehicles in these five categories) Table 2-8 provides support for this view
Table 2-8 Comparison of Vehicle Types in FTArsquos Five Service-life categories
Category Typical Characteristics Minimum Life
Length ApproxGVW Seats Average Cost
(Whichever comes first)
Years Miles
Heavy-Duty Large Bus 35 to 48 ft and 60 ft artic
33000 to 40000 27 to 40 $325000 to
over $600000 12 500000
Heavy-Duty Small Bus 30 ft 26000 to 33000 26 to 35 $200000 to
$325000 10 350000
Medium-Duty and Purpose-Built Bus 30 ft 16000 to
26000 22 to 30 $75000 to $175000 7 200000
Light-Duty Mid-Sized Bus 20 to 30 ft 10000 to 16000 16 to 25 $50000 to
$65000 5 150000
Light-Duty Small Bus Cutaways and Modified Van 16 to 28 ft 6000 to
14000 8 to 22 $30000 to $40000 4 100000
As noted in the text above the key exceptions to this observation are the 4-year and 5-year vehicles built using cutaway chassis Here there is a significant degree of overlap between the 4- and 5-year vehicle categories in terms of construction type sizes vehicle weights costs and manufacturers It should also be noted that the useful life attributes of these two vehicle types were not found to be significantly different in the review of actual vehicle retirement ages presented in the next chapter However despite these similarities the review in this chapter and the analysis in succeeding chapters do not provide adequate grounds for combining these two into a single 4- or 5-year vehicle category
Should FTA restrict the service-life categories in which vehicles are tested
The preceding section suggests that FTA is well served by the five existing minimum service-life categories However this suggestion is subject to the important caveat that the bus testing program ldquoratesrdquo vehicles in the categories best suited to those vehiclersquos characteristics In recent years some manufacturers have successfully lobbied in a more durable category than would appear warranted by their vehiclersquos general characteristics (eg testing a bus with 10-year characteristics as a 12-year bus) This has resulted in service reliability issues and in some
Federal Transit Administration 20
Useful Life of Transit Buses and Vans Chapter 2 Final Report FTA Service-Life Categories
instances early retirement for the purchasing agencies when the tested vehicles were not found to have the expected durability
The next chapter further discusses the overall requirements of the bus testing program and its relationships to useful life The issue here is that while the category definitions appear sound based on this review of vehicle types the most significant limitation in the current five-category system may lie in permitting vehicles to be tested in a higher service-life category than the one that best suits the characteristics of their vehicle Given this consideration FTA may wish to more tightly control in which categories vehicles are eligible to test based on some combination of characteristics (eg gross vehicle weight seating capacity other) but with the potential for special waivers to test in a different category so as not to stifle innovation (Manufacturers should be required to provide reasonable justification as to why their vehicles should be tested in the higher durability category)
What leverage does the transit industry have in influencing vehicle useful life
The analysis above identified the origin markets for the chassis body and other components for each of the five vehicle categories A key objective of this analysis was to demonstrate that nearly half of the vehicle components for 12-year buses and a significant majority of the components for all other vehicle categories (including chassis engines and transmissions) are obtained from the heavy-truck and automotive markets Given that transit represents a very small proportion of these markets (generally less than one percent) the transit industry has little ability to influence the characteristics of these components including their useful life in a cost-effective manner
A key exception here is the structure of 12-year buses As discussed in Chapter 6 the useful life of a 12-year vehicle is determined primarily by the durability of its structure (as most major components are replaced or rebuilt over the life of the structure) To the extent that 12-year bus structures are designed and manufactured solely for transit use the transit industry has better ability to influence this componentrsquos design and durability characteristics (Although given the manufacturersrsquo small annual order sizes and local agenciesrsquo tight capital budgets funding such innovation is challenging in practice)
With most other components and nearly all other service-life categories this is not the case Hence for example the transit industry cannot significantly alter the useful life characteristics of minivans or buses built on cutaway chassis without incurring the cost of further customizing these mass-produced items to meet transit-specific needs In short for component types and vehicle types derived largely from mass-produced markets the industry is likely better served by adopting useful life expectations to the existing characteristics of these assets rather than attempting to further modify them to better suit transit
Do the service-life categories require periodic review
Finally the useful life and other characteristics of transit buses and vans do change over time with changes in technologies vehicle designs new propulsion technologies new materials etc Given this ongoing change the current five-category system may no longer effectively capture
Federal Transit Administration 21
Useful Life of Transit Buses and Vans Chapter 2 Final Report FTA Service-Life Categories
the useful life or other characteristics of the nationrsquos bus fleets (eg consider the possibility of more durable BRT vehicles with useful life characteristics closer to rail vehicles) Thus FTA should consider conducting periodic reviews of the service-life categories every 5 to 10 years
Federal Transit Administration 22
Useful Life of Transit Buses and Vans Chapter 3 Final Report Legislation and Procurement
CHAPTER 3 LEGISLATION AND PROCUREMENT
This chapter provides a review of legislative requirements other than the minimum service-life requirements themselves with emphasis on their potential useful-life implications This includes FTArsquos bus testing regulations and ADA Buy America and Clean Air Act requirements In addition the chapter considers the impacts of procurement methods and guidelines on useful life expectations Finally this chapter reviews prior FTA and industry studies on both the establishment and the consequences of FTArsquos existing minimum service-life policy
FTA Service-Life Circulars and Regulations
This section highlights the federal regulations that are relevant to the useful life of buses and vans (with the exception of the minimum life requirements themselves) While many of these regulations are found to have potential useful life implications the implications generally are considered minor relative to the issues of annual mileage new vehicle designs changing life-cycle economics and other drivers of useful life as considered elsewhere in this report
Buy America Regulation
Buy America requires that rolling stock (ie vans buses and rail cars) procured with federal funding must contain at a minimum 60-percent domestic content by cost and that final assembly takes place in the Unites States These requirements are designed to protect and ensure the longshyterm viability of the domestic bus and van market
This legislation is also suspected of having a negative impact on vehicle life expectancy Since bus manufacturers rely on the cost of major components (eg engine transmission and axles) to meet domestic content requirements the Buy America regulation in effect limits the amount of money a bus manufacturer can spend on the (foreign built) structure of the vehicle which tends to drive the vehiclersquos useful service life
For example North American Bus Industries (NABI) recently pulled the ldquoCompoBusrdquo from the US market This bus used an expensive and durable composite material for the vehiclersquos structure which performed extremely well at FTArsquos Altoona testing facility Unfortunately for NABI the higher cost of the structure prevented it from complying with the Buy America regulation and from staying price competitive in the US low-bid bus procurement market Manufacturing this composite structure in the Unites States was not considered an option given higher domestic production costs The resulting bus structure cost exceeded the comparable cost level of the standard steel structure cost making the CompoBus uncompetitive in a low-bid procurement environment
Bus Testing Regulation
The Bus Testing Regulation requires new bus and van models to be tested at FTArsquos Altoona Pennsylvania test facility before they can be purchased using federal funds The purpose of the
Federal Transit Administration 23
Useful Life of Transit Buses and Vans Chapter 3 Final Report Legislation and Procurement
testing is to provide vehicle performance information that grantees can use to help inform their purchase or lease decisions for new vehicles These tests do not assign pass or fail standards nor do they assign an overall vehicle performance grade Rather the testing process is only designed to report test results to the manufacturer and potential grantees The Altoona program consists of seven automotive tests including maintainability reliability safety performance structural integrity fuel economy and noise
Importantly the busrsquos performance on the structural integrity test is believed to correlate closely with the busrsquos structural performance in revenue-generating service This accelerated testing simulates up to 25 percent of the mileage accumulated by transit buses in revenue service Most bus manufacturers design their structures to minimize the failures that occur during testing Even the better manufacturers find themselves altering their designs based on testing results The impact of this testing on actual vehicle useful-life remains unclear It is certainly the case that manufacturers may beef up their structures to ensure that they pass the 25-percent accumulated mileage test On the other hand by designing their structures to minimize the specific types of failures that occur during testing manufacturers may not be fully addressing the long-term structural requirements to meet FTArsquos minimum life requirements
The Bus Testing Program may also have other useful life implications The tests performed by the program vary depending on the FTArsquos service-life categories with the tests becoming more stringent for vehicles with higher service-life minimums (eg testing is more stringent for a 12shyyear bus than for a 10-year bus and so on) Over time many manufacturers have lobbied to have their vehicles tested in a higher service-life category than might otherwise be expected given the characteristics of their vehicle (eg based on gross vehicle weight passenger capacity or length) Given the absence of a passfail or vehicle grading scale this allows a manufacturer to advertise that their vehicle has been tested as a ldquo12-yearrdquo bus when its design characteristics are really more similar to those of a typical 10-year vehicle While this vehicle may easily pass the 25-percent accumulated mileage test for a 12-year vehicle the structure may not withstand a full 12 years of hard revenue service In this case the Bus Testing Program may not impact useful life so much as potentially allow vehicles to be incorrectly classified
Americans with Disabilities Act (ADA)
The ADA requires that transit buses and vans are accessible to persons with disabilities Initially this requirement was fulfilled with lifts but more recently low-floor buses have become the preferred approach to fulfill the ADA requirements With the popularity of heavy-duty low-floor buses issues surrounding compliance with regulations such as maintaining wheelchair lifts are losing relevance on 12-year vehicles However buses in the lower service-life categories (eg 4- 5- 7- and 10-year) that are built on top of truck or school bus-based frame rail chasses continue to necessitate the use of wheelchair lifts This adds costs that have some effect on the economic measure of useful life A more important effect of this regulation is that low-floor buses may not have the same long-term structural integrity as more traditional bus designs This suspicion (voiced by some study interviewees) cannot be fully confirmed until more vehicles with this relatively new bus design approach and pass their useful life standards
Federal Transit Administration 24
Useful Life of Transit Buses and Vans Chapter 3 Final Report Legislation and Procurement
Environmental Protection Agency (EPA) California Air Research Board (CARB) and Clean Air Act
The EPA CARB and Clean Air Act Amendments affect the permissible emissions levels for buses and vans In general these regulations have little or no impact on the physical life expectancy of transit buses This is because emissions regulations only have implications for vehicle drive trains (ie engine and transmission) and these vehicle components generally have life expectancies much less than that of the vehicle structure (eg 250000 and 300000 miles for the engine and more than 5000000 for the structure) However to the extent that environmental regulations drive the costs of replacement engines and transmissions they can affect vehicle life-cycle economics (both nonrecurring capital costs and recurring operating and maintenance costs) and thus impact the ldquooptimalrdquo timing of vehicle replacement
Major changes to the emission regulations are occurring in calendar years 2007 and 2010 The 2007 emission standards will dictate the use of exhaust after-treatment technology such as diesel particulate filters (DPFs) Most of the 2007 diesel engines will also incorporate cooled exhaust gas recalculating (EGR) technology These technologies are available and impacts on service-life options are not expected
Procurement Methods and Guidelines
This section considers the impacts of procurement guidelines and different procurement methods on the life expectancy of transit buses and vans
Standard Bus Procurement Guidelines
In the mid-1970s FTA sponsored the development of standard bus procurement guidelines This document is commonly referred to as the ldquoWhite Bookrdquo (in reference to the color of its cover) Since then the American Public Transportation Association (APTA) has sponsored updates of the bus procurement guidelines and expanded them to cover new technologies such as low floors CNG and articulated buses The guidelines heavily influence the design and durability of heavy-duty transit buses The guidelines address all areas of the vehicle including component design performance materials corrosion protection structural integrity and warranties By establishing useful and well-followed industry standards this reference has indirectly helped to maintain bus and van useful life characteristics
A group of the larger transit agencies in the Northeast has developed a more extensive set of bus specifications to append to the APTA ldquoWhite Bookrdquo These specifications have been developed to procure buses that can operate more reliably in the more difficult duty cycle and operating environment of these urbanized areas The revised requirements are focused on more stringent structural integrity and corrosion prevention specifications These are the most important constraints to fulfilling the FTA minimum service-life policy in these operating environments and even extending these buses to as long as 15 years of service Examples include
bull The Washington Metropolitan Area Transit Authority (WMATA) uses these extended specifications to procure buses that can better fulfill the 15-year life objective established by its board policy
Federal Transit Administration 25
Useful Life of Transit Buses and Vans Chapter 3 Final Report Legislation and Procurement
bull New York City Transit (NYCT) the main initiator of the more extensive bus specifications was looking for a bus design that could achieve the 12-year service-life objective with reliable service in a slow-speed stopstart urban duty cycle in New York City
bull The Toronto Transit Commission (TTC) was part of this research and is now trying to extend its bus useful life to 18 years or longer to help address constraints on bus replacement funding
All three of these examples present different paths to the same prioritymdasha structurally stronger bus to provide a longer andor more durable service life in tough urban operating environments
Third-Party Contracting Requirements
The methods transit authorities use to procure buses have potential impacts on their useful life In particular use of the low-bid procurement method without establishing some critical pre-bid requirements can result in the purchase of a lower quality bus with a below-average life expectancy This is the result of fierce price competition (and cost reductions) to ensure a contract win Within a pre-bid environment the firm establishment of structural component requirements during the specifications stage is of particular importance to ensuring the minimum life requirements are attained All other bus components can be replaced as long as the main structure can continue service
Conclusions Impact of Regulations and Procurement Practices
In conclusion while many federal regulations and industry procurement practices are believed to have potential useful life implications these implications are generally considered minor relative to the issues of annual mileage new vehicle designs changing life-cycle economics and other drivers of useful life The key exception here is the low-bid procurement process which may yield vehicles with lower quality structures leading to reduced vehicle longevity To protect against this outcome agencies need to establish firm structural component requirements during the pre-bid stage to ensure the minimum life requirements are attained
Federal Transit Administration 26
Useful Life of Transit Buses and Vans Chapter 4 Final Report Average Retirement Ages
CHAPTER 4 AVERAGE RETIREMENT AGES
This chapter uses NTD data to identity the actual retirement ages for vehicles from each of the five existing bus and van service-life categories The analysis is then used to evaluate how closely these average retirement ages correspond to the FTA minimums for each category To a certain extent the observed difference between the observed distribution of actual retirement ages as compared to FTArsquos retirement minimums provides a measure of actual vehicle durability relative to the minimum retirement points However for many operators the difference between the FTA minimum and actual agency retirement age is also a reflection of agency funding limitations (ie some agencies would retire their vehicles sooner if sufficient funding were available)
Analysis of Actual Fleet Retirement Ages Using NTD Vehicle Data
All US transit operators receiving FTA Section 5307 Formula Funds are required to include a comprehensive listing of their transit bus and van fleet holdings as part of their annual NTD submissions These vehicle listings document the number of active vehicles age (date built) current year mileage life-to-date mileage make model fuel type length and passenger capacity of each sub-fleet operated by the reporting agencies (including vehicles operated directly by the agency as well as those operated by contract providers) Unlike the study survey data described in the next chapter (which only covers a small sample of the nationrsquos bus and van operators) NTD provides good quality empirical data on the actual retirement practices of virtually all US bus and van operators1
Conspicuously missing from this data (from the viewpoint of this study) is documentation of the service-life category to which each sub-fleet vehicle has been assigned (ie 12-year 10-year 7shyyear 5-year and 4-year) a limitation FTA may wish to address in future revisions to the NTD reporting requirements To a limited extent these useful life assignments can be inferred based on the vehicle size and carrying capacity data found in NTD In addition the make and model data recorded in NTD can also be compared to that found in FTArsquos bus testing records to help supply the proper assignments (although NTDrsquos make and model data are not always populated or use the same designations as the bus testing records) Both of these approaches have been used by this study to help document actual vehicle retirement practices for each minimum service-life category
Analysis of NTD Bus and Van Data
This study used NTD transit bus and van vehicle data to assess the extent to which agencies operate vehicles beyond FTArsquos minimum service-life requirements and the extent to which the minimum vehicle age acts as a constraint on the fleet retirement decisions of the nationrsquos transit
1 As of 2006 rural transit operators receiving FTA Section 5311 funds are also required to report on their bus and van vehicle holdings These data are not expected to be published until later in 2007 With the exceptions of Urban 5309 operators (who own more than 95 percent of the nationrsquos bus fleets) and Rural 5311 operators no other operator types are required to report to NTD
Federal Transit Administration 27
Useful Life of Transit Buses and Vans Chapter 4 Final Report Average Retirement Ages
operators This analysis provides the measure of average vehicle useful life identified in Table 1shy3 in Chapter 1
In conducting this analysis this study used the bus size classification employed by NTD prior to 2002 (at which time the pre-existing three-tiered bus size categorization based on seating capacity was consolidated into a single ldquoMotorbusrdquo category) This bus size classification provided a useful means to help segment bus vehicles into the five vehicle type categorizations as recognized by FTArsquos service-life policy In addition the vehicle model names manufacturer names and vehicle specifications as reported to NTD were thoroughly reviewed to ensure that all bus and van models were placed in the correct minimum service-life categories (using each vehicle modelrsquos Altoona bus test assignment) Vehicles that could not be definitively placed within one of these five categories were not included in this analysis The resulting data sample covers all years from 1995 through 2001 and included more than 500 transit operators
While NTD records the date built make and model of each agencyrsquos sub-fleets it does not record the actual retirement of these vehicles Therefore as a means of identifying when individual agency sub-fleets were retired the records for each sub-fleet were tracked from year to year (ie across multiple years of NTD submissions) This analysis then identified the point in time at which individual bus sub-fleets ldquodisappearedrdquo from the NTD record (ie the age at which sub-fleets were retired from service) These data were then aggregated across all operators and time periods to estimate the average actual retirement ages for each vehicle type Use of multiple years of NTD vehicle data was crucial to an accurate determination of these retirement ages However even with seven years of NTD data and over 500 different transit operators the sample sizes for the 10- 7- and 5-year bus categories remain relatively small Hence the analytic results for these bus types are less certain in comparison to the considerably more popular 4- and 12-year vehicle types
This analysis was used to identify the following for each vehicle category
bull Actual Retirement Ages Specifically the distribution of actual retirement ages and the average retirement age for each vehicle type (comparing two consecutive years of data to determine which vehicles were retired from one year to the next)
bull Percentage of Fleet Vehicles Exceeding the FTA Minimum and Later Age Values Given the problematic nature of comparing vehicle records across multiple years of NTD submissions the analysis also looked at the percent of active fleet that ndash Exceed the service-life minimum by one or more years ndash Exceed the service-life minimum by two or more years ndash Exceed the service-life minimum by three or more years and so onhellip
This analysis is very helpful in assessing the distribution of fleet vehicle exceeding the minimum retirement ages
bull Impact of the Minimum Service Requirement The impact that the minimum service requirement has on the actual distribution of retirement ages
Federal Transit Administration 28
Useful Life of Transit Buses and Vans Chapter 4 Final Report Average Retirement Ages
Analysis of 12-Year500000-Mile Vehicles
As noted earlier 12-year category vehicles account for more than three in four of the nationrsquos 90000 transit buses and vans
Figure 4-1 Retirement Age Distribution of 12-NTD data on vehicles in the 12shyyear500000-mile vehiclesyear500000-mile category show
that retirements peak at ages 14 through 17 and the average retirement age for vehicles in this category is 151 years (see Figure 4-1) Hence the vast majority of these buses are retired well beyond the 12-year and 500000shymile minimum For example more than three-quarters of retirements occur at age 14 or later In contrast only 6 percent of vehicles are retired at age 12 and only 7 percent at age 13 These results clearly indicate that the 12-year minimum itself is not a binding constraint for most transit operators since they operate buses well beyond this age
Figure 4-1 also suggests that some vehicles are retired prior to the 12-year minimum Many of these retirements consist of vehicles that have reached the 500000 minimum mileage prior to the 12-year minimum age (the chart shows the vehicle life-to-date mileage as of the year prior to vehicle retirement) However there are also a number of ldquofalserdquo retirements depicted in this chart that capture NTD data entry errors (or changes in reported vehicle names from one year to the next) and perhaps some vehicle trading between agencies Vehicle retirements prior to age nine were excluded from the calculation of average retirement age
While the analysis in Figure 4-1 is helpful in evaluating the distribution of retirement ages it has little to say about the impact of vehicle utilization on useful life In contrast Figure 4-2 presents the proportion of active 12-year buses that are older than 12 14 16 and 18 years respectively (on the horizontal axis) These proportions are further segmented by average annual sub-fleet mileages including groupings of vehicles with between 20000 and 30000 annual miles 30000 and 40000 annual miles and so on (with the 30000 to 40000 group further segmented between those agencies that do and do not perform comprehensive mid-life overhauls)2 As expected the proportion of vehicles exceeding each age group threshold declines as the age threshold increases Moreover while roughly one-third of all vehicles for operators with between 20000 and 30000 annual miles per vehicle remain in service after the 12-year minimum is passed a surprising 12 percent (roughly one in eight) of vehicles for operators with between 40000 and 60000 miles remains in service past age 12 (representing a range of between 480000 and 720000 life-to-date miles) Hence even the highest mileage operators some with vehicles well
2 Note that most US transit operators do not perform a comprehensive mid-life vehicle overall for their 12-year buses Moreover those agencies that do perform such overhauls have average annual sub-fleet mileages of between 30000 to 40000 miles
Minimum Replacement Life = 12
0
200
400
600
800
1000
1200
1400
1 2 3 4 5 6 7 8 9 10 11 12 13 14 15 16 17 18 19 20 21 22 23 24 25 Retirement Age
Num
ber o
f Bus
es
Mileage Unknown Mileage gt= 500000 Mileage lt 500000
Federal Transit Administration 29
Useful Life of Transit Buses and Vans Chapter 4 Final Report Average Retirement Ages
beyond the 500000-mile minimum still maintain their vehicles in service past the 12-year age minimum
Figure 4-2 Share of Active 12 Year Buses Exceeding Specific Age Levels
For Operators With Differing Annual Fleet Milage 40
Average Annual Miles per Fleet Vehicle 35
Shar
e of
Fle
et V
ehic
les
30
25
20
15
10
5
0
20000 to 30000
30000 to 40000 (Major Rehab)
30000 to 40000 (No Major Rehab)
40000 to 50000
50000 to 60000
Older Than 12 Years Older Than 14 Years Older Than 16 Years Older Than 18 Years
Age Group
While the proportion of fleet vehicles remaining in service declines for all annual mileage groups Figure 4-2 shows that the proportions in service remain fairly high past the 12- 14- and 16-year age thresholds for vehicles that do versus those agencies that do not perform a major mid-life overall These findings demonstrate the effectiveness (if not the cost effectiveness) of these rehabilitations in extending vehicle life
Finally Figure 4-3 repeats the analysis from Figure 4-2 but this time segmenting 12-year vehicles between the articulated (60-foot) standard 40-foot and 35-foot vehicle types3 This chart demonstrates that while the proportion of vehicles in service past 12 years tends to decrease with increasing vehicle length a significant proportion of the active vehicles for each of these vehicle types remain in service after 12 years (including one in four 35-foot vehicles one in five 40-foot vehicles and one in six articulated vehicles)
In summary this analysis suggests that the current 12-year requirement provides a reasonable retirement age minimum for large heavy-duty vehicle types This is because the majority of these vehicles are retired in the 6-year period following the service-life minimum with the average retirement age occurring roughly three years past the minimum (providing a cushion for the early retirement of poor reliability vehicles) Similarly the fact that most of the vehicle retirements for this group are concentrated in a 5- to 6-year period following the retirement minimum implies that the vehicles have roughly common useful characteristics providing some
3 Note As of 2005 NTD does not report many 30-foot buses with ages of 12 years or more
Federal Transit Administration 30
Useful Life of Transit Buses and Vans Chapter 4 Final Report Average Retirement Ages
validation to the current grouping of these vehicles within the same service-life category Finally regardless of annual vehicle mileage or vehicle length a significant share of the nationrsquos heavy-duty vehicles remains in service after the 12-year minimum and many with more than 14 years of service
Figure 4-3 Share of Active 12 Year Buses Exceeding Specific Age Levels
Articulated 40 Foot and 35 Foot Vehicles 30
25
Shar
e of
Fle
et V
ehic
les 20
15
10
5
0
Articulated
40 Foot
35 Foot
Older Than 12 Years Older Than 14 Years Older Than 16 Years Older Than 18 Years
Age Group
Analysis of 10-Year350000-Mile Vehicles
Figure 4-4 Retirement Age Distribution The number of 10-year vehicles of 10-year350000-Mile Vehiclesreported to NTD is far smaller than the
number of 12-year vehiclesmdashthese vehicles account for little more than one percent of the nationrsquos transit buses and vans (roughly 1000 active vehicles) Consequently the analysis of average retirement age for this category suffers from small sample issues (Figure 4-4) This data suggests an average retirement age of approximately 84 years which is obviously less than the minimum retirement age Hence the quality of the analysis for this vehicle category is clearly problematic (the study had
Minimum Replacement Life = 10
0
10
20
30
40
50
60
1 2 3 4 5 6 7 8 9 10 11 12 13 14 15 16 17 18
Retirement Age
Num
ber o
f Bus
es
Mileage Unknown Mileage gt= 350000 Mileage lt 350000
difficulty in effectively identifying this vehicle type based on the data reported to NTD) and requires a better data source to properly evaluate an actual average retirement ages
Federal Transit Administration 31
Useful Life of Transit Buses and Vans Chapter 4 Final Report Average Retirement Ages
Figure 4-5 Share of Active Vehicles Exceeding Specific Age Levels
For 4 5 7 and 10-Year Buses and Vans 35
4 Year
5 Year 30
Shar
e of
Fle
et V
ehic
les 25
20
15
10
5
7 Year
10 Year
0 Greater Than Min Greater Than Min Greater Than Min Greater Than Min Retirement Age Retirement Age + 1 Retirement Age + 2 Retirement Age + 3
Age Group
NTD could be used however to document the proportion of 10-year vehicles currently in service that exceed the 10-year minimum in age (see Figure 4-5) This analysis suggests that only 7 percent (or roughly one in 15) of these vehicles remains in service past the 10-year service-life minimum It is also clear from Figure 4-5 that the 10-year vehicle Figure 4-6 Retirement Age Distribution of type has the lowest proportion of active 7-year200000-mile Vehicles vehicles exceeding the service-life minimum of the five existing service-life categories This may suggest the need to reduce the minimum life requirement for this vehicle type by one or more years
Analysis of 7-Year200000-Mile Vehicles
As with the 10-year vehicle category the number of vehicles in the 7-year category is relatively small accounting for just over 2 percent of the nationrsquos active bus and van fleets (under 2000 vehicles) However the data quality for
Minimum Replacement Life = 7
0
10
20
30
40
50
60
70
80
1 2 3 4 5 6 7 8 9 10 11 12 13 14 15 16 17 Retirement Age
Num
ber o
f Bus
es
Mileage Unknown Mileage gt= 200000 Mileage lt 200000
this sample is believed to be superior to that for the 10-year category based on the review of the
Federal Transit Administration 32
Useful Life of Transit Buses and Vans Chapter 4 Final Report Average Retirement Ages
NTD records and points to an average retirement age of approximately 82 years with retirements spiking at 10 years (Figure 4-6) This figure suggests that seven years is an appropriate minimum retirement age for these vehicles as many operators are clearly able to keep vehicles past this age and are retiring their vehicles within roughly a three- to four-year period after the minimum requirement is satisfied Figure 4-5 also supports this finding with 12 percent (roughly one in eight) of the nationrsquos active ldquo7-yearrdquo vehicles having a current age of 8 years or more
Analysis of 5-Year150000-Mile Vehicles
Vehicles in the 5-year age category also Figure 4-7 Retirement Age Distribution of account for only a small proportion of the 5-year150000-mile Vehiclesnationrsquos bus and van fleet (about 14 percent of the total or about 1500 active vehicles) For this vehicle type the average retirement age was estimated to be 59 years (Figure 4-7) Most vehicles are maintained in operation up to and beyond the five-year minimum although the age of retirements peaks right at five years with a significant number at four years (presumably for vehicles that attain the required mileage before they are retired) As with the analysis for 10- and 7-year categories the 5-year vehicle analysis using NTD suffers from small
Minimum Replacement Life = 5
0
20
40
60
80
100
120
140
160
180
200
1 2 3 4 5 6 7 8 9 10
Retirement Age
Num
ber o
f Bus
es Mileage Unknown
Mileage gt= 150000 Mileage lt 150000
sample issues and this approach should be revisited at a future point in time using an improved NTD dataset
Analysis of 4-Year100000-Mile Figure 4-8 Retirement Age Distribution of Vehicles 4-year100000-mile vehicles
Four-year vehicles account for close to Minimum Replacement Life = 4 one-fifth of the nationrsquos total bus and van fleet or roughly 15000 active vehicles 1600
The NTD data indicate that most vehicles 1400
in the 4-year and 100000-mile category are retired between four and seven years of age The majority of vehicles are being retired past 4 years with the average retirement age around 56 years This N
umbe
r of B
uses
1200
1000
800
600
400
suggests that the four-year minimum 200
service age for this vehicle category is 0
appropriate for the characteristics of this vehicle type (Figure 4-8) The fact that most retirements occur after the
Mileage Unknown Mileage gt= 100000 Mileage lt 100000
1 2 3 4 5 6 7 8 9 10 11 12
Retirement Age
Federal Transit Administration 33
Useful Life of Transit Buses and Vans Chapter 4 Final Report Average Retirement Ages
minimum retirement age suggests that the current minimum is not binding for most operators (a desirable characteristic for a retirement minimum)
Similarly Figure 4-9 presents the proportion of active 4-year vehicles exceeding the 4-year minimum age and other age thresholds for operators with differing annual mileages per feel vehicle As with the similar chart presented above for the 12-year vehicle category even those operators with very high annual mileage per fleet vehicle have more than one in 10 vehicles exceeding the minimum age requirement On average roughly one in three active 4-year vehicles is age five or older
Figure 4-9 Share of Active 4 Year Vans Exceeding Specific Age Levels
For Operators With Differing Annual Fleet Milage 45
Shar
e of
Fle
et V
ehic
les
40
35
30
25
20
15
10
5
10000 to 20000
20000 to 30000
30000 to 40000
40000 to 50000
50000 to 60000
60000 to 70000
0 Greater Than Age 4 Greater Than Age 5 Greater Than Age 6 Greater Than Age 7
Age Group
Summary
Table 4-1 summarizes the results of the preceding analysis This analysis of NTD bus vehicle data demonstrates that the average retirement age for most bus and van types occurs after the minimum age requirement is met This finding supports continued use of the existing policy as it provides age minimums that are clearly less than (but within one to three years of) the average actual retirement age This analysis also suggests that vehicles retired prior to the current age minimum have satisfied the current mileage minimums Finally a significant number of vehicles are operated well beyond the minimum age requirement suggesting that well-maintained vehicles can be retained in service well past the expected vehicle useful life
The fact that most vehicles are retired one to three years after the minimum age requirement has been attained is not in and of itself proof that the ldquotruerdquo useful life values of these vehicle types is greater than the minimum life requirement In some and perhaps many cases the actual
Federal Transit Administration 34
Useful Life of Transit Buses and Vans Chapter 4 Final Report Average Retirement Ages
retirement age exceeds the minimum requirement due to funding constraints (ie many operators would replace their vehicles earlier given additional funding capacity) and not optimal or preferred retirement age considerations However that fact that so many vehicles are regularly operated well beyond the service-life minimum requirements clearly indicates that most vehicles types do have some useful service-life remaining well past the current FTA minimums
Table 4-1 Minimum Versus Average Retirement Age by Vehicle Category
Vehicle Category Minimum Retirement Age
Average Retirement Age (Years)
Share of Active Vehicles That Are One or more years past the retirement minimum
Three or more years past the retirement minimum
12-Year Bus 151 19 9 10-Year Bus 84 7 4 7-Year Bus 82 12 3
5-Year Bus Van 59 23 5 4-Year Van 56 29 10
Average retirement age estimates for this vehicle category suffer from small sample issues
The fact that vehicles in service past the service-life minimums continue to deliver valuable service is demonstrated in Figure 4-10 (12-year buses) and Figure 4-11 (4-year vans) Both of these charts present the average annual mileage by vehicle age for vehicles in low average and high-mileage fleets Both charts demonstrate that while annual service mileage tends to decline with vehicle age vehicles well past the minimum retirement age continue to see significant service miles Hence far from being delegated to support or special service vehicles vehicles exceeding the minimum retirement age continue to deliver a significant proportion of the nationrsquos transit services
Assessment of Existing Bus Type Categories Based on NTD Analysis
FTArsquos current bus category definitions were designed to be widely encompassing and include virtually any new rubber-tired vehicle intended for transit service and purchased with FTA funds In terms of actual vehicle characteristics (eg length passenger capacity GVW) the existing service-life categories show considerable variation in vehicle characteristics both between and within each category (eg 12-year buses range in length from 30 to 60 feet) The question then concerns how sensible these categories are based on the observed useful life experience of each category type
Based on the preceding analysis the 12-year vehicle type demonstrates the greatest consistency in vehicle retirement ages followed next by the 4-year vehicle category (refer to the relatively smooth shape of the retirement age distributions in Figures 4-1 and 4-8 above) These orderly distributions around a mean replacement age are indicative of commonality of their overall useful life characteristics In contrast the distribution of retirement ages for the 10- 7- and 5shyyear vehicle types is more disorganized (see Figures 4-4 4-6 and 4-7) While some of this disorganization is a function of the relatively small purchase quantities for these less popular vehicle categories it may also reflect greater dissimilarities in the designs of these vehicle types (given their smaller purchase quantities there is probably less industry impetus and opportunity
Federal Transit Administration 35
Useful Life of Transit Buses and Vans Chapter 4 Final Report Average Retirement Ages
for vehicle type standardization) Hence based on this analysis of NTD data the 12- and 4-year categories appear to ldquomake senserdquo while the logic of the 10- 7- and 5-year categories may benefit from further review
Figure 4-10 Annual Vehicle Mileage By Vehicle Age for Fleets With
Differing Mileage Levels 12-Year Vehicles
Ann
ual V
ehic
le M
ileag
e A
nnua
l Veh
icle
Mile
age
80000
70000
60000
50000
40000
30000
20000
10000
0
Low Mileage Fleets (lt20000 annual miles per vehicle)
Average Mileage Fleets (35000 annual miles per vehicle)
High Mileage Fleets (50000 annual miles per vehicle)
Very High Mileage Fleets (65000 annual miles per vehicle)
1 2 3 4 5 6 7 8 9 10 11 12 13 14 15 16 17 18 Vehicle Age (Years)
Figure 4-11 Annual Vehicle Mileage By Vehicle Age for Fleets With
Differing Mileage Levels 4-Year Vehicles 80000
70000
60000
50000
40000
30000
20000
10000
0
Low Mileage Fleets (lt20000 annual miles per vehicle)
Average Mileage Fleets (35000 annual miles per vehicle)
High Mileage Fleets (50000 annual miles per vehicle)
1 2 3 4 5 6 7 8 9 Vehicle Age (Years)
Federal Transit Administration 36
Useful Life of Transit Buses and Vans Chapter 5 Final Report Industry Outreach
CHAPTER 5 INDUSTRY OUTREACH
This chapter presents the results of the first set of industry outreach interviews for this study (the results of the second set of interviews are presented in the next chapter) This first outreach effort consisted of a set of detailed interviews with a sample of transit agencies vehicle manufacturers transit industry suppliers and private operators The purpose of the interviews was to evaluate how FTArsquos existing minimum service-life requirements impact agency and manufacturer decisions regarding vehicle design procurement and retirement The interviews were also designed to elicit industry responses to a range of potential changes to the existing service-life requirements and to obtain industry representativesrsquo suggestions on how the current requirements might best be modified Finally the first set of industry outreach interviews provided valuable vehicle life-cycle cost data including the cost and expected useful lives of all major vehicle components (data required to support the life-cycle cost analysis in Chapter 7) Upon completion of these initial interviews a second set of follow-up interviews was conducted to further investigate several issues identified in the original interviews This second set of interviews focused on bus engineering concerns and the results of these issues are considered in the next chapter
Transit Agency Participants
The research team developed an interview guide to assess the current experience of transit agencies with the FTA service-life requirements Questions covered areas such as vehicle replacement decisions alternatives to the current FTA policies maintenance practices and the impacts on service quality Responses to the transit agency interview guide were received from the nine transit agencies identified in Table 5-1
The responding agencies include a mix of operator types such as urban suburban and rural operators and represents operators with fleet sizes ranging from less than 40 to over 4000 vehicles Seven of the nine agencies have purchased some or all of their fleet vehicles using FTA funds and hence have fleet vehicles that are subject to FTArsquos minimum service-life requirements Three of the agencies that have purchased some but not all of their vehicles using federal funds (Montgomery County Ride-On Frederick County TransIT and Jefferson Transit) are subject to state-imposed minimum life requirements that are at least as stringent as FTArsquos) NYCT was included in the sample because of both its large size and its decision to use non-FTA funding sources as a means of having more control over vehicle testing Toronto was included because of the absence of an active federal bus funding program in Canada (or service-life requirements) and the consequent need to regularly maintain heavy duty vehicles up to and past age 18
Staff Interviewed
The staff interviewed for this study were all members of senior and mid-level management holding fleet management and fleet maintenance responsibilities These respondents included representatives of one or more of the following types of positions within their organizations bull Bus Operations Manager
Federal Transit Administration 37
Useful Life of Transit Buses and Vans Chapter 5 Final Report Industry Outreach
bull Chief Mechanical Officer bull General Manager (smaller agencies only) bull Superintendent of Engineering bull Equipment Maintenance Manager bull Director of Vehicle Maintenance
Table 5-1 Agencies Responding to Detailed Interview Guide
Operator Type Fleet Size (2005 NTD)
Vehicles Purchased Using FTA Funds
Los Angeles County Metropolitan Transportation Authority (Metro) Los Angeles CA
Major Urban 2815 Buses Most
Massachusetts Bay Transportation Authority (MBTA) Boston MA
Major Urban 1311 Buses 235 Vans
Yes
New York City Transit New York NY Major Urban 630 Articulated Buses 4024 Buses
655 Vans
No
Toronto Transit Commission (TTC) Toronto Canada
Major Urban 1508 Buses No
Washington Metropolitan Area Transit Authority (WMATA) Washington DC
Major Urban 1467 Buses 378 Vans
Yes
Capital Metro Austin TX Medium Urban 434 Buses 187 Vans
Yes
Ride-On - Montgomery County MD Suburban 341 Buses Some
TransIT Services of Frederick County Frederick MD
Small Urban Rural
55 Buses 8 Vans
Some
Jefferson Transit Jefferson County WA Rural 20 Buses 17 Vans
Most
It is important to note here that most staff interviewed had considerable familiarity with the useful life of heavy-duty transit buses (ie the 12- and 10-year FTA bus categories) but generally did not have a firsthand understanding of the 4- 5- and 7-year vehicle types This is in part due to the relative scarcity of the 5- and 7- year vehicle types and to the fact that these smaller vehicle types are typically operated and maintained by contract operators The exceptions here are Frederick County TransIT and Jefferson County Transit which both provided valuable insight on the smaller vehicle types
Agency Interview Guide Responses
This section presents the received responses to the study interview guide by the nine responding agencies Not all of the agencies responded to every question therefore the number of responding agencies is indicated for every question Appendix A provides a complete summary of all responses to the interview guide
Federal Transit Administration 38
Useful Life of Transit Buses and Vans Chapter 5 Final Report Industry Outreach
Agency Useful-Life Experience
This section focuses on the sample agenciesrsquo current vehicle retirement policies including their expected and scheduled replacement age by vehicle type and other criteria driving retirement such as duty cycle funding constraints or maintenance issues
Table 5-2 summarizes the planned and agency policy retirement ages for heavy-duty vehicles for each of the sample agencies Table 5-2 also shows the range of actual retirement ages for recently retired fleet vehicles and a brief listing of some primary drivers of these recent retirement decisions
Table 5-2 Planned and Recent Actual Retirement Ages Heavy Duty Vehicles
Agency PlannedPolicyRetirement Age
(Heavy-DutyVehicles)
State Retirement
Policy (if any) Actual Retirement
Experience Issues With Recently Retired
Vehicles
WMATA 15 years (imposed by WMATA Board)
No 15 to 16 years High maintenance costs reliability
TTC 18 years at 40000-45000 annual miles
No 18 Years High maintenance costs
Montgomery County
12 years Yes same as FTA for larger vehicles
Close to scheduled TMCs retired at 15 years Gilligs retired at 12 years
Any delays due to procurement requests or testingapproval TMCs retired due to high maintenance costs Gilligs retired because of no lift poor quality and high maintenance
New York City Transit
12 years Yes 7 years (for all bus types and sizes)
13-15 years had to retire Grummans before FTA minimum
Overage due to lack of funding availability Early retirement of Grummans due to heavy duty cycle
MBTA 12 years No Recent retirements at 16-19 years
Limited funding
Los Angeles Metro
13 years or 500000 miles
No Within 2 to 3 years of planned
Retirement beyond scheduled due to budget and legal consent degree obligations Early retirement due to fire andor beyond repair
Frederick 12 years Yes same as FTA for larger vehicles
Within 1-2 years of planned
Delay due to procurement requests
Federal Transit Administration 39
Useful Life of Transit Buses and Vans Chapter 5 Final Report Industry Outreach
Agency PlannedPolicyRetirement Age
(Heavy-DutyVehicles)
State Retirement
Policy (if any) Actual Retirement
Experience Issues With Recently Retired
Vehicles
Austin 12 years Not stated Within 1-2 years of planned TMC CNG buses recently retired 6 months early ndash FTA approved
Outdated CNG equipment
Jefferson Transit
15 years Yes similar to FTA
15 to over 20 years Physical condition duty-cycle maintenance requirements
There are two key observations to be noted in Table 5-2 First all nine of the agencies reported having a policy on the useful life of heavy-duty buses and four of these nine agencies have planned retirement ages that exceed the FTA minimum of 12 years (with Los Angeles Metro at 13 years WMATA and Jefferson Transit at 15 years and TTC at 18 years) Second the actual vehicle retirement for all nine agencies typically occurs between one to four years after the FTA minimum has been reached (but can occur as late as vehicle age 20) Moreover for seven of the nine agencies the actual retirement age also typically exceeds the (less stringent) planned or policy retirement age Given these observations it is clear that FTArsquos current minimum service-life requirement for heavy-duty buses is not actively constraining the agenciesrsquo retirement decisions (as retirements occur after the minimum retirement age has been reached) Limited capital funding was cited as the primary reason why the timing of actual vehicle retirements has exceeded the plannedpolicy retirement age by all but one of the responding agencies The lone agency Frederick stated that funding is not an issue although the state rarely provides as many vehicles andor funds as the agency has requested
When asked to report on the primary problems associated with recently retired vehicles the agencies cited issues relating to vehicle maintenance deteriorated physical condition and component and structural wear related to heavy duty-cycles FTArsquos minimum service life requirements were only cited by three of the nine agencies (Boston Los Angeles and Austin) and each of these agencies typically maintains its vehicles two or more years past the current FTA minimum New York ranked FTA requirements as the lowest priority as it does not purchase vehicles with federal funds
It is also important to note here that all but one of the agencies has had to retire vehicles prior to their planned retirement age and in one case prior to the FTA minimum (Austin retired a problem CNG vehicle prior to 12 years with FTA approval) The causes of earlier-than-planned retirements included problem vehicles with abnormally high maintenance costs a desire for equipment upgrades and damage beyond repair Boston is the only agency that did not report early retirement of its vehicles This is despite a tough operating environment and the frequent need to keep vehicles well beyond planned 12-year retirement age MBTA staff also stated their desire for an 8-year replacement cycle to eliminate the need for a mid-life overhaul and to maximize use of the latest bus industry technologies None of the agencies reported having to take advantage of FTArsquos ldquolike-kind exchangerdquo provision which permits early retirement of
Federal Transit Administration 40
Useful Life of Transit Buses and Vans Chapter 5 Final Report Industry Outreach
specific vehicles and assignment of the unamortized FTA interest in them to replacement vehicles
Mid-Life Overhaul Practices
Table 5-3 summarizes responses to the current practices for comprehensive ldquomid-liferdquo overhauls of vehicles This overhaul is applied to all of the agenciesrsquo larger (40-foot) heavy-duty cycle vehicles with the strategy of maintaining vehicles to meet or pass their scheduled retirement age Overhauls are typically timed with the expected life of major components (eg drive train rebuilds) while service on minor components is on an as-needed basis New York reported that mid-life overhauls are planned though not typically performed on all vehicles In this case the vehicles are rehabbed on an as-needed basis or on an individual campaign basis following a preventive maintenance strategy Washington DC states that it is looking into additional smaller overhauls at 3 9 and 12 years for other component replacements and upgrades On the other hand Toronto indicated that it is considering revising its current 6- and 12-year overhaul program to a program with a 9- to 10-year major overhaul and smaller component overhauls at other years due to the decline in provincial funding
Table 5-3 Mid-Life Overhaul Practices Heavy-Duty Vehicles
Mid-Life Overhaul
Number of Respondents Agencies
Approximate Cost perVehicle ($2006)
Additional Years
Expected Components
Yes 4 Washington Toronto New York
$110000 3 years Engine transmissions AC brakes and other major components
Yes 1 Boston $175000 6 years
Sometimes 1 Los Angeles Limited due to lack of manpower and funds
Not stated
No 4 Frederick Montgomery Jefferson
Not considered cost effective
It is important to note that the sample presented here is heavily biased in favor of those agencies that do perform mid-life overhauls (with four of the nine respondent agencies performing such overhauls on a regular basis) Based on a prior FTA condition assessment of 43 US transit bus fleets the practice of completing major mid-life overhauls is relatively rare with only seven of the assessed operators regularly performing a major rehabilitation (four of which are also included in the sample for this study) In contrast those agencies that do not perform a scheduled mid-life overhaul typically complete many of the same rehab activities over the life of the bus but on an as-needed basis (as opposed to a single coordinated effort) It is important to note that those agencies undertaking major mid-life rehab activities represent many of the largest in the nation and hence are of critical importance to this study
Federal Transit Administration 41
Useful Life of Transit Buses and Vans Chapter 5 Final Report Industry Outreach
Impact of FTArsquos Minimum Service-Life Requirements
Although some agencies have occasionally had to either retire a vehicle prior to the FTArsquos minimum age or lighten the duty of vehicles to reach these minimums the overall sense is that agencies are not directly impacted by the current FTA requirements This is because the agencies have a state or agency-imposed minimum retirement age which is more stringent than the FTA minimums andor are impacted by the availability of capital funding which forces them to keep vehicles longer than desired
When asked how the agency has been impacted by FTArsquos current minimum retirement ages all but one of the agencies reported no impact due to having other state or agency-imposed minimums (Washington Montgomery Frederick Jefferson) or not purchasing vehicles with FTA funds (Toronto and New York and for some vehicles Los Angeles Montgomery Frederick and Jefferson) Austin reported not being negatively impacted by FTA guidelines although it has had to retire some buses six months early due to outdated equipment which FTA approved Boston reported being impacted by FTA minimums due to the need for a mid-life overhaul to reach the current 12-year heavy-duty minimum
Although New York reported no current impact from FTArsquos policy it has had to retire a group of vehicles prior to the FTA minimum retirement age which consequently led to a change in its vehicle funding policy These vehicles were purchased with federal funds and thus the agency had to reimburse 80 percent of the purchase price which was taken from other projects This early retirement forced a delay in future bus procurements and was the reason behind the current policy to purchase all vehicles with state and local funds
In the absence of the FTA 12-year minimum retirement age Boston would consider retiring vehicles earlier at eight years to eliminate the need and large capital expense of a six-year midshylife overhaul and keep up with the latest vehicle technologies Toronto and Los Angeles reported interest in retiring vehicles earlier than their own self-imposed policies require although in practice this would not be possible due to funding constraints
Regarding the appropriateness of the current FTA policy four of the agencies (Montgomery Frederick Austin and Jefferson) indicated that the retirement minimums are suitable and did not recommend any adjustments or revisions It should be noted that these agencies did not report any major problems with vehicles and have retired vehicles close to their planned retirement age Specific recommendations to the current FTA minimum retirement ages were given by five of the nine agencies Table 5-4 summarizes these recommendations The main recommendations reported by various agencies are to include rehabilitation costs or extended warranties as reimbursable costs and to give the agency more options or discretion on retirement ages
Federal Transit Administration 42
Useful Life of Transit Buses and Vans Chapter 5 Final Report Industry Outreach
Table 5-4 Recommendations on Current FTA Policy
Agency Recommendations Washington ndash WMATA bull Include options for agencies
bull Include rehab costs and extended warranties as reimbursable costs (up to some of original costs)
Toronto bull Shorter service-life options are not feasible (due to heavy-duty and procurement methods)
bull Increase to 12 15 18 20 and 24 years at agencyrsquos option bull Include rehab costs in federal funding
New York bull Provide options bull Mileage looks high based on annual average bull Include rebuild costs as reimbursable expense (to improve maintenance) bull Include stipulations on FTA funds for rebuild bull Use bus testing for bus prequalification bull Consider shaker-table in bus testing bull Identify higher-level options in ldquoWhite Bookrdquo specs
Boston bull Reduce agemileage from 12 years500000 miles to 8 years300000 miles Los Angeles bull Age is acceptable however allow more discretion on vehicles not performing at
optimum level
Vehicle Service-Life Categories
To review the current FTA service-life categories the survey asked agencies for their opinion on alternative vehicle classes based on durability and procurement value These alternatives are summarized as follows
bull More durable (more expensive) vehicles for high-volume service with longer FTA minimum ages and mileage requirements
bull Less durable (less expensive) vehicles with shorter FTA minimum retirement ages and mileage requirements
bull Use of the agencyrsquos own engineering and economic analysis to determine best retirement age and rely on existing funding constraints to ensure a reasonable length of service life
bull Mix of durability and minimum agemileage at the procurement level (procurement options)
Appendix A presents each agencyrsquos specific responses to each of these options The following is a summary of those responses
More Durable Vehicles Six of the nine responding agencies stated they were not interested in a more durable vehicle (only two agencies expressed a clear interest in this possibility) This generally negative response reflected concerns relating to cost effectiveness weight rider comfort and the slower adoption of new technologies Some agencies state that a more durable vehicle type might be considered if its components were equally durable especially with the
Federal Transit Administration 43
Useful Life of Transit Buses and Vans Chapter 5 Final Report Industry Outreach
strain from heavy-duty cyclesmdashand thus would not increase maintenance needs or decrease quality
Less Durable Vehicles Interest in less durable less expensive vehicles was even lower with all nine agencies expressing significant concerns Some agencies stated these vehicles would not be appropriate for their duty cycles and others expressed concern over the relationship with the expected life of components a decrease in quality and the increase in procurement efforts An MBTA participant reiterated their interest in reducing the current FTA minimum for heavy-duty buses from 12 to 8 years
Agency Determined Retirement Age None of the agencies clearly objected to the alternative option of allowing agencies to use their own judgment in determining vehicle retirement ages (ie drop all minimum life requirements and rely on funding constraints to ensure vehicles are retained for reasonable service lives) Based on the current actual retirement ages of the nine responding agencies few agency vehicles would be retired before FTArsquos current minimums (as is already the case for funding reasons) One concern with this option as expressed by an NYCT participant is the capability of some agencies to accurately determine the best vehicle retirement age
Mix of Procurement Options As a starting point for discussion the interview participants were provided with the list of procurement options presented in Table 5-5 and were then asked to consider these options or provide similar ideas The concept of providing a mix of procurement options was generally negative with only three of the nine operators clearly interested in this possibility Concerns included skepticism over the ability of vehicle manufacturers to develop cost-effective vehicles with the longer life spans and the slower adoption of new technologies with long-lived vehicles Respondents were also concerned with the capacity of rehab vendors to meet increased demand and how rehab would be monitored and approved by FTA There were also concerns as to how the smaller medium and even some larger sized operators would implement this option given that the vast majority of these operators do not currently perform (or have the capacity to perform) mid-life rehabilitations In addition operators with low average annual vehicle mileages often do not have the need to perform a mid-life overhaul given their relatively low rate of vehicle deterioration
Allowing Earlier Retirement of the Existing Vehicle Types The agencies also provided their opinions on permitting earlier retirement of the existing FTA vehicle types Positive impacts stated include reductions in fuel and maintenance costs reductions in emissions (newer vehicles) increased customer satisfaction from newer technologies and reductions in average fleet age It was also suggested that few agencies would be able to take advantage of such a reduction in service-life requirements due to funding constraints
Extending Retirement of the Existing Vehicle Types On the other hand most of the agencies cited negative impacts from extending the current FTA minimum service life These negative impacts include a decrease in quality of service (higher rate of failures aesthetic of vehicles reliability) and an increase in maintenance costs (between 10- to 50-percent higher) However the agencies did not predict significant increase or decrease in emissions and energy efficiency
Federal Transit Administration 44
Useful Life of Transit Buses and Vans Chapter 5 Final Report Industry Outreach
Table 5-5 Potential Transit Bus and Van Procurement Options
Category Length Approx
GVW Seated
Passengers Minimum Life Rehabilitation
Years Miles Years Comp Heavy-Duty Articulated Bus
55 - 70 ft
38000 - 48 - 60 12 500000 6 30 15 650000 610 50 18 750000 6 10 15 75
Heavy-Duty Large Bus 35 - 48 ft
33000 - 40000
27 - 40 10 450000 5 20 12 500000 6 30 15 650000 610 50 18 750000 6 10 15 75
Heavy-Duty Small Bus 20 - 30 ft
26000 - 33000
20 - 35 8 300000 4 10 10 350000 5 20 12 400000 6 30
Medium-Duty and Purpose-Built Bus
20 - 30 ft
16000 - 26000
22 - 30 7 200000 5 20 9 250000 6 30
Light-Duty Mid-Sized Bus 20 - 35 ft
10000 - 16000
16 - 25 5 100000 4 10 7 150000 5 20
Light-Duty Small Bus Cutaways and Modified
16 - 28 ft
6000 - 14000
8 - 20 4 100000 na 0 6 125000 4 10
The rehabilitation columns define the potential years of the rehab to account for components that cannot achieve the extended life and the likely of components that will need to be replaced during those rehabilitations
Vehicle Components
The survey also asked respondent agencies about the life expectancy of individual bus and van components and how these expectancies affect the decision to retire andor rebuild vehicles Unfortunately only three of the agencies responding to the survey provided detailed information on the life expectancy and costs of the requested list of vehicle components (see Appendix E) Given the small agency response rate this data was appended with manufacturer responses and other industry data to help guide the life-cycle cost analysis in Chapter 7
Cyclical Nature of Component Replacements However the data reported by those few agencies do clearly show that the expected life of major body components such as the structure and panels aligns closely with each agencyrsquos scheduled vehicle retirement age Similarly engine and transmissions have an expected life of approximately half or one-third of this retirement age which is roughly in line with the responses on mid-life and other scheduled overhauls When viewed in total the timing and cost of major vehicle component replacements are such that component replacement costs peak in cycles throughout the life of the vehicle with minor cost peaks occurring roughly every three years and major peaks every six years4 (The six-year peak corresponds closely to the drive train rebuild see Figure 7-6 in Chapter 7) As discussed in more detail in Chapter 7 these cost cycles help to define the logical retirement points throughout a vehiclersquos life Specifically an operator will only perform a major life-extending rehabilitation if the operator intends to operate the vehicle for an additional three to six years Otherwise the decision to undertake the life-extending rehab is not cost effective
4 The actual timing depends on average fleet mileages maintenance practices duty-cycles and other factors
Federal Transit Administration 45
Useful Life of Transit Buses and Vans Chapter 5 Final Report Industry Outreach
Component Determinants of Vehicle Useful Life When asked to consider which components drive or define the useful life of the vehicle as a whole several of the agencies identified the condition of structural members including the impact of corrosion as the key driver of total vehicle useful life Two agencies (Frederick and Montgomery) stated that specific or individual components are not the direct drivers on vehicle retirement decisions but the general conditions of the vehicle (maintainability reliability of components etc) Boston reported its retirement decisions are age-based and not component-based and also stated that components are not expected to last beyond 12 years
Besides structural members other components listed as important to the vehicle replacement decision include the electrical system suspension exterior and floors Conversely among the components listed as having no impact on retirement decisions include doors brakes windows and wheel chair lifts
Other Issues Impacting Useful Life
Survey respondents were also asked to consider issues suspected of having indirect impact on the useful life of buses and vans such as procurement policies and other federal regulations
Procurement Processes The agencies were asked to report the procurement process typically used and any effects this process has on the expected useful life of vehicles Most of the agencies reported using a best value request-for-proposal process based on price and other factors These agencies feel this process is better than low-bid as higher quality products are expected or can be negotiated
The transit agencies interviewed universally agreed that using a low-bid procurement approach negatively affected the bus useful life To mitigate this some agencies have taken a much more rigorous approach to specifying bus structure life requiring finite element analysis of the structure shaker table tests or strain gage testing in the agencyrsquos operating environment However even those agencies that did not detail bus structure requirements acknowledged that it was important to state minimum bus life requirements in their specification Agencies reported that low-bid procurements resulted in buses that were lower in quality and designed to just fulfill the minimum bus specifications used in that procurement In the interviews one agency noted that manufacturers have only two options to reduce their pricemdashone is to use lower costlower quality components and the other is lower paidless skilled labor in vehicle assembly With all of the North American bus manufacturers struggling financially agencies feel that manufacturers have adopted both approaches
All agencies agreed that the bus structure is the key determinant of bus life The other bus components and systems can be replaced as long as the main structure can continue in service Negotiated procurements instead of low bid can benefit an agency and get additional features such as stainless steel that are advantageous in extending the life of the structure However those agencies that are using a best-value negotiated procurement approach are not doing so primarily to extend bus useful life The main motivations for a negotiated procurement are to get the best mix of desirable features and highest reliability for the agency to reduce operating costs
Federal Transit Administration 46
Useful Life of Transit Buses and Vans Chapter 5 Final Report Industry Outreach
Buy America Regulations Agencies were also asked if Buy America regulations have affected the quality andor useful service life of vehicles Two of the agencies who responded to this question stated that these requirements do in fact have an impact specifically on how the limited market impedes the implementation of the latest design features or technologies Boston reported that the reduction of minimum life of heavy-duty vehicles to eight years would assist in fulfilling this provision differently while Austin reported that useful life is dependent on the procurement process of the agency WMATA staff also noted that this regulation can limitaffect how a manufacturer develops structure (the largest component manufactured abroad and hence budget constrained to meet the Buy America requirements) Given that structure is typically the largest component ultimately defining the total useful life of the vehicle a less expensive (lower quality) structure will result in a lower life expectancy vehicle This regulation does not directly affect three of the agencies (Toronto Frederick and Montgomery) while responses were not received from the remaining agency (New York)
Bus Testing Program Another indirect factor that may potentially affect the purchasing and retiring of vehicles is the Bus Testing Program conducted at Altoona PA Five of the respondent agencies reported using the bus testing results in the procurement process to establish performance requirements This included reviewing the testing results in writing specifications evaluating bids and discussing purchases with vendors However these agencies recommended that the actual test results would provide the agencies with more information to evaluate vehicles in the procurement process One respondent was fairly critical of the value of the testing program itself suggesting that competition between vendors is a more effective (and less expensive) means of ensuring product quality and longevity
ldquoWhite Bookrdquo Procurement Guidelines The survey also asked respondents about the influence of the ldquoWhite Bookrdquo procurement guidelines on vehicle durability and expected service life Five of the agencies agreed that the procurement guidelines should be adapted to include alternative service-life options to reflect differences in vehicle designs One agency noted the importance of recognizing the difference in the strain applied to urban heavy duty-cycle vehicles as compared to other service environments (10-year urban vs 15-year suburban) while another agency reported using more arduous specifications in its procurement than those in the guidelines The agencies were also asked whether they would consider the use of design specifications for a 10shyyear and a 15-year vehicle if retirement at those ages were allowed by FTA policy Table 5-6 summarizes the responses to these questions
Table 5-6 illustrates a split in whether agencies would consider the change in design specifications As expected those agencies that would find the 10-year bus design specification a positive change (Boston and Los Angeles) also have expressed difficulty in maintaining vehicles past the current 12-year minimum and support the shortening of minimum service life These two agencies are characterized as heavy metropolitan areas and as such tend to be more severe on vehicles In contrast agencies that would consider the 15-year and not the 10-year design specifications (Washington and Toronto which also have tough urban operating environments) already have policies in place to retire vehicles at that age and beyond
Federal Transit Administration 47
Useful Life of Transit Buses and Vans Chapter 5 Final Report Industry Outreach
Table 5-6 Design Specifications of 10- and 15-year bus
Vehicle Category Number of Agencies Notes
Would you consider the use of design specifications for a 10-year bus Yes 2 If the bus components remained at 12-years
Do not necessarily agree funding should be tied with age No 2 Board policy does not allow lower minimum age
Maybe 1 No answer provided 4
Would you consider the use of design specifications for a 15-year bus Yes 3 Already used by agency
Work on specifications for longer-life bus needed No 3 Too long would not hold up in urban environment
No answer provided 3
The respondentsrsquo lack of experience with lighter-duty vehicles limited the review of whether agencies would consider different service-life options for medium and light-duty buses and vans Only two agencies responded to this survey question Austin stated that the market for light-duty vehicles is as it should be while Boston would like to see a change in service-life options for smaller vehicles Jefferson County one of the few respondents with a good understanding of light-duty vehicle characteristics already uses more stringent retirement ages for the smaller vehicle types including a target retirement age of 9 for ldquo7-yearrdquo vehicles a target retirement age of 8 for ldquo5-yearrdquo vehicles and a target retirement age of 5 for ldquo4-yearrdquo vehicles
Used Bus Disposal Under current regulations operators are required to compensate the federal government if a transit bus is retired and sold prior to meeting the FTA retirement minimum After that point in time the operator can retire the vehicle and sell it either as a used vehicle or for scrap value If the book value of a bus being sold is more than $5000 then FTA requires the agency to reimburse them (in practice the amount of the reimbursement is subtracted from the agencies next available FTA funding certification for the purchase of new buses)
Most agencies reported selling their used vehicles in bulk for their salvage value with the sale price based on the quantity and the condition of the vehicles sold and with scrap value ranging from roughly $3000 to just $50 per bus If the bus is in good shape upon retirement agency maintenance staff will typically scavenge the functioning parts and the bus will be left in poor condition to be sold for less than $500 In some cases the retired vehicles are sold either to other transit operators or to non-transit entities Agencies indicated that these sale prices are typically in the low thousands Regardless of how the vehicles are disposed the funds obtained from bus sales or salvage represent only a small fraction of the original purchase price and the funds received from these sales are generally deposited in the agencyrsquos general fund (and hence not used specifically for the purchase of new vehicles) Agencies reported that given the low dollar amounts involved sale and salvage value funds do not play any role in agenciesrsquo vehicle retirement decisions
Federal Transit Administration 48
Useful Life of Transit Buses and Vans Chapter 5 Final Report Industry Outreach
Other Procurement Issues
The last section of the survey asked respondents to reiterate any difficulties in the procurement of vehicles and in maintaining them past their minimum service life As previously reported most agencies have had to retire vehicles prior to their scheduled retirement age These vehicles were reported to have high maintenance costs and the most common way to deal with them was to lighten their duty cycle while two of the agencies reported retiring vehicles due to outdated components
Interest in a ldquoLemon Lawrdquo Respondents were asked whether they would be interested in the creation of ldquolemon lawrdquo providing agencies with an opportunity to retire problem vehicles prior to meeting the service-life minimums without financial penalty The question did not specify how that option would be structured or what standards would be applied in identifying a ldquolemonrdquo vehicle With the exception of New York who did not respond to this question all of the agencies agreed that a potential ldquoLemon Lawrdquo consideration within the FTA service-life policy is a very desirable option However the agencies expressed concern over the enforcement of such options the performance measures used to justify early retirement (the suggestion was that these should be established based on a vehiclersquos performance industry-wide not within a single agency) and the quality aspects from the manufacturersrsquo and suppliersrsquo side Table 5-7 summarizes the individual agenciesrsquo responses
Table 5-7 Responses to Exceptions to FTA Guidelines
Agency Consideration and Potential Constraints to ldquoLemon Lawrdquo
FTA Demonstration Program or Waiver Aspect
Washington Good though difficult to enforce Should be industry-wide finding of poor performance (not just agency with poor procurement) Agency to decide optimum retirement Ensure funding of remaining years is rolled
Good help industry move forward and introduce new technologies
Toronto Yes as corrosion and structural problems made it difficult to maintain vehicles to 12 years
Procurement of lease of prototypes of buses from different manufacturers to test before selection
Montgomery Good idea (No response given) Boston Yes with constraint that manufacturers ensure integrity
and durability (maintain quality with minimal maintenance) No interest in program
Los Angeles Yes if necessary Option should not be used if normal warranty period is complete andor operating cost is substantially different from rest of agencyrsquos fleet
Yes
Frederick Yes with conditions of applicability defined Suggest option only to limited and serious conditions
Not applicable as a smaller agency with limited staff and capabilities
Austin Yes if dealt with bus supplier Yes Jefferson Yes good idea Not helpful for smaller agencies
Federal Transit Administration 49
Useful Life of Transit Buses and Vans Chapter 5 Final Report Industry Outreach
Useful Life Waiver for New Technology Demonstration Programs Table 5-7 also summarizes the agenciesrsquo responses regarding interest in and proposals of an FTA demonstration program or waiver aspect to test alternatives concerning service-life requirements The objective would be for FTA to help encourage agencies to test and adopt new technology vehicles with the guarantee that the agency can retire test vehicles before the service-life minimums have been met if the technology proves problematic
Summary Agency Outreach
It is important to note that a survey of nine agencies is not a statistically representative sample however the surveyed agencies provide valuable insight on the effects of and recommendations to the current FTA service-life policy Due to the limited sample size the initial findings presented in this section can be strengthened with further investigation
Of the nine agencies responding to the survey seven have a policy on minimum retirement life not imposed by FTA This policy is imposed by either the state or the agency itself and is typically more stringent than the current FTA minimum of 12 years for heavy-duty larger buses Moreover all of the respondent agencies are retiring their vehicles one to five years past the FTA retirement minimums and one to three years past their own agency-imposed (typically more stringent) retirement minimums Retirements past the planned retirement age have mainly been driven by the limited availability of capital funding while early retirements have been caused by high maintenance costs or equipment update It is important to note that these high maintenance needs are primarily linked to agencies with heavy to severe duty cycles in large metropolitan areas such as Boston New York and Los Angeles
Agencies recognize the importance of maintenance and overhauls specifically mid-life in order to reach and keep vehicles past their scheduled retirement age However the timing and extent of these maintenance needs are also limited by the availability of capital funding Moreover major mid-life life-extending overhauls are only performed by a relatively small number of the nationrsquos largest transit operators
Given these observations it is clear that the current FTA retirement minimums are not constraining the retirement decisions of most transit operators Indeed the retirement ages for the majority of the vehicle retirements documented by this study would not be altered by modest changes (eg plusmn one year) to the current FTA minimums In fact several retirement decisions may not be impacted by the removal of the FTA minimums Key exceptions here are New York and Boston New York actually changed its policy to not purchase vehicles with federal funds after having to retire vehicles early and reimburse FTA part of the purchase price Boston would prefer an eight-year minimum retirement to maintain higher quality and avoid the major capital expense of a mid-life overhaul With these exceptions the greatest impact of the current retirement minimums occurs when operators find themselves with problem vehicles struggling to meet the FTA minimums In these instances agencies are forced to absorb the cost of maintaining the vehicles place these vehicles on reduced service requirements andor seek FTA approval for early retirement
Federal Transit Administration 50
Useful Life of Transit Buses and Vans Chapter 5 Final Report Industry Outreach
Despite these observations many of the agencies recommended several changes to the current FTA policy such as the potential inclusion of rehabilitation costs as a reimbursable cost and the provision of flexibilityoptions to agencies in vehicle retirement Agencies also expressed interest in the potential introduction of a ldquoLemon Lawrdquo allowing early retirement of problem vehicles without financial penalty Interest in lowering the minimum retirement age was only considered desirable by some agencies as long as the quality of the vehicle is unchanged (ie not reduced to a less durable less expensive vehicle) The benefits of this change would include the reduction in maintenance costs and the ability to implement and keep up with the latest vehicle technologies On the other hand extending the minimum retirement age was not considered desirable to agencies expressing concerns over the expected decrease in quality of service to passengers and the increase in maintenance costs
Vehicle Manufacturer Response
The research team developed an interview guide to assess the current experience of vehicle manufacturers with the FTA service-life requirements Questions covered areas such as the effects of FTA requirements and regulations customer (transit operator) useful life expectations and life expectancy of vehicle components While a total of nine different North American vehicle manufacturers were contacted for this study only three manufacturers provided responses and completed the interview guide Table 5-8 lists these three vehicle manufacturers and the title of the key contact for their organization
Table 5-8 List of Vehicle Manufacturer Respondents
Bus Manufacturer Contact Title Interview Guide
Response Received and Completed
Orion Director of Engineering Yes Optima Bus Corp Marketing and Sales Manager Yes Millenium Transit President Yes
This section synthesizes the responses received in a narrative or tabular format Not all of the vehicle manufacturers responded to every question A complete summary of all vehicle manufacturer responses to the interview guide is provided in Appendix B
General Vehicle Useful-Life Expectations
The three vehicle manufacturers that responded to the interview guide surveyed currently manufacture different models of heavy-duty vehicles with lengths of 30 to 40 feet and capacities ranging from 23 to 47 passengers Although one of the manufacturers did not provide a detailed listing of its vehicle offerings all of the manufacturers are in the heavy-duty 12-year minimum vehicle market Both of the manufacturers reporting details of their current models stated a minimum life of 12 years although Orion reports its vehicles have a life expectancy of 18 years while Optima reports its vehicles have a life expectancy of 12 years All three manufacturers market their vehicles based on FTA service-life categories
Federal Transit Administration 51
Useful Life of Transit Buses and Vans Chapter 5 Final Report Industry Outreach
The manufacturers sell vehicles that are not subject to the Bus Testing Regulation such as Orionrsquos Sprinter van which is typically purchased by smaller agencies with local money The other two manufacturers did not detail specific vehicle models but Millennium reported that buses sold in Canada (although the same bus) are not subject to these regulations and Optima has been granted a waiver for additional testing on one of its current models
With regard to expected service life characteristics requested by their customers Orion Bus Industries is the only manufacturer to report specific requirement characteristicsmdashCanadian operators look for 18-year service life vehicles with longer warranty periods and extensive resistance to corrosion for those operators in the Eastern part of Canada where vehicles are affected by the high-salt environment The other two manufacturers stated simply that agencies are looking for durable vehicles that will last and exceed the minimum retirement ages However these manufacturers report that the vehicle retirement age is largely dependent on each individual agencyrsquos annual mileage operating environment (severity) agency maintenance practices and quality of service standards
This opinion regarding the impacts of operating environment and duty cycle on the conditionlife of vehicles is also reflected in the manufacturersrsquo responses to recommending a mid-life overhaul Two of the manufacturers reported that they could not recommend specific mid-life overhauls because the vehiclersquos conditions and the need for a mid-life overhaul depend on each operatorrsquos specific annual mileage environmentduty-cycle and maintenance practices The other manufacturer reported neither recommending nor participating in fleet rehabilitations as these activities offer no benefits to their business Among the components listed as typically needing replacement are the engine transmissions suspensions and axle Optima is the only manufacturer that reported providing a recommended component maintenancereplacement schedule which is included in this report as Appendix D This manufacturer also reported that the approximate cost of replacement of those four components listed above is $18000 per vehicle
FTA Minimum Service-Life Requirements
All of the manufacturers stated that they are impacted by the FTArsquos current minimum retirement ages and that the 12-year minimum age is a benchmark in this heavy-duty market Design specifications are driven by the demand of vehicles that will last up to and beyond this 12shyyear500000-mile benchmark such as the use of stainless steel or aluminum instead of mild steel to meet the corrosion requirements (as reported by Millennium) The manufacturers also structure their marketing strategies around this minimum retirement age (ie clearly stating the minimum life standard their vehicles have been tested to meet) which they believe affects the overall demand for their vehicles the relationship with their customers and the sales of vehicle parts One manufacturer specifically stated that a change in the 12-year minimum would directly impact its demand for vehicles and its competing markets (heavy-duty vs light-duty market)
The argument that reductions in FTArsquos minimum life requirements would directly result in accelerated vehicle sales and hence a significantly deeper more sustainable bus market should be tempered by the understanding that very few operators retire their vehicles right at the service-life minimums due to funding limitations (as shown in Chapter 4 and the preceding section of
Federal Transit Administration 52
Useful Life of Transit Buses and Vans Chapter 5 Final Report Industry Outreach
this chapter) To be clear a reduction in the FTA minimums would yield some additional sales at the margin but the increases would not be significant as most operators do not retire their vehicles until two or more years after the 12-year minimum has been reached In contrast increases to the service-life minimums by two or more years would likely result in a perceptible decrease to annual vehicle sales (see Figure 4-1)
The primary vehicle component listed by all of the manufacturers as being impacted by the FTA requirements is the structure andor chassis which is expected to last the 12 years without major failures as it cannot be rebuilt or replaced Other components listed include the engine body axles suspension and transmission However these were not considered significant to the life of the structurechassis in determining vehicle useful life
As previously noted the only market of customers requesting vehicles with expected life values different than FTA minimums is the Canadian market where vehicles are specified for 18-year service life Orion also reported that some of its customers ask for a 15-year design life for the chassis or other components such as CNG tanks with a service life of 15 to 20 years
The survey also asked manufacturers about recommendations or changes to the current FTA minimum ages None of the manufacturers provided or recommended specific changes and in fact Millennium reiterated that any changes to these minimums would have negative impacts to its current market However two of the manufacturers (Orion and Optima) stated that the FTA minimum retirement ages are arbitrary because they are driven by the FTA Altoona Bus Testing classifications and manufacturers are able to choose the category under which to test their bus Thus there is the potential of buses claiming a false durability of 12 years Recommendations in this area would include revising regulations to a less arbitrary more objective intense testing and providing more detailed reports of the testing results (passfail failure types etc)
Vehicle Life Classification
Another section of the survey reviewed the current FTA classifications by vehicle type and intended duty cycle as they relate to the FTA minimum retirement ages and examined the potential of other alternatives With regard to the appropriateness of the current FTA classifications Orion stated that this classification conflicts with EPA definitions and that the categories are not definite enough (weight classes are too loose) Optima reiterated that the minimum retirement ages are based on the FTA Altoona Bus Testing requirements which make vehicle classification arbitrary as manufacturers choose the category to test under and vehicles receive this classification regardless of length of time to complete or how it holds up In Optimarsquos opinion manufacturers can test buses at the highest possible classification to give them a marketing edge in spite of the testing results on quality or durability In short the manufacturers generally had few concerns with the current categories but some manufacturers had significant concerns with how those categories are applied in practice particularly in relation to the bus testing program
Vehicle manufacturers were also asked their opinion on potential longer-life and shorter-life vehicle options Table 5-9 summarizes their responses Two of the three manufacturers (Millennium and Optima) do not believe a longer-life more durable vehicle can be manufactured
Federal Transit Administration 53
Useful Life of Transit Buses and Vans Chapter 5 Final Report Industry Outreach
because more durable components cannot be produced If such a vehicle were manufactured it would be heavier (increased GVW) more expensive and likely less economical (fuel efficiency purchase price) The option of a less durable less expensive vehicle also received differing interest although the main characteristic and challenge to manufacturing this type of vehicle would be the decrease in component quality (ie having to rely on lower-cost components) One manufacturer expressed concerns about the feasibility of manufacturing a safe shorter life vehicle option that was ldquocost-neutralrdquo (as compared to existing 12-year models) The concern being that the required reductions in structural cost to make the vehicle cost competitive may also lead to structural issues Optima stated that another vehicle option for FTA to consider is the new hybrid electric vehicle with diesel or gasoline engines powering electric motors
Table 5-9 Opinions on Alternative Set of Vehicle Life Spans
Vehicle Life Orion Millennium Optima Longer-life more durable vehicle
Interest characteristics of
vehicle
Yes ndash would have to be more resistant to corrosion and heavier
No ndash already build most durable buses out there
No ndash components would not survive longer life duty cycle also important in affecting retirement
Challenges Encouraging modular design Rebuild cycles would affect supply of parts
Supporting technologies for long periods of times
Cannot increase life expectancy of components Higher price vehicles
Shorter-life less durable vehicles Interest
characteristics of vehicle
Yes (cater to different needs of transit operators) ndash lighter weight lower-cost components
No ndash eliminating options low-cost components
Not part of market niche
Challenges Establishing market Getting cost reductions from components not structure
Not part of market niche
Vehicle Components
This section of the survey summarized the manufacturersrsquo experience with individual components and their relationship to the expected service life of vehicles All of the manufacturers agreed that the life expectancy and maintainability of vehicle components affect the service life and vehicle retirement decision with the main component being the structure andor chassis As previously reported manufacturers expect these components to endure without major failures in order for vehicles to reach the FTA minimum retirement ages Millennium also listed the engine transmission and axles as vehicle components that also impact service life On the other hand vehicle components not affecting service life included seats radios fare boxes glasswindows and other destination announcement systems However two of the manufacturers listed that the life expectancy of engines and brakes are driven by other markets besides the bus industry
Federal Transit Administration 54
Useful Life of Transit Buses and Vans Chapter 5 Final Report Industry Outreach
Table 5-10 summarizes the design challenges to vehicle components reported by the manufacturers in the construction of vehicles with increased life expectancy and of vehicles with decreased life expectancy
As expected the responses from this section are in line with those reported in previous sections of the survey on the overall life expectancy of vehicles The FTA minimums impact the design specifications of vehicles especially the structure andor chassis which is a primary driver of retirement decisions because it cannot be economically rebuilt or replaced The manufacturing of longer-life vehicles is limited by the life expectancy of components as they are currently not built to last longer or have replacementmaintenance schedules in line with the expected life of the vehicle Conversely manufacturing shorter-life vehicles would involve lower-cost lighter-duty components (such as those in the truck and automotive industry)
Table 5-10 Component Challenges to Vehicle Options
Component Challenges Orion Millennium Optima
Longer-life vehicle No challenges ndash 18-year bus already built
Warranty on engines and batteries remains unchanged
Obsolescence of parts Affected components chassis engines transmissions electronic systems HVAC systems and others
Shorter-life vehicle Take out cost with reduced service life smaller engines lighter axles
Lighter-duty components mild steel structure
Downgrade of design need for change in industry mindset for lower-life vehicles
Summary Vehicle Manufacturers
It is important to note that the three vehicle manufacturers surveyed are not a statistically representative sample however they do provide valuable insight on the effects of and recommendations to the current FTA policy on useful life of buses and vans Due to the limited sample size the findings presented in this section could be strengthened with further investigation
The general observation is that vehicle manufacturers have built their manufacturing practices and marketing strategies around the current FTA minimum retirement ages specifically the use of the 12-year minimum retirement age as a benchmark in the heavy-duty vehicle market
These manufacturers tend to design vehicles with a structurechassis expected to last and exceed the 12-year minimum without major failures and with the expectation that other components such as the engine transmission and axle follow good maintenance practices to reach these minimum retirement ages The manufacturers also recognize that the needs of operators differ (18-year minimum in Canada higher corrosion rate etc) and that the operating environment and duty cycle play an important role in the vehiclersquos retirement age
Federal Transit Administration 55
Useful Life of Transit Buses and Vans Chapter 5 Final Report Industry Outreach
Changes to the current FTA minimums and classifications are closely tied to the life expectancy of vehicle components Longer-life vehicles would require more durable components which at this time are not available by component manufacturers and shorter-life vehicles would entail the use of lower-cost perhaps lower-quality components with lower durability expectations
Private Operators Response
The research team developed an interview guide to assess the current experience of private operators with vehicle retirement ages and the FTA service-life guidelines Questions covered areas such as factors in retirement decisions experience with customers (transit operators) and life expectancy of vehicle components Table 5-11 provides the list of private operators and the title of the key staff contacted
Paul Revere Transportation Company provides charters sedan service and shuttle service throughout the New England area Notably it currently has contracts with
bull Massachusetts Port Authority (MassPORT) to operate the Boston Logan Airport shuttle buses which provide service through the airport (terminals satellite parking and public transportation stations)
bull Massachusetts Bay Transportation Authority (MBTA) as the private bus carrier of Route 712 and 713 in the Winthrop area
bull Medical Academic and Scientific Community Organization Inc providing shuttle service between several medical and scientific-research-related locations throughout the Boston area
Table 5-11 List of Private Operators Contacted and Respondents
Private Operator Contact Title Response to
Interview Guide Received and
Completed
Paul Revere Transportation Company LLC
Director of Operations Director of Maintenance Yes
Abersquos Transportation Operations Manager Yes Hertz Rent-a-Car Director Operationrsquos Technology Yes
Abersquos Transportation provides charter limousine and sedan service and shuttle buses throughout the Washington metropolitan area including airport transportation sightseeing tours and company contracts (service to and from office locations and Metro stations) Hertz provides several rental services including rental-car services at airport locations where it operates vans and shuttle buses between terminals and at locations on the outskirts of the airport
This section synthesizes the responses received in a narrative or tabular format Not all of the private operators responded to every question
Federal Transit Administration 56
Useful Life of Transit Buses and Vans Chapter 5 Final Report Industry Outreach
Fleet Characteristics
The three private operators surveyed operate a variety of vehicle types in terms of manufacturer size and capacity and duty cycle As a sample set Abersquos Transportation operates Ford cutaways Paul Revere operates a number of Neoplan CNGs Neoplan Diesels and MCII Diesels and Hertz operates different sizes of Gillig low-floor clean-burning diesels
All operators stated performing regular maintenance on their fleets Table 5-12 summarizes specific maintenance tasks provided by operators
Table 5-12 Regular Maintenance Schedule
Private Operator Maintenance Notes Paul Revere Transportation Company LLC
bull Heavy-duty buses are inspected after 12000 miles
bull Light-duty buses are inspected at 3000 to 4000 miles
bull Exterior and applied panels replaced as necessary (typically 4 to 5 years)
Maintain minimummaximum spare parts in stock based on experience
Abersquos Transportation bull Oil change every 3000 miles (manufacturerrsquos recommendation)
bull Front brake pads changed every 10000 rear brake pads changed every 17000 miles (longer for larger 7-year vehicles)
bull Front tires changed every 10000 miles rear tires changed every 12000 miles
bull Transmission fluids changed every 50000 miles
bull Ford 60 - Warranty of 36000 miles on transmission 100000 miles on engine
bull International 3500 ndash Warranty of 150000 miles on transmission and engine
bull Inspection on all vehicles when washed (1 to 2 timesweek)
Hertz Rent-a-Car Preventive maintenance performed regularly ndash initially according to manufacturerrsquos recommendation but now adjusted based on historical data
Comprehensive maintenance program Maintenance performed by in-house mechanics
Vehicle Retirement
The private operators were asked to provide information on the expected useful life of their vehicles as well as the drivers behind the retirement decision In general the operators stated an expected vehicle life based on the manufacturerrsquos recommendation with the options to extend it through transfers to lower-frequency routes or rehabilitation programs
Paul Revere Transportation provided the following detailed information on the scheduled life and rehabilitation of most of its fleet vehicles
bull 40-foot Neoplan CNG Scheduled life of 12 years with an engine rehabilitation at 75 years
bull Medium-duty Passenger Vans Scheduled life of 115000 miles (approximately four to five years)
Federal Transit Administration 57
Useful Life of Transit Buses and Vans Chapter 5 Final Report Industry Outreach
bull 35-foot RTS Diesel Scheduled life of five to six years
bull MCII Diesel Scheduled life of 700000 miles
Paul Revere Transportation also stated that structural rehabilitation andor bodywork on its 40shyfoot Neoplan CNGs would be performed if the vehicle has a minimum of 12 years and is planned for use after end of contract for other tasks This operator also stated inspection work is performed on its passenger vans every 5000 miles due to the large impact from weather
Abersquos Transportation noted that its smaller cutaways are typically operated on main routes for three years although it would transfer these vehicles to low-frequency routes after the three-year mark if their conditions remained acceptable The goal is to keep the larger cutaways for six years although the vehicles continue operations for an additional year if they remain in excellent conditions The vehicles do not undergo any overhauls and are traded in after retirement
Hertz indicated an expected useful life of 12 years based on the bus manufacturersrsquo design to the federal regulation Hertz also stated performing one overhaul on the transmission andor motor in order to extend the vehiclesrsquo life beyond design life The cost of this overhaul is approximately $20000 to $30000
All of the operators stated vehicle maintenance requirements as one of the main factors behind the decision to retire vehicles Table 5-13 summarizes the other factors in retiring vehicles reported by each operator
Table 5-13 Retirement Factors
Private Operator Key Factors in Retirement Paul Revere Transportation Company LLC
bull Age of vehicle ndash Contracts with customers are often aligned with expected useful life (contract length equal to full or half of the expected life)
bull Physical condition and quality of service bull Duty cycle bull Vehicle maintenance requirements
Abersquos Transportation bull Increase in required maintenance cost bull Physical condition of vehicles (customer comfort)
Hertz Rent-a-Car bull Perform a return-on-investment analysis of life-cycle costs to trade-off rising maintenance costs as vehicles get older and the purchasing options of new vehicles
bull Operating conditions (frequency)
Purchase Considerations
The private operators were also asked to provide information on their vehicle procurement process and vehicle purchasing decisions As expected none of the three operators surveyed use a low-bid process and they are mainly focused on customer service and reliability All of the operators stated they are willing to pay more for the best technology available for example luxury models better fuel economy computer-aided dispatch or vehicle location electronics
Federal Transit Administration 58
Useful Life of Transit Buses and Vans Chapter 5 Final Report Industry Outreach
Paul Revere Transportation is the only operator surveyed that provides service under a contract with a transit agency As such this operator stated that it considers meeting FTA specifications and testing requirements for reliability when purchasing vehicles Paul Revere also based the length of its contract with these agencies on the expected life of the vehicles For example one of its current contracts with MASCO is for six years for which it operates a 12-year bus In this case the firm will not include the purchase of new vehicles in its expected re-bid
Summary Private Operators
It is important to note that the three private operators surveyed are not a statistically representative sample Due to the limited sample size the initial findings presented in this section can be strengthened with further investigation
Overall the private operators are not affected by the FTA service-life policy and evaluate the useful life of a vehicle based on the manufacturerrsquos recommendation vehicle physical condition and maintenance requirements These private operators also apply regular maintenance practices on their vehicles with rehabilitations andor overhauls of the larger-size vehicles planned at near the vehiclersquos mid-life age
The main factor for retiring vehicles for these operators is the increased cost in required maintenance and the level of service to customer (comfort and reliability) None of the operators use a low-bid procurement process when purchasing vehicles They consider the higher costs to purchase vehicles with the latest technologies in fuel use emissions andor vehicle location to provide a higher level of customer service
Federal Transit Administration 59
Useful Life of Transit Buses and Vans Chapter 6 Final Report Engineering Analysis
CHAPTER 6 ENGINEERING ANALYSIS
This chapter provides further evaluation of bus useful life from a bus engineering perspective To a large extent this section represents a continuation of the agency outreach analysis from the previous chapter as it is primarily based on the results of both the original agency interviews (see Appendix A) as well as the findings from the second round of agency interviews this time more closely focused on vehicle engineering-related issues (see Appendix C) A key objective of this section is to highlight the fact that bus useful life is largely determined by the useful life of the vehicle structure The chapter is also intended to provide an assessment of how transit agencies expect differences in service environment and vehicle characteristics (such as new vehicle designs propulsion systems and advanced technologies) to impact vehicle useful life In most cases transit agency interview participants have reported that while they have reason to expect some new technologies and vehicle designs may have minor impacts on expected useful life most of these new designs and technologies have not been utilized for a sufficient period of time to observe any material impact on actual service life
Transit Agency Participants ndash Follow-Up Interviews
Much of the analysis in this section of the report is supported by both the results of the initial agency interviews (as considered in the previous chapter) as well as the results of follow-up interviews completed with a slightly different sample of transit operators (to ensure broader representation for the study) but also with some of the same operators as in the initial sample (because of their familiarity with topics of specific interest such as CNG buses) The specific sample of seven transit operators included in the follow-up interviews is presented in Table 6-1 In contrast to the initial interviews which included agency staff with differing backgrounds (eg bus operations directors general managers and vehicle engineering staff) the follow-up interviews were directed specifically towards agency bus engineering staff The intention of these follow-up interviews was to obtain a more in-depth perspective on engineering issues with useful life implications (eg the adoption of new technologies)
Table 6-1 Agencies Responding to Detailed Interview Guide Operator Type Fleet Size
(2005 NTD) Harris County Metro Houston TX Major Urban 1400 Buses 229 Vans LA MTA Los Angeles CA Major Urban 2815 Buses MUNI San Francisco CA Major Urban 894 Buses WMATA Washington DC Major Urban 1467 Buses 378 Vans CATS Charlotte NC Medium Urban 321 Buses 170 Vans Lane Transit District Medium Urban 147 Buses 92 Vans Golden Gate Transit San Francisco CA Suburban 321 Buses 46 Vans
Federal Transit Administration 60
Useful Life of Transit Buses and Vans Chapter 6 Final Report Engineering Analysis
Useful Life of Transit Vehicle Chassis and Components
This section reviews the useful life characteristics of bus and van structures and components Rather than single unified objects buses and vans represent assemblies of numerous components Hence the useful life properties of the vehicle as a whole are likewise determined by the components from which the vehicle is constructed This last statement is true from two differing perspectives First the life-cycle cost characteristics of transit vehicles are determined by the life-cycle costs of the components from which the vehicle is constructed As shown in the next chapter the overlap of these componentsrsquo life cycles (some of which last the full life of the vehicle and others which are replaced one or more times over the life of the vehicle) can be used to determine the financially optimal point of retirement Second from an engineering perspective vehicle useful life is ultimately determined by those components with the longest overall life and primarily the chassis and structure to which all other components are attached
The following sub-sections consider the useful life characteristics of the primary components of bus and van types within each of the five FTA service-life categories
StructureChassis
Four- and Five-Year Vehicles Small buses are built on van and cutaway van chassis mass-produced by light-duty automotive manufacturers The chassis are made from two C-channel frame rails attached by a series of steel cross-members The chassis supports all major components including the suspension axle brakes wheels tires engine transmission fuel system and electrical system Van bodies and cabs are mounted to the frame rails with bolts and rubber isolators The vanchassis are designed to last the full service life of the vehicle (ie 4 or 5 years) and are not overhauled The cost of the vanchassis ranges between $20000 and $30000
Seven-Year Vehicles Vehicles within the 7-year service-life category include buses and trolleybus built on cab and stripped chassis The chassis are mass-produced by heavy truck manufacturers The chassis are made from two C-channel frame rails attached by a series of steel cross-members The chassis supports all major components including the suspension axle brakes wheels tires engine transmission fuel system and electrical system Passenger bodies and cabs are mounted to the frame rails with bolts and rubber isolators The chassis are designed to last the full 7-year service life and are not overhauled The cost of the vanchassis ranges between $30000 and $40000
Ten- and Twelve-Year Buses Heavy-duty small and large buses are built on custom designed or stripped chassis The chassis designs include integral structure chassis unit body monocoque or semi-monocoque chassis and some body-on-frame construction types depending on the manufacturer The chassis are made of mild or stainless steel and aluminum alloy from welded tube sections andor stamped structural panels The chassis supports all major components including the suspension axle brakes wheels
Federal Transit Administration 61
Useful Life of Transit Buses and Vans Chapter 6 Final Report Engineering Analysis
and tires engine and transmission fuel system HVAC and electrical system The chassis of a body-on-frame design (10-year buses) are not overhauled but may be repaired during the life of the vehicle The custom designed chassis are designed to last the full 12-year service life and are overhauledrepaired as necessary The cost of a typical midlife overhaul of the heavy-duty custom chassis ranges from $7000 to $14000
Table 6-2 StructureChassis Characteristics
Component 4- and 5-Year Vans and Buses 7-Year Bus 10-Year Bus 12-Year Bus
Structure Chassis
Type Van and van cutaway
Cab and stripped chassis
Body on frame construction
Integrated structure chassis unit body monocoque or
semi-monocoque chassis
Useful Life At least 4 to 5 years At least 7 years or 200000 miles
At least 10 years or 350000 miles
At least 12 years or 500000 miles
Rehabilitated No No No Yes Many agencies do not perform a scheduled rehab but will repair as needed
Body
Four- Five- and Seven-Year Vehicles The 4- and 5-year small bus bodies are mounted to cutaway van chassis and designed and built by a second-stage manufacturer The 7-year medium-duty bodies are mounted to a cab and stripped chassis and are also designed and built by a second-stage manufacturer A second-stage manufacturer is a manufacturer that receives an incomplete rolling chassis or van and adds necessary components that complete the vehicle and ready it for its intended market The bodies built for small and medium-duty buses are designed specifically for the transit and shuttle bus markets and feature transit style windows destination sign wheelchair lift and a separate passenger compartment air conditioning system The bodies are constructed from steel tubes and use either fiberglass or metal for the exterior skin The 4- and 5-year small bus bodies are attached to the cutaway van chassis and integrated with the driverrsquos cab The 7-year medium duty bodies are attached to the cab and stripped chassis and integrated with the operatorrsquos cab The cab houses the dashboard driver interfaces and driverrsquos seats The bodies for each of these vehicle categories are designed to last the full service life of the vehicle (ie 4 5 and 7 years respectively)
Ten- and Twelve Year Vehicles The bodies of 10-year heavy-duty small transit buses are built by two methodsmdasheither as an integral part of the chassis structure or as a separate body mounted on a chassis The bodies of heavy-duty 12-year transit buses are an integral part of the chassis structure The bodies of both vehicle categories are constructed from steel tubes or panels and use either fiberglass or metal for its exterior skin which may or may not be a stressed structural element of the design (ie add structural support to the vehicle) As the body of the heavy-duty buses is typically an integral part of the chassis it is designed to last the full service life of the vehicle with repairs and overhauls as necessary The cost of a typical midlife overhaul of the body is $14000
Federal Transit Administration 62
Useful Life of Transit Buses and Vans Chapter 6 Final Report Engineering Analysis
Table 6-3 Body Characteristics
Component 4- and 5-Year Vans and Buses 7-Year Bus 10-Year Bus 12-Year Bus
Body
Type Mounted to cutaway van chassis
Attached to the cab and stripped chassis
Either integrated with chassis or separate and
bolted to the chassis Integral part of the
chassis
Useful Life At least 4 to 5 years At least 7 years 200000 miles
At least 10 years 350000 miles
At least 12 years 500000 miles
Rehabilitated No As needed Yes Yes Many agencies do not perform a scheduled rehab but will repair as needed
Interior
Four- Five- and Seven-Year Vehicles The interior of 4- and 5-year small bus bodies and 7-year medium-duty bus bodies use plywood for the floors covered with a rubber flooring material Interior walls and headliner are covered with lightweight paneling which is finished off with vinyl or carpeting Small and medium-duty buses use fabric-covered seats that mount to the floor structure Transit authorities typically do not refurbish the interior of small or medium-duty buses but replace worn components on an as-needed basis
Ten- and Twelve-Year Vehicles The interiors of 10- and 12-year heavy-duty transit buses use plywood for the floors covered with a rubber flooring material Interior walls and headliner are covered with lightweight paneling which is finished with vinyl or carpeting Heavy-duty transit buses use fabric-covered solid plastic or stainless steel seats that mount to the sidewalls andor floor structure Transit authorities typically do not refurbish the interior of 10-year heavy-duty buses but replace worn components on an as-needed basis For 12-year vehicles operators typically spend roughly $13000 over the life of the vehicle on interior replacements (either as a comprehensive overhaul or on an as-needed basis)
Table 6-4 Interior Characteristics
Component 4- and 5-Year Vans and Buses 7-Year Bus 10-Year Bus 12-Year Bus
Interior
Type Plywood flooring w
carpeting light weight vinyl paneling
fabric seats
Plywood flooring w rubber covering light weight vinyl paneling
fabric seats
Plywood flooring w rubber covering light weight vinyl paneling fabric or solid plastic
seats
Plywood flooring w rubber covering light weight vinyl paneling fabric or solid plastic
seats Useful Life At least 4 to 5 years At least 7 years 7 to 10 years 7 to 10 years Rehabilitated As needed As needed As needed Yes
Many agencies do not perform a scheduled rehab but will repair as needed
Federal Transit Administration 63
Useful Life of Transit Buses and Vans Chapter 6 Final Report Engineering Analysis
Interior Climate Control
Typical heavy-duty 10- and 12-year vehicles and many 7-year vehicles have heating ventilation and air conditioning (HVAC) units that are mounted on the rear of the bus or the roof The units range in size from 80000 to 115000 btu HVAC system are typically repaired or replaced as needed during the life of the 10-year vehicles HVAC system are typically overhauled during midlife rehabilitations of 12-year heavy-duty transit buses while systems for 7- and 10-year vehicles typically last the service life of the vehicle The cost for overhauling the HVAC units including interior vents and panels is approximately $10000 In contrast most 4- and many 5shyyear vehicles have heating and cooling systems that are integrated with the body (as in private vehicles) and last the full service life of the vehicle
Table 6-5 Climate Control Characteristics
Component 4- and 5-Year Vans and Buses 7-Year Bus 10-Year Bus 12-Year Bus
Interior Type Body integrated Roof Mounted Roof Mounted Roof Mounted Useful Life Life of Vehicle Life of Vehicle 6 to 7 years 6 to 7 years Rehabilitated No No Sometimes Yes
Many agencies do not perform a scheduled rehab but will repair as needed
Electrical Systems
Many heavy-duty 10- and 12-year transit vehicle manufacturers use Programmable Logic Control (PLC) technologies which allow for multiplexing Multiplexing systems use a single wire databus for communication among major components in a bus The use of a single wire reduces the number of dedicated wires and relays and therefore reduces the overall weight and complexity of the vehiclersquos electrical system and wiring harnesses Heavy-duty transit vehicle electrical systems typically offer extensive diagnostic capability The use of the PLC provides for easier diagnosis of sub-systems using software on laptop PCs The electrical system is repaired as necessary over the life of a 10-year vehicle In contrast electrical systems for 12-year vehicles are frequently overhauled at midlife Typically a midlife overhaul of the electrical system costs $4000 on a 12-year vehicle In contrast most 4- 5- and 7-year vehicles have wiring harness electrical systems (as found in private vehicles) and last the full service life of the vehicle
Table 6-6 Electrical System Characteristics
Component 4- and 5-Year Vans and Buses 7-Year Bus 10-Year Bus 12-Year Bus
Electrical System Type Wiring harness Wiring harness Multiplexing system Multiplexing system Useful Life Life of Vehicle Life of Vehicle Life of Vehicle Life of Vehicle Rehabilitated As needed As needed As needed Yes
Many agencies do not perform a scheduled rehab but will repair as needed
Federal Transit Administration 64
Useful Life of Transit Buses and Vans Chapter 6 Final Report Engineering Analysis
Propulsion System
Four- and Five-Year Vehicles There are two types of internal combustion engines for full-size vans and cutaway van chassismdashspark ignition (gasoline) and compression ignition (diesel) The gasoline engines are designed and manufactured by the van and chassis manufacturer The engines typically have 6 8 or 10 cylinders ranging in displacement from 46 liters to 80 liters The engines are similar to those offered in full-size pickup trucks and sport utility vehicles (SUVs) Gasoline engines in this operating environment have a service life of 125000 to 175000 miles Diesel engines are options on these vehicles at a $4000 premium The diesel engines provide superior durability and fuel economy and with a service life of 250000 to 300000 miles typically outlast the vehicle
The transmissions are designed and built in-house by the vanchassis manufacturer The transmissions in operation today have both four and five speeds which includes overdrive Transmissions are sized to accommodate the input torque of the engine Transmission can be expected to last 75000 to 100000 miles in transit service The transmissions are similar to those used in full-size pickup trucks and SUVs
In this service-life category performing a mid-life rehabilitation on the bus is uncommon However engines and transmissions are overhauled on an as-needed basis Cost for overhauling an engine and transmission is $4000 and $2000 respectively
Seven-Year Vehicles Medium-duty buses are powered solely by diesel engines The engines can be designed and built by the chassis manufacturer or purchased from a dedicated diesel engine manufacturer such as Cummins or Caterpillar The engines typically have 6 cylinders and 60 to 70 liters of displacement and the cylinders are arranged in an inline configuration Inline configuration is naturally balanced and provides minimal vibration Diesel engines in this class typically last the busrsquos life with a service life of 200000 to 300000 miles For medium-duty buses Allison transmission is the dominate transmission provider The chassis volumes are not sufficient to warrant chassis manufacturers to design their own transmission Heavy-duty transmission vendors from Europe have yet to challenge Allison in this bus service-life category In the category performing a mid-life rehabilitation on the bus is uncommon However engines and transmissions are overhauled on an as-needed basis
Ten-Year Vehicles Nearly all of the internal combustion engines used in heavy-duty small transit buses are compression ignition (diesel) although there are some CNG and diesel hybrid powertrains in service The engines typically have four six or occasionally eight cylinders ranging in displacement from 60 liters to 80 liters in capacity The engines are similar to those offered in class 7 tractors and straight trucks and heavy duty pick-up trucks Diesel engines in this operating environment have a service life of approximately 200000 to 300000 miles The diesel engines are supplied to the chassis manufacturer by a diesel engine manufacturer according to the customerrsquos specifications The major diesel engine suppliers to the heavy-duty small transit industry include Cummins and International CNG versions can increase the cost of a transit bus by $50000 Diesel engines can last the entire service life of the vehicles or may be replaced during the service life (depending on the service characteristics of the operator)
Federal Transit Administration 65
Useful Life of Transit Buses and Vans Chapter 6 Final Report Engineering Analysis
The major supplier of heavy-duty small transit bus transmissions is Allison The transmissions in operation today have both four and five speeds Transmissions are sized to accommodate the input torque of the engine Transmission can be expected to last to 150000 miles in transit service and hence will likely require an overhaul during the life of the vehicle
Table 6-7 Propulsion System Characteristics
Component 4- and 5-Year Vans and Buses 7-Year Bus 10-Year Bus 12-Year Bus Propulsion System Engine
Type Gasoline and diesel engines Diesel engines Diesel with some CNG and hybrid
Diesel with some CNG and hybrid
Useful Life Gas 125000 to 175000 miles Diesel200000 to 300000 miles
200000 to 300000 miles
200000 to 300000 miles
200000 to 300000 miles
Rehabilitated Rare As needed Yes Yes Propulsion System Transmission Type Automatic Manual Automatic Automatic Automatic
Useful Life 75000 to 100000 miles
100000 to 150000 miles 150000 miles 150000 miles
Rehabilitated As needed As needed Yes Yes Many agencies do not perform a scheduled rehab but will repair as needed
Twelve-Year Vehicles Nearly all of the internal combustion engines used in heavy-duty transit buses are compression ignition (diesel) although there are CNG and diesel hybrid powertrains in service The engines have four six or occasionally eight cylinders ranging in displacement from 80 liters to 140 liters The engines are similar to those offered in class 8 tractors and straight trucks The diesel engines are supplied to the chassis manufacturer by a diesel engine manufacturer according to the customerrsquos specifications CNG versions can increase the cost of a transit bus by $60000 and hybrid powertrains can add $150000 to the price of the vehicle Diesel engines have a service life of 250000 to 300000 miles and are typically overhauled or replaced on the vehicle
The transmissions are purchased by the chassis manufacturer according to the customerrsquos specifications The transmissions in operation today have both four and five speeds Transmissions are sized to accommodate the input torque of the engine Transmissions can be expected to last to 150000 miles in transit service
In this service-life category performing a mid-life rehabilitation on the bus is common and typically includes the powertrain However engines and transmissions are also overhauled on an as-needed basis Cost for overhauling an engine and transmission is approximately $35000 including engine compartment accessories such as mounts and emission control devices
Federal Transit Administration 66
Useful Life of Transit Buses and Vans Chapter 6 Final Report Engineering Analysis
Axles and Differentials
Four- Five- and Seven-Year Vehicles The axles and differentials used on small buses are exclusively built for the vanchassis manufacture by Tier 1 suppliers The axles are designed to accommodate the load rating of the vehicle Most rear axles for this vehicle weight class use a floating design in which the load on the axle is carried by the axle housing and not the axle shafts The differential provides the final gear reduction and transmits power from the powertrain to the wheels Properly maintained axles and differentials will perform for many years without major maintenance Transit service is hard on axles and differentials and it is not uncommon to have to replace the bearings on the axle shafts or the differential itself This type of maintenance is not scheduled and is performed on an as-needed basis Overhauling a rear axle can cost upward to $1500
Depending on vehiclersquos loading rating the front axle and suspension uses either a solid axle design with coil leaf or torsion bar mechanical springs or an independent suspension with either a coil or torsion bar mechanical spring Independent suspensions provide superior ride comfort but have more bushings associated with them requiring periodic replacement Front-axle and suspension systems are inspected regularly with repairs performed on an as-needed basis
Ten- and Twelve-Year Vehicles Ten- and twelve-year heavy-duty buses use axles and differentials from the trucking industry although there are transit bus specific axles used especially in low-floor applications where the front axle by necessity must be a low profile design Rear axles of low-floor designs can also be of a low profile design but this is only required in a full low-floor type of design compared with the more common partial low-floor design Heavy-duty small transit buses use two axles and are rated for a GVW of 26000 to 33000 pounds with the front typically rated at 10000 and the rear at 20000 pounds Large heavy-duty transit buses use two axles (3 for an articulated bus) and are rated for a GVW of 36000 to 40000 pounds The maximum axle weight allowed is typically 18000 front and 22000 rear depending on the state As delivered large heavy-duty transit bus front axles are rated for 13000 pounds and rear axles are typically rated for 26000 pounds Rear axles for this vehicle weight class use a fully floating design in which the suspension loads on the axle are carried by the axle housing and not the axle shafts Here again it is not uncommon to have to replace the bearings on the axle shafts or the differential itself and this type of maintenance is not scheduled it is performed on an as-needed basis and can be expected at least once during the vehicle life Rear suspensions are most commonly air springs or occasionally solid leaf springs
The front axle and suspension is generally a solid axle design with coil springs air springs or occasionally an independent suspension with air springs Independent suspensions provide superior ride comfort but have more bushings associated with them requiring periodic replacement Front axle and suspension systems are inspected regularly with repairs performed on an as-needed basis Overhauling heavy-duty axles can cost $9000 and suspensions roughly $4600 per rebuild
Federal Transit Administration 67
Useful Life of Transit Buses and Vans Chapter 6 Final Report Engineering Analysis
Table 6-8 Axles and Differentials Characteristics
Component 4- and 5-Year Vans and Buses 7-Year Bus 10-Year Bus 12-Year Bus
Type Floating rear solid or torsion front w leaf
suspension
Floating rear solid front w leaf suspension
Floating rear solid front w coil springs air
springs
Floating rear solid front w coil springs air
springs Useful Life Life of Vehicle Life of Vehicle 6 to 7 years 6 to 7 years Rehabilitated As needed As needed As needed As needed
Many agencies do not perform a scheduled rehab but will repair as needed
Brakes
Four- Five- and Seven-Year Vehicles Four- and five-year small buses are equipped with hydraulic brake systems featuring drum brakes on the rear and disc brakes on the front axles Medium-duty 7-year buses are typically equipped with hydraulic brake systems with either drum or disc foundation brakes Higher-capacity vehicles are equipped with pneumatic brake systems because of limitation on the boiling point of hydraulic fluid In transit service brakes are inspected on scheduled intervals based on either vehicle mileage or time Brake life is dependent on the duty cycle and can range between 15000 and 30000 miles Rebuilding the brakes can cost upwards of $400 per axle
Table 6-9 Brakes Characteristics
Component 4- and 5-Year Vans and Buses 7-Year Bus 10-Year Bus 12-Year Bus
Brakes
Type Hydraulic drum rear brakes and disc front
brakes
Pneumatic drum rear brakes and disc
front brakes
Pneumatic drum rear brakes and disc front
brakes
Pneumatic drum rear brakes and disc front
brakes
Useful Life 15000 and 30000 miles
15000 and 30000 miles
15000 and 30000 miles
15000 and 30000 miles
Rehabilitated Yes Yes Yes Yes
Ten- and Twelve-Year Vehicles Ten- and twelve-year heavy-duty transit buses are equipped with air brake systems featuring drum or disc brakes on the front and rear axles Heavy-duty vehicles are equipped with pneumatic brake systems because of limitation on the boiling point of hydraulic fluid In transit service brakes are inspected on scheduled intervals based on either vehicle mileage or time Brake life is dependent on the duty cycle and can range between 15000 and 30000 miles Rebuilding the brake system can cost $5000 including actuators linings and drums
Wheelchair Lifts
Conventional high-floor buses use wheelchair lifts to meet ADA requirements Low-floor designs also use some form of boarding aid for wheelchair passengers such as an air-driven boarding ramp and kneeling system The ramps are located on the inside of the bus at the front entrance door and are operated by the driver These boarding aids use interlocks that prevent the
Federal Transit Administration 68
Useful Life of Transit Buses and Vans Chapter 6 Final Report Engineering Analysis
bus from moving with a deployed wheelchair lift or ramp These systems are repaired as required during the life of the vehicle Typical overhaul cost for wheelchair lifts at midlife of a 12-year vehicle ranges from $12000 to $20000 with ramps costing relatively less depending on the complexity of the mechanism
Table 6-10 Wheelchair Lifts and Ramps Characteristics
Component 4- and 5-Year Vans and Buses 7-Year Bus 10-Year Bus 12-Year Bus
Type Lifts and Ramps Lifts Lifts Lifts Useful Life Life of Vehicle 6 to 7 years 6 to 7 years 6 to 7 years Rehabilitated As needed As needed As needed As needed
Summary
Figure 6-1 summarizes the results of this sub-section Specifically the figure presents the expected service lives of all major component groupings for a 12-year bus Here component groupings have been placed into three categories acting as rough prioritizations of vehicle replacement and rehabilitation importance These include (1) replacements required to keep vehicles fully operable (2) replacements to ensure vehicle operation remains safe and (3) replacementrehabilitation activities to maintainimprove vehicle esthetics (or general quality of service) Note here that relatively few vehicle components typically last the full ldquoservice liferdquo of the vehicle For 12-year vehicles this includes the structure (the component to which most other components are attached) exterior (panels or ldquoskinrdquo) and the electrical system This summary presentation helps to emphasize the fact that the vehicle structure the skeleton to which all other components are attached is the single most important vehicle component that defines the overall useful life of the entire vehicle Given this importance the next sub-section will further review the vehicle frame
Federal Transit Administration 69
Useful Life of Transit Buses and Vans Chapter 6 Final Report Engineering Analysis
Figure 6-1 Component Expected Life 12-Year Bus
Structure
Electrical System
Fuel System
Engine
Axles and Differential
Transmission
Suspension
Brakes
Tires
Wheelchair Lift
Radio and Public Address System
Hubs
Air System
Exterior
Windows
Interior Climate Control
Interior
Destination Signs
16 Expected Component Life (Years)
Vehicle Structure ndash A Second Look
This section provides further consideration of vehicle structure As noted above vehicle structure defines the useful life of the vehicle as a whole more than any other single vehicle component This is because the structure is the backbone to which all other vehicle components are ultimately attached Should the structure wear out or fail due to the influences of corrosion or a significant accident then the life of the vehicle is essentially at an end In contrast other vehicle components can be replaced as needed when they fail or become obsolete This even includes components that can be challenging to replace such as electrical systems which may require significant dismantling of the vehicle prior to removal and replacement Even the vehicle exterior (eg the panels making up the ldquoskinrdquo of the vehicle) which also tends to last the expected service life of the vehicle can be replaced as needed over the life of the vehicle Replacing the structure however would require the removal of all other components and then the complete reassembly of the vehiclemdashan improbable task
As the Chapter 2 analysis makes clear the structure of the 12-year bus (and some 10-year buses) is really only the bus and van structure developed solely for the transit market with the structures for all remaining bus and van types developed with other user applications in mind such as school buses motor homes courtesy vehicles and family vans Given that structure defines vehicle useful life more than any other component and that 12-year vehicle structures are the only structures designed specifically for transit use (and transit is the largest purchaser) the 12shy
Operability
Safety
Esthetics
0 2 4 6 8 10 12 14
Federal Transit Administration 70
Useful Life of Transit Buses and Vans Chapter 6 Final Report Engineering Analysis
year structure is the single component where FTA and the transit industry are in the best position to alter both component life and vehicle useful life simultaneously
The following sub-sections consider the useful life of vehicle structure from two different perspectives The first is the impact of service environment which is a primary determinant of structure service life and a factor that many transit operators would like to include along with service years and miles in assessing FTArsquos minimum service-life requirements The second is consideration of how different structure designs impact the useful life of transit buses For the most part the discussion in the section is limited to 12-year buses
Service Environment
All of the agencies interviewed for this study including those participating in both the initial and follow-up reviews acknowledged that service environment is one of the most significant factors that impacts the useful life of the bus structure This was recognized by agencies whether they considered their own service environment as less the same as or more severe than the national average
Agencies who noted that their service environment was the same as or less severe than the average did comment that buses that see high passenger load rates and are subjected to more severe service wear out faster This is intuitive and most agencies can proactively address this by rotating their buses so that the vehicles get equal exposure to the high service routes in order to balance overall fleet life However this is not always possible One agency noted that they exclusively used 60-foot articulated buses on specific high demand routes These buses experienced much higher wear and required more maintenance This agency attributed the higher maintenance requirement to the more demanding service environment served by the 60-foot bus rather than to the complexity of the articulated vehicle
The variability in service environment and its impact on bus useful life implies that a standard replacement age may not be appropriate for all transit agencies A bus structure built to survive the standard 12 years in an average North American city will not last 12 years in a harsher New York City or Boston environment Conversely a bus structure built to survive 12 years in either of these northeastern cities will be over-designed for the average US transit agency The bus structure will survive in excess of 12 years but it is a heavier and stronger structure The additional weight of the structure results in lower passenger capacity higher fuel consumption and greater wear on suspension and braking components Many of the agencies interviewed (including TTC NYCT and MBTA) have strengthened their specifications to include structural validation requirements in order to ensure they are purchasing buses that will survive for their desired (eg 12 year or longer) useful life within tough operating environments
TTC and NYCT working with Bodycote (formerly Ortech) developed an evaluation process to pre-qualify bus structures using a shaker table test The shaker table can be used to simulate the bus in the agencyrsquos actual operating environment The shaker table consists of four hydraulic posts that attach to the busrsquos wheel ends The hydraulic posts input loads into the busrsquos structure based on accelerometer data collected from actual routes The dynamic test can simulate 500000
Federal Transit Administration 71
Useful Life of Transit Buses and Vans Chapter 6 Final Report Engineering Analysis
miles of actual operation in a matter of weeks The actual stresses and failures that a bus structure would experience in service can be found over the course of the test
Using a similar methodology the stresses imparted into the bus structure can be measured in service and used to calculate ldquodamage factorsrdquo for the structure Instead of testing a completed bus on a shaker table this method can be used to predict useful life This approach has been applied by the MBTA on all of their recent bus procurements Each bus design was outfitted with a few dozen to a couple of hundred strain gauges and road tested in both loaded and unloaded conditions The strainstress data gathered from these tests was then extrapolated over the required 500000-mile useful life of the bus By comparing this information with known fatigue curves for standard welded joint classes the expected life of the bus structure can be determined In addition any locations that may have a lower than required life can be identified and redesigned prior to full bus structure production
Based on the interviews with transit agencies it is clear that service environment has a significant impact on bus structure useful life However because of the wide range in service environments throughout the country agencies with the most severe service environments have found it necessary to emphasize bus structure validation as part of their evaluation process If all agencies are required to get 12 years of useful life from their buses this will result in the average agency purchasing a vehicle that is over-designed for their needs at a higher cost with operating penalties of increased weight andor reduced passenger capacity
Severity and Minimum Service-life requirements Finally the question then arises as to whether the service environment should be includedmdash along with minimum service years (eg 12 years) and service miles (eg 500000 miles)mdashin the definition of FTArsquos expected minimum service-life requirements In other words should agencies operating in severe service environments be subject to less restrictive minimum service-life requirements as compared to those in less severe environments (eg 10 years versus 12 years for a large heavy-duty bus) While many of the interview respondents support the lesser restriction it is not clear how this service environment adjustment would be implemented in practice For example how would service environment severity be measured and where does the boundary between severe and not severe lie Presumably this would require some type of index incorporating measures of average passenger loadings street ldquoroughnessrdquo road salt utilization and perhaps local topography (ie for presence of steep grades) Alternatively agencies could lobby for a severity rating that FTA would then need to agree to
At the same time FTA would also need to conduct some analyses to determine how the minimum age and mileage requirements should best be altered to reflect these differences For example for large heavy-duty buses should the service-life requirements be 10 years for high-severity environments 12 years for average severity environments and 14 years for low-severity environments or some other set of ages
Another option would be to maintain the current 12-year and 500000-mile requirements and then somehow adjust funding levels to reflect the needs for a stronger structure for more severe operating environments To a limited extent this is already the case as (1) formula funding is already tied to ridership (thus accounting for rider impacts if not street roughness impacts) and
Federal Transit Administration 72
Useful Life of Transit Buses and Vans Chapter 6 Final Report Engineering Analysis
(2) FTA funds 80 percent of the vehicle cost including 80 percent of the higher cost for vehicles with stronger structures
In summary while it is very clear that service environment severity is a primary determinant of vehicle useful life it is not as clear how this factor could be represented in FTArsquos minimum service-life requirements While it is possible in theory to develop measures to capture and reflect differences in service environment severity (eg an index of service severity) selection development and reporting of these measures would require some research and would still require identification of a clear (but arbitrary) cut-off point between the severe and less severe environment types
Construction Type
The method in which transit buses are designed and constructed has an impact on their useful life The most popular method of construction used today for 12-year service life buses is an integral body and chassis constructed from square tubing This construction method uses hundreds of varying sizes of square tubes that are welded together to form the sidewalls roof and floor structures The sections are brought together and welded creating an integral bus body and chassis There are thousands of welds in a completed bus structure and the welds are subject to fatigue Buses that use this construction method are commonly referred to in the industry as ldquostickrdquo buses European bus designs heavily influenced this construction method New Flyer Orion NABI and Neoplan all employ this type of construction
The advantage of this construction method is that very little tooling and few machines if any are used in fabricationmdashthus minimizing expenses related to introducing a new bus design Disadvantages include the fact that the buses are very labor intensive to build and early versions suffered from structural design deficiencies corrosion problems and general quality control issuesmdashleading in turn to useful life issues Many transit authorities stayed with the proven General Motors RTS design last manufactured by NovaBus and Flxiblersquos Model 870 both of which were high-floor designs With the advent of low-floor buses however even the most loyal RTS operators were forced to procure stick busesmdashthe more effective design for vehicles of this type Most manufacturers have addressed the issues previously associated with stick buses by treating the tubes with corrosion-resistant coatings employing stainless steel improving quality control and strengthening the design such that newer designs are expected to have better useful life expectancies as compared to earlier models
Low-Floor Designs
Low-floor buses entered the market in the early to mid-1990s These buses feature a dropped front axle that enabled the floor to be lower and thereby eliminated the need for entry steps They also eliminated the need for wheelchair lifts which were problematic to maintain In the US market the low-floor bus standardized around a configuration featuring a low floor that ran from the front of the bus to just aft of the rear door After which two steps are required to reach the rear platform The raised rear platform provides sufficient space under the floor for a conventional rear axle and powertrain
Federal Transit Administration 73
Useful Life of Transit Buses and Vans Chapter 6 Final Report Engineering Analysis
Most of the 40-foot transit buses sold today are of the low-floor design Interview participants stated that it is too early to tell whether the low-floor design will impact vehicle longevity but did note that this design is more susceptible to roadside damage and salt spray (because the floor structure is closer to the ground) Furthermore the front suspension travel is reduced due to space limitation which may result in greater loads imparted into the bus structure with possible long-term service life ramifications Some interview participants felt that the service life of low-floor buses would be less than that of high-floor buses although they are capable of meeting minimum service-life requirements Others responded that the service life should be similar
Articulated Bus Designs
Articulated buses were introduced in the US market in the 1980s by European manufacturers Two configurations were sold In one configuration commonly referred to in the industry as a ldquopusherrdquo the engine resides in the rear of the second module or ldquotrailerrdquo similar to a conventional 40-foot bus The other design referred to as a ldquopullerrdquo houses the engine below the floor of the forward module or ldquotractorrdquo The added complexity of articulated buses increased their maintenance costs which can reduce their useful service life Only a few large transit authorities operate articulated buses in significant numbers Transit authority responses did indicate issues with articulated buses but these issues were primarily vendor-specific and not necessarily typical of this vehicle type
The advent of bus rapid transit (BRT) has renewed interest in articulated buses These latest designs feature low floors stylistic front ends pusher powertrain layouts and in some cases doors on both sides of the vehicle It is premature to comment on the durability of the latest generation of articulated buses however features such as doors on either side would be expected to challenge the structural integrity of the bus and could negatively affect its useful life
Bus Durability and New Technologies
Promoting research into advanced designs and technologies has always been an FTA interest and a transit industry strength In the 1990s FTA performed research on battery electric hybrid electric alternative fueled fuel cell and composite material buses This research has led to some useful-life impacts on the grantees For example the composite structures can certainly provide a minimum 12-year life and likely more These may be of interest to agencies looking for longer-life vehicles However the cost of the composite buses has limited their competitiveness within the low-bid procurement process
The following subsections consider the useful life implications of two types of new vehicle technologiesmdashalternative fuel and new electronics technologies
Alternative Fuels and Hybrid Propulsion Systems
The use of new fuels and propulsion systems in transit has historically affected the reliability and (in some cases) useful life of transit buses Early compressed and liquefied natural gas engines for example were sensitive to fuel quality and the energy content of the fuel because their mechanical fuel injection systems were not sophisticated enough to adjust for these differences
Federal Transit Administration 74
Useful Life of Transit Buses and Vans Chapter 6 Final Report Engineering Analysis
and often led to engine damage Newer electronically controlled engines have solved issues associated with changes in fuel content
Natural gas engines operate with a lower compression ratio The lower ratio results in smaller forces on the pistons pistons rod crankshaft and crankshaft bearings theoretically extending the life of the lower half of the engine The high combustion temperatures associated with spark-ignited engines negatively affect the upper half of the engine Taken together CNG engine should have similar life to that of diesels which is approximately 300000 miles
Survey responses from transit authorities found modern CNG engines to be durable and reliable Some transit authorities commented on the increased maintenance requirements due to the added components such as the spark plugs and ignition systems Transit authoritiesrsquo current concern with CNG buses is their higher curb weights CNG buses weigh approximately 3000 lbs more than their diesel counterpart The added weight is associated with the high-pressure cylinder storage tanks that make up the fuel storage system Some transit authorities expressed concern that the added weight negatively affects the useful life of transit bus structures Hence while the engine life of CNG vehicles may be comparable to that of traditional diesel engines the higher CNG engine weight may have negative useful life impacts on vehicle structures The agency respondents stated that this has yet to be proven
Diesel hybrid electric propulsion systems are the latest technology employed on transit buses Hybrid propulsion systems feature a diesel engine generator electric traction motor power electronics and batteries The batteries are capable of storing energy from regenerative braking and using it later to propel the bus NYCT was the first transit authority to purchase diesel hybrid electric buses in 1998 Since that time the technology has developed additional suppliers have entered the market and the technology has gained widespread acceptance Diesel hybrid electric buses have proven successful in terms of reliability and maintainability and the regenerative braking feature has significantly reduced brake maintenance
Diesel hybrid electric propulsion systems have two issues that may impact bus useful life The first issue is the life expectancy of the batteries There are currently two battery types being used on transit busesmdashlead-acid and nickel metal hydrides Neither is capable of meeting the minimum life expectancy of a transit bus both will need to be replaced one or more times throughout the vehicle life cycle Transit authorities will have to decide whether it makes economic sense to install new batteries at a significant expense into an older bus or retire and buy new The second issue deals with weight The weight of the batteries and associated components is approximately 1500 pounds While not as significant as the weight with CNG buses the additional weight increases roof loads onto the structure and may impact useful life Here again the actual impact on vehicle useful life will not be known until these buses begin to reach their mid and later service years
New Electronics Technologies
Over the past decade transit operators have added an ever-increasing number of new electronics technologies to their bus vehicles including automatic vehicle location automatic passenger counters on-board cameras vehicle diagnostics adaptive signal timing and communication
Federal Transit Administration 75
Useful Life of Transit Buses and Vans Chapter 6 Final Report Engineering Analysis
control voice annunciation and others In many instances agencies will not allow their buses to pullout for daily revenue service unless these systems are fully functioning (in some cases for liability concerns) However as each new technology is added to the bus and as more of these technologies are deemed critical to service operations the probability of one ore more technologies failing steadily increases leading to a potential need for increased spare ratios Of greater concern to agencies is the fact that the likelihood of these technologies failing is expected to increase further as vehicles age leading to potentially serious fleet reliability issues for aging fleets (or an increased need for vehicle electronics overhauls after mid life) Once more the ultimate impact on vehicle useful life will not be known until these technologies have been in service for many more years
Life-Extending Practices
Life-extending practices employed by transit authorities include the use of corrosion-resistant materials preventative maintenance programs and mid-life overhaul programs Many transit authorities specify corrosion-resistant materials when procuring buses These include the use of protected carbon steel and stainless steel The interior of the tubes are treated with an interior rust inhibitor while the undercarriage is also treated with an undercoating Corrosion-resistant metals rust inhibitors and undercoating are imperative to ensuring a long useful life
Similarly preventative maintenance programs are key to ensuring minimum life requirements are satisfied Operating buses with worn or bad suspension bushing for example increases the loads imparted into the busrsquos structure and ultimately shortens the useful life of the bus Typical preventative maintenance programs might include a 3000-mile minor mechanical and 12000shymile major mechanical and inspection
In addition to preventative maintenance programs some of the nationrsquos largest transit authorities perform mid-life overhauls after roughly seven years of service The overhaul programs are extensive and result in the rebuilding or replacing of a majority of components on the bus The work can be performed in-house or by an outside contractor Transit authorities that engage in mid-life overhaul program typically extend the service life to 15 years
Vehicle Emissions
An additional consideration with respect to bus and van useful life and FTArsquos minimum service-life requirements is vehicle emissions of nitrogen oxides (NOx) and particulate matter (PM) First although it is difficult to obtain empirical data on the matter it is generally believed that vehicle engines emissions gradually worsen over the life of the vehicle as the condition of the engine continually declines (even with rebuilds) Second and more importantly emissions levels for new heavy-duty transit buses have been decreasing steadily over time as newer cleaner burning engines are developed (see Figure 6-2) Either way it is clear that any reduction in actual vehicle service life (ie earlier fleet retirements) can help accelerate the replacement of older vehicles (and engines) with newer vehicles with cleaner burning engines yielding a clean air benefit to society However as has been noted many times throughout this report FTArsquos current minimum life requirement is not binding for most transit operatorsmdashand hence any relaxation of that requirement would not yield an appreciable reduction in transit fleet particulate
Federal Transit Administration 76
Pre-19
87
1987
-1990
1991
-93
1994
-95
1996
-98
1999
-02 20
03
2004
-06 20
07
2008
+
Useful Life of Transit Buses and Vans Chapter 6 Final Report Engineering Analysis
emissions (See Financial Impact of Earlier or Later Bus Retirement in the next chapter which estimates the small number of vehicles likely to be retired earlier with a reduction in FTArsquos minimum service-life requirements) Moreover it has not been shown that the benefits of this emissions reduction would offset the increased capital cost for accelerated vehicle replacement Finally even if more agencies were responsive to a reduction in FTArsquos minimum service-life requirements the emissions benefit from accelerated retirement would be short-lived As shown in Figure 6-2 new engines are now nearing zero-emissions levels for NOx and PM Once all of the older ldquodirtierrdquo vehicles are retired the benefit of accelerated retirement disappears
Figure 6-2
Heavy Duty Transit Buses NOx and PM Emissions by Model Year
0
5
10
15
20
25
NO
x (g
mi)
000 005 010 015 020 025 030 035 040 045
PM (g
mi) NOx
PM
Source California Air Resources Board Urban Diesel Transit Bus Emissions Inventory
Vehicle Reliability
The impact of age on a busrsquos useful life varied by transit agency and was primarily influenced by the agencyrsquos maintenance practices and service environment While all agencies reported that buses became less reliable with age it was noted that the extent of unreliability and deterioration could be controlled andor mitigated by improved maintenance In general agencies that followed a rigorous preventative maintenance regime reported that they saw minimal deterioration of the bus over the 12-year expected life Agencies that performed primarily corrective maintenance reported that older buses became less and less reliable and more and more expensive to maintain
Federal Transit Administration 77
Useful Life of Transit Buses and Vans Chapter 6 Final Report Engineering Analysis
National Bus Condition Assessment
From 1999 to 2002 FTArsquos Office of Budget and Policy completed a series of physical condition inspections for a large sample of US transit buses This study evaluated the physical condition of close to 900 transit buses and vans at more than 40 different transit properties The purpose of these inspections was to develop bus vehicle decay curves to simulate the nationrsquos current and future bus replacement needs within FTArsquos TERM
The bus physical condition data collected for this effort provide valuable information on (1) the expected physical condition of US transit buses throughout the vehicle life cycle and (2) a clear understanding of how the physical condition of transit buses of the same age varies across bus models and transit properties The results of this condition assessment provide a valuable means to understand both the consequences of the existing minimum service-life requirements (eg the expected physical condition of a 40-foot transit bus at age 12) as well as the consequences of changing that policy (eg how increasing or decreasing the minimum retirement age would impact the physical condition of the nationrsquos bus transit fleets) This section provides an overview of FTArsquos bus condition assessment program and its findings as they relate to FTArsquos minimum life requirements
National Bus Condition Assessment ndash Overview
The national bus condition assessment evaluated the current physical condition of 895 transit buses and vans located at 77 facilities from 43 different US transit properties In practice each assessment consisted of a detailed on-site evaluation of the current physical condition of several vehicles of each sub-fleet located at each sample agency maintenance facility For bus vehicles the assessment included a detailed inspection of the vehicles interior exterior chassis and understructure and engine compartment This visual inspection data was then combined with agency maintenance hours road call fluid analysis (eg oil sample) and other data to yield a comprehensive evaluation of each vehicles overall physical condition
The primary goal of the national bus condition assessment was to provide FTA with this snap shot of the current physical condition of the nations bus fleet and related maintenance assets This national condition evaluation is significant as it provides a critical measure of the quality and safety of transit service currently provided to the nations bus riders At the same time by revealing the distribution of physical conditions of the nations bus fleets (eg across vehicle ages) the assessment also provides a realistic basis for evaluating the nations immediate vehicle and facility replacement needs This analysis of the FTA service-life policy used this bus condition assessment to help establish an engineering basis to the minimum useful-life service measures of age and miles
A secondary project goal for the national bus assessment was to develop improved asset decay curves of bus vehicles and bus facilities for FTAs TERM TERM itself is designed to predict current physical conditions and long-term capital needs for the US transit industry Given these capabilities TERM is also the primary analytical tool used by FTA to prepare its condition and needs estimates for the biennial US DOT report to Congress In developing those estimates TERM uses statistical decay curves to model the life cycle of all transit asset types including bus
Federal Transit Administration 78
Useful Life of Transit Buses and Vans Chapter 6 Final Report Engineering Analysis
vehicles and related facilities These condition decay relationships were used in this contribution to the useful-life analysis
Considerable care was taken to ensure that the vehicles and transit agencies included in the inspection process yielded a representative sample of the nations bus fleet and agencies as a whole This objective was achieved by first examining both the overall characteristics of the nations bus fleets and related facilities and the prime determinants of the physical decay processes for these asset types (eg variations in passenger loadings average miles per year per vehicle and climate) The sample of assets for inspection was then selected to ensure a representative sample based on these national characteristics and one with sufficient data points to permit comprehensive statistical analysis of the asset decay process for buses and facilities This representative sample is equally important to this engineering analysis of the useful life of buses and vans
Overview of Key Results
The national bus condition assessment yielded several significant results regarding the physical condition and asset decay characteristics of the nations bus vehicles These include the following
1 The rate of decay for bus vehicles appears to fall into three distinct regimes over the asset life cyclemdashbeing highest over the first five years of revenue service slowing markedly between the ages of 5 through 14 and then accelerating again as the vehicle approaches retirement These observed regimes are consistent with the known service and rehabilitation practices of US transit operators throughout a typical vehicle life cycle In general most transit agencies obtain their highest revenue mileage and conduct the least amount of rehabilitation activities over the initial years of vehicle revenue service (ie producing a high decay rate) Between the ages of 5 and 14 (approximately) vehicles see less revenue service and begin to undergo multiple small rehabilitation activitiesmdashreducing the rate of decay Finally the value of maintaining a low-service vehicle approaching retirement declines continuously after the age of 14 leading to significant reductions in rehabilitation activity and consequently a rapid increase in the rate of decay
2 On average agencies pursuing aggressive preventive maintenance programs tended to experience lower overall maintenance costs superior bus conditions (a lower rate of deterioration) and extended vehicle life In contrast agencies focused primarily on corrective maintenance tended to exhibit poorer overall conditions higher maintenance costs and higher vehicle failure rates
3 Overall the primary contributors to vehicle decay were high utilization rates salt-related corrosion (highest in regions using road salt andor adjacent to salt water) and weak preventive maintenance Many vehicles also suffered from the effects of vandalism
4 While the national condition inspections covered all bus and vehicle types the inspection effort was concentrated on 12-year buses Consequently the data quality is highest for this vehicle type and much of the analysis that follows relate specifically to findings for the 12shyyear vehicle type
Federal Transit Administration 79
Useful Life of Transit Buses and Vans Chapter 6 Final Report Engineering Analysis
Vehicle Condition Rating Criteria
The condition rating criteria used in the bus condition engineering analysis is based on a five-value measurement of every detailed component and element within each bus (Table 6-11) The 1 to 5 condition rating scale used here is derived directly from that used by FTA to report asset conditions for all transit asset types at the national level Every component was assessed in this process based on a detailed valuation description of the five measures for each component5
These component condition ratings were subsequently entered into a national bus condition assessment database and the overall physical condition of that vehicle calculated as the weighted average of the condition ratings across all vehicle components The component weights assigned for this calculation are equal to each components estimated percentage contribution to the total life-cycle capital cost of the vehicle (including the components purchase price capital maintenance and rehabilitation and replacement costs as applicable)
The condition assessment engineers observed a broad variation in the rate of vehicle decay across the transit agencies participating in the study For example on average 40-foot buses were observed to take 84 years to decay from condition 50 (excellent) to condition 30 (adequate) However this decline took only 51 years for the lowest ranked operators included in the study For the highest ranked operators this decay process required 135 yearsmdashone year past the FTAs minimum retirement age
Table 6-11 Vehicle Condition Rating System
Rating Condition Description 50 Excellent No visible defects near new condition 40 Good Some (slightly) defective or deteriorated component(s) 30 Adequate Moderately defective or deteriorated component(s) 20 Fair Defective or deteriorated component(s) in need of replacement 10 Poor Critically damaged component(s) or in need of immediate repair
Bus Vehicle Conditions
Figure 6-3 provides a scatter plot of the observed vehicle conditions for the 895 transit buses and vans Specifically each point represents the weighted average condition value for a single vehicle based on the assessed condition of that vehicles constituent components As expected vehicle conditions decline significantly over the life of the vehiclemdashstarting in excellent condition (5) and deteriorating to marginal or poor condition (2 or 1 approximately) over a 10- to 20-year period
5 For more information about the TERM model or details of the bus condition assessment process please reference ldquoStatus of the Nationrsquos Highways Bridges and Transit Conditions and Performancerdquo and the ldquoTransit Economic Requirements Model Users Guiderdquo
Federal Transit Administration 80
Useful Life of Transit Buses and Vans Chapter 6 Final Report Engineering Analysis
Figure 6-3
Bus Physical Condition Versus Age
10
15
20
25
30
35
40
45
50 Ph
ysic
al C
ondi
tion
Full Bus (12 yr) Small Bus (7-10 yr) Vans (4 yr)
0 1 2 3 4 5 6 7 8 9 10 11 12 13 14 15 16 17 18 19 20 21
Vehicle Age (Years)
This figure also reveals broad variation in the rate at which vehicles deteriorate For example while most 12-year vehicles tend to remain in the good through excellent range (ratings 35 to 5) during the first two years of revenue service several vehicles appear to fall quickly below this level This rapid rate of decline was typically the result of very high service levels high passenger loadings accidents and in a few instances vandalism At the same time many 12-year vehicles were in adequate (condition 3) or better condition well past the FTAs 12-year minimum retirement age These well-preserved vehicles were typically the product of strong preventive maintenance programs milder operating environments and lighter duty cycles Relatively few 12-year vehicles had an overall condition rating less than 20 (although many individual vehicle components were assigned a condition rating of 1) This result reflects transit agency reticence to place a vehicle in active service if it has deteriorated such that it represents a safety hazard has poor reliability or provides poor service quality
Implications for FTArsquos Minimum Service-life Policy Part 1
For this review of FTArsquos minimum service-life policy an overall vehicle condition rating of 20 means a reasonable floor beneath vehicles should not generally be permitted in service In other words an overall condition of 20 helps to establish a maximum replacement life point (not a minimum) By inference then vehicles with ages equal to FTArsquos minimum retirement age (or mileage) should have overall condition ratings that are greater than 20 Specifically this minimum retirement age should optimally occur after a vehicle type has declined below a condition rating of 30 (ie adequate) but before it reaches an overall condition of 20 (substandard)
Federal Transit Administration 81
Useful Life of Transit Buses and Vans Chapter 6 Final Report Engineering Analysis
Average Vehicle Condition by Age 12-Year Vehicles
Figure 6-4 illustrates the change in average vehicle conditions by vehicle age for the full sample of 12-year vehicles once the scatter plot data presented above are ldquosmoothedrdquo to better capture the rate of vehicle decay for different bus populations6 Inspection of this smoothed average graph reveals several significant features First as expected average vehicle physical conditions tend to decline as vehicle age increases Second the rate of decline is not constant but varies over time In particular the rate of decline appears to fall into three distinct regimes over the asset life cyclemdashbeing highest from procurement through age 5 (approximately) slowing markedly from age 5 to 14 and then accelerating again after age 14 Finally the rate of decline decreases slowly from year to year within each regime appearing to follow an exponential decay process within each regime period
Figure 6-4
Average Bus Conditions by Age (Smoothed)
10
15
20
25
30
35
40
45
50
0 1 2 3 4 5 6 7 8 9 10 11 12 13 14 15 16 17 18 19 20 Vehicle Age
Con
ditio
n
Sample Average Top Quartile Agencies Bottom Quartile Agenices
As shown in Table 6-12 the observed deterioration regimes are entirely consistent with the known service maintenance and rehabilitation practices of US transit operators throughout a typical vehicle life cycle In general most transit agencies obtain the highest revenue mileage from bus vehicles during their initial years of service (ages zero through five approximately) During this period the vehicles require the least maintenance and provide the highest quality service to transit patrons in terms of comfort cleanliness and reliability The lower rate of
6 Specifically Figure 6-4 presents a smoothed average of the data points first presented in Figure 1-2 The smoothed average was calculated by first computing the observed average condition rating value at each vehicle age These observed average age values were then smoothed such that the smoothed average value for age t was set equal to the observed average values for ages t t-1 and t+1 (ie Smoothed AverageAge t = 13AverageAge t-1 + AverageAge t + AverageAge t+1)
Federal Transit Administration 82
Useful Life of Transit Buses and Vans Chapter 6 Final Report Engineering Analysis
capital maintenance and high rate of utilization combine to produce the highest rate of asset decay during this time period
Table 6-12 12-Year Vehicle Decay Rate Regimes
Age Regime Vehicle Ages Rate of Decay Agency Practices
Like New 0 to 5 Highest bull High annual mileage bull Minimalno rehabilitation (near new condition)
Mature 5 to 14 Moderate bull Reduced annual mileage bull Significant rehabilitation activity (engine rebuilds
mid-life overhauls)
Old 14 + Moderate Increasing
bull Low annual mileage bull Significant reduction in maintenance and
rehabilitation activity (nearing retirementmdashallowed to deteriorate)
Between the ages of 5 and 14 (approximately) vehicles begin to undergo more or less continuous capital maintenance and rehabilitationmdashincluding engine and transmission rebuilds upholstery replacement exterior painting and other component replacement activities These capital maintenance activities occur regardless of whether there is an overhaul process or scheduled or unscheduled component replacements Most agencies pursue these activities on an as-needed basis throughout this time period with very few agencies conducting a more or less complete vehicle overhaul at a single point in time Furthermore the actual level of maintenance and rehabilitation pursued during this period varies widely across agencies
During this period a typical vehicles overall condition rating will actually fluctuate up and down (eg pass above and then decay below the smoothed average line in Figure 6-3) as various rehabilitation activities are completed and the asset decay process begins again Regardless of the level of rehabilitation pursued these activities tend to reduce the rate of asset decay At the same time the level of annual service mileage derived from these vehicles tends to decrease over this period as operators focus service on newer fleet vehicles The combined increase in rehabilitation activity and decrease in annual service miles serve to decrease the rate of vehicle decay This emphasizes the necessity of rehabilitation activities regardless of whether they are part of an overhaul program scheduled in an organized replacement process or completed as failures necessitate on an unscheduled basis (unusual) In addition this pattern may support the exclusion of rehabilitation costs from a new federal reimbursable expensemdashan option that was considered in the initial hypotheses of potential service-life options
Finally most agencies begin to retire vehicles past the age of 12 or 14 years As vehicles approach retirement their annual miles of revenue service decrease significantly in favor of younger vehicles (tending to decrease the rate of asset decay) However the value of fully maintaining a low-service vehicle approaching retirement declines continuously during this time period leading to significant reductions in rehabilitation activity and consequently a significant increase in the rate of vehicle decay It should be noted however that several agencies operated vehicles in adequate (condition 3) or better condition well past the FTAs 12-year minimum retirement age Service-life options in this extended-life time period (beyond 12 years) has very little interest based on historical usage experience
Federal Transit Administration 83
Useful Life of Transit Buses and Vans Chapter 6 Final Report Engineering Analysis
Variation in Vehicle Decay Rates across Transit Agencies 12-Year Vehicles
Figure 6-3 provides the upper and lower bounds demonstrating the (smoothed) average condition values for those sample agencies with the highest and lowest overall condition ratings While these bounds do not fully explain the wide variation in 12-year vehicle conditions they do point to significant differences in the rate of vehicle decay across US transit operators (see Table 6-13)
Table 6-13 Average Number of Years to Attain Different Condition Ratings
Condition Rating
Years to Attain Condition Rating Bottom Quartile
Agencies Average Top QuartileAgencies
50 00 00 00 45 10 12 14 40 20 24 29 35 33 40 70 30 51 84 135 25 136 157 NA 20 189 200 NA
Note None of the agencies with average fleet conditions ranking in the top quartile operated vehicles older than age 16
For example 12-year vehicles operated by the lowest ranked transit agencies typically decline from Excellent to Good (ie from condition rating 5 to 4) in only two years However for the highest ranked agencies vehicles appear to decay more slowly and take an additional year to reach condition 4 Similarly while vehicles operated by the lowest ranked operators typically take five years to decline to Adequate (condition 3) vehicles operated by the top ranked agencies do not attain this rating until after age 13 over one year past the FTAs minimum 12shyyear retirement age
Implications for FTArsquos Minimum Service-life Policy Part 2
The agency analysis presented above demonstrates that even the bottom quartile agencies can easily attain FTArsquos current 12-year minimum retirement age for 40-foot buses without concern for operating vehicles into the lower engineering condition values of 25 to 20 (As discussed above an overall condition of 20 represents an overall vehicle condition that corresponds to the concept of a maximum retirement age or better yet a minimum acceptable service condition) This implies that a lower minimum life option may not be necessary or appropriate given the current bus design standards and operating conditions
Correlation with Vehicle Life-Cycle Cost Analysis
Chapter 7 of this report reassesses the bus condition information considered here There the life-cycle cost analysis is used to identify financially optimal retirement ages for all transit bus and van vehicle types The financially optimal retirement ages are then mapped to the corresponding
Federal Transit Administration 84
Useful Life of Transit Buses and Vans Chapter 6 Final Report Engineering Analysis
expected physical condition for vehicles of the optimal retirement age This correlation of engineering condition and life-cycle cost analyses is intended to provide an absolute answer to the optimal retirement age question (based on financial considerations) combined with an understanding of the physical condition implications of the identified optimal age (including expected levels of service reliability service quality and vehicle safety)
Federal Transit Administration 85
Useful Life of Transit Buses and Vans Chapter 7 Final Report Life-Cycle Cost Analysis
CHAPTER 7 LIFE-CYCLE COST ANALYSIS
This chapter presents the results of a minimum life-cycle cost analysis of the useful life of transit buses and vans This analysis considers all of the capital or non-recurring costs associated with vehicle acquisition as well as the recurring costs of vehicle operations maintenance and rehabilitation The objective of this analysis is to identify the point in the asset life cycle at which total life-cycle costs are at their lowest or are ldquominimizedrdquo From a financial perspective the minimum life-cycle cost point represents the optimal vehicle retirement age This minimum life-cycle cost analysis is presented first for the mainstay vehicle of the transit fleetmdashthe 40-foot heavy-duty ldquo12-yearrdquo bus The process is then repeated for each of the other transit bus and van categories Prior to presenting this analysis the chapter first identifies several of the primary determinants to life-cycle costs and life expectancy (including annual vehicle mileage average operating speed and agency rehabilitation practices) and then presents the full range of variation in these determinants across the nationrsquos bus transit operators
Later towards the end of the chapter the results of the life-cycle cost analysis are combined with the vehicle physical condition analysis from the last chapter The objective is to provide the reader with some understanding of a vehiclersquos expected physical condition at the financially optimal retirement point (in other words while the retirement point may be financially optimal is the vehiclersquos physical condition still acceptable to riders and operators) Finally this chapter concludes with an analysis of the potential loss of ridership and related fare revenues associated with increasing failure rates of an aging fleet Together the combined results of these differing analytical perspectives (cost physical condition and failure rates) help define the optimal useful-life periods for each bus and van vehicle category
Data Sources and Caveats
The cost and timing of rehabilitation activities used for the analysis were obtained from agencies and vehicle manufacturers that participated in the interview process for this study However the response rate for the cost data portion of the interview guide was low with few agencies responding fully Additional cost data were obtained from prior studies including a 2002 Booz Allen Hamilton analysis of 30 small and medium-sized bus operators in Illinois While the data obtained are of good quality and reported costs are comparable across all data sources the overall sample size is small Future life-cycle studies may wish to improve on the statistical reliability of the analysis by devoting additional resources to expanded data collection and a larger sample size Data on the average annual vehicle mileages were obtained from NTD
Key Determinants of Life-Cycle Costs
Life-cycle costs and vehicle life expectancy can vary significantly across transit operators even for operators using the same vehicle type under similar vehicle maintenance regimes Hence it is important to consider these factors when conducting a life-cycle cost analysis intended to represent the experience of the nationrsquos transit operators as a whole Towards this end this section identifies three key determinants of vehicle life-cycle costs (and life expectancies)mdash
Federal Transit Administration 86
Useful Life of Transit Buses and Vans Chapter 7 Final Report Life-Cycle Cost Analysis
annual vehicle mileage average operating speed and agency rehabilitation practices The section then goes on to discuss how these determinants vary across the nationrsquos transit fleets providing the full range of experience that needs to be reflected in the life-cycle cost analysis The analysis here is focused on the 12-year vehicle type but was also completed for the 10- 7- 5- and 4-year vehicle categories (see below)
Fleet Operating Conditions Annual Mileage and Operating Speed
The rate of vehicle wear is determined by a variety of factors including annual mileage average operating speed and passenger loadings In general higher annual mileages increase the rate of vehicle deterioration Similarly decreasing bus operating speeds are typically an indication of heavier duty-cycles (more frequent stops and starts) leading to a reduced life expectancy for drive trains brakes and other vehicle components Variations in annual mileages and operating speeds also have an impact on both the timing of fleet rehabilitation activities (eg drive train replacements) and annual operating and maintenance costs (higher annual mileage vehicles generally require higher maintenance and consume more fuel per mile than lower mileage vehicles of the same age) Hence an effective analysis of vehicle life-cycle costs must consider the range of annual mileages and service operating speeds experienced by US transit operators
Figure 7-1 shows the distribution of annual vehicle mileages for 12-year transit buses based on 2004 NTD data This chart shows a range of annual bus vehicle mileages with most US vehicles traveling between 25000 and 45000 miles each year The average annual mileage across all of the nationrsquos transit motor buses is just under 37000 miles The life-cycle cost analysis below will examine three specific annual vehicle mileage casesmdash25000 35000 and 45000 miles per year
Figure 7-1 Average Annual Miles
Distribution of US Transit Bus Vehicles
10000 15000 20000 25000 30000 35000 40000 45000 50000 55000 60000 65000
Average Annual Miles Per Fleet Vehicle
Average annual vehicle mileage tends to be highest during the earlier years of a vehiclersquos life (when utilization of the vehicle is highest) and then tends to decline as the vehicle ages (and is
00
20
40
60
80
100
120
140
160
Num
ber o
f Veh
icle
s (th
ousa
nds)
Federal Transit Administration 87
Useful Life of Transit Buses and Vans Chapter 7 Final Report Life-Cycle Cost Analysis
applied to lower demand routes) This characteristic is shown for the 12-year bus type in Figure 7-2 Once again analysis of life-cycle costs needs to reflect natural variations in the rate of vehicle utilization throughout a vehiclersquos life to accurately determine the timing of rehabilitation activities
Figure 7-2 Average Annual Milage 40 Foot Bus
00
50
100
150
200
250
300
350
400
450
500
Mile
s pe
r Yea
r (th
ousa
nds)
1 2 3 4 5 6 7 8 9 10 11 12 13 14 15 16 17 18 19 20
Vehicle Age
Finally Figure 7-3 shows the distribution of average operating speeds for 12-year transit buses Based on this data the average operating speed for 12-year transit buses is roughly 13 miles per hour with a range of between 8 and 20 miles per hour (although there is a small number of operators with average operation speeds outside of these boundaries) The life-cycle cost analysis presented below will utilize these minimum maximum and average operating speed values in defining the cost characteristics of the nationrsquos fleets of 12-year vehicles Similar bounds for annual vehicle mileage and operating speeds were developed for the life-cycle cost analyses of the 10- 7- 5- and 4-year bus and van vehicle categories (see below) As noted earlier in this report differences in average operating speed can be used as a proxy to account for differences in the total service hours (and the condition impacts of differences in hours) of transit vehicles with similar life-to-date service miles (Note Agencies can and do measure life-to-date vehicle mileage but currently have no means to measure life-to-date hours)
Fleet Rehabilitation Practices
In addition to variations in annual vehicle mileages and mean operating speeds transit agencies also employ differing life-cycle vehicle rehabilitation practices for their fleets This analysis will consider two specific cases The first case considers those agencies that undertake an extensive mid-life overhaul of their fleet vehicles In addition to the typical drive train replacement (engine and transmission replacement occurring every 250000 miles on average) extensive overhauls also include some body work exterior repainting replacement of most or all interior upholstery window and floor replacements technology upgrades etc The practice of conducting major mid-life overhauls is typically confined to the nationrsquos largest and highest ridership bus operators
Federal Transit Administration 88
Useful Life of Transit Buses and Vans Chapter 7 Final Report Life-Cycle Cost Analysis
00
20
40
60
80
100
120
Num
ber o
f Veh
icle
s (T
hous
ands
)
(eg New York City Transit New Jersey Transit and WMATA) but is relatively uncommon for most other operator sizes Where utilized major mid-life overalls of 12-year vehicles typically occur when the vehicle is six to seven years in age and are expected to provide several years of additional service life
Figure 7-3 Average Operating Speed
Distribution of US Bus Vehicles
80 90 100 110 120 130 140 150 160 170 180 190 200
Average Operating Speed (mph)
The second case considered here is intended to represent those operators that do not perform a major coordinated mid-life overhaul (most of the nationrsquos bus operators and roughly three-quarters of the nationrsquos bus vehicle fleet) For these operators replacement and rehabilitation of worn vehicle components is an ongoing continuous process performed on an as-needed basis In reality there is likely a continuum of rehabilitation practices between these two extremes However examination of these two limiting cases will effectively convey the relevant range of life-cycle cost issues between them
Life-Cycle Cost Analysis
The preceding analysis is intended to provide an understanding of the range of operating characteristics and rehabilitation practices that together are believed to drive differences in life-cycle costs and vehicle life expectancy across the nationrsquos transit operators Using that analysis this section develops a detailed life-cycle cost analysis of the 12-year 40-foot vehicles that constitute the bulk of the nationrsquos bus transit fleets This analysis is then used to identify that point in the vehicle life cycle when the sum total of all annualized costs (capital operating maintenance and rehabilitation) is minimized This minimum life-cycle cost point represents a financially optimal age to retire and replace a vehicle in effect providing a measure of ldquoeconomic useful liferdquo (as distinguished from an engineering useful life or other measure) As expected the point at which life-cycle costs are minimized can vary appreciably given differences in annual mileages average operating speeds and rehabilitation practices
Federal Transit Administration 89
Useful Life of Transit Buses and Vans Chapter 7 Final Report Life-Cycle Cost Analysis
Specifically this analysis considers the following life-cycle costs
bull Acquisition Cost and Disposal Value This includes purchase cost plus related procurement costs as well as the expected sale price or scrap value of the used vehicle
bull Expected Component Replacements and Mid-Life Overhaul Costs This includes the cost of all expected component replacements and rebuilds naturally occuring over the life of a vehicle (eg drive train rebuild) as well as the cost of any additional planned mid-life overhaul activities (if any) These costs are oriented toward the larger component replacement rebuild or rehabilitation needs and exclude the cost of minor vehicle repairs Examples include
ndash Engine and transmission rebuilds
ndash Other expected component replacements (eg brakes tires batteries suspension etc)
ndash Mid-life overhaul costs (eg repainting replacement of flooring upholstery windows body work etc)
bull Operating and Maintenance Costs This includes the cost of fuel preventative maintenance programs and all labor and parts for minor repairs as required to maintain vehicles in good working order
The following sub-sections provide an analysis of the expected annual cost of these different cost types throughout the vehicle life cycle beginning with a discussion of expected component replacement and mid-life overhaul costs
Expected Component Replacement and Mid-Life Overhaul Costs
Figure 7-4 presents the distribution of expected major component replacement and mid-life overhaul costs over a potential 20-year life cycle for a 40-foot transit bus (hence it excludes the cost of vehicle acquisition and all other vehicle operating and maintenance costs) The chart assumes a vehicle that averages 35000 miles per year over the full life cycle The chart also considers the two cases of (1) those agencies that complete an extensive mid-life overhaul and (2) those agencies that do not complete a mid-life rebuild but carry out their major component replacements on a continuous as-needed basis The analysis also assumes that the number of times a given replacementrebuild activity is performed depends on the vehiclersquos age at the time of retirement For example if engine rebuilds occur on roughly a six-year cycle (every 210000 miles) then this activity will occur once for a vehicle retired before 12 years twice for a vehicle retired before 18 years and 3 times for a vehicle retired at age 20 or later Similarly it is assumed that agencies currently pursuing a major mid-life rebuild program at vehicle age 7 (for example) would want to repeat the process again at age 14 if the vehicle was expected to operate well past that age
In reviewing Figure 7-4 it is easy to identify the timing of major vehicle replacement activities In particular the timing of the 7-year major mid-life overhaul (and its potential repetition at age 14) stands out clearly These investments include the cost of engine and transmission rebuilds repainting significant rehab and replacement of vehicle interiors (flooring upholstery and windows) bodywork as needed some electrical work and other upgrades In contrast the midshylife peaks for those agencies that do not perform a major mid-life overhaul are significantly
Federal Transit Administration 90
Useful Life of Transit Buses and Vans Chapter 7 Final Report Life-Cycle Cost Analysis
lower (fewer rehab activities equate to lower costs) but also have higher cost peaks for the intervening years (as some replacement activities tend to be more spread out) The smaller peaks primarily represent replacement of those components having shorter expected lives including tires brakes and batteries
Figure 7-4
Life Cycle Cost Profile Major Component Replacements and Overhauls
Maj
or C
ompo
nent
Rep
lace
men
ts a
nd O
verh
aul C
osts
$140000
$120000
$100000
$80000
$60000
$40000
$20000
$0
(Assumes 35000 miles per year)
Major Mid-Life Overhaul (40ft)
Continuous Rehabilitation (40 ft)
Optional (Rehab activities not
performed within 1 to 3 years of retirement)
1 2 3 4 5 6 7 8 9 10 11 12 13 14 15 16 17 18 19 20
Vehicle Age (years)
From the viewpoint of evaluating FTArsquos service-life policy the key point to note is that whether or not an agency conducts a major mid-life overhaul there are major cost cycles that are repeated throughout a vehiclersquos life cycle which are roughly concurrent with drive-train rebuilds (eg the cost peaks at roughly ages 6 to 7 and 12 to 14 in Figure 7-4) These major cycles help guide agency rehab-replacement decisionsmdashspecifically agencies will only complete a major vehicle rehabilitation initiative if they intend to keep that vehicle in service for at least three to five years after these improvements have been made For example in the case of a heavy-duty vehicle approaching 12 years in age an agency will only reinvest in that vehicle (eg rebuildreplace the engine and transmission) if the agency intends to obtain an additional three to five years of revenue service from that vehicle Otherwise these rehabilitation activities will be avoided (to save cost) and the vehicle will be retired after the minimum retirement requirements have been satisfied To summarize vehicle rehab and replacement decisions are determined by the timing of the vehiclersquos major reinvestment cycles with the timing of these cycles determined by annual vehicle mileage average operating speed and environment and agency maintenance practices
Minimum Life-Cycle Cost Analysis
Figure 7-4 above profiles the expected annual expenditures on component replacements and midshylife overhaul activities for heavy-duty vehicles for each year in the asset life cycle (including several years beyond the industry average retirement ages) In contrast the objective of this analysis is to identify that point in the asset life cycle at which the annualized value of all life-
Federal Transit Administration 91
Useful Life of Transit Buses and Vans Chapter 7 Final Report Life-Cycle Cost Analysis
cycle costsmdashincluding acquisition costs component replacement costs mid-life overhaul costs and operations and maintenance (OampM) costsmdashare minimized This minimum life-cycle cost analysis is depicted graphically in Figure 7-5 Specifically the cost values in this chart provide a measure of the average cost of ownership for a 40-foot vehicle at each vehicle age7 For example if a heavy-duty vehicle were retired at age 5 the annualized cost would be roughly $115000 (at that point regardless of whether the owner agency performs a mid-life rehab or not) Somewhere between the ages of 8 and 10 this annualized cost drops below $100000 reaching a cost minimum around a vehicle age of 14
Figure 7-5 Minimum Life Cycle Cost Profiles Including Vehicle Acquisition Major
Component Replacement Overhaul and OampM Costs
Tota
l Ann
ualiz
ed L
ife C
ycle
Cos
ts
$200000
$180000
$160000
$140000
$120000
$100000
$80000
$60000
(Assumes 35000 miles per year)
Major Mid-Life Overhaul (40 ft)
Continuous Rehabilitation (40 ft)
Minimum Life Cycle Costs
1 2 3 4 5 6 7 8 9 10 11 12 13 14 15 16 17 18 19 20
Vehicle Age (years)
The determinants for the shape of the cost curve in Figure 7-5 including the ldquoUrdquo shaped minimum are as follows First as the number of years of ownership increase a vehiclersquos acquisition cost becomes spread over an increasing number of years thus reducing the average annualized capital cost of ownership It is this decreasing annualized capital cost (the largest of all vehicle life-cycle costs) that accounts for the downward sloping curve through age 14 At the same time increasing vehicle age is also accompanied by increasing operating and maintenance costs (vehicles require more frequent repairs as they age) an effect that is captured by the slow rise in costs that becomes apparent in this chart after vehicle age 14 (Note At age 14 in this chart the savings from spreading capital costs over a greater number of service years is overtaken by the increase in annual OampM costs) Together the combined impacts of decreasing annualized capital costs and increasing operating costs as vehicle age increases yields a ldquoUrdquo shaped curve with a cost minimum Finally the bumps in this curve around ages six and seven
7 More precisely annualized cost is not the actual cost divided by the number of years of service (eg acquisition cost vehicle age) Rather annualized cost represents the stream of annual payments the net present value of which are equivalent to the initial investment cost Specifically the annualized cost of the vehicle acquisition cost for any age is given by
minus Vehicle Age )(Acquisition Cost ) (i (1minus (1+ i) ( ))
Federal Transit Administration 92
Useful Life of Transit Buses and Vans Chapter 7 Final Report Life-Cycle Cost Analysis
capture the cost of major component replacement and overhaul activities (eg drive train replacement) costs that become less apparent at later vehicle ages as they are also spread over an increasing number of years of service
This brief discussion is intended to provide a high-level overview of the application of minimum life cycle analysis to transit buses and vans A more detailed explanation and analysis can be found in Appendix D (minimum life-cycle cost methodology) Appendix E (details of the life-cycle cost analysis for heavy-duty vehicles) and Appendix F (transit vehicle life-cycle cost data)
Minimum Life-Cycle Cost Analysis Results 40-Foot Buses
The results of the minimum life-cycle cost analysis for 40-foot heavy-duty buses is presented in Table 7-1 Each row provides the age and mileage at which the minimum life-cycle cost point is reached depending on (1) the average annual vehicle mileage and (2) whether or not the vehicle undergoes agency performs a major mid-life overhaul (versus ldquocontinuous rehabilitationrdquo) For each of these six cases the minimum life-cycle cost is attained at or after the current FTA 12shyyear minimum (see below) For the single case where the cost minimum occurs right at the 12shyyear age (ie vehicles with 45000 annual miles) the cost minimum is attained at 540000 miles thus exceeding the 500000-mile minimum requirement Recall here that the average annual vehicle mileage for 40-foot buses is just over 35000 miles
Table 7-1 Minimum Life-Cycle Cost Replacement Ages
40-Foot 12-Year500000-Mile Bus
Annual Vehicle Mileage
Agency Performs Major Mid-Life Overhaul
Agency Performs Continuous Vehicle Rehabilitation
Minimum Life-Cycle Cost Age
Minimum Life-Cycle Cost Mileage
Minimum Life-Cycle Cost Age
Minimum Life-Cycle Cost Mileage
25000 16 400000 17 425000 35000 14 490000 14 490000 45000 12 540000 12 540000
The analysis in Table 7-1 considers the minimum life-cycle cost for three specific annual vehicle mileagesmdash25000 35000 (the national average) and 45000 annual vehicle miles Figure 7-6 provides the ages and life-to-date mileages at which life-cycle costs are minimized for vehicles traveling between 20000 and 70000 miles annually The solid bars and left-side axis present the ages at which life-cycle costs are minimized for this range of annual vehicle mileages The solid line and right-hand axis present the life-to-date mileages at which life-cycle costs are minimized
Review of Figure 7-6 suggests that from a cost-effectiveness perspective FTArsquos current retirement minimums (for large buses) of 12 years or 500000 miles represent reasonable choices For all annual vehicle mileages the minimum cost point is attained at either an age or mileage that exceeds one or both of the FTA minimums for these measures In all cases the difference between one and both of the current FTA minimum requirements also provides some
Federal Transit Administration 93
Useful Life of Transit Buses and Vans Chapter 7 Final Report Life-Cycle Cost Analysis
margin for the early retirement of vehicles with reliability problems For example vehicles traveling an average of 40000 miles per year could reach their cost minimums at age 13 and a LTD (life to date) mileage of 520000 miles Hence this provides a ldquomarginrdquo of one year or 20000 miles of optimal service beyond the FTA minimum for an average vehicle or the option to reduce service life by these amounts for less reliable vehicles Moreover this difference between the 12-year and 500000-mile minimum is smallest (while still providing a meaningful early retirement margin) for vehicles that average between 30000 and 45000 miles of travel per year Together these vehicles account for more than 70 percent of the nationrsquos large buses
Figure 7-6
Age and Mileage at Which Life-Cycle Cost Is Minimized (Single Mid-Life Rehabilitation or Single Drive Train Replacement)
20
20000 25000 30000 35000 40000 45000 50000 55000 60000 65000 70000
Average Annual Mileage
Age Minimum Life Cost is Attained Life to Date Miles Minimum Life Cost is Attained
FTA Mileage Minimum
FTA Age Minimum
Average Annual Mileage
700000
18 600000
16
500000 14
12 400000
10
300000 8
6 200000
4 100000
2
0 0
Vehi
cle
Age
Life
-Cyc
le C
ost I
sM
inim
ized
(Yea
rs)
Vehicle LTD M
iles Life-Cycle
Cost Is M
inimized
Other Bus and Van Types
The preceding analysis has focused entirely on the life-cycle cost attributes of a standard 12shyyear 40-foot bus This section provides a summary analysis of all remaining bus and van types (with their current FTA retirement minimums) including bull Articulated buses (12-year 500000-LTD-mile minimum) bull Heavy-duty small buses (10-year 350000-LTD-mile minimum) bull Medium-duty small buses (7-year 200000-LTD-mile minimum) bull Light-duty mid-size buses and vans (5-year 150000-LTD-mile minimum) bull Light-duty small buses and vans (4-year 100000-LTD-mile minimum)
This analysis is founded on both data collected for this study as well as data available from similar analyses (including an analysis of small and medium-sized bus operators located in downstate Illinois) Again while these data sources have provided good quality vehicle
Federal Transit Administration 94
Useful Life of Transit Buses and Vans Chapter 7 Final Report Life-Cycle Cost Analysis
purchase and rehabilitation cost data the sources lack depth It is recommended that future useful-life studies devote increased resources to ensure a more robust data sample
Articulated Buses
Table 7-2 presents the ages and LTD mileages at which life-cycle costs for articulated buses reach their minimum Here each row provides the age and mileage at which the minimum life-cycle cost point is reached depending on the average annual vehicle mileage and on whether or not the agency performs a major mid-life overhaul (versus ldquocontinuous rehabilitationrdquo) Overall the minimum cost ages and mileages as well as the optimal overhaulrebuild assumptions are the same for articulated buses as that found for 40-foot buses
Table 7-2 Articulated Bus (60 Foot) ndash Minimum Life-Cycle Cost Replacement Ages
Annual Vehicle Mileage
Agency Performs Major Mid-Life Overhaul
Agency Performs Continuous Vehicle Rehabilitation
Minimum Life-Cycle Cost Age
Minimum Life-Cycle Cost
Mileage Minimum Life-Cycle Cost Age
Minimum Life-Cycle Cost
Mileage
25000 19 475000 17 425000 35000 14 490000 14 490000 45000 12 540000 12 540000
Figure 7-7 Age and Mileage at Which Life-Cycle Cost Is Minimized
Articulated Bus
Age
Life
-Cyc
le C
ost I
s
Min
imiz
ed (Y
ears
)
18
16
14
12
10
8
6
4
2
0
FTA Mileage Minimum
FTA Age Minimum
Average Annual Mileage 600000
500000
400000
300000
200000
100000
0
LTD Miles Life-C
ycle Cost Is M
inimized
25000 35000 45000
Average Annual Mileage Age Minimum Life Cost is Attained Life to Date Miles Minimum Life Cost is Attained
Figure 7-7 charts the results from Table 7-2 along with the current FTA minimum age and mileage requirements This chart suggests that FTArsquos current age and mileage minimums are appropriate when assessed from the viewpoint of minimizing total life-cycle costs This is based on the fact that (1) all vehicles regardless of annual average mileage attain their minimum life-cycle point at an age or LTD mileage that exceeds the existing FTA minimums and (2) in all
Federal Transit Administration 95
Useful Life of Transit Buses and Vans Chapter 7 Final Report Life-Cycle Cost Analysis
cases the current FTA age and mileage minimums provide a margin for early retirement of problem vehicles (ie vehicles with above average expenses andor reliability issues) Note that the national average annual mileage for US articulated buses is 31900 miles per year
Heavy-Duty Small Buses (10-year 350000-LTD-mile minimum)
Table 7-3 presents the ages and LTD mileages at which life-cycle costs for small heavy-duty buses reach their minimum Similarly Figure 7-8 charts the results from Table 7-3 along with the current FTA minimum age and mileage requirements This analysis again suggests that FTArsquos current age and mileage minimums are appropriate when assessed from the viewpoint of minimizing total life-cycle costs Again all vehicles regardless of annual average mileage attain their minimum life-cycle point at an age andor LTD mileage that exceeds the existing FTA minimums and in all cases the current FTA age and mileage minimums provide a margin for early retirement of problem vehicles The national average annual mileage for US heavy-duty small buses is 35400 miles per year
Table 7-3 10-Year Heavy-Duty Small Bus ndash
Minimum Life-Cycle Cost Replacement Ages
Annual Vehicle Mileage
Agency Performs Continuous Vehicle Rehabilitation
Minimum Cost Age Minimum Cost Mileage
Full Drive Train Replacement
25000 12 300000 No 35000 11 385000 Yes 45000 11 495000 Yes
The analysis selects the minimum cost age and mileage for that drive train replacement option (ie replace or do not replace) that provides the lowest minimum total life-cycle cost
Figure 7-8 Age and Mileage at Which Life-Cycle Cost Is Minimized
Heavy-Duty Small Buses
0
2
4
6
8
10
12
14
Age
Life
-Cyc
le C
ost I
sM
inim
ized
(Yea
rs)
0
100000
200000
300000
400000
500000
600000
LTD Miles Life-Cycle
Cost Is Minim
ized
FTA Mileage Minimum
FTA Age Minimum
Average Annual Mileage
25000 35000 45000
Average Annual Mileage Age Minimum Life Cost is Attained Life to Date Miles Minimum Life Cost is Attained
Federal Transit Administration 96
Useful Life of Transit Buses and Vans Chapter 7 Final Report Life-Cycle Cost Analysis
Medium-Duty Small Buses (7-year 200000-LTD-mile minimum)
Table 7-4 presents the ages and LTD mileages at which life-cycle costs for small medium-duty buses reach their minimum while Figure 7-9 charts these results along with the current FTA minimum age and mileage requirements As with the larger vehicle types this analysis finds that (1) all vehicles regardless of annual average mileage attain their minimum life-cycle point at an age andor LTD mileage that exceeds the existing FTA minimums and (2) in all cases the current FTA age and mileage minimums provide a margin for early retirement of problem vehicles
Table 7-4 7-Year Medium-Duty Small Bus ndash
Minimum Life-Cycle Cost Replacement Points
Annual Vehicle Mileage
Agency Performs Continuous Vehicle Rehabilitation
Minimum Cost Age Minimum Cost Mileage
Full Drive Train Replacement
25000 9 225000 No 35000 8 280000 Yes 45000 7 315000 Yes
The analysis selects the minimum cost age and mileage for the drive train replacement option (ie replace or do not replace) that provides the lowest minimum total life-cycle cost
Figure 7-9 Age and Mileage at Which Life-Cycle Cost Is Minimized
Medium-Duty Small Bus
0
1
2
3
4
5 6
7
8
9
10
Age
Life
-Cyc
le C
ost I
sM
inim
ized
(Yea
rs)
0
50000
100000
150000
200000
250000
300000
350000
LTD Miles Life-Cycle
Cost Is Minim
ized
FTA Mileage Minimum
FTA Age Minimum
Average Annual Mileage
25000 35000 45000
Average Annual Mileage Age Minimum Life Cost is Attained Life to Date Miles Minimum Life Cost is Attained
One difference here is the fact that minimum life-cycle cost points for all three of the annual vehicle mileage groupings considered here (25000 35000 and 45000 miles per year) meet or exceed both the current FTA minimum age requirement and the current minimum LTD mileage requirement Despite this observation there does not appear to be significant justification for revising the existing FTA minimums (ie using minimum life-cycle cost as a criterion) The national average annual mileage for medium-duty small buses is 32800 miles per year
Federal Transit Administration 97
Useful Life of Transit Buses and Vans Chapter 7 Final Report Life-Cycle Cost Analysis
Light-Duty Mid-Size Buses and Vans (5-year 150000-LTD-mile minimum)
Table 7-5 presents the ages and LTD mileages at which life-cycle costs for light-duty mid-size buses and vans reach their minimum while Figure 7-10 charts the results for these vehicles along with their current FTA minimum age and mileage requirements (Note here that the annual vehicle miles of travel groupings have all dropped by 5000 miles as compared to the prior charts reflecting the lower average annual mileages for light-duty vehicle types)
Table 7-5 5-Year Light-Duty Mid-Size Buses and Vans ndash Minimum Life-Cycle Cost Replacement Points
Annual Vehicle Mileage
Agency Performs Continuous Vehicle Rehabilitation
Minimum Cost Age Minimum Cost Mileage
Full Drive Train Replacement
20000 7 140000 No 30000 6 180000 No 40000 5 200000 No
This analysis selects the minimum cost age and mileage for the drive train replacement option (ie replace or do not replace) that provides the lowest minimum total life-cycle cost
Figure 7-10 Age and Mileage at Which Life-Cycle Cost Is Minimized
Light-Duty Medium-Size Buses and Vans
0
1
2
3
4
5
6
7
8
Age
Life
-Cyc
le C
ost I
sM
inim
ized
(Yea
rs)
0
50000
100000
150000
200000
250000
LTD Miles Life-Cycle
Cost Is Minim
ized
FTA Mileage Minimum
FTA Age Minimum
Average Annual Mileage
20000 30000 40000
Average Annual Mileage Age Minimum Life Cost is Attained Life to Date Miles Minimum Life Cost is Attained
As before this analysis finds that (1) all vehicles regardless of annual average mileage attain their minimum life-cycle point at an age andor LTD mileage that exceeds the existing FTA minimums and (2) in all cases the current FTA age and mileage minimums provide a margin for early retirement of problem vehicles Compared to the vehicle types considered above one difference here is that the minimum cost ages and mileages for all vehicle types (based on this analysis) are associated with the scenario where there is no engine replacement over the life of
Federal Transit Administration 98
Useful Life of Transit Buses and Vans Chapter 7 Final Report Life-Cycle Cost Analysis
the vehicle (in contrast for the vehicle types considered above the lowest life-cycle cost points for vehicles with average and higher annual mileages were associated with the full drive-train replacement option) The national average annual mileage for light-duty mid-size buses and vans is 29500 miles per year
Light-Duty Small Buses and Vans (4-year 100000-LTD-mile minimum)
Table 7-6 presents the ages and LTD mileages at which life-cycle costs for light-duty small buses and vans reach their minimum while Figure 7-11 charts this information along with the FTA minimum age and mileage requirements Again this analysis finds that (1) all vehicles regardless of annual average mileage attain their minimum life-cycle point at an age andor LTD mileage that exceeds the existing FTA minimums and (2) in all cases the current FTA age and mileage minimums provide a margin for early retirement of problem vehicles Each of the three vehicle mileage examples (20000 30000 and 40000 per year) has minimum life-cycle cost mileages that exceed the FTA minimum retirement requirement of 100000 LTD miles The national average annual mileage for light-duty small buses and vans is 28500 miles per year
Table 7-6 4-Year Light-Duty Small Buses and Vans ndash
Minimum Life-Cycle Cost Replacement Points Annual Vehicle Mileage
Agency Performs Continuous Vehicle Rehabilitation
Minimum Cost Age Minimum Cost Mileage Full Drive Train Replacement
20000 6 120000 No 30000 5 150000 No 40000 4 160000 No
This analysis selects the minimum cost age and mileage for that drive-train replacement option (ie replace or do not replace) that provides the lowest minimum total life-cycle cost
Figure 7-11 Age and Mileage at Which Life-Cycle Cost Is Minimized
Light-Duty Small-Size Buses and Vans
0
1
2
3
4
5
6
7
Age
Life
-Cyc
le C
ost I
s M
inim
ized
(Yea
rs)
0
20000
40000
60000
80000
100000 120000
140000
160000
180000
200000
LTD Miles Life-C
ycle Cost Is M
inimized
FTA Mileage Minimum
FTA Age Minimum
Average Annual Mileage
20000 30000 40000
Average Annual Mileage Age Minimum Life Cost is Attained Life to Date Miles Minimum Life Cost is Attained
Federal Transit Administration 99
Useful Life of Transit Buses and Vans Chapter 7 Final Report Life-Cycle Cost Analysis
Life-Cycle Cost Analyses of Changes to FTArsquos Service-life Policy
In addition to identifying the financially optimal retirement point for each bus and van category a related study objective was to consider other potential financial implications of or changes to FTArsquos minimum service-life policy Specifically this includes finding answers to the following questions
bull How would an increase or decrease in FTArsquos minimum service-life requirements impact transit industry finances including annual replacement expenditures and agency operating costs
bull How does the continuing addition of new technologies affect the financially optimal useful life
The following sub-sections consider each of these questions
Financial Impacts of More and Less Frequent Bus Replacement Industry Perspective
This sub-section seeks to answer the first question from the perspective of the transit industry as a whole Specifically how would an increase or decrease in FTArsquos minimum service-life requirements affect vehicle replacement at the industry level The analysis first considers the case of a two-year reduction in the FTA minimum service-life requirements for large heavy-duty buses (ie from 12 to 10 years) and then repeats this analysis for a two-year increase in the minimum age requirements for that vehicle type (from 12 to 14 years) The impact of these changes from the agency perspective is considered in the next sub-section
Reduction in Minimum Life from 12 to 10 Years As discussed in prior sections of this report very few of the nationrsquos transit operators are likely to reduce their current vehicle retirement ages if FTA were to reduce the current retirement minimums by one or two years This is because the vast majority of the nationrsquos operators retire their heavy-duty buses two to four years after the retirement minimums have been reached due to financial constraints Hence any reduction in FTArsquos minimum useful life would only impact those few operators whose retirement decisions are in fact constrained by the existing service-life policy and the resulting industry-wide cost impact of that change would be very small
To emphasize this point refer back to Figure 4-1 Based on the analysis presented there roughly 6 percent and potentially as much as 10 percent of all retirements for heavy-duty buses occur right at vehicle age 12 This translates to an average of roughly 200 to 300 vehicle retirements per year for which the time of retirement is potentially constrained by FTArsquos minimum life requirements Suppose now that the minimum retirement age for heavy-duty buses was reduced two years (ie from 12 to 10 years) Assuming that all vehicles currently retired right at the current 12-year minimum shifted to the new 10-year minimum (an unlikely event as some of these operators will also face funding constraints or state and local minimum life requirements) then the long-term average annual replacement rates for these operators would increase from 200 to 300 vehicles annually to 240 to 360 vehicles annually an increase of 40 to 60 additional
Federal Transit Administration 100
Useful Life of Transit Buses and Vans Chapter 7 Final Report Life-Cycle Cost Analysis
vehicles per year8 Given that deliveries of new buses have averaged roughly 3000 per year over the past decade and the industryrsquos estimated total vehicle production capacity of 7500 to 10000 vehicles the addition of 40 to 60 additional new vehicles resulting from a two-year reduction in the heavy-duty vehicle minimum life requirement is far from significant
Increase in Minimum Life from 12 to 14 Years In contrast an increase in the minimum retirement age would force about 825 annual vehicle retirements (roughly 20 percent of the total) to be postponed by one or two years Assuming that all vehicles currently retired at age 12 or 13 would now be retired at the new 14-year minimum the long-term average annual replacement rates for these operators would decrease from roughly 825 vehicles annually to roughly 700 vehicles annually a decrease of 125 vehicles per year9
Once again the impact of this change on an industry that delivers roughly 3000 per year is not significant It is critical to understand however if the minimum life were extended past 14 years of age (eg to ages 15 16 or more) the impact on the industry would quickly become very significant particularly for vehicle manufacturers
Financial Impacts of More and Less Frequent Bus Replacement Agency Perspective
Consider the impact now from the viewpoint of an individual transit operator that currently retires its vehicles at 12 years of age and would reduce that retirement age to 10 years if permitted by FTA policy Here earlier vehicle retirement would increase that agencyrsquos vehicle-related capital costs but would also reduce the agencyrsquos operating costs (as newer vehicles require less maintenance) What then would be the net impact of this two-year reduction in FTArsquos replacement age minimum for operators of this type Table 7-7 answers this question using the life-cycle cost analysis discussed in the preceding sections of this chapter Specifically this analysis shows the annualized costs of capital and major component replacement costs and operating and maintenance costs for retirement at ages 12 and 10 and the differences in these costs As expected earlier retirement increases annualized capital and component costs and decreases annualized operating costs The net impact is a $3600 increase in annualized costs from retiring at age 10 versus age 12 Roughly speaking this implies that the total annual cost of vehicle operationsmdashincluding capital major component replacement and OampM costs (and taking discounting into effect)mdashwould be roughly $3600 higher for agencies retiring their vehicles at age 10 than for those retiring their vehicles at age 12 This amounts to more than a four percent increase in annual vehicle-related costs
8 This analysis excludes the initial ldquobumprdquo in vehicle replacements of roughly 400 to 600 vehicles that would occur in the first year the policy took effect
9 This analysis excludes the initial postponement of roughly 800 or more vehicles that would occur in the first two years the policy took effect
Federal Transit Administration 101
Useful Life of Transit Buses and Vans Chapter 7 Final Report Life-Cycle Cost Analysis
Table 7-7 Annualized Vehicle Costs ndash Large Heavy-Duty Bus
Per Vehicle Impact of Reducing Vehicle Retirement Age from 12 to 10 Years
Cost Element Annualized Costs for Retirement at Age 12 Age 10 Change
Capital Costs and Major Component Replacement Costs $60700 $66300 + $5600
Operating and Maintenance Costs $27000 $25000 - $2000 Total $87700 $91300 + $3600
Assumes vehicle averaging 35000 miles per year
What then would be the impact of increasing the minimum retirement age for heavy-duty vehicles from 12 to 14 years (for example) The answer to this question is addressed in Table 7-8 Later retirement decreases annualized capital and component costs and increases annualized operating costs The net impact is a $2800 decrease in annualized costs from retiring at age 14 versus age 12 Roughly speaking this implies that the total annual cost of vehicle operations would be roughly $2800 lower for agencies retiring their vehicles at age 14 than for those retiring their vehicles at age 12 This amounts to more than a three-percent drop in annual vehicle-related costs
Table 7-8 Annualized Vehicle Costs ndash Large Heavy-Duty Bus
Per Vehicle Impact of Increasing Vehicle Retirement Age From 12 to 14 Years
Cost Element Annualized Costs for Retirement at Age 12 Age 14 Change
Capital Costs and Major Component Replacement Costs $60700 $55700 - $5000
Operating and Maintenance Costs $27000 $29200 + $2100 Total $87700 $84900 - $2800
Assumes vehicle averaging 35000 miles per year
Impact of New Bus Technologies on the Financially Optimal Retirement Age
The next question to be addressed is How does the continuing addition of new technologies affect the financially optimal useful life In considering this question it is important to understand that any increase in vehicle capital costs will tend to increase the financially optimal retirement age while any increase in operating and maintenance costs will tend to decrease the optimal retirement age The net change depends on which of these two impacts is larger This interaction is presented in Figure 7-12
With respect to new technologies such as AVL APCs voice annunciation security cameras and collision avoidance systems the increase in vehicle purchase price is dependent on which specific technologies are included in a new bus specification Adding most or all of these components can be expected to increase the price of the bus by roughly $30000 to $50000 Assuming these technology components have life cycles comparable to that of the bus itself yields a roughly 10-percent to 15-percent increase in the annualized vehicle capital cost In the absence of any change to operating costs the life-cycle analysis shows that this increase does not
Federal Transit Administration 102
Useful Life of Transit Buses and Vans Chapter 7 Final Report Life-Cycle Cost Analysis
impact the optimal vehicle retirement age In fact vehicle capital cost needs to increase by up to $200000 to alter the financially optimal retirement age by even one year (upward)10
Figure 7-12 Impact of Changes in Capital and Operating Costs on Minimum Life-Cycle Cost
Increase in Purchase and Operating Costs
$000
$050
$100
$150
$200
$250
100000 200000 300000 400000 500000 600000 700000 800000 Vehicle Age
Cos
t Per
Mile
Capital OampM
Change in Optimal Useful Life
Increase in Vehicle Purchase Cost
$000
$050
$100
$150
$200
$250
100000 200000 300000 400000 500000 600000 700000 800000 Vehicle Age
Cos
t Per
Mile
Capital (Old) Capital (New) OampM Costs
Increase in Optimal Useful Life
Increase in Purchase Cost
Increase in Vehicle Operating Costs
$000
$050
$100
$150
$200
$250
100000 200000 30 0 700000 800000 Vehicle Age
Cos
t Per
Mile
0000 400000 500000 60000
Capital OampM Costs (Old) OampM Costs (New)
Decrease in Optimal Useful Life
Increase in OampM Costs
Similarly operators investing in these new technologies now anticipate increased costs to maintain these new systems (either directly by operator staff or through vendor maintenance agreements) Even if it is assumed that these costs add 20 percent to annual vehicle OampM costs (a rather conservative assumption) there is still no impact on the optimal retirement ages identified earlier in this chapter However the key unknown in this analysis is how these operating costs change with time Most agencies anticipate that these new technologies will begin to fail at an increasing rate as the vehicle approaches 12 or more years of revenue service With multiple systems in place these failures may have significant impacts on an agencyrsquos ability to make their peak-period pullout requirements However none of these systems has been in place for a sufficiently long time to have reliable cost data for these systems at the more advanced bus ages (ie age 12 or higher) It can be noted however that based on the cost analysis performed for this study vehicle OampM costs would need to increase by more than one-third before the cost impact of these new technologies would alter the financially optimal retirement age by even one year (downward)
10 This because of the very flat shape of the annualized capital cost curve
Federal Transit Administration 103
Useful Life of Transit Buses and Vans Chapter 7 Final Report Life-Cycle Cost Analysis
Vehicle Physical Condition versus Minimum Cost Retirement Age
Heavy-Duty Large Buses
The analysis above considers the point in the asset life cycle at which annualized life-cycle costs are minimized This provides an assessment of useful life based entirely on cost effectiveness and hence without reference to vehicle condition or quality of service In contrast to this approach Figure 7-13 presents measures of vehicle physical condition (and by association vehicle quality of service ldquoesthetic qualityrdquo reliability and potentially safety) as a function of vehicle age for medium- to large-size transit buses (ie 35 to 60 feet) This bus condition-decay curve was developed for FTArsquos TERM model and the details of this process were presented at the end of the last chapter The scale ranges from a perfect score of 50 (excellent) to 40 (good) 30 (adequate) 20 (substandard) and 10 (poor) In practice most agencies retire their large buses somewhere between the conditions 20 to 30
Within Figure 7-13 the solid center line represents the average physical condition of vehicles with roughly 35000 in annual mileage (and average maintenance practices) The upper line represents the projected condition of vehicles with lesser mileage (25000 miles per year) while the lower dotted line represents those with above-average mileage (45000 miles per year) Unlike the minimum life-cycle cost analysis above there is no obvious point at which vehicles should be retired Rather vehicle decay is a gradual decline in physical condition where the selection of a specific retirement point is necessarily arbitrary
Figure 7-13
Bus Physical Condition Versus Age 50
45
40
35
30
25
20
15
10
35000 miles per year
25000 miles per year
45000 miles per year
Vehicle Condition at Minimum Life-Cycle Cost
0 1 2 3 4 5 6 7 8 9 10 11 12 13 14 15 16 17 18 19 20 21
Vehicle Age (Years)
Phys
ical
Con
ditio
n
Federal Transit Administration 104
Useful Life of Transit Buses and Vans Chapter 7 Final Report Life-Cycle Cost Analysis
However when the minimum life-cycle ages are plotted on Figure 7-13 (as red circles) these retirement points are located at reasonable condition valuesmdashafter vehicle condition begins to decline below ldquoadequaterdquo (30) but before the vehicle attains the ldquosubstandardrdquo designation (20) The lower condition value for vehicles with higher mileages (ie condition of the 35000 annual mileage vehicle at minimum life-cycle cost is higher than that of the 45000 annual mileage vehicle) is a reflection of the higher LTD mileages attained by these vehicles at the minimum cost points (ie 425000 miles for vehicles traveling 25000 miles per year 490000 miles for vehicles traveling 35000 miles per year and 540000 miles for vehicles traveling 45000 miles per year)
For the viewpoint of reconsidering vehicle useful life and FTArsquos minimum life requirements this cross-referencing of the minimum life-cycle cost and condition model approaches suggest that the minimum life-cycle cost ages (and mileages) represent reasonable optimal retirement ages (both in terms of cost-effectiveness and retirement occurring at a reasonable condition value) More importantly these optimal retirement ages (and some mileages) occur after the current FTA-required retirement minimums of 12 years or 500000 miles is satisfied Conversely the current FTA retirement minimums provide some margin for the early retirement of lower-reliability vehicles
All Bus and Van Categories
Figure 7-14 identifies the condition values at which all bus and van vehicle categories attain their minimum life-cycle cost based on total LTD mileage (and not age) As with Figure 7-13 this chart also indicates the differing condition values at the minimum cost point within a given vehicle type (eg heavy-duty small bus) Specifically the blue circles indicate the mileage and condition at which minimum life-cycle cost is attained for vehicles with low average annual mileage for that specific vehicle type The yellow and red circles capture the same mileages and conditions for vehicles with average and high annual mileages respectively
As in Figure 7-13 the minimum life-cycle cost points for the three average annual mileage scenarios all occur at condition values less than adequate but typically well above substandard Hence all these retirement points are ldquologicalrdquo in that they occur after the vehiclersquos condition has begun to show signs of age but before the vehicle begins to experience significant quality of service reliability or potential safety issues (as is expected for vehicles with condition ratings less than 20 or ldquosubstandardrdquo) Again it is important to emphasize that the points represented here are founded on the objective of minimizing total life-cycle cost In practice different transit operators or the federal and state governments may wish to target useful-life standards based on other objective criteria (eg a minimum quality of service)
Federal Transit Administration 105
Useful Life of Transit Buses and Vans Chapter 7 Final Report Life-Cycle Cost Analysis
Figure 7-14
Condition At Which Minimum Life-Cycle Cost is Attained
10
15
20
25
30
35
40
45
50
0 100000 200000 300000 400000 500000 600000 700000
Life-to-Date Miles
Phys
ical
Con
ditio
n
Heavy-Duty Large Bus (12 year)
Heavy-Duty Small Bus (10 year)
Medium-Duty and Purpose Built (7 year)
Light-Duty Mid-Size BusVan (5 year)
Light-Duty Small Bus Van (4 year)
Excellent
Good
Adequate
Substandard
Poor
= Low annual milage vehicle
= Average annual milage vehicle
= High annual milage vehicle
Condition at Which Minimum Life-Cycle Cost is Attained For
Vehicle Age Service Reliability and Ridership
While transit riders are known to have a clearly stated preference for newer cleaner transit vehicles the study team was unable to identify any empirically based studies providing a quantitative relationship between vehicle age (or condition) and vehicle ridership This despite the very extensive literature on the responsiveness of travel demand to many different factors (including elasticities for service price service frequency and travel time and cross elasticities for gas and differences in travel time) Hence while the qualitative response to newer vehicles is well documented (ie riders prefer newer vehicles and state that they are more apt to use transit given a newer cleaner fleet) the quantitative ridership response to changes in fleet age or condition are not well documented Given the lack of information on this subject the study has focused on the direct ridership impacts of decreasing vehicle reliability with vehicle age as a means of addressing the issue of the ridership response to changes in vehicle condition
Road Calls
As bus vehicles age the probability of mechanical failures increases leading ultimately to increased service disruptions for system riders Figure 7-15 demonstrates the relationship between vehicle age and the number of road calls per vehicle mile (the inverse of mean distance between failures) for full-size transit buses This relationship was developed using actual road call data from a sample of five US transit operators11 Each point on this chart represents the average failure rate (over a 12-month period) for all vehicles in a given sub-fleet for one of these operators For this analysis a road call was defined as an in-service failure causing a vehicle to
11 At the request of these operators their names have been excluded from this presentation
Federal Transit Administration 106
Useful Life of Transit Buses and Vans Chapter 7 Final Report Life-Cycle Cost Analysis
be pulled from service (and hence resulting in a service disruption for system riders) The estimated relationship clearly captures the increasing likelihood of in-service failures as bus vehicle age increases The surrounding data points similarly capture the wide variability in vehicle reliability resulting from both differences in the inherent reliability of different vehicle models differences in service environment and differences in vehicle maintenance practices
Figure 7-15
Road Calls Per Mile (Agency Sub-Fleets)
00000
00001
00002
00003
00004
00005
00006
0 2 4 6 8 10 12 14 16 18 20 Vehicle Age (Years)
Roa
d C
alls
Per
Mile
As with the presentation of declining condition above this analysis does not suggest a specific point in the asset life cycle at which bus vehicles should be retired (note also that the repair costs associated with these in-service failures are already captured in the minimum life-cycle cost analysis above) However this analysis does emphasize the negative service reliability implications of increasing fleet age
Vehicle Age Reliability and Ridership
As transit buses age their appearance and ride quality typically decline with potential negative impacts for system ridership (ie some riders may select an alternative to buses if bus vehicle condition falls below some acceptable threshold) Unfortunately no prior research has been identified that assesses the impact of fleet age on system ridership12 However from the relationship presented in Figure 7-15 it is clear that increasing vehicle age does lead to an increased frequency of road calls and consequently to service disruptions for the sub-group of riders impacted by those road calls Figure 7-16 uses the vehicle age and road calls relationship presented in Figure 7-15 to estimate the annual number of riders directly impacted by bus service failures for agencies with fleets of various sizes (ie 100 500 and 1000 buses) These
12 The study team conducted a statistical analysis specifically for this project comparing average vehicle loadings with average fleet age using NTD data to determine whether increasing average fleet has any impact on system ridership This analysis did not identify a statistically significant relationship between these two measures
Federal Transit Administration 107
Useful Life of Transit Buses and Vans Chapter 7 Final Report Life-Cycle Cost Analysis
calculations assume an average annual vehicle mileage for these fleets of 35000 miles per bus They also assume an average bus passenger load of 68 riders (hence on average 68 riders are directly impacted by each road call or service disruption event)13 This chart shows that increasing fleet age clearly has a significant impact on the number of riders experiencing a road call event especially for the nationrsquos larger operators
Figure 7-16 presents the total number of riders impacted by road calls for differing average fleet ages However we must also address the incremental impact of a one-year increase in average fleet age Table 7-9 presents this incremental ridership impact for a range of fleet sizes and annual vehicle mileages per vehicle As expected the incremental numbers of riders impacted by road calls from increasing fleet age is highest for the larger transit operators and those with the highest annual mileage per vehicle
Figure 7-16
Number of Riders Impacted By Road Calls by Average Fleet Age
0
10000
20000
30000
40000
50000
60000
70000
80000
90000
100000
0 1 2 3 4 5 6 7 8 9 10 11 12 13 14 15 16 17 18 19 20
Average Fleet Age (Years)
Ave
rage
Ann
ual N
umbe
r of R
ider
s Im
pact
ed b
y B
us R
oad
Cal
ls
100 Vehicle Fleet 500 Vehicle Fleet 1000 Vehicle Fleet
Table 7-9 Incremental Increase in Annual Number of Riders Impacted By Road Calls from One-Year Increase in Average Fleet Age
Annual Vehicle Mileage Fleet Size 100 Vehicles 500 Vehicles 1000 Vehicles 25000 miles 225 1120 2245 35000 miles 320 1610 3220 45000 miles 565 2823 5645
The final consideration here is the ridership impact of declining service reliability with increasing fleet age If it is assumed that road call andor service disruption events motivate riders to abandon buses in favor of an alternative mode perceived to be more reliable (eg auto) then the numbers in Table 7-9 estimate the maximum potential ridership loss from an increase in
13 The average passenger load of 68 persons represents the average for all US bus fleets reporting to NTD
Federal Transit Administration 108
Useful Life of Transit Buses and Vans Chapter 7 Final Report Life-Cycle Cost Analysis
service failures due to a one-year increase in average fleet age However in most transit markets a significant proportion of bus riders have no viable alternative to bus and hence are unlikely to discontinue bus use after having experienced a road-call event Hence it can be assumed that the actual loss in ridership resulting from increasing in-service failures with increasing fleet age is much smaller than that presented in the table above
From the viewpoint of FTArsquos minimum service life policy the implications are as follows First it has been noted repeatedly throughout this report that very few agenciesrsquo retirement decisions are constrained by the current FTA minimums (retirements that generally occur two or more years after the retirement minimums have been satisfied and the timing of which has been determined by funding constraints) Given this situation it is unlikely that a decrease in the FTA retirement minimums would impact service reliability service quality ridersrsquo transit experiences or actual ridership levels In contrast an increase in the FTA retirement minimums would begin to constrain the vehicle retirement decisions of some transit operators by forcing them to maintain their transit vehicles for a longer period of time (see Figure 4-1) In this case the increase to the minimum retirement ages would negatively impact service quality service reliability riderrsquos transit experiences and potentially actual ridership levels
Federal Transit Administration 109
Useful Life of Transit Buses and Vans Chapter 8 Final Report Prior Useful-life reviews
CHAPTER 8 PRIOR BUS USEFUL-LIFE REVIEWS
This section reviews the results of prior useful-life research conducted by FTA and the Transit Cooperative Research Program (TCRP)
Initial Policy Statement ndash FTA Circular 90301
On June 17 1985 FTA (at that time UMTA) issued a change to its FTA Circular 90301 that incorporated the service-life policy for transit buses This marked the official public announcement of the FTArsquos position on the issue which required transit authorities to operate heavy-duty transit buses for a minimum of 12 years or 500000 miles with a maximum fleet-wide spare ratio of 20 percent FTA officials interviewed during the development of this study stated that the 12-year service-life requirement was not based on any detailed study Rather it was selected based on industryrsquos operating experience or ldquorules of thumbrdquo in maintaining heavy-duty transit buses
1985 Inspector General Statement
The 12-year requirement announced in the FTArsquos circular was not without controversy Later that same year the Inspector General (IG) unsuccessfully challenged the minimum service life policy attempting to increase the service life from 12 to 15 years and increase the spare ratio from 20 to 30 percent
1988 Useful Life of Transit Vehicles Study
In 1988 the FTA sponsored a study entitled ldquoUseful Life of Transit Vehiclesrdquo (UMTA-IT-06shy0322-88-1) This study focused primarily on the mechanical or engineering life of transit buses It excluded other factors such as the economic life ridership impacts and technological obsolescence of the vehicle The engineering analysis was focused on the life expectancy of the vehicle and components and not on any measure of vehicle condition
The key findings of this study were that the availability of capital funds and the FTA 12-year minimum were the main drivers of bus replacement decisions that the average age of retirements was over 16 years and that spare ratios of 20 percent were achievable with good maintenance Recommendations included increasing the minimum requirements to at least 14 years (600000 miles for commuter buses) allowing justified exceptions to the policy and developing a funding policy that encourages the extension of buses beyond their minimum life requirements
The earlier finding that the availability of capital funds is a key driver of fleet retirement decisions is consistent with the findings presented in this report In contrast while the 1987 study identified the 12-year minimums as a primary driver of replacement decisions for heavy-duty vehicles agencies participating in this study rarely referred to the minimums as a decision driver Rather for the current study agency participants suggested that replacement decisions were driven more by funding availability maintenance requirements and quality of service issues
Federal Transit Administration 110
Useful Life of Transit Buses and Vans Chapter 8 Final Report Prior Useful-life reviews
1988 Transit Capital Investment to Reduce Operating Deficits ndash Alternative Bus Replacement Strategies Study
In 1988 a study entitled ldquoTransit Capital Investments to Reduce Operating Deficits ndash Alternative Bus Replacement Strategiesrdquo (National Cooperative Transit Research and Development Program (NCTRP) Report No 15) surveyed several transit agencies to identify the major factors in current and planned bus replacement decisions The survey found that the availability of federal funds and vehicle age are among the top considerations while operating and maintenance cost reductions are typically not considered a driver for vehicle replacement At that time the average planned replacement age for heavy-duty buses for agencies participating in this study was 16 Funding constraints were a major factor in the plans to maintain vehicles in service for this length of time
The 1988 NCTRP Report also looked at the relationship between vehicle age and various components of operating and maintenance costs such as fuel and lubrication engine repairs AC and brakes A key objective of this study was to develop a methodology to incorporate operating costs in vehicle replacement decisions This is based on the studyrsquos hypothesis that the timing and extent of maintenance work affects the retirement age of a vehicle and the retirement decision affects the need for major work The actual study analysis was limited by data availability although the researchers did find a strong correlation between vehicle age and vehicle maintenance and rehabilitation costs The methodology developed by this study was designed to guide transit managers in evaluating the trade-offs between continuing to operate an existing vehicle ldquoas isrdquo replacing it or significantly rehabilitating it
1995 Bus Industry Summit
On September 22 1995 FTA convened a Bus Industry Summit to identify and discuss industry concerns related to FTArsquos bus service-life policy The summit yielded a broad diversity of opinions on vehicle useful life and several suggestions on how FTA might consider altering its service-life requirements For example many summit participants suggested that FTArsquos 12-year service-life standard for 40-foot buses should be reexamined These discussions included suggestions to both lengthen and shorten the minimum service-life requirement
bull 8-Year Bus Some manufacturers suggested moving to an 8-year service-life minimum It was suggested that this would ensure that the latest technological advances could be introduced sooner leading to cleaner lighter safer and more fuel-efficient buses It would also expand the size of the overall market potentially increasing the viability of the domestic transit bus market
bull General Reduction in Service Life Some agency representatives concurred with the general objective of a reduced service-life requirement under the expectation that this would enhance the vehicle thus driving down the base vehicle process and accelerating the adoption of new technologies The anticipated results were improved service quality and a stabilized vehicle market
Federal Transit Administration 111
Useful Life of Transit Buses and Vans Chapter 8 Final Report Prior Useful-life reviews
bull 15-Year Bus FTA staff noted that the US DOT Inspector General considered a 15-year service-life standard because of the lessened need for federal capital funds
bull 18-Year Bus A bus builder noted that Ontario Canada has an 18-year standard with a substantial overhaul scheduled for year 12 The practice of extending vehicle useful life to 18 years or more through enhanced initial design and materials specifications improved maintenance practices and application of more extensive and frequent vehicle rebuild programs has spread throughout Canada due to the lack of national capital funding for bus replacement
bull Flexible Policy Some participants argued that national policy should be flexible and should not be based on a one size fits all service-life standard They argued that a single standard cannot consider differences in ndash Climatic and demographic circumstances ndash Budgetary constraints and priorities of transit operators ndash Overall operating expenses ndash Maintenance practices and maintenance management systems ndash The types of operating systems on buses ndash Rebuilding and replacement policies
These varied responses show that there was no clear consensus among the Bus Industry Summit participants on an optimal minimum service-life policy Also in addition to these suggested changes in overall vehicle useful life it was also pointed out that useful-life issues directly impact decisions concerning the approach to warranty programs Maintenance management systems and rebuilding schedules are also impacted
Overall the meeting highlighted the need for analysis that would consider all of the factors that bear on the relative costs and benefits of moving to an alternative service-life standard For example maintenance and fuel costs the impact on service quality for riders early deployment of new safety efficiency and technical features the health of the bus manufacturing industry and funding impacts on a longer-term basis must be examined when considering changes in current replacement parameters based on a specified useful life
1997 Useful Life of Heavy-Duty Transit Buses Study
In 1997 the FTA sponsored a second study entitled ldquoUseful Life of Heavy-Duty Transit Busesrdquo (TCRP Project J-6 Task 15) This study was commissioned based on feedback from industry received during the FTA-sponsored Bus Industry Summit meeting (see above) This study expanded on the 1988 study by addressing variables such as operating environment regulations technology maintenance practices and operating economics
The purpose of this special study was to review relevant data in order to make recommendations on the appropriateness of the current service-life standard for heavy-duty transit buses The effort included an analysis of factors that impact vehicle life including the operating environment (eg climate terrain annual bus mileage average operating speed and urban suburban or rural)
Federal Transit Administration 112
Useful Life of Transit Buses and Vans Chapter 8 Final Report Prior Useful-life reviews
requirements mandated by the ADA Clean Air Act Amendments and others and the introduction of new technologies (eg alternative fuels advanced electronics)
This study identified duty cycle as likely the most important variable affecting vehicle life with the life of buses decreasing as the severity of the duty cycle increases The study suggested that average operating speed could be used as a proxy for duty cycle severity in future useful-life analyses14 Recommendations included changes to the current service-life policy to consider the total age of the fleet (and not the age of the individual vehicles) and the type of service the vehicle is operated under FTArsquos age and mileage standards were not changed following this study
Other Studies
The following are descriptions of several additional studies that have addressed the issue of transit vehicle useful life
bull In 1995 the New York Metropolitan Transportation Authority Office of the Inspector General published a report evaluating the then-perceived deterioration in the condition of New York City Transitrsquos bus fleet At that time one-third of the fleet was over the 12-year minimum retirement age and older buses were experiencing significant corrosion and parts failures The report attributed the poor conditions to the failure of management to establish and enforce preventive maintenance procedures and poor capital planning to purchase new vehicles and operate and maintain older age vehicles Recommendations emphasized the need for adequate maintenance and inspection policies especially targeted to buses over 12 years of age
bull In 2004 a group of university researchers led by Li et al developed a model to explore the contribution of preventive maintenance to vehicle condition Vehicle condition ratings (or the probability of a vehicle being at a condition rating) were calculated based on the vehiclersquos age mileage and amount of maintenance spending The decision analysis model evaluated the benefitcost ratio of the expected gain from extended life that would result from specific maintenancerepair actions and the associated costs The model developed in this study introduced a quantitative measurement of the expected benefits of maintenance actions on the vehicle life cycle The analysis clearly indicated a relationship between vehicle condition useful life and preventive maintenance practices
bull The 1988 Pennsylvania Department of Transportation (PennDOT) ldquoHandbookrdquo is a guide to assist transit agencies purchasing small transit vehicles The handbook contains information on the characteristics of small transit vehicles PennDOT procurement procedures and optional equipment with technical specifications and costs The expected life reported for standard vans body on chassis vehicles and small buses is 3 to 5 years 5 to 7 years and 10 to 15 years respectively all depending on a number of factors such as operating environment and preventive maintenance programs
14 Note that the analysis in Chapter 7 uses average agency operating speed as a cost driver for OampM costs However this study was unable to demonstrate quantitatively a relationship between decreasing operating speed and decreasing vehicle life expectancy
Federal Transit Administration 113
Useful Life of Transit Buses and Vans Chapter 8 Final Report Prior Useful-life reviews
bull The Small Transit Vehicle economics (STVe) model was developed by a group of university researchers and is designed to support decision-makers purchasing small transit vehicles The model provides an economic evaluation of various types of vehicles given the inputs of operating conditions such as type of service and capacity Types of vehicles listed in Table 8-1 are categorized based on characteristics that affect capital maintenance and operating costs The vehicle categories presented in the table and the expected useful lives for each of these categories are all roughly similar to those currently used by FTA
Table 8-1 Small Transit Vehicle Economics Model
Category Description Approx Seating Capacity
Expected Life+
1 Van 10 ndash 11 4 2 Van Cutaway Single Wheel 13 4
3G Van Cutaway Dual Wheel Gasoline 18 5 3D Van Cutaway Dual Wheel Diesel 18 5 4 Purpose Built Front Engine 22 6 5 Purpose Built Rear Engine 22 7 6 Medium-Duty Low-Floor Front Engine 20 7 7 Heavy-Duty Low-Floor Front Engine Varies 12 8 30 ft Heavy-Duty Bus Varies 12
+ As considered in the STVe model
Comparisons of Past Studies with This Report
Largely the findings of the studies sited above appear to be consistent with the findings reported elsewhere in this report Key common findings between this and prior studies include
bull Transit buses (heavy-duty buses in particular) generally have many years of valuable service life well after the service minimum age has been reached Also operators generally retire their vehicles well past this point in time
bull Vehicle retirement decisions are driven less by the service-life minimums than they are by funding availability maintenance requirements and quality of service issues
bull Economic and engineering analyses suggest that the current FTA service-life minimums are generally appropriate for each of FTArsquos five minimum service-life categories (ie there is no clear need to change the categories or the service-life minimums for each category)
bull Duty cycles (as measured by the average operating speed proxy) are a key driver of vehicle useful life especially for vehicles operated in fixed-route service
bull There are diverse opinions among industry representatives as to the preferred useful life of heavy-duty (ie 12-year) transit vehicles ranging from 8 to 15 years or more
bull There is value in having some flexibility in the application of the service-life minimums to reflect differences in agency service environments and to address the issue of problem vehicles
Federal Transit Administration 114
Useful Life of Transit Buses and Vans Chapter 8 Final Report Prior Useful-life reviews
Other Considerations
In addition to the considerations outlined above review of FTArsquos minimum service-life policy for transit buses and vans can also gain perspective from a brief review of this subject from different perspectives To that end the following sub-sections consider bus useful life from the viewpoints of the New Starts cost-effectiveness evaluation and the experience of Canadian transit agencies operating essentially the same transit buses as their American counterparts but for several additional years of useful life
New Starts Program Impacts
For FTArsquos New Starts program asset useful life values including those for transit vehicles are used to determine the total annualized cost of proposed New Starts investments New Starts projects with low annualized capital costs tend to have more favorable cost effectiveness and net benefit measures relative to those with higher annualized capital costs Hence revisions to FTA minimum service-life standards (the standards also used to annualized vehicle costs for New Starts investments) can have the potentially unexpected impact of lowering or increasing the cost-effectiveness measures for New Starts investments with bus or van components (eg BRT investments) Longer useful life results in increased years that vehicle capital costs will be spread over within the annualized cost calculation thus reducing the projectrsquos cost-effectiveness measure (increasing net benefits)
Note that this issue has already arisen with respect to some BRT designs intended to have a useful life of approximately 18 years Assigning an 18-year minimum useful life value to these vehicles (versus the current 12-year value for large buses) would make these vehicles more competitive with similar rail investments
The Canadian Experience
As already noted Canadian transit authorities do not receive bus replacement funding assistance from their national or provincial governments Because of this Canadian transit agencies tend to operate their buses longer and maintain a larger spare fleet than their US counterparts It is not clear how the service life of Canadian buses is influenced by the lack of Canadian federal assistance versus the fact that these operators have no spare ratio maximum Either way Canadian transit agencies have been operating transit buses with similar designs to US buses for 15 years on a consistent basis and have extended them to the 18-year range through enhanced designs and more extensive component replacement programs
Canadian agencies have also conducted cooperative research efforts into bus designs and the available means to extend useful life through more aggressive design specifications The results of these approaches are evident in the extended useful bus life for these operatorsrsquo vehicle fleets However the extent to which this longer vehicle life is driven by differences in bus design is not fully clear given that these agencies have higher spare ratios providing them with a larger pool of buses to draw from when problems are encountered within an aging fleet The conclusion then
Federal Transit Administration 115
Useful Life of Transit Buses and Vans Chapter 8 Final Report Prior Useful-life reviews
is that vehicle life can be prolonged significantly from the current FTA minimums for large buses The uncertainty is the full costs and service quality implications of extending vehicle life beyond 15 to 16 years
Case Study ndash US versus Canadian Useful Life
The transit bus industries in Canada and the United States use virtually identical vehicles and the services provided are very similar In both countries the majority of agencies are municipal Interestingly three of the six largest North American transit bus manufacturers are Canadian or have significant Canadian-based manufacturing facilities
Table 8-2 Geographic Locations of Major North American Bus Manufacturers
Manufacturer Head Office Canadian Facilities American Facilities
New Flyer Winnipeg MB Winnipeg MB St Cloud MN Crookston MN
Nova Bus St-Eustache PQ St-Francois-du-lac PQ NA Orion Bus Mississauga ON Mississauga ON Oriskany NY
NABI Anniston AL NA Anniston AL Gillig Hayward CA NA Hayward CA
Millennium Roswell NM NA Roswell NM
While there is significant Canadian content in the manufacturing and assembly of the buses the majority of the major components going into the final product specifically the high-dollarhighshyvalue items such as engines transmissions axles and HVAC are all supplied by non-Canadian companies and are almost exclusively US companies In addition exporting to the United States is critical for both New Flyer and Orion who have large US facilities in order to meet the Buy American requirements
Despite the similarities in the vehicles manufactured in the United States and Canada there is a significant difference in agency requirements for useful life As just noted Canadian agencies expect an 18-year useful life versus 12 years in the United Statesmdasha 50-percent increase above the US requirement Other distinguishing characteristics between the US and Canadian markets are reflected in the higher usage and productivity of urban transit in Canada Canadian transit use per capita is 150 percent of the US use (144 billion trips versus 917 billion trips) Of these trips it is estimated that 75 percent are made by bus in Canada compared to just over 60 percent in the United States Government funding (from all levels combined) on a per-capita basis is less than 80 percent of the US level
The buses used in the United States and Canada are virtually identical in design and purchased using similar specifications and procurement approaches Regardless Canadian agencies expect the vehicle to have an 18-year life From our interviews with agencies and manufacturers there are two leading factors driving this difference in expected bus life
1 Federal capital funding for transit is non-existent in Canada Other than intercity rail all transit funding in Canada is a provincial responsibility
Federal Transit Administration 116
Useful Life of Transit Buses and Vans Chapter 8 Final Report Prior Useful-life reviews
2 Provinces have not established long-term funding allocations While annual operating budgets are supplemented there is not an established formula for capital vehicle replacements similar to the FTA
The US agencies interviewed have adapted to the FTArsquos 12-year useful life for transit buses primarily because it is tied to the FTArsquos 80-percent funding Agencies have adjusted their internal funding and planned vehicle replacement schedules to match the established FTA funding streams In Canada where there is no established funding formula for vehicle purchases agencies must plan to keep their vehicles longer Agencies have therefore focused on an 18-year vehicle life
Federal Transit Administration 117
Useful Life of Transit Buses and Vans Chapter 9 Final Report Conclusions
CHAPTER 9 KEY FINDINGS AND RECOMMENDATIONS
Key Findings
Following are key findings from this study
Review of FTArsquos Current Service-life categories
The review of FTArsquos minimum service-life requirements yielded the following key findings
bull The current service-life category groupings are appropriate The study found that the current categories represent logical groupings of vehicles having broadly similar characteristics in terms of construction methods size weight passenger capacities cost manufacturers and customer bases A possible exception here is for 4-year and 5-year vehicles built using cutaway chassis where there is a significant degree of overlap between the two age categories in terms of construction type sizes and manufacturers
bull Transit has little ability to alter bus and van useful-life characteristics cost-effectively Given transitrsquos small share of the vehicle and component markets (typically less than one percent) the transit industry has little ability to influence component useful-life characteristics in a cost-effective manner A key exception here is the structure of 12-year buses To the extent that 12-year bus structures are designed specifically for transit use the transit industry has some leverage to influence this componentrsquos design and durability characteristics
Review of Procurement Regulations with Potential Useful-Life Implications
While many federal regulations (eg Buy America Bus Testing ADA and EPA) and industry procurement practices (third-party contracting) are believed to have potential useful-life implications these implications are generally considered minor relative to the issues of annual mileage new vehicle designs changing life-cycle economics and other drivers of useful life
Analysis of Actual Retirement Ages Using NTD Vehicle Data
The study used NTD data to determine how recent actual retirement ages for transit buses and vans compare with FTArsquos current minimum service requirements for transit buses and vans to determine whether these requirements are affecting the vehicle retirement decisions of the nationrsquos transit operators
bull Most buses and vans retired well after the minimum service age requirement is satisfied On average transit buses and vans are retired between one to three years after their minimum service-life requirement has been satisfied (Table 9-1) In addition a significant proportion of buses and vans remain in service at least one year past the retirement minimum (eg 20 percent of heavy-duty 12-year buses) and with many still in service three or more
Federal Transit Administration 118
Useful Life of Transit Buses and Vans Chapter 9 Final Report Conclusions
years past the minimum requirement (eg one in ten ldquo12-yearrdquo buses in active service are age 15 or older)
Table 9-1 Minimum Versus Average Retirement Age by Vehicle Category
Vehicle Category Minimum Retirement
Age Average Retirement
Age (Years) Share of Active Vehicles that are
One or more years past the retirement minimum
Three or more years past the retirement minimum
12-Year Bus 151 19 9 10-Year Bus 7 4 7-Year Bus 82 12 3
5-Year Bus Van 59 23 5 4-Year Van 56 29 10
Average retirement age estimates for these vehicle categories suffer from small sample issues
bull Minimum service age does not constrain agency vehicle retirement decisions Relatively few transit buses and vans are retired right at the minimum service age requirement Hence the current retirement minimums are not constraining the vehicle retirement decisions of the vast majority of the nationrsquos bus and van operators This indicates that any reduction to the current minimum age requirements (eg from 12 to 10 years for a ldquo12-year busrdquo) would not result in a significant increase in the rates of retirement for the five service-life categories
Industry Outreach
Representatives of local transit operators vehicle manufacturers and private bus fleet operators were interviewed to assess their current experiences with bus and van useful life The following are key findings from this industry outreach process
bull Actual retirement ages generally exceed both FTA minimums and agency service-life policies The actual timing of vehicle retirement for all nine agencies typically occurs between one to four years after the FTA minimum has been reached (but can occur as late as vehicle age 20) Moreover for most agencies the recent actual retirement ages also exceed the planned or policy retirement age Hence it is clear that FTArsquos current minimum service-life requirement is not actively constraining these agenciesrsquo retirement decisions
bull Capital funding availability is the primary determinant of retirement age Limited capital funding was cited as the primary reason why the timing of actual vehicle retirements has exceeded the planned and policy retirement age (and FTA service minimums) Because of this the average fleet age is more likely to be impacted by the increased availability of federal funding than by any relaxation in the minimum service-life requirements Other decision factors included service reliability vehicle condition vehicle maintenance physical and local environmental conditions procurement process and duty cycle (operating speed mainly)
bull Only large agencies operating in severe environments perform scheduled mid-life overhauls Only the larger urbanized agencies interviewed (Massachusetts Bay Transportation Authority New York City Transit Toronto Transit Commission and Washington Metropolitan Area Transit Authority) perform comprehensive ldquomid-liferdquo
Federal Transit Administration 119
Useful Life of Transit Buses and Vans Chapter 9 Final Report Conclusions
overhauls of their heavy-duty cycle vehicles stating that these overhauls are required to obtain full service lives given the tough service environments in which they operate In contrast none of the other agencies interviewed (including Los Angeles Metropolitan Transportation Authority and Houston Metro) regularly complete a mid-life overhaul with most suggesting it is not cost effective for them
bull Most agencies reported not being impacted by FTArsquos service-life requirements Most interviewed agencies stated that their vehicle retirement decisions are not significantly impacted by FTArsquos service-life minimums (these decisions are constrained more by capital funding availability)
bull Extending the service-life requirements would hurt many agencies Conversely most if not all of the agencies reported that they would be negatively impacted if current FTA minimum service lives were extended These negative impacts include a decrease in quality of service (higher rate of failures aesthetic of vehicles reliability) an increase in maintenance costs (between 10 to 50 percent higher) and less leeway to retire ldquoproblemrdquo vehicles
bull Agencies support development of a ldquolemon lawrdquo and a technology demonstration option Interview respondents supported development of a ldquolemon lawrdquo and a technology demonstration option The lemon law concept would permit early retirement of problem vehicles without penalty to the agency Under the technology demonstration concept a grantee could request a similar release from the service-life policy for FTA-approved tests of new vehicle technologies
bull Most agencies were not interested in more or less durable heavy-duty vehicles Most agencies stated that they were not interested in a more durable vehicle (ie with a more expensive heavier weight longer life expectancy structure) This is due to concerns over the cost effectiveness weight and rider comfort for this option All nine agencies also expressed significant concerns with a less durable vehicle (ie with a cheaper lighter weight lower life expectancy structure) There were concerns regarding the expected inability to survive the required duty cycles and the relationship with a decrease in quality and an increase in procurement efforts
Engineering Analysis
The engineering analysis provides further evaluation of bus useful life from a vehicle engineering perspective The following are key findings
bull Useful life is ultimately determined by the life of the vehicle structure Vehicle structure defines the useful life of the vehicle as a whole more than any other single vehicle component Should the structure wear out or fail due to corrosion or a collision then the life of the vehicle is essentially at an end
bull Service environment is a key determinant of structure useful life Many interview participants clearly indicated that service environment is a key determinate of structure (and hence vehicle) useful life Because of this several agencies expressed the desire that FTA revise the service-life requirements definition to include service environment severity along with service years and miles (eg 12 years or 500000 miles)
Federal Transit Administration 120
Useful Life of Transit Buses and Vans Chapter 9 Final Report Conclusions
bull ldquoStick busrdquo and low-floor vehicles may have shorter useful life Interview participants suggested that stick bus (structures constructed using hundreds of welded tubes) and low-floor designs (which use stick construction) may have shorter useful life as compared to traditional designs Interview participants stated that it is too early to tell whether this is in fact the case
Economic Analysis
The economic analysis identified the age for all vehicle categories at which total life-cycle costsmdashincluding all capital operating and maintenance costsmdashare minimized (reflecting the impact of differences in mileage) This analysis identifies a financially optimal retirement point for the vehicle
bull The minimum cost retirement points all occur at or after the FTA minimum service life From a cost-effective perspective FTArsquos current service-life minimumsmdashincluding both the minimum years and miles requirementsmdashrepresent reasonable choices For each service-life category the minimum cost point is attained at either an age or mileage that exceeds one or both of the FTA minimums for these measures
bull Reducing heavy-duty vehicle service life from 12 to 10 years would only have a minimal impact on vehicle sales Assuming all vehicles currently retired right at the current 12-year minimum shifted to a new 10-year minimum the long-term average annual replacement rates for these operators would increase from 200 to 300 vehicles to 240 to 360 vehicles annually or 40 to 60 additional vehicles per year The addition of 40 to 60 additional new vehicles is unlikely to yield a significant boost to the small domestic bus market
Recommendations
Based on the findings above it is recommended that the FTA consider the following
bull Maintain the current service-life minimums Few buses and vans are currently retired right at FTArsquos current service-life minimums Rather the vast majority of these vehicles are retained in service for at least one year (4- and 5- years vehicles) and as many as three or more years (eg for 12-year vehicles) after the minimum service requirements have been met indicating that these vehicles have some service life remaining beyond the minimums Moreover the current service-life age andor mileage minimums for all vehicle types occur before the minimum life-cycle cost points for these vehicles are reached Hence the current service-life minimums clearly meet the joint objectives of (1) ensuring that buses and vans purchased using federal dollars remain in service for most of their useful life (2) of providing agencies some flexibility in determining when their vehicles will be retired and (3) of helping to minimize life-cycle costs In this sense the current service-life minimums really are just that the minimum ages at which vehicles can be retiredmdashnot a recommended retirement age or a measure of actual expected useful life The current minimum service-life requirements should be maintained
bull Maintain the current service-life categories Similarly the segmentation of transit bus and van types into the current five service-life categories reflects actual similarities in vehicle
Federal Transit Administration 121
Useful Life of Transit Buses and Vans Chapter 9 Final Report Conclusions
structures designs components costs origin markets manufacturers and end users These current categories should be maintained
bull Review the service-life minimums and service-life categories regularly The analysis of recent changes in vehicle designs the adoption of new technologies and the introduction of new vehicle types (eg stainless steel BRT vehicles) highlight the fact that the useful-life characteristics of transit buses and vans are subject to change For this reason FTA should review the minimum life requirements and service-life categories on a regular basis (eg every 5 to at most every 10 years)
bull Consider adoption of a ldquolemon lawrdquo This law would define circumstances under which ldquoproblemrdquo vehicles could be retired early without financial penalty
bull Consider adoption of a technology demonstration option Similar to the ldquolemon lawrdquo this option would define circumstances under which agencies could retire vehicles purchased to test new technologies (with FTArsquos prior agreement) early again without financial penalty The intention would be to encourage test and adoption of new but potentially unreliable technologies expected to benefit the entire transit industry
bull Restrict the service-life categories in which vehicles are tested In recent years some manufacturers have successfully lobbied to have their vehicles tested in a more durable category than would appear warranted by their vehiclersquos general characteristics (eg testing a bus with 10-year characteristics as a ldquo12-yearrdquo bus) The result has been service reliability issues and in some instances early retirement for the purchasing agencies when the tested vehicles were not found to have the expected durability Thus FTA may wish to more tightly control which categories vehicles are eligible to test in based on some combination of characteristics (eg gross vehicle weight seating capacity) but with the potential for special waivers to test in a different category so as not to stifle innovation (Manufacturers should be required to provide reasonable justification as to why their vehicles should be tested in the higher durability category)
bull Modify the NTD reporting requirements to better document actual vehicle retirement age and each vehiclersquos assigned service-life category The analysis used in this study to determine actual vehicle retirement ages relied on cross comparisons of NTD data from multiple reporting years to identify when specific vehicle sub-fleets have been retired FTA should modify NTD to track the actual age of vehicle retirements thus significantly improving FTArsquos ability to track and monitor any trends in vehicle retirement ages Similarly NTDrsquos vehicle documentation should also include the service-life category to which each vehicle has been assigned (again to facilitate monitoring of the retirement ages for each service-life category)
bull Conduct a study to evaluate the sensitivity of bus ridership to changes in vehicle age and condition A key objective of this study was to consider how bus ridership might change (increase) in response to a reduction in the average age of the nationrsquos bus fleets (eg with the introduction of a new shorter lived heavy-duty transit vehicle) However while review of the existing literature provides numerous references to the sensitivity of ridership to changes in fares and service frequency no literature references were identified that provide a quantitative link between ridership and fleet age or condition In the absence of solid empirical data linking ridership and fleet age any analysis of this relationship can only be
Federal Transit Administration 122
Useful Life of Transit Buses and Vans Chapter 9 Final Report Conclusions
based on conjecture and limited anecdotal evidence For this reason it is recommended that FTA conduct a study to evaluate the sensitivity of bus ridership to changes in vehicle age and condition Given the availability of good-quality route-level ridership data (from electronic fare boxes and APCs) this study could easily be conducted using a sample of US transit operators using before and after comparisons of which older sub-fleets have been replaced by new (or newer) vehicles
Federal Transit Administration 123
1
Useful Life of Transit Buses and Vans Final Report Bibliography
BIBLIOGRAPHY
The following documents have been used as project resources
Books papers technical reports
Federal Transit Administration 1988 ldquoUseful Life of Transit Vehiclesrdquo UMTA-IT-06-0322-88shy1 Washington DC US Department of Transportation
This study focused primarily on the mechanical or engineering life of transit buses It excluded other factors such as the economic life ridership impacts and technological obsolescence of the vehicle
Abrams E and E Hide 1997 ldquoUseful Life of Heavy-Duty Transit Busesrdquo TCRP Project J-6 Task 15 Washington DC Transportation Research Board
This task reviews FTA guidelines on the minimum useful life of 12 years or 500000 miles of operation for heavy-duty buses The study expanded on the 1988 study and includes an analysis of factors that impact vehicle life (operating environments mandated requirements and new vehicle technologies) and makes recommendations on the appropriateness of the current service-life standards
American Public Transportation Association 1997-2002 ldquoStandard Bus Procurement Guidelinesrdquo
This is a comprehensive set of industry-wide purchase standards with both technical specifications and procurement guidelines for transit buses
Booz Allen Hamilton 2005 ldquoManaging Capital Costs of Major Federally Funded Public Transportation Projectsrdquo TCRP Project No G-07 Washington DC Transportation Research Board (TRB)
This report examines the strategies tools and techniques to better estimate contain and manage major transit capital projects Nine case study projects were examined in detail to provide insight into various project management approaches Major cost drivers considered in this analysis were initial inflation scope changes and schedule changes
Yang F L Yu G Song W Wang and W Pei 2004 ldquoVehicle Age Distribution Model and Application for Beijing Chinardquo Washington DC Annual Meeting of the TRB
This paper proposes a survival probability-based model to calculate and forecast the area-specific vehicle age distributions which uses the total number of registered vehicles (not distinguished by years) and the total number of newly registered vehicles or the number
Federal Transit Administration 124
Useful Life of Transit Buses and Vans Final Report Bibliography
of scrapped vehicles (the most recent year) The model is designed for areas where historical vehicle registration records are incomplete or unavailable
Li Q H Zhao and Y Xingping 2004 ldquoDecision Making Modeling for Rural and Small Urban Transit Asset Managementrdquo Washington DC Annual Meeting of the TRB
This paper describes the framework of a transit asset management system and discusses the methodologies developed to assist agencies in foreseeing the transit deterioration process The study explores the contribution of preventive maintenance costs to the vehicle condition ratings The optimization procedures developed help allocate sufficient funding to sustain future well-being of transit vehicles The concept of extended life (payoff for maintenance actions) of transit vehicles is introduced to provide a structure for the management decision-making process
KFH Group Inc 2000 ldquoAnalyzing the Costs of Operating Small Transit Vehiclesrdquo TCRP Report 61 Washington DC Transportation Research Board
This report serves as a user guide to the accompanying Small Transit Vehicle economics model which is designed to provide support to transit planners and other decision-makers on the purchase of small transit vehicles for different services and operating environments The user guide also discusses qualitative and non-financial factors that influence the size of vehicles to be purchased
Schneck D C and R S Laver 1995 ldquoTransit Capital Cost Indexrdquo Washington DC Annual Meeting of the TRB
This study presents the results of research aimed at improving the estimation of future capital costs for light and heavy-rail fixed guideway projects The research produced a set of cost indices for a broad range of project elements comparing these cost indices with broader measures of inflation and suggesting how they should be incorporated into cash flow projections for proposed fixed guideway projects
Pennsylvania Department of Transportation (PennDOT) Bureau of Public Transportation 1988 ldquoHandbook for Purchasing a Small Transit Vehiclerdquo Urban Mass Transportation Administration Washington DC US Department of Transportation
This handbook was developed to assist Pennsylvania grantees in the vehicle procurement process The first part of the handbook contains information on the characteristics of small transit vehicles objective criteria for selection and PennDOT procurement procedures while the second part provides a list of optional equipment and features with their technical specifications and approximate costs
Metropolitan Transportation Authority Office of the Inspector General 1995 ldquoIs New York City Transitrsquos Bus Fleet Too Old to Provide Reliable and Safe Bus Servicerdquo TRA 4506-4 ISNYC 94-79636 New York NY New York State Library
Federal Transit Administration 125
Useful Life of Transit Buses and Vans Final Report Bibliography
This document reviews the conditions and problems of the New York City Transit bus fleet which at the time had one-third of its buses over the 12-year retirement criterion Age-related safety performance and structural deficiencies are examined The report offers a number of recommendations to restore the fleet to a state of good repair and monitor the condition of its overage vehicles
Hemily B and R King ldquoThe Use of Small Buses in Transit Servicerdquo TCRP Synthesis Report 41 Washington DC Transportation Research Board
This research explores the use of small buses (30 feet or less) in the transit industry The study included a survey of North American transit agencies using small buses transit agencies that do not have small buses and bus manufacturers Results from this research were related to the fleet composition with respect to small buses the wide variety of vehicle models and service categories and overall experiences and most common areas of concern for transit agencies regarding small buses
2 FTA and agency reports
Federal Transit Administration 2006 ldquoNon-Rail Vehicle Market Viability Studyrdquo MI-26-7008shy051 Washington DC US Department of Transportation
Federal Transit Administration 1988 ldquoUseful Life of Transit Vehiclesrdquo UMTA-IT-06-0322-88shy1 Washington DC US Department of Transportation
Federal Transit Administration 1998 ldquoUrbanized Area Formula Programrdquo Circular C90301C Washington DC US Department of Transportation
Federal Transit Administration 1995 ldquoFinal Report Bus Industry Summit Proceedingsrdquo Washington DC US Department of Transportation
Federal Transit Administration ldquoBuy America Requirements ndash Surface Transportation Assistance Act of 1982rdquo 49 CFR 661 Washington DC US Department of Transportation
Federal Transit Administration ldquoBus Testing Regulationrdquo 49 CFR 665 Washington DC US Department of Transportation
Americans with Disabilities Act of 1990 United States Public Law 101-336
3 Internet sources
Altoona Bus Research and Testing Center lthttpwwwvsspsuedubtrchtmgt (January 16 2006)
American City amp County ldquoPublic TransitCommission Uses Third Party for Bus Procurementrdquo lthttpwwwamericancityandcountycommaggovernment_commission_uses_thirdindexhtmlgt (January 13 2006)
Federal Transit Administration 126
U F
seful Life of Transit Buses and Vans inal Report Bibliography
This article describes the bus procurement process taken by the Metropolitan Transit Commission (MTC) in St Cloud MN
Hubbard D 2005 ldquoIf It Makes It Here It Can Make It Anywhererdquo BUSRide Magazine lthttpswwwbusridecom200507If_it_makes_it_here_it_can_make_it_anywhere_aspgt (January 16 2006)
This article is about the Altoona Bus Research and Testing Center (ABRTC)
Goby D 2004 ldquoThe Environment and New Bus Service Liferdquo School Transportation News lthttpwwwstnonlinecomstnbusmaintenanceschoolbustechniciangoby_buslife0404htmgt (January 16 2006)
This is an opinion article on the environmental impacts of school buses with six- to eight-year service life compared to longer (10 to 15 year) service life
Federal Transit Administration 127
Useful Life of Transit Buses and Vans Appendix A Final Report Summary of Transit Agency Survey
APPENDIX A SUMMARY OF TRANSIT AGENCY SURVEY
Issue Area WMATA (Washington)
Toronto Transit
Montgomery Co Ride-On
New York City Transit MBTA (Boston) LA MTA
(Los Angeles) Frederick Co Capital Metro (Austin TX)
Jefferson Transit
General Experience - Federal Funding
Use Federal funding to purchase buses and vans (yn) Yes Limited
Few (some State funded - which is partially funded with federal sources most are from County
No use MTANY State Capital Funds Yes Yes Yes Yes Yes
Percent of fleet purchased using Federal funds 100
Limited diesel hybrid support on a demonstration basis (150 buses) - 13 city 13 province and 13 federal Rest of fleet is funded by agency or city Not given 0 100 Not stated
25-30 Other funding sources State and Local 99 95
General Experience - Service-life policy (Heavy-Duty Vehicles)
Have policy in place State or agency
Yes ndash imposed by WMATA board Yes
State (more stringent than FTA) and County policies
Not stated (use average age of fleet to make sure garages have equal distribution - not for policy)
Yes (use average age of fleet) Yes
Follow State policy which is similar to FTA (see table) Yes Yes
Planned agency policy retirement age
15 years for 40-foot
18 years at 40-45000 annual
12 for County funded none stated for State funded
12 years as an objective 12 years
13 years or 500000 miles (not given)
ldquo12-yearrdquo bus retirement target is age 15 ldquo7-yearrdquo is age 9 5-year bus target is age 8 and 4-year is age 5
Preferred retirement age from the viewpoint of agency staff
5 years due to funding limitationsconst raints
18 year can extend to 20-24 to correspond with procurement cycle
Same as FTAMD 12 years 8 years
12 years (Budget)
Yes FTAMTA minimums Maintaining vehicles for longer period is too expensive
Same as scheduled
Same as scheduled
Federal Transit Administration 128
Useful Life of Transit Buses and Vans Appendix A Final Report Summary of Transit Agency Survey
Issue Area WMATA (Washington)
Toronto Transit
Montgomery Co Ride-On
New York City Transit MBTA (Boston) LA MTA
(Los Angeles) Frederick Co Capital Metro (Austin TX)
Jefferson Transit
Do actual retirement ages differ from the scheduled retirement age
Difficulties with Thomas SLFs (scheduled at 12 failing at 10-11)
States NO but CNG buses had to be retired at 12-years due to high maintenance
Close to minimum life budget not a problem (delay usually due to procurement process)
Yes 13-15 years due to lack of funding (structural rebuild and re-power program to extend)
Yes Actual exceeds scheduled due to other funding priorities Use average age of fleet Target is 8 years for fleet average age unable to meet this because of limited funding
Yes due to budget and legal consent degree obligations
Yes but retirement was within 1-2 years for minimums Minibuses (retired at 6 years 145000 miles) were very old Cutaways (retired 6 years 210000 miles) very old No
Yes Prior to 4 years ago no established replacement schedule existed
Examples of recent sub-fleet retirements
Group of 1983 MAN artics operated barely 11-12 years (12-year sched) and 400k-500k miles (600k sched) All other groups retired at scheduled miles or more
Group of 1984 30-ft TMCs (retired 1999 - 15 years Expensive to maintain Group of 1989 30-ft Gilligs (retired 20012002 - 12 years) had been re-engined 19921993 no lift poor ac expensive maintenance drivers hated
Group of 1987 RTS (20-30k miyr retired 2006) kept in reserve fleet while other vehicles were in overhaul Group of 1990 RTS (retired 2006 360-380k miles total) 1990 RTS not sent through re-power program no engine replacement wo failure
Retired 032006 heavy duty Schedule 8 Actual 16 Retired 1205 heavy duty Scheduled 8 Actual 17 Retired 1204 heavy duty Schedule 8 Actual 18 Retired 1203 heavy duty Scheduled 8 Actual 19
1991 Orions (retired at 14 years) -replacement decision driven by increasing maintenance -does not use mileages Goshen coach (retired at 6 years averaged 150000 miles) Vehicles could not stand up to fixed route services
(1) 30 1993 TMC CNG (retired 032005) -Retired 6 month early due to CNG equip outdated 1986 Gilligs Phantoms (retired 92005) - kept for contingency and for use by local PD
1984 35 Foot Orion (retired June 2006) age 22 years and with over 800000 miles 1985 Orion (retired August 2006) age 21 years and with 892625 miles
Drivers of Retirement Policy
In order of priority Capital funding vehicle maintenance other-ridership physical conditionQOS
Agency Duty Cycle (need to specify vehicles to operate with heavy-duty) and Capital Funding (mainly the LACK of alternative funding option) Does not use average fleet age or percent over age due to lack of funding
Physical CondQOS agency duty cycle (which is lowmoderate) veh Maintenance cap funds
(1) Cap Funds (2) ConditionQOS (3) Maintenance (4) Duty Cycle (5) WeatherRoad (6) FTA reqs
Availability of capital funding FTA minimum requirements
ConditionQOS Maintenance Capital Funding FTA ages
FTA retirement ages OTHER MD MTA procurement cycle is slow (Frederick purchases most vehicles through the state) Significant lag between replacement order and vehicle delivery state rarely provides as many vehicles as requested
Maintenance Capital Funding FTA minimums (QOS can be attained independent of age)
Physical condition duty-cycle maintenance requirements and capital funding availability
Federal Transit Administration 129
Useful Life of Transit Buses and Vans Appendix A Final Report Summary of Transit Agency Survey
Issue Area WMATA (Washington)
Toronto Transit
Montgomery Co Ride-On
New York City Transit MBTA (Boston) LA MTA
(Los Angeles) Frederick Co Capital Metro (Austin TX)
Jefferson Transit
General Experience - Mid-Life Overhaul
Perform mid-life overhaul (yn) Yes
Yes at 6 and 12 years With further decline in provincial funding revise overhaul program established at 9-10 years
No tried back in 19921993 and found not cost effective Not effective likely due to easy duty (larger buses maintained by County)
Yes planned but not always done - last up to 15 years When not done rehab activities are as needed or on component basis Yes
Sometimes (no due to funding and manpower)
No Frederick is small agency only perform basic vehicle maintenance on-site Enginetransmis sion replacements are contracted out No other scheduled rehab performed
No on an as-needed basis No
Components included in overhaul cost of overhaul
Engine and major components (transmission brakes ac) avg $110kvehicle
Engine transmission plus extensive other components avg $100kbus NA
Power plant paint suspension transmission some structural $100-120k per bus Mini-overhaul 3-4 years paint interior brakes suspensions shocks airbags) = $30-40k Geared towards performance not extension gain in reduction of corrective maintenance and road incidents
Rebuild power plant AC brakes steering axels body and frame air tanks limited wiring Avg cost of $173000 bus NA NA NA
Overhaul on Vehicle types All 40-ft buses All 40-ft buses NA Heavy-duty Heavy-duty 40-ft fixed route NA NA NA
Additional years
Gets vehicles from 12 to 15 years additional 150k miles
Extends 12-15-year bus to 18 years NA
3-4 years if necessary to keep past 12 years but done as corrective maintenance and keep incidents to minimum 6 years NA NA NA NA
Federal Transit Administration 130
Useful Life of Transit Buses and Vans Appendix A Final Report Summary of Transit Agency Survey
Issue Area WMATA (Washington)
Toronto Transit
Montgomery Co Ride-On
New York City Transit MBTA (Boston) LA MTA
(Los Angeles) Frederick Co Capital Metro (Austin TX)
Jefferson Transit
Coordination of overhaul timing with expected life of major components (eg drive train replacement)
Coordinate with those that fail 6-8 years looking into additional smaller overhauls (39 and 12)
With extension of major overhaul to 9-10 year doing more componentmini overhauls during other years Components with separate replacement cycles (brakes steering suspension) are on an ongoing basis (vs one major overhaul) affects availability for service NA
Follow strategy of preventive maintenance Use overhauls plus campaigns to do most maintenance as schedule (vs corrective)
6-year midlife ensures continued performance of all components and subsystems
NA budget is major factor in whether midlife overhaul is performed NA NA NA
FTA Minimum Service-life policy
Impact of current FTA policy on retirement decisions (yn)
No however later in interview agency states some difficulty in reaching 12-year retirement age - did not retired but lighten duty
No (Canadian no life constraint)
Used as basis for policy schedule and actual retirement No impact
12-year minimums result in 6-year midlife rehab at considerable capital expense
Budget does not allow MTA to retire at 12 MTA attempts to retire at 13 yrs
Submits vehicle replacement requests to MD MTA as vehicles meet minimums State requirements for smaller vehicles are slightly more strict
No negative impact
No Vehicles exceed the FTA minimums in terms of both age and miles Staff viewed this as a ldquopositiverdquo for the current service-life minimums
Would you retire earlier than the FTA minimums if you could
No agency retires later (15 years) due to Board policy
No funding to do so Have kept vehicles longer than desired -would prefer to retire at 15 but no funding requires extending to 18 and further for procurement cycles Have retired buses earlier than preferred (no
No impacts from retirement ages
No impact exception of FTA funded 19831984 Grumman that could not handle NY duty and street conditions Reimbursed FTA for portion (80) - reason for use of State and City funds now Early
Earlier 8-year replacement would eliminate 6-year midlife rehab and ensure latest technology Have not retired earlier than FTA mins
Early possible but budget constraint Budget has forced longer service than desired due to absent fundingbudget Metro might entertain using shorter design lives Has retired early (fire and beyond
In general NO Current minimums are appropriate Would not retire sooner but do like to retire close to minimum ages for maintenance issues (not QOS) Exceptions are Goshen and Thomas SLF
Would not retire earlier in absence of requirements and has not forced vehicles pass desired age Have retired prior to FTA minimum (1993 TMC - due to CNG outdated) FTA approved early retirement
No vehicles still have yearsmiles of remaining useful life after minimums have been attained
Federal Transit Administration 131
Useful Life of Transit Buses and Vans Appendix A Final Report Summary of Transit Agency Survey
Issue Area WMATA (Washington)
Toronto Transit
Montgomery Co Ride-On
New York City Transit MBTA (Boston) LA MTA
(Los Angeles) Frederick Co Capital Metro (Austin TX)
Jefferson Transit
FTA requirement) due to high failure rates and maintenance
retirement affected other MTA projects and delayed procurements to refund those projects
economical repair)
which have provided problems Goshens keep longer than desired (are unreliable and unfit for fixed service)
Does your state have a minimum vehicle life policy No No
Yes same for larger vehicles more yearsmiles for smaller
Yes 7 years to cover all bus types No No
Yes (more strict than FTA minimums on smaller vehicles) Not stated
Yes same as FTA minimums
Recommendations
Options for agencies inclusion of rehab costs as reimbursable extended warranties as reimbursable
Suggest shorter useful life is NOT feasible for heavy-duty operations and procurement methods Minimum agemileage should be increased to 12151820 and 24 years FTA classification be revised for rehab costs to be included
No current minimums are appropriate Cannot judge appropriateness for smaller since they were recently purchased (previously contracted)
Makes sense to provide options mileage looks high on annual average should include rebuild costs as capital reimbursement (improve maintenance) stipulations on use of FTA funds for rebuild use testing to pre-qualify buses higher-level specs from ldquoWhite Bookrdquo
Reduce minimum agemileage to reduce maintenance costs Change 12-year 500000-mile category for 40-ft heavy duty to 8-year 300000 miles
Allow more discretion on buses not performing at optimum level In general age is acceptable No changes
Retirement minimums are OK extending them would be a problem due to increasing maintenance
No current minimums are appropriate
Maintain current policy
Vehicle Life Classes
Opinions on the usefulness and applicability of the current classification
FTA should provide options for each vehicle type make rehab and warranty reimbursable longer life
Mainly focus on heavy-duty buses maybe extend heavy-duty specs to smaller buses too No
Mileage seems high (calculate avg annual mileage and apply to each option consistently)
Useful but redefine to include 8-year 300000-mile heavy duty vehicles NA
Retirement minimums are OK extending them would be a problem due to increasing maintenance
No revisionsreducti onsincreases to minimums
They are good They allow for the purchase of a quality product and still provide reasonable replacement for high-volume
Federal Transit Administration 132
Useful Life of Transit Buses and Vans Appendix A Final Report Summary of Transit Agency Survey
Issue Area WMATA (Washington)
Toronto Transit
Montgomery Co Ride-On
New York City Transit MBTA (Boston) LA MTA
(Los Angeles) Frederick Co Capital Metro (Austin TX)
Jefferson Transit
shorter vehicles areas would be good but are the required components amp structure available
1st Option (more durable longer lasting vehicles)
Not right now possibly in future
BRT vehicles not considered yet have developed longer life vehicle specs with NYCT WMATA and MBTA focused on stainless steel structure composite panels and extensive rust protection
Only if other features come in not just for the sake of durability
Yes in terms of durability duty cycle places great strain on buses Stainless steel is key to this No
If such vehicles truly had an extended vehicle life METRO is very hard on vehicles and struggle to get past 12 yrs
No not appropriate for market concern of increasing maintenance costs and decreased reliability and service quality Yes
No We are not in a high-volume service corridor and a longer life vehicle would only put us behind in technological advancements that are of benefit for safety and operating costs
2nd Option (less durable shorter life vehicles)
Interesting but do not see benefits Component life is typically 6-8 yrs - would have to be in this range
No do not believe can handle heavy-duty cycles
Skeptical that vehicle can be constructed with cost savings to make it cost effective option Concern over increase of cost and effort of procurement process
Would not apply to NYCT duty cycles
No Looking for same heavy-duty vehicle with an 8 year minimum life requirement
Metro is hard on vehicles could work if vehicles were suitably durable
No current agemileage requirements are preferred Concern reduced life = reduce safetyreliability durability Consider life expectancy of vehicle structure and components
No revisionsreducti onsincreases to minimums
Our experience with shorter-life medium duty equipment has been negative Increased operating and repair costs for the agency more service disruptions and increased passenger dissatisfaction
3rd Option (allow agencies to replace vehicles as needed relying upon funding formula constraints to limit fleet
Currently done by agency (15-year major overhaul -considering mini overhauls in between) Would not do
Does not affect agency (Canadian) but
Yes but concern about
Should be done as an industry to cause a change in life
If funding match were changed to 5050 6040 7030 8020 9010hellipbased on equipment age mileage it would encourage prudent maintenance and vehicle
replacement activities)
anything different
believe this is best way
capabilities of other agencies No objection Reasonable
expectancy of buses
replacement practices
Federal Transit Administration 133
Useful Life of Transit Buses and Vans Appendix A Final Report Summary of Transit Agency Survey
Issue Area WMATA (Washington)
Toronto Transit
Montgomery Co Ride-On
New York City Transit MBTA (Boston) LA MTA
(Los Angeles) Frederick Co Capital Metro (Austin TX)
Jefferson Transit
4th Option (consisting of up to three different options of minimum retirement ages mileages for each vehicle category plus pre-defined rehabilitation requirements for each option)
Interesting but not appropriate to 40-ft and with agency policies would not alter procurement decisions would probably require incentive
No only do longer life durable procurements (no impacts to current procurement decisions) Heavy-duty 10-year option not useful - others OK (no experience with light-duty) Agency would require additional federalprovincia l funding
Interesting but skeptical Rehab provisions are of no interest (no rehab performed) Concern over capacity of rehab vendors to meet increased demand and how rehab would be monitored and approved by FTA
Yes like idea of options within consistent structure Procurement decisions not affected - would like to consider 15-18 year options Suggestion to reduce annual miles
No but suggest 8-year option
Yes alter procurement by more evaluation of trade-offs (age vs operating costs) Need to consider impact of sustaining vehicles on emissions Challenge Need to have good understanding of how increased age decreases QOS Incentives could encourage our procurement decisions to look at alternative procurement scenarios
Like having more options Interest in having rehab option but concern how smaller agencies might implement option (do not do rehabs typically contracted out) Who would perform rehabs and to what level General interest in longer more reliable vehicles no interest in short life (perceived as cheaper componentsreli abilitysafety)
No low pricebid not conducive to best value for rolling stock
No The mileages are too high for replacement the percentage of match funds We would be always running older behind the technological curve coaches
Effects of earlier bus replacement
No price benefits with shorter life components do not allow for shorterlonger life sourcing of parts for older vehicles is a BIG issue (longer life would increase problem)
Potentially more inventory control issues Vague answer
Reduced maintenance costs fuel costs midlife rehab costs emissions and increased customer satisfaction No negative impacts
Shortens time to adopt new techn (improved passenger amenities efficientlower emissions) Faster replacement means passengers benefit from newer equipment
Cheaper buses = cheaper components = decreased reliability
Federal Transit Administration 134
Useful Life of Transit Buses and Vans Appendix A Final Report Summary of Transit Agency Survey
Issue Area WMATA (Washington)
Toronto Transit
Montgomery Co Ride-On
New York City Transit MBTA (Boston) LA MTA
(Los Angeles) Frederick Co Capital Metro (Austin TX)
Jefferson Transit
Extend Minimum Life Additional costs including maintenance
Little effect on current costs (policy is already at 15) some financial impacts from procurements that couldnt make 15 year Maintenance expenses would increase because of increase in mean distance between failures
Increased need for mini overhauls of components slightly increase - planned component overhauls helping to maintain reliability and cost increases
Increased maintenance cost and demand more durable vehicles from manufacturers
Maintenance expenses would increase approx 8 per year
Addition of mid-life overhaul program higher rate of catastrophic failures and corresponding operating costs Costs increase Mid-life overhaul $50-$100k plus 10-50 higher maintenance cost (higher component and structural failures) Reliability reduced by 10-25
Increased maintenance expenses Passenger complaints also an issue (80 are work trips 50 are captive riders)
Higher maintenance costs (corrosion could cause additional costs) Running repair costs could go up 10-15 plus paint cosmetic and corrosion repair to be evaluated for feasibility
Would limit ability to purchase replacement coaches when funding was available could force us to use antiquated less passenger friendly equipment and limit our ability to expand future service maintenance costs would increase
EnergyEmissions impacts of earlier bus replacement
Slight increase in emissions but larger increases from newer engine performance Slight reductions in energy efficiency from original engine performance but larger reductions from newer engine performances
Have not seen increase or decrease emissions not changing energy nearly the same no decline in performance
EnergyEmissio ns would increase by 8 a year
Difficult to quantify Energy efficiency No unless significant breakthrough in engine efficiency
No on emissions No on energy newer engines are getting less mpg
New technology is leading the charge to produce emissions free vehicles Not all older fleets will be able to retrofit to current and future EPA requirements
Federal Transit Administration 135
Useful Life of Transit Buses and Vans Appendix A Final Report Summary of Transit Agency Survey
Issue Area WMATA (Washington)
Toronto Transit
Montgomery Co Ride-On
New York City Transit MBTA (Boston) LA MTA
(Los Angeles) Frederick Co Capital Metro (Austin TX)
Jefferson Transit
Other options for FTA to consider
Consider an 8-year minimum life option for heavy-duty larger buses keep same level of quality (no decrease in quality) Would improve customer satisfaction reliability maintenance latest technologies emissions fuel economy educated workforce positive community perception
Other options Large regional transit agencies should be allowed to use proposed pooled procurement approach This allows for 90 reimbursement They would have to allow other regional operators to piggy-back on those procurements
Supports development of more durable better quality 10-year bus (30-ft Orions are too large for downtown) desire for sturdydurable short vehicle capable of extended heavy duty
No impact on performance maintenance plans would be tailored to bus needs
Base FTA replacement schedules on serviceagency type urban rural or non-profit high-volume or low-volume Based on these criteria use variable agency match as the incentive to regulate quality maintenance and vehicle life
Vehicle Components ndash Impacts of Life Expectancy
Is maintainability life expectancy of vehicle components a key retirement driver
Structural members determine life (reason to retire early) - everything else is replaceable (choice is replace vs maintain)
Yes CNG buses had to be retired at 12 due to high maintenance -dont know for hybrids (expect same as diesel) AC drives rebuild every 5 years on hybrids Expect 500k miles on engine Structural corrosion is limited by stainless steel composite panels and rust prevention efforts
No although concerns of general maintainability are a factor
No Retirement is aged-based not component-based No component is durable beyond expected 12-years Yes
Increasing maintenance and decreasing reliability is primary concern of age
Yes if corrosion is bad then consider early replacement Yes
Federal Transit Administration 136
Useful Life of Transit Buses and Vans Appendix A Final Report Summary of Transit Agency Survey
Issue Area WMATA (Washington)
Toronto Transit
Montgomery Co Ride-On
New York City Transit MBTA (Boston) LA MTA
(Los Angeles) Frederick Co Capital Metro (Austin TX)
Jefferson Transit
Components important to replacement decisions
Heavy-Duty Electrical system (tends to go at 15) Engine and transmission the most expensive
Body structure panels corrosive protection drive train and suspension on low-floor vehicles
Components changed on correctivefailure basis Engines transmission alternators starters AC compressors air compressors fuel injectors AVL assemblies
Interviewees area not capable of answer general sense that no parts in particular cause problems but typically a range of components become less reliable
Structure axes exterior skin floor corrosion Other issues typically resolved with proper maintenance
Body condition (ie leaking excessive corrosion) power plant electronics failure structural wear and integrity
Components with no impact on retirement decisions
Doors brakes controls windows bumpers and interior replaced on a corrective basis Doors brakes and controls below that expected
Brakes seats stanchions suspension steering transmission paint flooring signage and wheelchair lifts
Other Issues affecting Procurement Process
Current procurement policy for your agency
Best value negotiated based on price and other factors (low bid no good = lower quality)
Low bid with tight specifications and brand requirements No bids have been fully compliant Needed to negotiate relative compliance to specs Tight specifications focused on body undercarriage and panels are more important in procurement
RFP - price is only 10 of evaluation great emphasis on quality (evaluated by quality selection committee) Low-bid
IFB amp RFP More advanced vehicles are usually purchased via negotiated procurement Believe procurement process has an effect on quality and expected life of bus
Purchase through the state (MD MTA) Have piggy backed some procurements with other counties (low bid) Best value RFP
Piggy-back on existing FTA approved bids
Federal Transit Administration 137
Useful Life of Transit Buses and Vans Appendix A Final Report Summary of Transit Agency Survey
Issue Area WMATA (Washington)
Toronto Transit
Montgomery Co Ride-On
New York City Transit MBTA (Boston) LA MTA
(Los Angeles) Frederick Co Capital Metro (Austin TX)
Jefferson Transit
Impact of procurement methods on useful life
Big impact on useful life due to higher quality product received (vs low bid = lower quality)
Impacts on longer-life requirements
Precludes known quality components No impacts
Best value as lowest bid does not always mean best value as the life expectancy could be worse Believes procurement process has impact on quality and expected life of bus
Yes If the bid options necessary for our service conditions are not available and yet we need to purchase the vehicle that vehicle will be retired at the FTA minimum as opposed to exceeding the FTA replacement criteria
Suggestions
Enhance standard bus procurement guidelines to include performance-based specs and include more optionsalternati ves Current specs are too prescriptive
If there was a good way to accurately estimate vehicle life cycle costs for certain vehicles especially composite vehicles
Proviso for small agencies to add options necessary to their service area or require RFP agencies to include in bids as many allowable options as possible It is not unusual to see a large agency produce specs with only their agency needs in mind and attach no options lists
Federal Transit Administration 138
Useful Life of Transit Buses and Vans Appendix A Final Report Summary of Transit Agency Survey
Issue Area WMATA (Washington)
Toronto Transit
Montgomery Co Ride-On
New York City Transit MBTA (Boston) LA MTA
(Los Angeles) Frederick Co Capital Metro (Austin TX)
Jefferson Transit
Impact of Buy America on useful life
Yes structural members drive useful life and Buy America does limitaffect how a manufacturer develops structure Buy America also limits design improvements due to limited marketcompetiti on for change
No requirements in Canada but do limit European content to 20 due to their use of low-carbon steel Have restricted use of frame design and manufacture from European suppliers
Only applies to state-funded vehicles (which is a minority)
Reduce heavy-duty to 8 years
Somewhat true Most Buy America compliant bus manuf build their bus structures outside of US though dont know whether this has a qualitative impact Given how small the US bus industry has become the current provisions may be restricting how quickly US Transit Properties can adopt the latest international technologies
Not qualified to answer (purchase through state)
Useful life is dependent upon procuring agency to know what they need and how to maintain
The Buy-America requirements increase the cost of a vehicle without necessarily increasing its useful life Lowering the Buy-America percentage will allow manufacturers to produce vehicles at a lower cost with the same or better quality Example Mercedes-Benz
Altoona Testing - Use of Testing Results
Yes use them but not rigorous enough Results included in price and other factor measurements for bid (weighed) More agencies should use results recommend providing actual test results (vs passfail)
Yes use the bus testing results in the evaluation and require the New York drive files from the B-35 bus route shaker test Not directly
Yes new purchasing is a in-houseconsultan t function consultants use Altoona when advising clients or writing specs Data could be organized to establish quality ratings as a guide in achieving minimum life requirements Suggestion Expand Altoona testing to include quality rating system for buses
Yes reports are reviewed and discussed with vendors prior to all new bus deliveries
Not qualified to answer (purchase through state)
Yes testing is required by APTA guidelines More testing as in Altoona will provide better information for agencies (but who will pay)
The Altoona testing is done in such a manner that it is of no practical value to maintenance personnel or to operations for passenger safety Competition between manufacturers is the best for achieving a quality long-life product Altoona simply adds costs passed on to the transit system
Federal Transit Administration 139
Useful Life of Transit Buses and Vans Appendix A Final Report Summary of Transit Agency Survey
Issue Area WMATA (Washington)
Toronto Transit
Montgomery Co Ride-On
New York City Transit MBTA (Boston) LA MTA
(Los Angeles) Frederick Co Capital Metro (Austin TX)
Jefferson Transit
ldquoWhite Bookrdquo
Adapt guidelines to reflect alternative useful life options
Very good idea guidelines should be performance-based and offer alternativesopti ons for each components include extended warranties as just warranties Need to develop plans to respond to many design exceptions
Yes and use more onerous specs from Toronto NYCT
See similar options for mediumlight duty Yes
Only if there was an understanding that 10 years in heavy urban transit can be far more severe than 15 in suburban
Not qualified to answer (purchase through state)
Yes as long as todays 12-year do not become tomorrows 10-year
Would you consider using design specification for an FTA approved 10 year bus
No due to 15-year Board policy If policy changes then maybe for limited specialty fleet like downtown circulators No
If bus components remained at 12-year level
Yes but not necessarily agree that a 15-year bus for suburban use got more funding than a 10-year bus for urban use Maybe
Would you consider using design specification for an FTA approved 15 year bus
Yes this way now would appreciate more work on bus specs for longer life buses
Already use No experience in medium or light duty but sounds ok No
I have yet to see a bus that will hold up well to 15 years service in heavy duty urban environment
No 15 years is too long Yes
Would you consider similar useful life Do not use No the light-options for medium except for No experience duty market is and light vehicles paratransit but sounds ok Yes Not applicable OK
Federal Transit Administration 140
Useful Life of Transit Buses and Vans Appendix A Final Report Summary of Transit Agency Survey
Issue Area WMATA (Washington)
Toronto Transit
Montgomery Co Ride-On
New York City Transit MBTA (Boston) LA MTA
(Los Angeles) Frederick Co Capital Metro (Austin TX)
Jefferson Transit
Use of useful life exempt FTA demonstration programs to advance adoption of new technologies
Good idea to help move state of industry forward use to introduce new technologies
Alternatives of interest to TTC are procurement of prototype buses from several manufactures to test in service before selection of supplier This is similar to NYCT program Also maybe lease buses to test new manufacturer or model in operations before authorizingappr oving for bid
RideOn is too small not in-depth experience with maintenance No Yes
No as a smaller agency small staff limited resources limited capability to support technologies Yes No
Bus Procurement Difficulties
Difficulties keeping a vehicle in service through the minimum life requirement
Yes used vehicles for lighter duty shorter service spans then moved to spare and contingency until 12-year
Yes 150 Orion 6 CNG buses that were unreliable and high maintenance Retired at 12-years trouble getting to that 12 years
Yes premature failure of cradles and frames
Yes Methanol TMC buses in 1992 need to be converted to diesel to run reliably
Goshens and Thomas SPFs found to be unreliable for fixed route now use for limited service on lower duty cycles or low ridership routes This increases service hours of more reliable vehicles
Yes TMC CNG buses (outdated CNG) No
Requested waiver from the service-life policy
Yes but rejected Not applicable No
Not in recent memory except for a handful of accident buses No No
Federal Transit Administration 141
Useful Life of Transit Buses and Vans Appendix A Final Report Summary of Transit Agency Survey
Issue Area WMATA (Washington)
Toronto Transit
Montgomery Co Ride-On
New York City Transit MBTA (Boston) LA MTA
(Los Angeles) Frederick Co Capital Metro (Austin TX)
Jefferson Transit
Reaction to creation of a Lemon Law for problem vehicles
Good concept difficult to qualityenforce Suggest for this to work there should be an industry-wide finding of poor performance (not just agency) - exclude them from counting against spare fleet allow agency to decide optimum retirement and ensure remaining years funding rolled into next procurement (perhaps with higher local funding reqs)
Yes Had New Flyer and Icarus artic space frame corrosion problem and structural failures that had to be expensively maintained to make 12-years Great
Yes under constraint that manufactures should be compelled to ensure the structural integrity and durability of bus frames with min maintenance requirements over the min life of the vehicle
Yes if it were necessary Option should not be used 1) following completion of normal warranty period 2) when the annual operating cost or fleet reliability are substantially different than the rest of an agencys fleet
Yes but need to define conditions under which it would be applicable Suggest really only apply to limited and fairly serious conditions OwnSelf problems not sufficiently problematic to warrant use of option
Yes if responsible party (bus supplier) is dealt with Yes
Other Suggestions and or Comments
Policies need to consider difference between large urban operators and small suburban or rural operators
Federal Transit Administration 142
Useful Life of Transit Buses and Vans Appendix B Final Report Summary of Vehicle Manufacturer Survey
APPENDIX B SUMMARY OF VEHICLE MANUFACTURER SURVEY
Issue Area Orion Bus Industries Millennium Transit Optima Bus Corporation
General Life Expectations
Current buses manufactured
Two models 30-40 length 44-47 passengers Minimum life 12 years Expected 18 years Altoona tested No inventory provided
Three models (1) Opus Under 30 305 length 23-27 passengers Minimum scheduled manuf estimated life of 12 years (2) Opus Under 35 35 length 31 passengers Minimum scheduled and manuf estimated life of 12 years (3) American Heritage Streetcar 2875 length 28 passengers Minimum scheduled and manuf estimated life of 12 years
Marketing based on FTA categories (yn) Yes
Yes vehicles in 12-year service-life category tested and sold Yes
Vehicles not subjected to Bus Testing Regulation
Yes the Sprinter Van bought by smaller agencies with local money
Yes and No Same buses are sold in Canada which do not have to meet regulation (sell based on service record)
Yes FTA granted waiver to perform additional testing on Opus Under 35 vehicles
Specific expected-life characteristics
18-year vehicles in Canada Agency customers ask for longer warranty period and extensive corrosion resistance in Eastern part of country (high salt environment)
No transit operators want buses that hold-up (argue their environment is the most severe) Not all 12-year buses created equal (New York does not purchase Bluebirds tested at 12-year does not hold up to NY environment)
Yes request from agency customers is for heavy-duty transit buses normally aligned with FTA minimums However they may choose to keep vehicles in service longer Primary determinants of vehicle retirement age operating environment and duty cycle maintenance needs above 12-year age
Recommendation of mid-life overhaul (yn)
Do not recommend on chassis Cannot predict future condition of vehicle depends on duty environment maintenance etc
Do not recommend or get involved No benefits to manufacturer if agency does or does not perform overhaul - overhaul funds go to component vendors
Recommend following vehicle and component maintenance schedule Need for mid-life overhaul dependent on duty cycle of vehicle
Components included in overhaul recommendation
No on chassis Engine and transmission should be replaced Manufacturer provides few unique parts for overhaul most parts are purchased directly from vendor
Provide few unique parts for overhaul but most parts are purchased directly from vendors
Engines transmission suspension and axle (approx cost of overhaul or update is a little over $18k)
FTA Minimum Requirements
Impacts by FTA minimums (design driver)
Yes especially the 12-year category Category fundamentally drives design 12-year is heavy-duty benchmark
Buses built to meet FTA service-life requirements Impacts would be from changes (1) sell less buses if increased to 15 years and (2) be put in competition with lighter-bus manufacturers if requirements decreased to 8 years Corrosion requirements dictate use of stainless steel and aluminum instead of mild steel
Yes design and durability affected by minimums Compete in heavy-duty market thus need to design for 12-year500000-mile vehicles Build relationship with agency as vehicles sold approach minimum ages Also affects sales of parts after components fail past warranty period but before reaching minimum age Drive design by specifying service-life requirements to component suppliers chassis and body durability and testing requirements of category establish engineering design levels for load stress and fatigue criteria
Federal Transit Administration 143
Useful Life of Transit Buses and Vans Appendix B Final Report Summary of Vehicle Manufacturer Survey
Issue Area Orion Bus Industries Millennium Transit Optima Bus Corporation
Vehicles or components affected
Components not replaceable or cannot be rebuilt - such as chassis
Structure required to last 12 years without class 1 or 2 failures Warranty periods depends on component manufacturers Engine manufacturers charger higher for 12-year warranty (ie price of 4 engines)
Chassis body axles suspension engine transmission floor crash worthiness and air conditioner
Customer requests different than FTA minimums
Canada requests 18-year vehicles Others want a 15-year life for chassis CNG tanks with 15 to 20-year service life No No
RecommendationsChang es to current FTA minimums
There has been debate over 12-year build vehicles not durable enough (ensure testing is within right category) Altoona testing should be more (stress the durability more) and have more of a passfail aspect
No changes Lower minimums would put company in competition with smaller-bus manufacturers Increase of service life would result in less vehicles sold Do not believe longer more durable bus can be manufactured Already build most durable buses out there
No changes recommended to current minimums Classifications should be revised if tied directly to Altoona Bus Testing and monitorregulation should be revised (less arbitrary subjective method) FTA minimum retirement ages are arbitrary classifications driven by Altoona testing Testing not always reliable benchmark as manufacturers choose category to test under Vehicles are also not given rating Testing not monitored by FTA or governing body In the eyes of the industry Altoona bus testing drives life expectancy of buses although transit operators cannot review testing reports Bus testing reports should be a determining factor because it gives insight into durability and reliability (failure types problems etc)
New Vehicle Life Classes
Current usefulnessapplicability of vehicle classification
Categories are not definite enough They conflict with EPA definitions and weight classes are too loose It is what it is
Minimum retirement age based on Altoona Bus Testing no passfail assignment manufacturers choose classification to test under Vehicles are given classification when it completes test regardless of length of test time or durability This gives marketing edge which forces manufacturers to test at highest possible classification regardless of vehicles quality or durability
Option 1 Longer-life vehicles
Interest in manufacturing Yes No do not believe more durable buses can be manufactured
No components would not survive longer minimum retirement ages In most cases component manufacturers cannot produce more durable components Also duty cycle plays a key role in retirement decisions Larger specialized BRT vehicles would more likely have strenuous duty cycle affecting ability to meet longer-life requirement
Characteristics
Characteristics would include being inherently resistant to corrosion and have a higher GVW (over 33000 lbs category)
Component suppliers would have to provide longer more durable components Longer-life vehicle would be heavier (heavy-duty parts or higher-cost materials) would reduce fuel economy and would increase purchase price
Federal Transit Administration 144
Useful Life of Transit Buses and Vans Appendix B Final Report Summary of Vehicle Manufacturer Survey
Issue Area Orion Bus Industries Millennium Transit Optima Bus Corporation
Challenges
Challenges would be to encourage a modular design (beneficial to operators) Same bus in different lengths the weight class is the discriminator Rebuild cycles would create problems with part availabilities such as engine parts
Could not support todays technology for long periods (engines software)
Cannot increase life-expectancy of components increase purchase price
Option 2 Shorter-life vehicles
Interest in manufacturing Yes - the need of transit operators differ especially duty cycles and suburbanurban areas
No focus is on 12-year buses Less desirable would mean eliminating options use of mild steel less expensive components European design methodology previously used for low-floor bus - did not pass testing Not our market niche
Characteristics Lighter weight lower-cost components lower expectation of durability maybe lighter duty engine
Truck engines and axles cheap seats medium heavy-duty engines Not our market niche
Challenges Establishing market for these vehicles Getting cost out from components not structure Not our market niche
Other options None None
New vehicle types hybrid electric Properties diesel or gasoline engine that rotates a generator providing electric power to electric mothers through either batteries or ultra-capacitors to an electric motor driving the rear wheels
Vehicle Components
Effects of maintainabilitylife-expectancy of vehicle component on service life
Structure dictates life of vehicle - retirement comes as structure cannot be economically repaired Yes specifically the major component systems
Yes maintainability and availability of parts plays a key role in retirement decision Another driver of retirement is the perception of ridership and willingness to ride older vehicles (vs newer vehicles that may attract more riders)
Components that impact service life Structure chassis
Engine (CNGs do not last as long as diesel) transmission destination signs axles HVAC CNG tanks
No specific components listed Overall maintainability and quality of vehicle impacts retirement decision
Components that do not impact service life Wear items glass moving parts wiring harness
Seats hand rail-stanchions radios destination signs fare box windows - changed as needed
Customers have transferred the following items from 15-year old vehicles to new vehicles in all of our models fare boxes radios and voice announcement systems
Challenges to vehicle components with longer vehicles
No challenges to longer-life vehicles - already build 18-year vehicles
Challenges to longer-life no change to engine warranty by engine manufacturers batteries on hybrids
Parts becoming obsolescent as a driving factor Challenges of longer-life vehicles to the following components affect all models engine transmissions axles lack of stainless steel chassis suspension package fiberglass components electronic systems (including wiring) HVAC system brakes air system alternators and doors (and door controls)
Federal Transit Administration 145
Useful Life of Transit Buses and Vans Appendix B Final Report Summary of Vehicle Manufacturer Survey
Issue Area Orion Bus Industries Millennium Transit Optima Bus Corporation
Challenges to vehicle components with shorter vehicles
Challenges to shorter-life vehicles take out cost with reduced service life smaller engines lighter axle rating
Challenges to shorter-life vehicles de-rating components (use lighter-duty components from automotive industry) mild steel structure (if benign operating environment was certain)
Downgrade of design of each vehicle Vehicles have been designed for 12-year500000-miles mindset of industry demand for this vehicle type would have to change if life expectancy decreased No specific components stated
Component life-expectancy driven by other markets Yes - axles brakes engines (but not transmission)
Yes - engine transmission HVAC (by refrigerator truck market) axles (drop axles not specific to bus market - off road is larger market)
Federal Transit Administration 146
Useful Life of Transit Buses and Vans Appendix C Final Report Engineering Interviews
APPENDIX C ENGINEERING INTERVIEWS
Questions
Service-life policy and T
How does your agency define the useful life
CATS (Charlotte NC)
argets
By age and then mileage
Golden Gate Transit (San Francisco CA)
Useful life is determined primarily by age but GGT will keep buses longer if condition is good
Harris County Metro (Houston TX)
Useful life is FTA 12 year
LA MTA (Los Angeles CA)
The MTA uses the FTA definition of useful life 500000 miles 12 years 40000 milesyear
Lane Transit District (Eugene OR)
LTD defines useful life according to FTArsquos service life criteria
MUNI (San Francisco CA)
Muni uses 12 years as economic useful life of buses Munirsquos buses are often in service for up to 16 years
WMATA (Washington DC)
FTA and APTA New Bus Procurement Guidelines
Does your agency have a target useful life for your standard 40 foot transit buses What is it for smaller buses
Target is for 12 years but can get 15 years from heavy-duty buses The target is 5 years150000 miles for cutaways
Target is 12 years Buses are typically in-service for 14 years OTR coaches are kept for 16 years Target is 12 years
13 years or 500000 miles
LTD targets 15-year service life Smaller buses are replaced at 7-year Same as above Policy is 15 years
Life Extending Practices What are they
What life extending practices does your agency utilize if any
MTA uses an extensive maintenance program to maintain its fleet of 2400 buses Nothing on structure
Midlife overhauls of engines flooring and other components as needed fleet wide campaigns as necessary (battery replacement etc)
Preventive maintenance (PM) and Vehicle overhaul (VOH) programs
Preventive maintenance
PMs are done by mileage at 6K and 12K As the Gillig Phantoms aged they were required to have a 3K PM due to engine issues
Rigorous PM program which includes engine oil and transmission fluid analysis at each oil change interval providing early warning of problems
Mid-life overhauls interiors suspension paint engine Basic
Daily ndash pretrip 3000 mile ndash Minor mechanical 12000 mile - Major mechanical PM inspections 18-day interior housecleaning
Specify corrosion resistant structure materials (aluminum stainless steel)
New bus specification are for a stainless steel structure
Do not spec entire stainless steel bus but will specify at critical areas such as power train mounting locations
Do not spec stainless steel
None Eugene doesnrsquot have issues with corrosion
Buses speced to be built with corrosion resistant materials but allow the bus builder to specify brand
Stainless steel amp protected carbon steel
Specify undercoating
Undercoating is included in specification None
Interior tube rust inhibitor Tectyl 506 Waxoy or equal Undercarriage Tectyl 127 CG or equal
Federal Transit Administration 147
Useful Life of Transit Buses and Vans Appendix C Final Report Engineering Interviews
Questions CATS (Charlotte NC)
Golden Gate Transit (San Francisco CA)
Harris County Metro (Houston TX)
LA MTA (Los Angeles CA)
Lane Transit District (Eugene OR)
MUNI (San Francisco CA)
WMATA (Washington DC)
Warranty What are your warranty requirements for a 40rsquo transit bus
Engine
2 year standard warranty (new spec calls for 5 year extended warranty)
5 year extended warranty
2 year standard warranty METRO does not use extended warranties as FTA does not fund
2 year standard warranty
Standard 2-year On new engine designs LTD purchases extended 5-year warranties
5 years 300000 miles
Transmission
1 year standard warranty (new spec calls for 5 year extended warranty)
5 year extended warranty
2 year standard warranty
2 year standard warranty Same as engine
5 years 300000 miles
If more than 10 failure rate considered fleet
Bus structure 12 year corrosion warranty
2 year standard warranty
defect per specification
40rsquo bus ndash 12 years 500000 miles
Procurement and Legislation
Do you think the low bid process has impacted the expected useful life of transit buses and vans
CATS does not use low bid they use a Best Value negotiated procurement
Yes ndash bus builders must use lower costlower quality materials to compete andor use lower costless qualified labor to assemble bus GGT has used a negotiated procurement on their last vehicle purchase
Yes ndash they had a very bad experience with Neoplan which was a low bid procurement
Yes absolutely The MTA has been burned by low bid processes
Not if you have a tight specification If your specification is tight the manufacturer can not substitute inferior quality parts that could cause service life issues
Muni uses negotiatedbest value method In past electric trolley bus fleet procurement the low bid winner was an Eastern European manufacturer that typically had shorter life spans than North American customer expectations
Yes Negotiated procurements give more flexibility to acquire more reliable components and system
Do you think the Buy America ACT in any way impacts the expected useful life of transit buses and vans
Limits choices especially for BRT type vehicles However this is not a current concern for CATS No
No ndash does not impact useful life
No negative impact LTDrsquos challenge is complying with the regulation in performing inspections and assuring component content source
There is not enough background data to know this
EPA Emissions
CATS stated that this is a good thing It has not influenced early retirement of buses but has required retrofits to older buses
CARB regulations more stringent than EPArsquos Resulted in small California transit bus engine market of only 400 engines per year making these engines an expensive
MTA operates in the most restrictive regulatory environment State EPA audits emissions twice per year
Diesel particulate filters on 2004 engine plugging prematurely causing excess back pressure This back pressure is expected to reduce life of the engine Too early to tell how much
Federal Transit Administration 148
Useful Life of Transit Buses and Vans Appendix C Final Report Engineering Interviews
Questions CATS (Charlotte NC)
Golden Gate Transit (San Francisco CA)
Harris County Metro (Houston TX)
LA MTA (Los Angeles CA)
Lane Transit District (Eugene OR)
MUNI (San Francisco CA)
WMATA (Washington DC)
FTA ADA
Has impacted facilities but not vehicles No None
On a recent bus procurement an ADA compliant wheelchair ramp was mechanically inferior to manufacturersquos standard ramp because the cables were tested and found more likely to fail in service
FTA Bus Testing Regulation No
Good requirement Helps assure the availability of quality products
Impact of Service Environment Vehicle Structure on Useful Life
Have you had any issues in meeting the FTA 12 year minimum life requirement
Have not had an issue with 40rsquo buses No
Engine cradles with NABI buses were a problem ndash but were addressed by the manufacturer
No as long as maintenance is performed the MTA meets the 12 year life
No issues with meeting 12-year life No
Aggressive PMrsquos and mid-life overhaul programs have allowed us to meet minimum life requirements for transit buses
What is the primary determinant of the useful life of the structure (service environment age mileage) Mileage
Service environment A unique Californian impact is the requirement to recycle bus wash water ndash this was found to be corrosive to the buses
Service environment Buses on demanding service routes get beat up much more quickly than buses of similar age or mileage
1) Construction 2) Environment The MTA operates in a harsh environment Every street has manhole storm drains that beat up the fleet on a daily basis
Age mileage repair costs and safety issues
Munirsquos severe service environment (ie the topography)
Service environment age and mileage plus life extending practices
To what extent does was your service environment the cause of early vehicle retirement
Charlottersquos service environment not a major determinant of useful life
GGT replaces buses at 12-14 years this is not necessarily because they are worn out
Results in cracking body loosening of panels more rattles
The environment is a key factor in the life of the fleet
It doesnrsquot Mild temperature
Early failures are sometimes seen around the interfaces between suspension and frame or axle and suspension if not properly designed for the Muni topography
Service environment causing early retirement of the vehicle is highly unlikely
Do you consider your service environment more severe average or less severe than the national average
Less severe to average (roads are in good shape do not use salt no snow)
Less severe to average Average
More severe The buses are abused by the environment loads and service demands Less severe
Severe Muni topography is unique and requires structure development is necessary and limited to a certain extent by foreign or domestic suppliers
Average to more severe due to winter salting of road surfaces
Federal Transit Administration 149
Useful Life of Transit Buses and Vans Appendix C Final Report Engineering Interviews
Questions CATS (Charlotte NC)
Golden Gate Transit (San Francisco CA)
Harris County Metro (Houston TX)
LA MTA (Los Angeles CA)
Lane Transit District (Eugene OR)
MUNI (San Francisco CA)
WMATA (Washington DC)
Different designs Low Floor or Articulated Do you expect the Only expect 12 years Too early to tell Low useful life of low-floor from low floor buses Have not run the low floor buses require vehicles to be less but could get 15 floor artics long more frequent Hope and expect the than or greater than years from high floor enough to form an replacement of same based on standard buses buses opinion No No issues suspension parts testing and analysis Equal to standard bus
What about articulated vehicles Na
Recently purchased some New Flyer articulated buses Too early to tell Same as above Equal to standard bus
What about for smaller cutaway and body on frame constructed buses
Had a 5-year target but high mileage and demanding service made it difficult to achieve
METRO Lift vans were originally purchased to keep for 3 years ndash will keep for 5 years No data
Muni does not employ these types of buses
Plannedscheduled overhauls
Do you perform a major mid-life rehab No
No Repair replace components as needed
No Buses are fixed when broken
Sometimes (no due to funding and manpower)
No LTD has studied but decided it wasnrsquot worth doing
No (just drive train) Flooring and other components as necessary
Mid life overhauls are performed to standard 40rsquo 12-year bus at the 4 and 8-year interval
Do you perform engine transmission overhauls at regular intervals
No Replace with rebuilt engine transmission as needed Typically swap out an engine at 200000-300000 miles (6-9 years)
GGT performs regular oil and fluid analysis for engines and transmissions to identify pending enginetransmission problems
No Will replace as needed A bus will go through 2-3 engines and 3-4 transmissions over its life Engines 250000
Yes Engine 350k miles Trans 250k miles Yes Midlife
Engine and transmission overhauls are performed to standard 40rsquo 12-year bus at the mid-life vehicle overhaul
Reliability of vehicles as age increases
How significant are reliability issues as your vehicles approach the end of their useful life
CATS is a young agency and it does not have long term service experience
GGT has not seen a deterioration of vehicle reliability as vehicles age This attributed to the PM program
Will see vehicles become more expensive to run as they age
If the fleet is maintained the life can be achieved
Maintenance requirements do go up as age of vehicle increases
It varies from fleet type to fleet type
Vehicles approaching the end of their useful life are less reliable and more costly to maintain depending on the life extending practices employed
Do you have quantitative measures of reliability versus vehicle age
Quarterly audits are performed that sample 25 of the fleet
METRO tracks operating costs not necessarily reliability Buses are replaced when they are considered too expensive to operate
No In process of switching to a new maintenance management system Yes
No quantitative measures of vehicle reliability vs age are employed at this time
Federal Transit Administration 150
Useful Life of Transit Buses and Vans Appendix C Final Report Engineering Interviews
Questions CATS (Charlotte NC)
Golden Gate Transit (San Francisco CA)
Harris County Metro (Houston TX)
LA MTA (Los Angeles CA)
Lane Transit District (Eugene OR)
MUNI (San Francisco CA)
WMATA (Washington DC)
Have you encountered issues sourcing replacement components for older buses
Yes ndash this is always an issue
Yes ndash can no longer get parts for Neoplans and have problems sourcing parts for European OTR coaches In contrast older RTS buses kept in service for up to 18 years
Yes Example Detroit Diesel has gone out of the transit bus business Parts are no longer available
No Oldest buses are 1991 Gilligs Parts are available
Yes This happens often with non-US supplied parts or if the bus builder or supplier goes out of business
New vehicle procurement contracts contain provisions that ensure support from the OEM for the life of the vehicle for items such as replacement parts
Alt-Fuels and Hybrid Vehicles
Has the useful life of alt fuels vehicles been less than standard diesel vehicles
CATS has two Allison hybrids There is concern that the extra weight may impact structure life
NA Will begin testing ethanoldiesel blend this year
No longer operate alternate fuel vehicles due to fueling station issues
Too early to tell The CNG buses require 30 more manpower to maintain Na Too early to tell
We anticipate their useful life to be equal to standard bus
Alternatively how does their long-term maintainability compare with standard diesel vehicles
The hybrid buses have very low maintenance Both buses have exceeded 50 longer brake life and may also achieve longer oil change intervals NA Na
Too early to compare Anticipate Muni may have to spend more time maintaining batteries Equal to standard bus
New Technologies (AVL AVM APCs Multiplexing collision avoidance cameras)
How do you expect the long-term performance of vehicles with new technologies will compare with older less technology oriented vehicles
Will take more resources to maintain buses with additional equipment which will impact vehicle life if maintenance resources switched from vehicle PM to maintaining new technology
Too early to tell Think of this type of equipment as separate from the bus Upgrades are necessary as the equipment ages independent of the bus age Equal to standard bus
Alternatively how do you expect their long-term maintainability to compare to standard vehicles with less equipment
All of these systems result in higher electrical loads on the bus It is expected that there will be electrical system problems previously not seen on standard buses with less equipment
Maintaining new technologies is a challenge The staff are not trained on maintaining new technologies
The more high tech features a bus has the more failures are experienced For example a new fleet of electric trolley buses had significantly higher failure rates (lower mean distances between failures) Equal to standard bus
Federal Transit Administration 151
Useful Life of Tran Final Re
sit Buses and Vans Appendix C port Engineering Interviews
Questions CATS (Charlotte NC)
Golden Gate Transit (San Francisco CA)
Harris County Metro (Houston TX)
LA MTA (Los Angeles CA)
Lane Transit District (Eugene OR)
MUNI (San Francisco CA)
WMATA (Washington DC)
Do you think reliability with these vehicles as they age will lead to the need for a greater spare fleet
Anticipate that all these additional systems will have an impact on long-term life of electrical system due to the additional loads (have not had good reliability with cameras) Bus radio is the system that will keep a bus from going into service
No Currently buses are not held out of service if these systems (ie cameras) are not working
These technologies will increase maintenance costs but will not impact useful life
This may be an issue Too early to tell Yes
No at this time we do not anticipate the need for a greater spare fleet due to reliability issues
Federal Transit Administration 152
Useful Life of Transit Buses and Vans Appendix D Final Report Minimum Life-Cycle Cost Methodology
APPENDIX D MINIMUM LIFE-CYCLE COST METHODOLOGY
Chapter 7 presents the results of life-cycle cost analyses for each of the existing FTA minimum service-life categories This appendix presents the methodology behind that analysis Specifically this discussion includes
bull Adjustment of participant agency supplied life-cycle cost data to reflect differences in annual fleet mileage
bull Calculation of annualized cost factors
bull Calculation of annualized vehicle acquisition major component replacements and vehicle rehabilitation costs
bull Regression analysis and annualization of OampM costs
bull Calculation of total annualized costs
Conversion of Participant Life-Cycle Costs to Reflect Differences in Annual Mileage
Agencies and vehicle manufacturers participating in this study supplied life cycle costs for major component replacements and rehabilitations of their transit vehicles (see Appendix E) Note however that the agencies providing data have annual mileages that are close to the national average (ie about 37000 miles annually for a 12-year bus) Hence while the timing of major component replacements for these agencies is representative of industry averages they are not representative of agency fleets with lower or higher average annual mileages (eg 25000 or 45000 miles per vehicle per year respectively) As discussed in Chapter 6 agencies with lower annual fleet mileages per vehicle will be able to ldquostretch-outrdquo their major component replacement cycles while agencies with high annual mileages per vehicle will need to accelerate those cycles relative to operators with average fleet mileages
Therefore to conduct analyses considered representative of the nationrsquos full distribution of transit fleet mileages the life-cycle cost data were adjusted to replicate the annual mileage of three separate annual vehicle mileage groups 25000 miles 35000 miles and 45000 miles This adjustment was completed by first converting each componentrsquos reported replacement age to a replacement mileage value based on the annual vehicle mileage of the operator supplying the data (ie multiply annual mileage by the component replacement age) Next the replacement mileage values for each major component were used to determine the number of years that component would remain in service for fleets of varying annual average vehicle mileages For example if bus engine was determined to have roughly 250000 miles between rebuilds operators with only 25000 miles in annual service only need to rebuild this engine in (250000 miles) (25000 miles per year) = 10 years In contrast an agency operating its vehicles 45000 miles each year will need to rebuild the engine in roughly 55 years
Federal Transit Administration 153
Useful Life of Transit Buses and Vans Appendix D Final Report Minimum Life-Cycle Cost Methodology
Calculation of Annualized Cost Factors
Next all vehicle costsmdashincluding the cost of vehicle acquisition major component replacements rehabilitation activities and operating and maintenance (OampM) costsmdashneed to be converted to an annualized basis Annualizing tells us what the cost of each item would be on a per year basis if maintained in service for x years Here the value of the annualized cost can be calculated for any value of x allowing determination of the annualized cost if the vehicle is owned for a period of time including 1 year 2 years 12 years 18 years or more
Table D-1 The factor for annualizing any cost is given by the Annualization Factors (70) following Annualization
Years Factor 1Years minustAnnualized Cost Factor= (i (1minus(1+ i) )) 1 1070 1000
2 0553 0500 Here t is the number of years a component or 3 0381 0333
4 0295 0250 vehicle is expected to remain in service and i is the 5 0244 0200 discount rate (set to 7 percent for this analysis in 6 0210 0167 compliance with OMB guidance) Note that the 7 0186 0143
value of the annualized cost factor declines as the 8 0167 0125 number of service years for a component increases 9 0153 0111 (ie as the cost of that component is spread over an 10 0142 0100 increasing number of service years) The values for 11 0133 0091 the annualized cost factor at different years of 12 0126 0083
13 0120 0077 service are presented in Table D-1 (for the sake of 14 0114 0071 comparison Table D-1 also includes the value of 15 0110 0067 1years a frequently used but imprecise means of 16 0106 0063 estimating annualized cost) 17 0102 0059 18 0099 0056
Calculation of Annualized Vehicle 19 0097 0053 20 0094 0050 Acquisition Major Component
Replacement and Rehabilitation Costs
Next these annualized cost factors were used to estimate the annualized value of all vehicle costs excluding OampM costs This was merely a matter of annualizing the costs of vehicle acquisition major component replacement and rehabilitation activities using the annualization factors This calculation is presented below The double summation represents the discounted cost of all components (x) replaced as of vehicle age t The value Annualized Vehicle Cost t then provides a vehiclersquos total annualized cost value were that vehicle to be retired at age t (excluding OampM costs which are considered next)
minustAnnualized Vehicle Costt = (Vehicle Acquisition Cost+sumsumComponentCostxt )(i (1minus(1+ i) ))
Federal Transit Administration 154
Useful Life of Transit Buses and Vans Appendix D Final Report Minimum Life-Cycle Cost Methodology
Regression Analysis and Annualization of OampM Costs
To this point the analysis has excluded all vehicle OampM costs (eg fuel preventive maintenance and corrective maintenance) As noted in Chapter 6 OampM costs tend to increase overtime as vehicles age (ie as smaller parts begin to fail more regularly and fuel economy tends to decrease) The first step for this analysis was to develop regression models to model increasing OampM costs with increasing vehicle age Unfortunately this study did not have the resources required to conduct a detailed primary data collection effort of OampM costs by vehicle age for all five minimum service-life categories (and across multiple operators) For this reason members of the study team drew upon an earlier analysis completed for a group of over 40 different small and medium sized bus operators based in Illinois Together these Illinois operators use each of the bus and van types represented by FTArsquos five minimum service-life categories and have multiple years of cost records for their vehicle fleets
Analysis of Illinois OampM cost data yielded the following regression model of OampM cost per mile at vehicle life-to-date (LTD) mileage x for 40-foot buses (t-stats in parenthesis)
Cost per mile at LTD mileage x = -0783 + 401E-07( LTD Miles) ndash 00317(Operating Speed) (-941) (511) (-527)
The results of this model are presented in Figure D-1
Figure D-1 Life Cycle Cost Profiles Annualized OampM Costs
(35000 miles per year 40 Ft bus)
$0
$5000
$10000
$15000
$20000
$25000
$30000
$35000
$40000
$45000
$50000
Ann
ualiz
ed V
ehic
le O
ampM
Cos
ts
Low Speed (8 mph) 35000 miles per yr
Medium Speed (12 mph) 35000 miles per yr
High Speed (20 mph) 35000 miles per yr
1 2 3 4 5 6 7 8 9 10 11 12 13 14 15 16 17 18 19 20
Vehicle Age (years)
Finally the equation above provides the cost per mile at different LTD mileages However to calculate the annualized values of OampM costs at age t these LTD mileage based costs must be summed across the full life of the vehicle through age t discounted and then annualized
Federal Transit Administration 155
Useful Life of Transit Buses and Vans Appendix D Final Report Minimum Life-Cycle Cost Methodology
Calculation of Total Annualized Costs
Once OampM costs are added to the mix the final calculation of total annualized cost is given by
minustAnnualizedVehicle Costt = (Vehicle Acquisition Cost+sumsumComponentCostxt + LTD O amp M Costs)(i (1minus (1+ i) ))
This analysis was then used to calculate total annualized cost at each age to determine the specific vehicle age at which life-cycle costs for each vehicle type are minimized
Federal Transit Administration 156
Useful Life of Transit Buses and Vans Appendix E Final Report Heavy-Duty Vehicle Life-Cycle Cost Analysis
APPENDIX E HEAVY-DUTY VEHICLE LIFE-CYCLE COST ANALYSIS
Chapter 7 provides a high-level minimum life-cycle cost analysis for heavy-duty 12-year transit buses The presentation there is indented to provide the reader with a high-level overview of that analysismdashyielding an understanding of the results but without focusing on the details of the analysis In contrast this appendix reproduces much of that presentation this time providing an understanding of the details behind that analysis (including application of the minimum life-cycle cost analysis as presented in Appendix D)
Heavy Duty Vehicle Life-Cycle Cost Analysis
Using the analysis of national differences in operating characteristics and rehabilitation practices as presented in Chapter 6 this appendix develops a detailed life-cycle cost analysis of the 12shyyear 40-foot vehicles that constitute the bulk of the nationrsquos bus transit fleets This analysis is then used to identify that point in the vehicle life cycle when the sum total of all annualized costs (capital operating maintenance and rehabilitation) is minimized This minimum life-cycle cost point represents a financially optimal age to retire and replace a vehicle in effect providing a measure of ldquoeconomic useful liferdquo (as distinguished from an engineering useful life or other measure) As expected the point at which life-cycle costs are minimized can vary appreciably given differences in annual mileages average operating speeds and rehabilitation practices
Specifically this analysis considers the following life-cycle costs
bull Acquisition Cost and Disposal Value Purchase cost plus related procurement costs as well as the expected sale price or scrap value of the used vehicle
bull Expected Component Replacements and Mid-Life Overhaul Costs This includes the cost of all expected component replacements and rebuilds that naturally occur over the life of a vehicle (eg drive train rebuild) as well as the cost of any additional planned mid-life overhaul activities (if any) These costs are oriented toward the larger component replacement rebuild or rehabilitation needs and exclude the cost of minor vehicle repairs Examples include ndash Engine and transmission rebuilds ndash Other expected component replacements (eg brakes tires batteries suspension) ndash Mid-life overhaul costs (eg repainting replacement of flooring upholstery windows
bodywork)
bull Operating and Maintenance Costs Includes the cost of fuel preventative maintenance programs and the cost of all labor and parts for minor repairs as required to maintain vehicles in good working order
Federal Transit Administration 157
Useful Life of Transit Buses and Vans Appendix E Final Report Heavy-Duty Vehicle Life-Cycle Cost Analysis
The following sub-sections provide an analysis of the expected annual cost of these different cost types throughout the vehicle life cycle beginning with a discussion of expected component replacement and mid-life overhaul costs
Expected Component Replacement and Overhaul Costs
Figure E-1 presents the distribution of expected major component replacement and overhaul costs over a potential 20-year life cycle for a 40-foot transit bus (hence it excludes the cost of vehicle acquisition and all other vehicle operating and maintenance costs) The chart assumes a vehicle that averages 35000 miles per year over the full life cycle The chart also considers the two cases of (1) those agencies that complete an extensive mid-life overhaul and (2) those agencies that do not complete a mid-life rebuild but carry out their major component replacements on a continuous as-needed basis The analysis also assumes that the number of times a given replacementrebuild activity is performed depends on the vehiclersquos age at the time of retirement For example if engine rebuilds occur on roughly a six-year cycle (every 210000 miles) then this activity will occur once for a vehicle retired before 12 years twice for a vehicle retired before 18 years and 3 times for a vehicle retired at age 20 or later Similarly it is assumed that agencies currently pursuing a major mid-life rebuild program at vehicle age 7 (for example) would want to repeat the process again at age 14 if the vehicle was expected to operate well past that age
Figure E-1
Life Cycle Cost Profile Major Component Replacements and Overhauls
Maj
or C
ompo
nent
Rep
lace
men
ts a
nd O
verh
aul C
osts
$140000
$120000
$100000
$80000
$60000
$40000
$20000
$0
(Assumes 35000 miles per year)
Major Mid-Life Overhaul (40ft)
Continuous Rehabilitation (40 ft)
Optional (Rehab activities not
performed within 1 to 3 years of retirement)
1 2 3 4 5 6 7 8 9 10 11 12 13 14 15 16 17 18 19 20
Vehicle Age (years)
In reviewing Figure E-1 it is easy to identify the timing of major vehicle replacement activities In particular the timing of the seven-year major mid-life overhaul (and its potential repetition at age 14) stands out clearly These investments include the cost of engine and transmission rebuilds repainting significant rehab and replacement of vehicle interiors (flooring upholstery and windows) bodywork as needed some electrical work and other upgrades In contrast the mid-life peaks for those agencies that do not perform a major mid-life overhaul are significantly
Federal Transit Administration 158
Useful Life of Transit Buses and Vans Appendix E Final Report Heavy-Duty Vehicle Life-Cycle Cost Analysis
lower (fewer rehab activities equate to lower costs) but also have higher cost peaks for the intervening years (as some replacement activities tend to be more spread out) The smaller peaks primarily represent replacement of those components having shorter expected lives including tires brakes and batteries
From the viewpoint of evaluating FTArsquos service-life policy the key point is that whether or not an agency conducts a major mid-life overhaul there are major cost cycles that are repeated throughout an vehiclersquos life cycle which are roughly concurrent with drive-train rebuilds (eg the cost peaks at roughly ages 6 to 7 and 12 to 14 in Figure E-1) These major cycles help guide agency rehab-replacement decisionsmdashspecifically agencies will only complete a major vehicle rehabilitation initiative if they intend to keep that vehicle in service for at least three to five years after these improvements have been made For example in the case of a heavy-duty vehicle approaching 12 years in age an agency will only reinvest in that vehicle (eg rebuildreplace the engine and transmission) if the agency intends to obtain an additional three to five years of revenue service from that vehicle Otherwise these rehabilitation activities will be avoided (to save cost) and the vehicle will be retired after the minimum retirement requirements have been satisfied To summarize vehicle rehab and replacement decisions are determined by the timing of the vehiclersquos major reinvestment cycles with the timing of these cycles determined by annual vehicle mileage average operating speed and environment and agency maintenance practices
Finally the difference in the timing of the ldquomid-liferdquo activities as presented in Figure E-1 is an artifact of the particular operating characteristics maintenance practices and service performance standards of the sample of agencies that provided data for this study In other words it should not be expected that all major mid-life overhauls only occur at age seven (they may happen earlier or later depending on differences in average annual mileage rehab policies funding availability and other factors) Similarly those agencies that perform more continuous rehabs do not all concentrate their ldquomid-liferdquo activities at age six Rather these activities are ldquospread outrdquo over multiple years Again the exact timing of these activities can and do occur at differing times for different agencies depending on differences in annual mileages rehabilitation practices and operator finances
Figure E-2 highlights how differences in annual vehicle mileages can impact the timing and cost of component replacement and overhaul activities Specifically this example presents the expected life-cycle cost profile for agencies performing major mid-life rebuilds but with fleet vehicles traveling an average of 45000 35000 or 25000 miles per year As expected vehicles traveling fewer miles per year require less frequent component replacements (and hence lower average annual costs) while higher mileage vehicles have more frequent component replacement needs This same analysis is repeated for those agencies that do not perform major mid-life rehabs in Figure E-3
Federal Transit Administration 159
Useful Life of Transit Buses and Vans Appendix E Final Report Heavy-Duty Vehicle Life-Cycle Cost Analysis
Figure E-2 Life Cycle Cost Profiles Major Component Replacements and Overhauls
(Agenices Performing Major Mid-Life Overhauls)
1 2 3 4 5 6 7 8 9 10 11 12 13 14 15 16 17 18 19 20
Vehicle Age (years)
Annualized Acquisition Major Component Replacement and Overhaul Costs
The analysis next adds the cost of vehicle acquisition to the component and mid-life rehabilitation costs considered above (operating and maintenance costs are considered shortly) All of these costs are then annualized over different time periods The combined annualized costs are presented in Figure E-4 The cost values in this chart provide a measure of the average cost of ownership for a 40-foot vehicle at each vehicle age15 As the number of years of ownership increase the vehiclersquos acquisition cost is spread over an increasing number of years thus reducing the average annualized cost of ownership (leading to the downward sloping curve) The bumps in this curve capture the timing of major component replacement and overhaul activities (costs that also decrease on an annualized basis as vehicle age increases as these costs are spread over increasing years of service)
$0
$20000
$40000
$60000
$80000
$100000
$120000
$140000
$160000
$180000
Maj
or C
ompo
nent
Rep
lace
men
ts a
nd O
verh
aul C
osts
Major Mid-Life Overhaul (40ft) 45000 miles per yr
Major Mid-Life Overhaul (40ft) 35000 miles per yr
Major Mid-Life Overhaul (40ft) 25000 miles per yr
Optional (Rehab activities not
performed within 1 to 3 years of retirement)
15 More precisely annualized cost is not the actual cost divided by the number of years of service (eg acquisition cost vehicle age) Rather annualized cost represents the stream of annual payments the net present value of which are equivalent to the initial investment cost Specifically the annualized cost of the vehicle acquisition cost for any age is given by
minus Vehicle Age )(Acquisition Cost ) (i (1minus (1+ i) ( ))
Federal Transit Administration 160
Useful Life of Transit Buses and Vans Appendix E Final Report Heavy-Duty Vehicle Life-Cycle Cost Analysis
Figure E-3 Life Cycle Cost Profiles Major Component Replacements and Overhauls
(Agenices Performing Continuous Rehabilitations) $120000
Continuous Rehab (40ft) 45000 miles per yr
Continuous Rehab (40ft) 35000 miles per yr
Continuous Rehab (40ft) 25000 miles per yr $100000
$80000
Optional (Rehab activities not
performed within 1 to 3 $60000 years of retirement)
$40000
$20000
$0
1 2 3 4 5 6 7 8 9 10 11 12 13 14 15 16 17 18 19 20
Vehicle Age (years)
Figure E-4 Life Cycle Cost Profiles Vehicle Acquisition Major Component
Replacements and Overhaul Costs (excludes OampM costs) (Assumes 35000 miles per year)
$140000
$120000 Major Mid-Life Overhaul (40ft)
Continuous Rehabilitation (40 ft) $100000
$80000
$60000
$40000
$20000
$0 1 2 3 4 5 6 7 8 9 10 11 12 13 14 15 16 17 18 19 20
Vehicle Age (years)
Figure E-5 reproduces the analysis in Figure E-4 for those agencies that do pursue comprehensive mid-life overhauls but this time for the three annual mileage groupings including 45000 35000 or 25000 miles Figure E-6 does the same for agencies that perform vehicle rehabilitation on a more continuous basis Both of these charts capture the increase in annualized cost as annual vehicle miles increase the higher annualized costs for those agencies pursuing
Tota
l Ann
ualiz
ed C
osts
M
ajor
Com
pone
nt R
epla
cem
ents
and
Ove
rhau
l Cos
ts
Federal Transit Administration 161
Useful Life of Transit Buses and Vans Appendix E Final Report Heavy-Duty Vehicle Life-Cycle Cost Analysis
extensive mid-life overhauls and the overall flattening of the annualized cost curves as the number of years of service approaches and surpasses 12 years
Figure E-5 Life Cycle Cost Profiles Vehicle Acquisition Major Component
Replacements and Overhaul Costs (excludes OampM costs) (Agencies that Perform Major Mid-Life Overhauls)
$140000
$120000
$100000
$80000
$60000
$40000
$20000
$0
Tota
l Ann
ualiz
ed C
osts
To
tal A
nnua
lized
Cos
ts
Major Mid-Life Rebuild (40ft) 45000 miles per yr
Major Mid-Life Rebuild (40ft) 35000 miles per yr
Major Mid-Life Rebuild (40ft) 25000 miles per yr
1 2 3 4 5 6 7 8 9 10 11 12 13 14 15 16 17 18 19 20
Vehicle Age (years)
Figure E-6
Life Cycle Cost Profiles Vehicle Acquisition Major Component Replacements and Overhaul Costs (excludes OampM costs)
(Agencies that Perform Continuous Rehabilitation) $140000
$120000
$100000
$80000
$60000
$40000
$20000
$0
Continuous Rehab (40ft) 45000 miles per yr
Continuous Rehab (40ft) 35000 miles per yr
Continuous Rehab (40ft) 25000 miles per yr
1 2 3 4 5 6 7 8 9 10 11 12 13 14 15 16 17 18 19 20
Vehicle Age (years)
Federal Transit Administration 162
Useful Life of Transit Buses and Vans Appendix E Final Report Heavy-Duty Vehicle Life-Cycle Cost Analysis
$0
$5000
$10000
$15000
$20000
$25000
$30000
$35000
$40000
$45000
$50000
Ann
ualiz
ed V
ehic
le O
ampM
Cos
ts
Low Speed (8 mph) 35000 miles per yr
Medium Speed (12 mph) 35000 miles per yr
High Speed (20 mph) 35000 miles per yr
Annualized Operating and Maintenance Costs
The analysis above considers all life-cycle costs excluding basic operating and maintenance (OampM) costs (ie the cost of fuel and corrective and preventive maintenance) As described above vehicle OampM costs tend to increase as the total number of vehicle miles increase OampM costs also tend to be higher for fleets operating in more congested urban areas and hence experiencing heavy-duty cycles Figure E-7 presents estimates of changes in annual vehicle operating and maintenance costs based on data obtained from a sample of bus operators throughout the State of Illinois
Figure E-7 Life Cycle Cost Profiles Annualized OampM Costs
(35000 miles per year 40 Ft bus)
1 2 3 4 5 6 7 8 9 10 11 12 13 14 15 16 17 18 19 20
Vehicle Age (years)
Total Annualized Life-Cycle Costs
Finally this section combines all of the prior annualized costsmdashincluding the costs of vehicle acquisition major component replacement major overhaul (if any) and operations and maintenance (OampM) costsmdashinto a single annualized cost measure The analysis then considers the annualized vehicle costs and minimum cost replacement points for the following combinations of operator characteristics
bull Performance of major mid-life overhaul yes or no
bull Differing annual average mileages 25000 35000 and 45000 miles per year
bull Number of overhauls (for agencies performing major mid-life overhauls) or drive train rebuilds (for agencies performing continuous rehabilitation) over the life of the vehicle including No overhaul (or drive train rebuild) one overhaul (or drive train rebuild) and multiple overhauls (or drive train rebuilds)
This represents a total of 18 different scenarios for analysis
Federal Transit Administration 163
Useful Life of Transit Buses and Vans Appendix E Final Report Heavy-Duty Vehicle Life-Cycle Cost Analysis
Agencies Performing Major Mid-Life Overhauls
Figure E-8 presents the total life-cycle cost profile (including annualized acquisition component replacement vehicle overhaul and OampM costs) for an agency that (1) performs a major mid-life overhaul and (2) operates its fleet vehicles an average of 35000 miles per year (roughly the national average) The three lines in the chart consider the differing options of (1) performing no mid-life overhaul (including no mid-life drive train rebuild) (2) performing one mid-life overhaul (the standard) and (3) performing two ldquomid-liferdquo overhauls (the second to extend vehicle life toward 20 years)
Figure E-8 Total Life Cycle Cost Profiles
Tota
l Ann
ualiz
ed L
ife C
ycle
Cos
ts
$200000
$180000
$160000
$140000
$120000
$100000
$80000
$60000
$40000
$20000
$0
Major Mid-Life Overhaul 35000 miles per yr
No Overhaul
One Overhaul Only
Multiple Overhauls
End of useful life
1 2 3 4 5 6 7 8 9 10 11 12 13 14 15 16 17 18 19 20
Vehicle Age (years)
Note that the cost curve for the ldquono overhaulrdquo scenario has been cut off at age 8 while the curve for the ldquoone overhaul onlyrdquo curve has been cut off at vehicle age 15 These cut-off points reflect the assumption that agencies not performing an engine and transmission rebuild at approximately age six or seven cannot expect the vehicle to remain in reliable working order more than a few years (eg age eight) Similarly if the agency completed a major rebuild at age 7 an additional major rebuild will be required to maintain service quality beyond age 14 or 15 The results in Figure E-8 suggest that total annualized life-cycle costs are (1) minimized at different vehicle ages for the three major overhaul options (none one or two) and (2) are lowest for the one-overhaul option and highest for the two-overhaul option Table E-1 presents the cost minimum amounts and ages for these three alternatives
Federal Transit Administration 164
Useful Life of Transit Buses and Vans Appendix E Final Report Heavy-Duty Vehicle Life-Cycle Cost Analysis
Table E-1 Life-Cycle Cost Minimums Major Mid-Life Overhauls ndash 35000 Annual Miles
Number of Overhauls Annualized Life-Cycle Cost Minimum ($2006)
Vehicle Age at Cost Minimum (years)
No Overhaul $99000 Between 7 to 8 One Overhaul $91000 Between 14 to 15 Multiple Overhauls $96000 13
This option does not make logical sense as the minimum cost point is reached before the second major rehabilitation
Both the chart and table indicate that the one-overhaul option is the optimal choice from a cost perspective and that this minimum cost point is reached at roughly age 14 to 15 or two to three years after the current FTA service-life minimum for this ldquo12-yearrdquo vehicle type In contrast the multiple-overhaul option is not cost effective relative to either the no- or one-overhaul options (as its cost minimum is both higher and earlier than the one-overhaul alternative and prior to the second overhaul) Overall the annualized cost differences between each option are clear but not significantly different (ie the most expansive no-overhaul option is roughly 10 percent more than the least expensive one-overhaul option)
Figure E-9 Total Life Cycle Cost Profiles
Major Mid-Life Overhaul 45000 miles per yr
1 2 3 4 5 6 7 8 9 10 11 12 13 14 15 16 17 18 19 20
Vehicle Age (years)
The analysis above suggests that life cycle costs for a 40-foot vehicle averaging roughly 35000 miles per year and receiving a major mid-life overhaul occurs roughly around age 14 or 15 or two to three years after the current FTA minimum of 12 years Note here that 35000 annual miles is roughly the national average for this vehicle type
For vehicles with lower or high average annual mileages Figure E-9 considers the life-cycle cost profiles for the 45000 annual mile scenario and Figure E-10 for the 25000 annual mile scenario
$0
$20000
$40000
$60000
$80000
$100000
$120000
$140000
$160000
$180000
$200000
Tota
l Ann
ualiz
ed L
ife C
ycle
Cos
ts
No Overhaul
One Overhaul Only
Multiple Overhauls
End of useful life
Federal Transit Administration 165
Useful Life of Transit Buses and Vans Appendix E Final Report Heavy-Duty Vehicle Life-Cycle Cost Analysis
Figure E-10 Total Life Cycle Cost Profiles
Major Mid-Life Overhaul 25000 miles per yr
1 2 3 4 5 6 7 8 9 10 11 12 13 14 15 16 17 18 19 20
Vehicle Age (years)
High Annual Mileage (45000 per year) Figure E-9 considers the case of an agency that does perform an extensive mid-life overhaul with fleet vehicles traveling an average of 45000 miles per year In this case the one-overhaul option is clearly the most cost effective (Table E-2) In this case the cost minimum is reached somewhere between 11 and 12 years of vehicle life and close to 500000 miles In contrast neither the multiple major overhaul nor the no-overhaul options appear while the no-overhaul option being (marginally) the most expensive
Table E-2 Life-Cycle Cost Minimums Major Mid-Life Overhauls ndash 45000 Annual Miles
$0
$20000
$40000
$60000
$80000
$100000
$120000
$140000
$160000
$180000
$200000
Tota
l Ann
ualiz
ed L
ife C
ycle
Cos
ts
No Overhaul
One Overhaul Only
Multiple Overhauls
End of useful life
Number of Overhauls Annualized Life-Cycle Cost Minimum ($2006)
Vehicle Age at Cost Minimum (years)
No Overhaul $115000 7 One Overhaul $108000 Between 11 and 12 Multiple Overhauls $114000 Between 10 and 11
Low Annual Mileage (25000 per year) Figure E-10 considers an agency that does perform an extensive mid-life overhaul but with fleet vehicles traveling an average of 25000 miles per year In this case the no-overhaul option is the most cost effective (Table E-3) but only marginally more so as compared to the one-overhaul option
Table E-3 Life-Cycle Cost Minimums Major Mid-Life Overhauls 25000 Annual Miles
Number of Overhauls Annualized Life-Cycle Cost Minimum ($2006) Vehicle Age at Cost Minimum
No Overhaul $74000 10 One Overhaul $78000 17 Multiple Overhauls $79000 19
Federal Transit Administration 166
Useful Life of Transit Buses and Vans Appendix E Final Report Heavy-Duty Vehicle Life-Cycle Cost Analysis
As will be shown later when considering those agencies that do not perform a major-mid-life overhaul (ie those that perform continuous rehabilitations) agencies with lower annual mileage per fleet vehicle may be better off performing less than the full overhaul and retiring their 12shyyear fleet vehicles some time after ages 14 or 15 (Note here that this and all other scenarios were evaluated based on the data obtained for this study In reality it is not certain that there are any agencies with low annual miles per vehicle that actually perform a full life-extending overhaul)
Summary Agencies Performing Major Mid-Life Overhauls
In summary for those agencies that do perform major life-extending rehabilitations the one-overhaul option appears to be the most cost effective for most operators (ie those with average or higher annual mileage) From a cost-effective perspective those with lower mileage (ie less than or equal to 25000 miles annually) are likely best off performing a scaled-down rehabilitation around age 9 and then operating the vehicle past age 14 (this scenario will be considered in greater depth in the following section under the ldquocontinuousrdquo rehabilitation agency discussion) The multiple-overhaul option was not found to be cost effective within the scenarios considered here (in all cases this option experiences its cost minimum before a second rehabilitation is undertaken) Finally while the one-overhaul option generally appears to be the most cost effective the total life-cycle cost difference between this and the no-overhaul option (on an annualized basis) was not found to be more than 10 percent
Implications for Useful Life Agencies Performing Major Mid-Life Overhauls
When evaluated solely in terms of cost-effectiveness vehicles with average mileages of between 35000 and 45000 miles per year reach their minimum annualized life-cycle cost after the FTArsquos current 12-year minimum retirement age (ie 14 years for vehicles with 35000 annual miles and 12 years for vehicles with 45000 annual miles) Assuming agencies with lower mileages choose to avoid the more-extensive mid-life rehabilitation in favor of the less-expensive continuous rehabilitation (as discussed below) these agencies reach their minimum annualized life-cycle cost between ages 14 and 16 (depending on the rehabilitation activities completed)
Agencies Practicing Continuous Rehabilitation
The preceding analysis considered those agencies that undertake major life-extending overhauls some time near the mid-point of a vehiclersquos expected useful life (examples include New York City Transit New Jersey Transit and WMATA) These agencies are characterized by above-average duty cycles high ridership and highly congested urban environmentsmdashfactors that require more significant rehabilitation activities to ensure reliable operability and quality of service over the vehiclersquos life In contrast most US transit operators (in particular the smaller and mid-size operators) do not perform a single major mid-life overhaul Rather these agencies complete rehabilitation activities on an as-needed or continuous basis Moreover these agencies will ultimately perform many if not most of the same rehabilitation activities as those agencies that do complete a major overhaul but not in a single coordinated event In other words these operators tend to spread their rehabilitation activities throughout the vehiclersquos life cycle
Federal Transit Administration 167
Useful Life of Transit Buses and Vans Appendix E Final Report Heavy-Duty Vehicle Life-Cycle Cost Analysis
Rehabilitation Assumptions Once again agencies performing continuous vehicle rehabilitation complete many of the same rehabilitation activities as those conducting a full mid-life overhaul The following are key examples of rehabilitation activities not typically performed by continuous rehabilitation operators chassis or structural element refurbishment or reconstruction (not related to a significant accident) major body work complete refurbishment of vehicle interior replacement of fare collection equipment interior climate control replacement and electrical system upgrades16
Similar to the analysis above this analysis of the continuous rehabilitation operators does assume that operators make a determination of how many major rehabilitation cycles their vehicles undergo throughout the vehiclersquos life cycle Specifically the analysis considers the options of (1) one drive train rebuild (2) multiple drive train rebuilds or (3) no drive train rebuild Despite its name the ldquono drive train rebuildrdquo scenario considered here does assume one transmission rebuild three or four years into the vehicle life cycle However this is the only drive train rehabilitation activity assumed under the ldquono drive train rebuildrdquo scenario
Average Annual Mileage (35000 per year) Figure E-11 presents the total life-cycle cost profile (including annualized acquisition component replacement vehicle overhaul and OampM costs) for an agency that (1) performs continuous vehicle rehabilitation and (2) operates its fleet vehicles an average of 35000 miles per year (roughly the national average)
Figure E-11 Total Life Cycle Cost Profiles
Continuous Rehabs 35000 miles per yr
1 2 3 4 5 6 7 8 9 10 11 12 13 14 15 16 17 18 19 20
Vehicle Age (years)
16 In practice the complete list of rehabilitation activities performed over a vehiclersquos life cycle can vary significantly across agencies Hence some ldquocontinuous rehab agenciesrdquo may perform one or more of the rehabilitation activities excluded from this analysis of this agency ldquotyperdquo Moreover continuous rehab agencies will sometimes need to perform some of these activities on a periodic basis due to extenuating circumstances (eg problem vehiclescomponents or accident repairs) The intention here is to group operators into two basic types those that do and those that do not perform major mid-life overhauls In reality there is a range of rehabilitation practices each particular to the specific needs objectives and management practices of the nationrsquos many bus operators
$0
$20000
$40000
$60000
$80000
$100000
$120000
$140000
$160000
$180000
$200000
Tota
l Ann
ualiz
ed L
ife C
ycle
Cos
ts
No Drive Train Rebuild
One Drive Train Rebuild Only
Multiple Drive Train Rebuilds
End of useful life
Federal Transit Administration 168
Useful Life of Transit Buses and Vans Appendix E Final Report Heavy-Duty Vehicle Life-Cycle Cost Analysis
Table E-4 shows that in this case the one-drive-train rebuild option is clearly the most cost effective Similar to the above the multiple-drive-train rebuild scenario experiences its cost minimum prior to the second rebuild event thus negating any logic to multiple rebuilds In contrast the no-drive-train rebuild scenario does not provide sufficient time to distribute vehicle acquisition costs over sufficient years to compete with the one-rebuild option This option is roughly 15 percent more costly as compared to the one-drive-train rebuild option
Table E-4 Life-Cycle Cost Minimums Continuous Rehabilitation ndash 35000 Annual Miles
Number of Overhauls Annualized Life-Cycle Cost Minimum ($2006) Vehicle Age at Cost Minimum
No Drive Train Rebuild $97000 7 One Drive Train Rebuild $85000 14 Multiple Drive Train Rebuilds $94000 11
High Annual Mileage (45000 per year) Figure E-12 considers the case of an agency performing continuous rehabilitations with fleet vehicles traveling an average of 45000 miles per year Here again the one-drive-train rebuild option is easily the most cost effective occurring at roughly age 14 This option is roughly 15 percent more cost effective as compared to the no-drive-train rebuild option
Table E-5 summarizes the life-cycle cost analysis and the results of the minimum-cost values for each of the high-mileage scenarios presented in Figure E-12 For this higher-mileage scenario the one-rebuild option is necessary to reach the 12-year life and provides the lowest minimum life-cycle cost
Figure E-12 Total Life Cycle Cost Profiles
Continuous Rehabs 45000 miles per yr $200000
$180000
$160000
$140000
$120000
$100000
$80000
$60000
$40000
$20000
$0
Tota
l Ann
ualiz
ed L
ife C
ycle
Cos
ts
No Drive Train Rebuild
One Drive Train Rebuild Only
Multiple Drive Train Rebuilds
End of useful life
1 2 3 4 5 6 7 8 9 10 11 12 13 14 15 16 17 18 19 20
Vehicle Age (years)
Federal Transit Administration 169
Useful Life of Transit Buses and Vans Appendix E Final Report Heavy-Duty Vehicle Life-Cycle Cost Analysis
Table E-5 Life-Cycle Cost Minimums Continuous Rehabilitation ndash 45000 Annual Miles
Number of Overhauls Annualized Life-Cycle Cost Minimum ($2006)
Vehicle Age at Cost Minimum
No Drive Train Rebuild $114000 6 One Drive Train Rebuild $98000 12 Multiple Drive Train Rebuilds $113000 9
Low Annual Mileage (25000 per year) Figure E-13 considers the case of an agency performing continuous rehabilitation with fleet vehicles traveling an average of 25000 miles per year In this case the one-drive train rebuild option is marginally more cost effective as compared to the no-rebuild option Once again the multiple-rebuild option makes little sense with the cost minimum attained just prior to the second engine rebuild event
Table E-6 summarizes the life-cycle cost analysis and the results of the minimum-cost values for each of the high-mileage scenarios presented in Figure E-13 For this higher-mileage scenario the one-rebuild option is necessary to reach the 12-year life and also provides the lowest minimum life-cycle cost
Figure E-13 Total Life Cycle Cost Profiles
Continuous Rehabs 25000 miles per yr $200000
$180000
$160000
$140000
$120000
$100000
$80000
$60000
$40000
$20000
$0
Table E-6 Life-Cycle Cost Minimums Continuous Rehabilitation ndash 25000 Annual Miles
Tota
l Ann
ualiz
ed L
ife C
ycle
Cos
ts
No Drive Train Rebuild
One Drive Train Rebuild Only
Multiple Drive Train Rebuilds
End of useful life
1 2 3 4 5 6 7 8 9 10 11 12 13 14 15 16 17 18 19 20
Vehicle Age (years)
Number of Overhauls Annualized Life-Cycle Cost Minimum ($2006)
Vehicle Age at Cost Minimum
No Drive Train Rebuild $76000 9 One Drive Train Rebuild $72000 17 Multiple Drive Train Rebuilds $78000 17
Federal Transit Administration 170
Useful Life of Transit Buses and Vans Appendix E Final Report Heavy-Duty Vehicle Life-Cycle Cost Analysis
Summary Agencies Performing Continuous Vehicle Rehabilitation
In summary for those agencies that do perform vehicle rehabilitations on a continuous as-needed basis the one-overhaul option appears to be the most cost effective for operators high average and low annual mileages (with the advantage being only marginal for lower mileage operators) The multiple-overhaul option was not found to be cost effective within the scenarios considered here (in all cases this option experiences its cost minimum before a second rebuild is undertaken) Finally the one-drive-train rebuild option was found to have roughly a 15-percent cost advantage over the other options for operators with 35000 or more in annual mileage This advantage was only a little more than 5 percent for agencies with 25000 in annual mileage
Implications for Useful Life Agencies Performing Continuous Rehabilitation
When evaluated solely in terms of cost-effectiveness vehicles with average annual mileages of 25000 35000 and 45000 miles per year reach their minimum annualized life-cycle cost on or after FTArsquos current 12-year minimum retirement age (ie 17 years for vehicles with 25000 annual miles 14 years for vehicles with 35000 annual miles and 12 years for vehicles with 45000 annual miles)
Summary Minimum Life-Cycle Cost Values and Ages
Tables E-7 and E-8 respectively identify the minimum annualized life cycle cost values and the ages at which these cost minimums are attained (by annual vehicle mileage) Each table highlights the cost minimum values and ages for each annual mileage group
Table E-7 Minimum Life-Cycle Cost Values ($2006)
Annual Vehicle Mileage
Agency Performs Major Mid-Life Overhauls
Agency Performs Continuous Vehicle Rehabilitation
No Overhaul
One Overhaul
Multiple Overhauls
No Drive Train Replacement
One Drive Train
Replacement
Multiple DriveTrain
Replacements 25000 $74000 $78000 $79000 $76000 $72000 $78000 35000 $99000 $91000 $96000 $97000 $85000 $94000 45000 $115000 $108000 $114000 $114000 $98000 $113000
Note Differences in costs between agencies that do and do not perform major mid-life overhauls reflect both (1) differences in rehabilitation activities performed and (2) differences in the cost data provided by those agencies participating in this study
With one exception minimum life-cycle cost is attained at or after the current FTA 12-year minimum The exception is those agencies with 25000 average annual miles that ordinarily perform a major life-extending rehabilitation (As noted above it is unlikely that agencies would pursue this option as with only 25000 miles per year it is likely more cost-effective to perform a less extensive rehabilitation around year 10 and then operate the vehicle until age 14 or later)
Federal Transit Administration 171
Useful Life of Transit Buses and Vans Appendix E Final Report Heavy-Duty Vehicle Life-Cycle Cost Analysis
Table E-8 Minimum Life-Cycle Cost Ages
Annual Vehicle Mileage
Agency Performs Major Mid-Life Overhauls
Agency Performs Continuous Vehicle Rehabilitation
No Overhaul
One Overhaul
Multiple Overhauls
No Drive Train Replacement
One Drive Train
Replacement
Multiple DriveTrain
Replacements 25000 10 17 19 9 17 17 35000 9 14 13 7 14 11 45000 7 12 11 6 12 9
Higher-Mileage Vehicles
The vehicles with 45000 miles experience their cost minimum at 12 years When converted to miles this equates to 540000 miles (12 X 45000) by the age of retirement Here again the life-cycle cost analysis results are in line with the current FTA minimum life requirements of 12 years or 500000 miles Hence although the age at which the minimum life-cycle cost value is attained continues to decline as average annual mileage increases these operators can take advantage of FTArsquos current minimum 12-year or 500000-mile-of-service option to ensure retirement at the minimum life-cycle cost point Hence based on this cost-effectiveness assessment the current minimum-life mileage requirement of 500000 appears reasonable
Generalized Analysis
The analysis above considered the minimum life-cycle cost for three specific annual vehicle mileages 25000 35000 (the national average) and 45000 Figure E-14 provides the ages and LTD mileages at which life-cycle costs are minimized for vehicles traveling between 20000 miles and 70000 miles annually Here the solid bars and left-side axis present the ages at which life-cycle costs are minimized for this range of annual vehicle mileages The solid line and right-hand axis present the LTD mileages at which life-cycle costs are minimized
Review of E-14 suggests that from a cost-effective perspective FTArsquos current retirement minimums (for large buses) of 12 years or 500000 miles represent reasonable choices For all annual vehicle mileages the minimum cost point is attained at either an age or mileage that exceeds one or both of the FTA minimums for these measures In all cases the difference between one and both of the current FTA minimum requirements also provides some margin for the early retirement of vehicles with reliability problems For example vehicles traveling an average of 40000 miles per year could reach their cost minimums at age 13 and an LTD mileage of 520000 miles Hence this provides a ldquomarginrdquo of one year or 20000 miles of optimal service beyond the FTA minimum for an average vehicle or the option to reduce service life by these amounts for less reliable vehicles Moreover this difference between the 12-year and 500000shymile minimum is smallest (while still providing a meaningful early retirement margin) for vehicles that average between 30000 and 45000 miles of travel per year Together these vehicles account for more than 70 percent of the nationrsquos large buses
Federal Transit Administration 172
Useful Life of Transit Buses and Vans Appendix E Final Report Heavy-Duty Vehicle Life-Cycle Cost Analysis
Figure E-14 Age and Mileage at Which Life-Cycle Cost Is Minimized
(Single Mid-Life Rehabilitation or Single Drive Train Replacement)
0
2
4
6
8
10
12
14
16
18
20 Ve
hicl
e A
ge L
ife-C
ycle
Cos
t Is
Min
imiz
ed (Y
ears
)
0
100000
200000
300000
400000
500000
600000
700000 Vehicle LTD
Miles Life-C
ycle C
ost Is Minim
izedAge Minimum Life Cost is Attained Life to Date Miles Minimum Life Cost is Attained
FTA Mileage Minimum
FTA Age Minimum
Average Annual Mileage
20000 25000 30000 35000 40000 45000 50000 55000 60000 65000 70000
Average Annual Mileage
Federal Transit Administration 173
Useful Life of Transit Buses and Vans Appendix F Final Report Agency Supplied Life-Cycle Cost Data
APPENDIX F AGENCY SUPPLIED LIFE-CYCLE COST DATA
The following are the contents of the life-cycle cost database created for this study using data supplied by the local transit operators and vehicle manufacturers responding to the study interview guide This information includes the expected cost and timing (in years) for replacement of all major vehicle components The cost data have been ldquopooledrdquo and averaged here to provide a more complete and representative set of vehicle life-cycle costs Given this pooling the tables below present cost data for three different ldquooperatorrdquo types bull Large operators that perform a major mid-life rehabilitations bull Operators that do not perform mid-life overhauls bull Vehicle manufacturers supplying life-cycle cost data
In the end the life-cycle cost data supplied by the vehicle manufacturers was not used for this study as it was found to differ significantly from the actual cost experiences of the nationrsquos transit operators Also the cost data supplied by agencies (including those that do and do not perform major rehab activities) is representative of agencies with average annual mileages of roughly 37500 annual miles (for those do perform major mid-life rehabilitations) and roughly 36000 miles (those than do not major mid-life rehabilitations) These cost data were then adjusted accordingly for the analyses presented in Chapter 6
Table F-1 Large Operator With Major Rehab
CompID Group Component Replacement
Cost Expected Life
(years) 1 Body Structure 14 2 Body Exterior and Applied Panels 3 Body Paint $250000 7 4 Body Interior 5 Body Floor $220000 7 6 Body Steps and Stepwells $12000 7 7 Body Wheel Housings $172000 7 8 Body Exit Passenger Doors $300000 7 9 Body Service Compartment
10 Body Engine door Access Doors 11 Operating Components Doors $3800 7 12 Operating Components Windshield Wipers and Washers $19000 3 13 Operating Components Headlight Assy Lighting 14 Operating Components Dimmer switch Controls 15 Operating Components Speedometer Instruments 16 Interior Trim Panels 17 Interior Headlining
Federal Transit Administration 174
Useful Life of Transit Buses and Vans Appendix F Final Report Agency Supplied Life-Cycle Cost Data
CompID Group Component Replacement
Cost Expected Life
(years) 18 Interior Front End 19 Interior Rear End 20 Interior Passenger Info and Advertising 21 Interior One Seat Insert Passenger Seats $340000 7 22 Interior Driverrsquos Seat $135600 3 23 Interior Rubber Floor Covering 24 Windows Windshield $250000 14 25 Windows Driverrsquos Side Window $50000 14 26 Windows Side Windows $300000 14 27 Insulation Insulation 28 Ancillary Items Dash Panels 29 Ancillary Items Visors 30 Ancillary Items Chime Exit Signal 31 Ancillary Items Outside Mirrors $76000 3 32 Ancillary Items Inside Mirrors 33 Passenger Assists Front Doorway 34 Passenger Assists Vestibule 35 Passenger Assists Overhead 36 Passenger Assists One Set Insert Longitudinal Seats 37 Passenger Assists Rear Doorway 38 Bumpers Front Bumper $189300 7 39 Bumpers Rear Bumper $92300 7 40 Destination Signs Run Box Run Numbers $654500 7 41 Destination Signs Rear Route Route Numbers 42 Destination Signs Front Main Auxiliary Destination Sign 43 Destination Signs Fare Collection Device 44 Destination Signs Wheelchair Lift $1200000 7 45 Destination Signs Wheelchair Restraints 46 ITS Components AVL 47 ITS Components APC 48 ITS Components Others 49 Propulsion System Engine Mounts $50000 7 50 Propulsion System Accessories $200000 7 51 Propulsion System Pump Hydraulic Drive $120000 7 52 Propulsion System Engine $1294000 7 53 Propulsion System Radiator Cooling System $370000 3 54 Propulsion System Transmission $1164300 4 55 Propulsion System Muffler Cat Conv Exhaust System $430000 7 56 Propulsion System EGR Emissions Control Devices $190000 7 57 Propulsion System Reman Diff Axles and Differential $900000 7 58 Propulsion System Sway Bar Suspension 59 Propulsion System Air Springs 60 Propulsion System Shock Absorbers
Federal Transit Administration 175
Useful Life of Transit Buses and Vans Appendix F Final Report Agency Supplied Life-Cycle Cost Data
CompID Group Component Replacement
Cost Expected Life
(years) 61 Propulsion System Steering Gear 62 Propulsion System Steering 63 Brakes Brake Chamber Actuators 64 Brakes Rear Axel Set Friction Material 65 Brakes Hubs $280000 7 66 Brakes One Drums or Rotors 67 Brakes Compressor Air System $350000 3 68 Brakes Wheels 69 Brakes Tires $160000 3 70 Fuel System Fuel Tank 71 Fuel System Fuel Filler 72 Electrical Components Batteries 73 Electrical Components Master Battery Switch 74 Electrical Components Fire Detectors 75 Electrical Components Radio Noise Suppression 76 Interior Climate Control Master control ac heat Controls 77 Interior Climate Control Plenums and Vents 78 Interior Climate Control Filter Air Intakes 79 Interior Climate Control Radio amp Public Address System $800000 7 99 BodyStructure Other Overhaul Costs $700000 7 99 BodyBody Other Overhaul Costs $300000 7 99 Interior Other Overhaul Costs $824400 7 99 Fare Collection Other Overhaul Costs $500000 14 99 Suspension Other Overhaul Costs $460000 7 99 Brakes Other Overhaul Costs $500000 7 99 Fuel System Other Overhaul Costs $150000 7 99 Electrical Components Other Overhaul Costs $381000 3 99 Interior Climate Control Other Overhaul Costs $1000000 7
Table F-2 Mid to Large Operator No Major Rehab
CompID Group Component Replacement
Cost Expected
Life (years) 1 Body Structure 12 2 Body Exterior and Applied Panels $18026 12 3 Body Paint $300000 6 4 Body Interior 12 5 Body Floor 12 6 Body Steps and Stepwells 12 7 Body Wheel Housings 12 8 Body Exit Passenger Doors $174244 6 9 Body Service Compartment 12
10 Body Engine door Access Doors $235071 6
Federal Transit Administration 176
Useful Life of Transit Buses and Vans Appendix F Final Report Agency Supplied Life-Cycle Cost Data
CompID Group Component Replacement
Cost Expected
Life (years) 11 Operating Components Doors $33223 4 12 Operating Components Windshield Wipers and Washers $24706 1 13 Operating Components Headlight Assy Lighting $10828 1 14 Operating Components Dimmer switch Controls $8962 3 15 Operating Components Speedometer Instruments $10168 3 16 Interior Trim Panels 12 17 Interior Headlining 12 18 Interior Front End 12 19 Interior Rear End 12 20 Interior Passenger Info and Advertising 12 21 Interior One Seat Insert Passenger Seats $183680 6 22 Interior Driverrsquos Seat $223733 4 23 Interior Rubber Floor Covering 12 24 Windows Windshield $250000 12 25 Windows Driverrsquos Side Window $133421 12 26 Windows Side Windows $228184 12 27 Insulation Insulation 28 Ancillary Items Dash Panels $10288 12 29 Ancillary Items Visors $23234 6 30 Ancillary Items Chime Exit Signal $18756 6 31 Ancillary Items Outside Mirrors $40228 1 32 Ancillary Items Inside Mirrors $3655 6 33 Passenger Assists Front Doorway 12 34 Passenger Assists Vestibule 12 35 Passenger Assists Overhead 12 36 Passenger Assists One Set Insert Longitudinal Seats $4592 6 37 Passenger Assists Rear Doorway 12 38 Bumpers Front Bumper $109112 12 39 Bumpers Rear Bumper $139336 12 40 Destination Signs Run Box Run Numbers 1 41 Destination Signs Rear Route Route Numbers $422300 3 42 Destination Signs Front Main Auxiliary Destination Sign $607100 6 43 Destination Signs Fare Collection Device 44 Destination Signs Wheelchair Lift $2100000 12 45 Destination Signs Wheelchair Restraints $9544 6 46 ITS Components AVL 47 ITS Components APC 48 ITS Components Others 49 Propulsion System Engine Mounts $8896 3 50 Propulsion System Accessories 51 Propulsion System Pump Hydraulic Drive $105676 3 52 Propulsion System Engine $1932000 6 53 Propulsion System Radiator Cooling System $386500 6
Federal Transit Administration 177
Useful Life of Transit Buses and Vans Appendix F Final Report Agency Supplied Life-Cycle Cost Data
CompID Group Component Replacement
Cost Expected
Life (years) 54 Propulsion System Transmission $1823200 4 55 Propulsion System Muffler Cat Conv Exhaust System $274239 6 56 Propulsion System EGR Emissions Control Devices $39619 3 57 Propulsion System Reman Diff Axles and Differential $201475 6 58 Propulsion System Sway Bar Suspension $38222 4 59 Propulsion System Air Springs $11842 4 60 Propulsion System Shock Absorbers $11923 4 61 Propulsion System Steering Gear 62 Propulsion System Steering $99586 6 63 Brakes Brake Chamber Actuators $10972 3 64 Brakes Rear Axel Set Friction Material $14000 1 65 Brakes Hubs $89087 6 66 Brakes One Drums or Rotors $11000 1 67 Brakes Compressor Air System $100866 3 68 Brakes Wheels $16968 6 69 Brakes Tires $40000 05 70 Fuel System Fuel Tank $202708 6 71 Fuel System Fuel Filler $28828 12 72 Electrical Components Batteries $8935 2 73 Electrical Components Master Battery Switch $1624 6 74 Electrical Components Fire Detectors $45369 4 75 Electrical Components Radio Noise Suppression 76 Interior Climate Control Master control ac heat Controls $100000 6 77 Interior Climate Control Plenums and Vents 12 78 Interior Climate Control Filter Air Intakes $1066 1 79 Interior Climate Control Radio amp Public Address System $16423 4 99 BodyStructure Other Overhaul Costs 12 99 BodyBody Other Overhaul Costs $18026 12 99 Interior Other Overhaul Costs $300000 6 99 Fare Collection Other Overhaul Costs 12 99 Suspension Other Overhaul Costs 12 99 Brakes Other Overhaul Costs 12 99 Fuel System Other Overhaul Costs 12 99 Electrical Components Other Overhaul Costs $174244 6 99 Interior Climate Control Other Overhaul Costs 12
Table F-3 Vehicle Manufacturer Costs
Comp ID Group Component Replacement
Cost Expected
Life (years) 1 Body Structure 12 2 Body Exterior and Applied Panels $31000 12 3 Body Paint 12
Federal Transit Administration 178
5
10
15
20
25
30
35
40
45
Useful Life of Transit Buses and Vans Appendix F Final Report Agency Supplied Life-Cycle Cost Data
CompID Group Component Replacement
Cost Expected
Life (years) 4 Body Interior 12
Body Floor 12 6 Body Steps and Stepwells 12 7 Body Wheel Housings 12 8 Body Exit Passenger Doors 12 9 Body Service Compartment
Body Engine door Access Doors $240000 12 11 Operating Components Doors 12 12 Operating Components Windshield Wipers and Washers $55000 12 13 Operating Components Headlight Assy Lighting $15000 12 14 Operating Components Dimmer switch Controls
Operating Components Speedometer Instruments $27000 12 16 Interior Trim Panels 12 17 Interior Headlining 12 18 Interior Front End 12 19 Interior Rear End 12
Interior Passenger Info and Advertising $5000 12 21 Interior One Seat Insert Passenger Seats 12 22 Interior Driverrsquos Seat 12 23 Interior Rubber Floor Covering 12 24 Windows Windshield $72000 12
Windows Driverrsquos Side Window $51000 12 26 Windows Side Windows $63000 12 27 Insulation Insulation 28 Ancillary Items Dash Panels 12 29 Ancillary Items Visors $16000 6
Ancillary Items Chime Exit Signal 12 31 Ancillary Items Outside Mirrors $7000 12 32 Ancillary Items Inside Mirrors $3000 12 33 Passenger Assists Front Doorway 12 34 Passenger Assists Vestibule 12
Passenger Assists Overhead 12 36 Passenger Assists One Set Insert Longitudinal Seats 12 37 Passenger Assists Rear Doorway 12 38 Bumpers Front Bumper 12 39 Bumpers Rear Bumper 12
Destination Signs Run Box Run Numbers 12 41 Destination Signs Rear Route Route Numbers 12 42 Destination Signs Front Main Auxiliary Destination Sign 12 43 Destination Signs Fare Collection Device 12 44 Destination Signs Wheelchair Lift 12
Destination Signs Wheelchair Restraints 12 46 ITS Components AVL
Federal Transit Administration 179
Useful Life of Transit Buses and Vans Appendix F Final Report Agency Supplied Life-Cycle Cost Data
CompID Group Component Replacement
Cost Expected
Life (years) 47 ITS Components APC 48 ITS Components Others 49 Propulsion System Engine Mounts $6000 6 50 Propulsion System Accessories $280000 6 51 Propulsion System Pump Hydraulic Drive $67000 6 52 Propulsion System Engine $1700000 6 53 Propulsion System Radiator Cooling System 12 54 Propulsion System Transmission $1170000 6 55 Propulsion System Muffler Cat Conv Exhaust System $75000 12 56 Propulsion System EGR Emissions Control Devices $68500 12 57 Propulsion System Reman Diff Axles and Differential $300000 12 58 Propulsion System Sway Bar Suspension 12 59 Propulsion System Air Springs $27000 3 60 Propulsion System Shock Absorbers $26000 3 61 Propulsion System Steering Gear 62 Propulsion System Steering 12 63 Brakes Brake Chamber Actuators $14000 6 64 Brakes Rear Axel Set Friction Material $20000 3 65 Brakes Hubs $26000 12 66 Brakes One Drums or Rotors $25000 3 67 Brakes Compressor Air System 12 68 Brakes Wheels $23000 12 69 Brakes Tires $40000 05 70 Fuel System Fuel Tank 12 71 Fuel System Fuel Filler 12 72 Electrical Components Batteries $10000 3 73 Electrical Components Master Battery Switch $4000 12 74 Electrical Components Fire Detectors $21000 12 75 Electrical Components Radio Noise Suppression 12 76 Interior Climate Control Master control ac heat Controls $78000 12 77 Interior Climate Control Plenums and Vents 12 78 Interior Climate Control Filter Air Intakes $4000 05 79 Interior Climate Control Radio amp Public Address System 12 99 BodyStructure Other Overhaul Costs 12 99 BodyBody Other Overhaul Costs $31000 12 99 Interior Other Overhaul Costs 12 99 Fare Collection Other Overhaul Costs 12 99 Suspension Other Overhaul Costs 12 99 Brakes Other Overhaul Costs 12 99 Fuel System Other Overhaul Costs 12 99 Electrical Components Other Overhaul Costs 12 99 Interior Climate Control Other Overhaul Costs
Federal Transit Administration 180
Useful Life of Transit Buses and Vans Final Report Useful Life of Transit Buses and Vans Final Report
METRICENGLISH CONVERSION FACTORS
FedeFederal Tranral Transit Administrasit Administrationtion 181181