used car dealership econometrics case study
TRANSCRIPT
Media Econometrics from a Used Car Dealership
example

Project Objectives and Analysis Scope
Project Objectives
1. Can we evaluate the effectiveness of multi-channel marketing in terms of units sold
and return on investment?
2. Can we provide insights in to future investment allocations across media that will
drive unit sales?
Analysis Scope
Identify and quantify the incremental impact of marketing on car sales across all
sites?
Determine the ROI of each marketing investment - online and offline.
Identify any synergies between key media channels.
Optimise media spending across channels to increase sales.

Used Car Sales & Seasonality
Dec 2010
Dec 2011 Dec 2012
Jan 2011
Jan 2012
Jan 2013
Mar 2011
Mar 2012
Mar 2013
Aug 2012
Aug 2011 Aug 2013
Seasonally recurring patterns are evident from the sales data. Sales plummet in December of
each year, only to rise again in January. March and August see an uplift in used sales due to
new car registration plate changes.
Modelling architecture
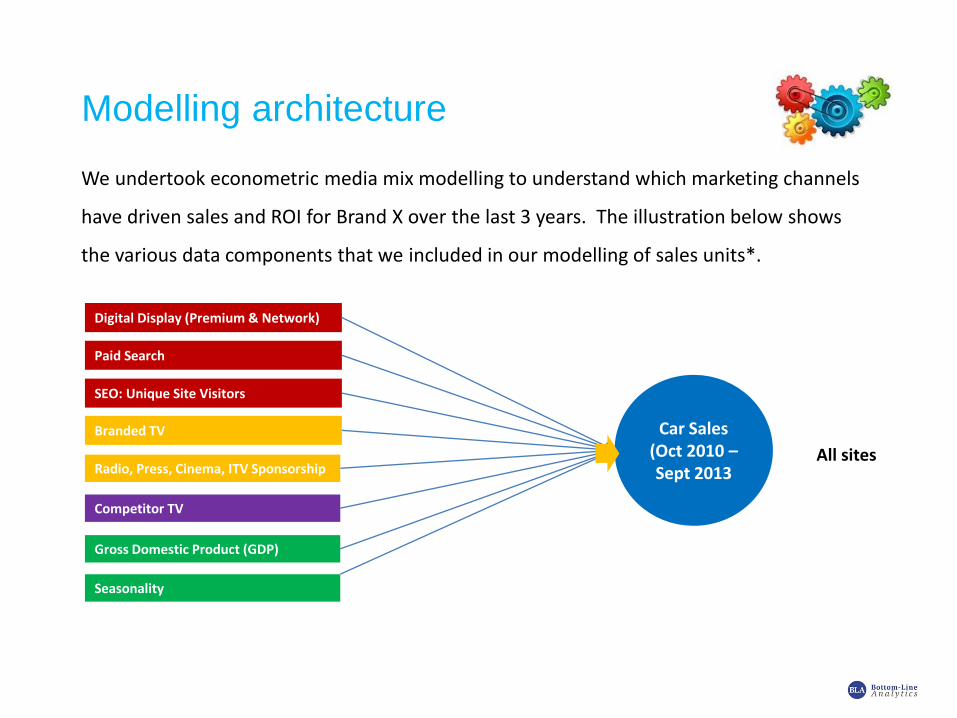
We undertook econometric media mix modelling to understand which marketing channels
have driven sales and ROI for Brand X over the last 3 years. The illustration below shows
the various data components that we included in our modelling of sales units*.
Digital Display (Premium & Network)
Branded TV
Paid Search
SEO: Unique Site Visitors
Radio, Press, Cinema, ITV Sponsorship
Competitor TV
Gross Domestic Product (GDP)
Seasonality
Car Sales (Oct 2010 – Sept 2013
All sites
Model Performance & Accuracy
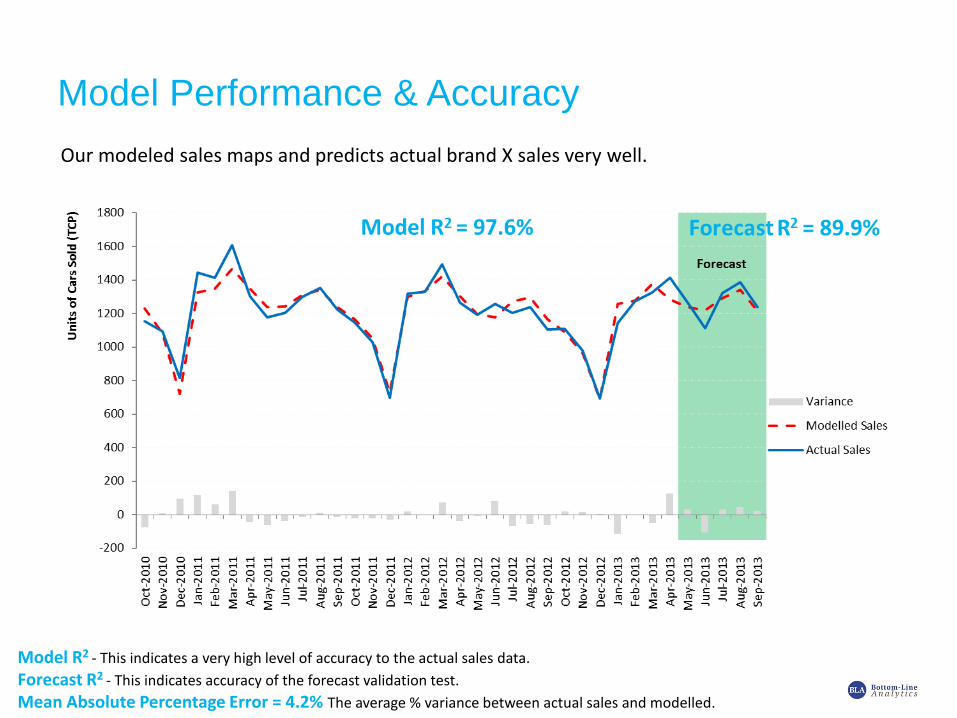
Model R2 - This indicates a very high level of accuracy to the actual sales data.
Forecast R2 - This indicates accuracy of the forecast validation test.
Mean Absolute Percentage Error = 4.2% The average % variance between actual sales and modelled.
Our modeled sales maps and predicts actual brand X sales very well.
Annual Marketing Contributions
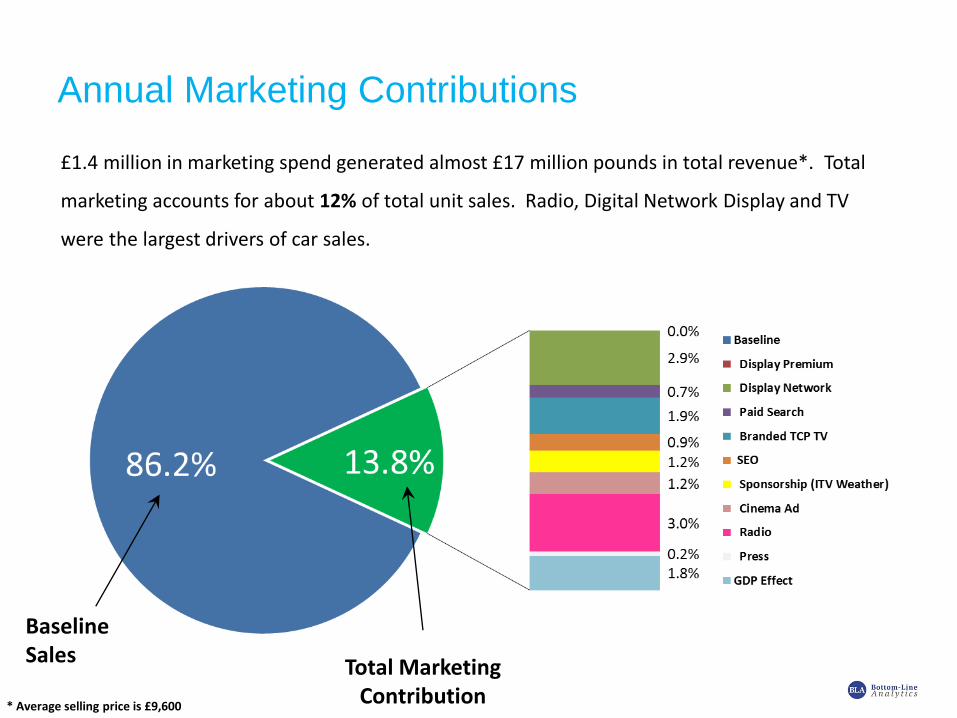
£1.4 million in marketing spend generated almost £17 million pounds in total revenue*. Total
marketing accounts for about 12% of total unit sales. Radio, Digital Network Display and TV
were the largest drivers of car sales.
Baseline Sales
Total Marketing Contribution
* Average selling price is £9,600

Incremental Marketing Contributions by Month
Gains from recent campaigns negated by competitive media.
Baseline Momentum (Seasonality and cumulative Brand Equity)
Comp 1 TV Comp 3 TV
Comp 2 TV Comp 4 TV Comp 5 TV

Marketing Spend Efficiency (ROI Per £1 Spent)*
Cinema, Digital Display and Sponsorship drive the most sales per £1 spent. Press activity
has been the least efficient and made a loss.
Branded TV
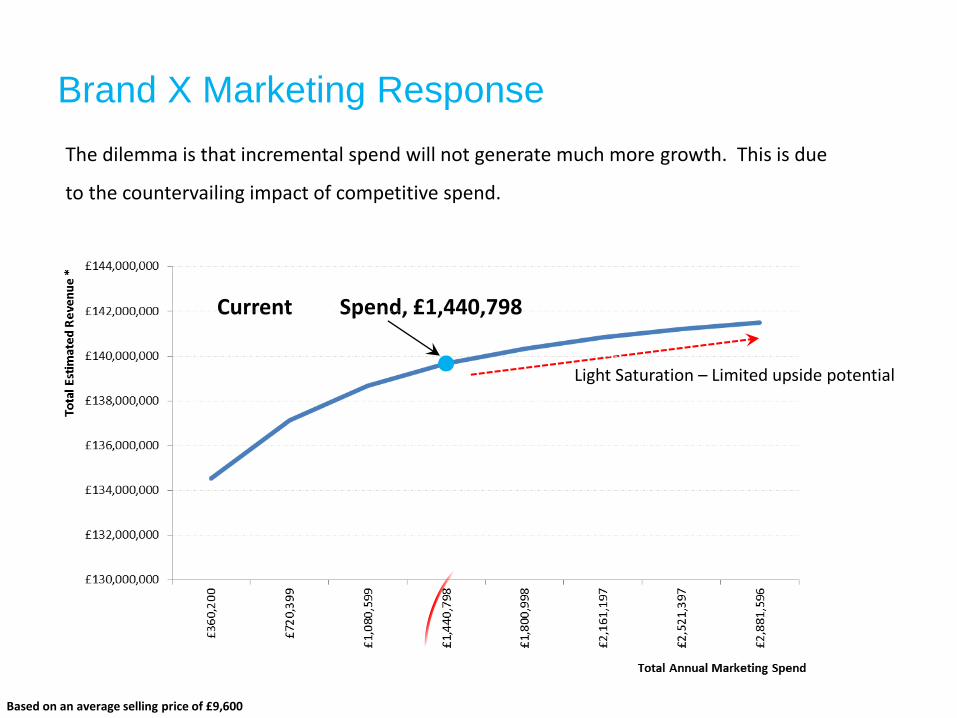
Brand X Marketing Response
The dilemma is that incremental spend will not generate much more growth. This is due
to the countervailing impact of competitive spend.
Current TCP Spend, £1,440,798
Light Saturation – Limited upside potential
Based on an average selling price of £9,600
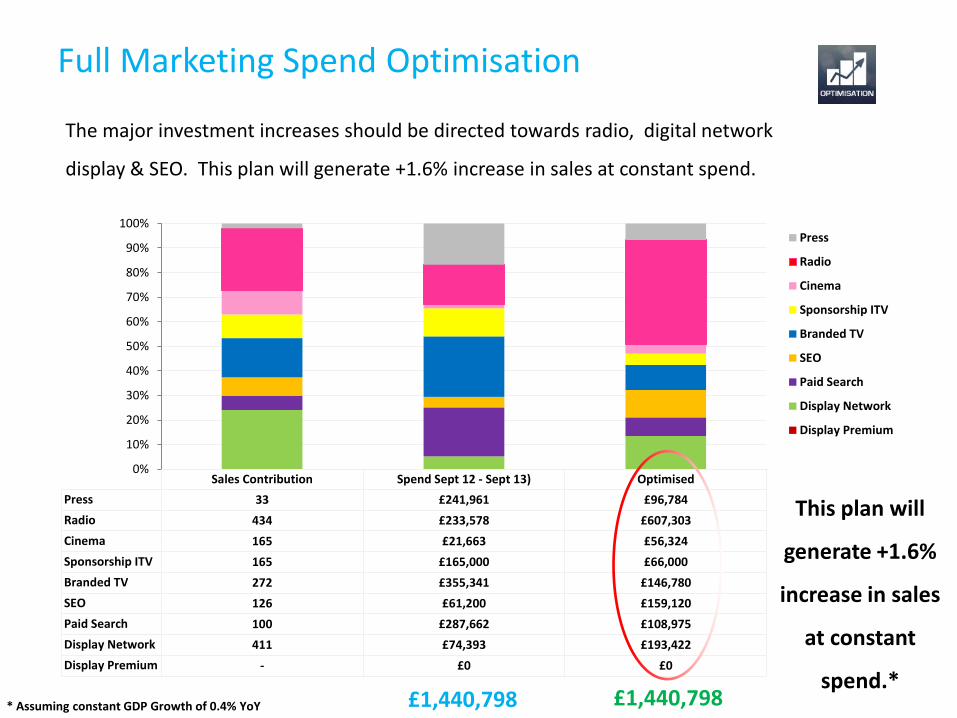
Full Marketing Spend Optimisation
Sales Contribution Spend Sept 12 - Sept 13) Optimised
Press 33 £241,961 £96,784
Radio 434 £233,578 £607,303
Cinema 165 £21,663 £56,324
Sponsorship ITV 165 £165,000 £66,000
Branded TV 272 £355,341 £146,780
SEO 126 £61,200 £159,120
Paid Search 100 £287,662 £108,975
Display Network 411 £74,393 £193,422
Display Premium - £0 £0
0%
10%
20%
30%
40%
50%
60%
70%
80%
90%
100%Press
Radio
Cinema
Sponsorship ITV
Branded TV
SEO
Paid Search
Display Network
Display Premium
£1,440,798
The major investment increases should be directed towards radio, digital network
display & SEO. This plan will generate +1.6% increase in sales at constant spend.
£1,440,798
This plan will
generate +1.6%
increase in sales
at constant
spend.* * Assuming constant GDP Growth of 0.4% YoY
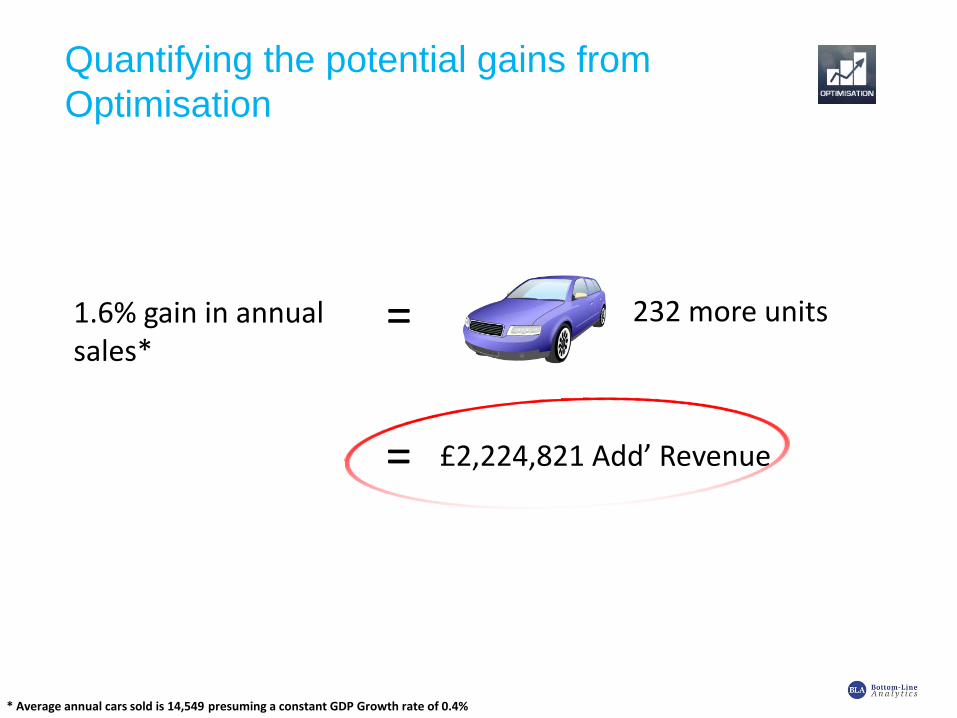
Quantifying the potential gains from
Optimisation
1.6% gain in annual sales*
= 232 more units
= £2,224,821 Add’ Revenue
* Average annual cars sold is 14,549 presuming a constant GDP Growth rate of 0.4%
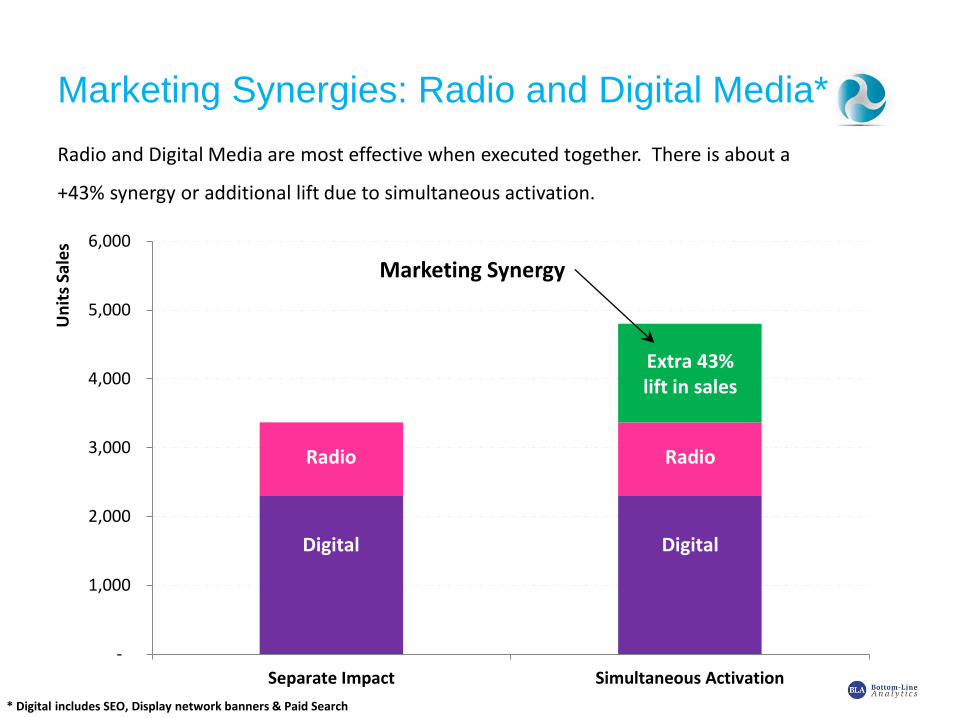
Marketing Synergies: Radio and Digital Media*
-
1,000
2,000
3,000
4,000
5,000
6,000
Separate Impact Simultaneous Activation
Un
its
Sale
s
Extra 43% lift in sales
Digital
Radio
Digital
Radio
Radio and Digital Media are most effective when executed together. There is about a
+43% synergy or additional lift due to simultaneous activation.
* Digital includes SEO, Display network banners & Paid Search
Marketing Synergy

Key Insights and Suggestions
Much of Brand X’s media and marketing spend is neutralised by competitor spending.
The result is that there is only a small upside due to increased marketing investment.
Brand X’s best opportunity for growth lies in getting more out of its current investment
by spending more on more productive media and less on unproductive forms.
Moving marketing plans towards more ‘integrated’ and coordinated execution does show
substantial upside. Due to the synergies between TV, Radio and Digital Media, there are
significant opportunities to drive growth through more integrated execution of these
media.
Michael Wolfe CEO Bottom Line Analytics Global E: [email protected] M: 770.485.0270 www.bottomlineanalytics.com
Masood Akhtar Partner, Analytics (EMEA) Bottom Line Analytics Global E: [email protected] M: +44 7970 789 663 www.bottomlineanalytics.com