use of the hydrogen bond potential function in a comparative molecular field analysis (comfa) on a...
TRANSCRIPT

Journal of Computer-Aided Molecular Design, 7 (1993) 263-280 263 ESCOM
J-CAMD 200
Use of the hydrogen bond potential function in a comparative molecular field analysis (CoMFA) on a set of
benzodiazepines
Ki H w a n K i m a'*, Giovanni Greco b, Et tore Novel l ino b, Car lo Silipo b and An ton io Vit tor ia b
OComputer Assisted Molecular Design, Pharmaceutical Products Division, Abbott Laboratories, Abbott Park, IL 60064, IZS.A,
bDipartimento di Chimica Farmaceutica e Tossicologica, Universitgt di Napoli, 80131 Naples, Italy
Received 2 June 1992 Accepted 18 November 1992
Key words: 3D-QSAR; CoMFA; GRID; Hydrogen-bond potential; Partial Least Squares; Hydrophobicity; Benzodiazepine
SUMMARY
The results of the GRID-Comparative Molecular Field Analysis (CoMFA) were compared with those of the SYBYL-CoMFA in a study of benzodiazepines. The results demonstrate that the hydrogen bonding function using the GRID H20 probe in a CoMFA can successfully describe the hydrophobic effects of substituents without any bias or preconcept of their effects in the development,
INTRODUCTION
A relatively recent development in the area of structure-activity relationships [1] is represented by Comparative Molecular Field Analysis (CoMFA) [2]. In this 3D-QSAR approach a number of steric and electrostatic energy values is sampled at regularly spaced points of a lattice in which the molecules of a data set have been superimposed. These energies are measured as interactions between each ligand and properly selected probe through simple functions of molecular mechan- ics force fields. The intermolecular energies obtained are then correlated with biological activity using the partial least squares (PLS) method [3-5]. The most predictive model is chosen from cross-validation procedures [6,7]. CoMFA has been employed not only in pharmacodynamic studies [8-12] but also to model chemical equilibrium constants and traditional Q SAR descriptors [13-15]. Kim [16,17] has observed that the GRID [18-20] H20 probe can be an efficient hydro- phobic descriptor in CoMFA.
*To whom correspondence should be addressed.
0920-654X/$ I0.00 © t993 ESCOM Science Publishers B.V.

264
Recently, Greco et al. [12] reported a study of a combined QSAR-CoMFA approach on a set of agonistic benzodiazepines with the SYBYL force field [21]. In the Q SAR analysis the following parameters were employed as molecular descriptors in the final equation (Eq. 1):
pIC50 = 0.991(+ 0.255)I2.- 0.035(+ 0.014)El~oMo + 0.409(+ 0 . 1 8 0 ) g 7 - 0.407(_+ 2.990) n = 48, s = 0.410, r = 0.867, F1,44 = 20.6
(1)
In Eq. 1, the substituent constant [22], ~7, describes the hydrophobicity of the substituents on the benzodiazepine ring at 7-position corresponding to the 7-chlorine atom in diazepam (I), EnoMo is the AM1 calculated HOMO energy [23], and ] 2, is an indicator variable which held the value of 1 when the 2'-position of the C ring was substituted. The positive coefficient of ~7 suggested that the substitutent at the 7-position may interact with a hydrophobic pocket of the receptor. Additionally, charge-transfer interactions with an electronegative site appear to pro- mote the binding affinity. The actual role played by the 2'-substituents (mostly halogens) in increasing the binding affinity could not be properly assessed because of the poor structural variance at the T-position. The molecular modeling studies, however, excluded that the 2'- substituent could influence the strength of the binding through intramolecular conformational effects [12].
Since the results of the traditional QSAR provided evidence of an involvement of a specific ligand-receptor hydrophobic interaction, an attempt was made to properly include the ~7 param- eter in the CoMFA model. On the basis of empirical observations and theoretical considerations [12], the ~7 descriptor was added, through a weighting factor of 100, to a CoMFA data table whose columns were constituted by electrostatic energies. The weighted rCv substituent constant plus the CoMFA electrostatic field explained more than 75% of the variance in the biological data.
Although the introduction of a hydrophobic parameter in a CoMFA calculation was success- fully accomplished, there are some unavoidable limitations in such an approach. First, a set of rc or log P values should be available for all the investigated compounds. Second, one or more substituent positions must be identified for their supposed hydrophobic relevance on a subjective basis.
In light of our experiences with the hydrogen bond potential function in describing hydropho- bic interactions [16,17], the set of benzodiazepines was evaluated for their binding affinity potency with the hydrogen bond function of GRID in this CoMFA study. The results are compared with the SYBYL-CoMFA results obtained previously [12].
METHODS
Molecular modeling The geometries of the compounds were modeled with the standard bond distances and angles
using SYBYL and optimized with the AM1 [23] of MOPAC [24]. All the molecules were consid- ered exclusively in the conformation in which the C3 carbon atom is positioned above the plane of the aromatic A ring. The molecules were superimposed on diazepam (I) by minimizing the root mean square of the interatomic distances using the C2 carbonyl oxygen or an 'equivalent' nitro- gen atom in that position, the N4 nitrogen or an 'equivalent' carbon atom in that position, and

265
the centroids of A and C rings. Detailed molecular modeling procedures are described in a previous publication [12].
CoMFA interaction energy calculation The 'hydrophobic', steric, and electrostatic potential energy fields of each molecule were calcu-
lated at various lattice points surrounding the molecule using H20, CH3, and H + probes with the program GRID as described in a previous communication [14,15,17]. A van der Waals radius of 1.70 and a charge of 0.0 were used for the H20 probe with two hydrogen-donating and two hydrogen-accepting properties. The polarizability and effective number of electrons were 1.20 and 7, respectively. The optimum hydrogen-bond energy was -4.0 kcal/mol and the optimum hydrogen-bond length was 2.8 ,~ for O'..O hydrogen bonds. These are currently the default values in GRID. In GRID, the H20 probe was treated as if they can rotate freely and the length and orientational dependence of the hydrogen-bond were considered. A van der Waals radius of 1.95 and a charge of 0.0 were used for the CH3 probe, and a zero van der Waals radius and a charge of 1.0 were used for the H + probe.
For each substituted benzodiazepine molecule, the energies at a total of 1573 grid points were calculated with 2 • spacing in a lattice of 24 × 20 × 20 (X = -14 to 10, Y = -9 to 11, Z = -9 to 11). All the energy values with a value greater than 4.0 kcal/mol were truncated to 4.0. Any lattice point for which the standard deviation of the energies was less than 0.05 was discarded. These procedures reduced the number of lattice points to 221,239, and 1349 for the H20, CH3 or H + probe, respectively.
Partial least squares ( PLS) calculations Ten to fifteen orthogonal latent variables were first extracted by the standard PLS algorithm.
The number of latent variables extracted was always at least 3 less than the number of the compounds included in the correlation. These latent variables were subjected to the PLS valida- tion test in the original order of extraction or in the order of their correlation with the dependent variable. The 'best' correlation model was chosen on the basis of which model significantly minimized the sum of squares of the difference in activity between the predicted and observed values using predictions made from a leave-one-out cross-validation test. After the number of latent variables was established from the cross-validation, the 'best' correlation model was derived with the same number of latent variables. The final model was further validated by the overall and the stepwise F-statistics. If F-statistics did not support the model, the least significant latent variable was eliminated and the model was re-derived. The variables Z1H20-Z3H2 o and ZlcH3-Z3cn3 in the correlation equations are the first through the third latent variables from H20 and CH3 probes, respectively. The variables Z1H+--Z3H+ are the first through the third latent variables from an H + probe, and the variables Z1H20,H+--Z7H20,H+ are the first through the seventh latent variables from both H20 and H + probes respectively obtained from the PLS analysis in each example. PRESS and press s are calculated as follows: PRESScn ) = 2{Yobs Ycal(n)} 2 and press S(n/ = {PRESS(n)/N} 1/2, where n is the number of latent variables, Yobs and Yca~ are the observed and calculated biological activity values, and N is the number of compounds included in the correlations.

266
RESULTS AND DISCUSSION
In the GRID-CoMFA [25] study, a heterogeneous set of 48 benzodiazepine analogues was used. These compounds are listed in Table 1 and shown in Fig. 1. The structural modifications involve various positions of the seven-membered B-ring and the nature of A-ring substituent which corresponds to the 7-chlorine atom in diazepam (I).
H3C 0
~ N
(I)
The biological activity of interest is the ligand binding affinity (pICs0) to the benzodiazepine receptors determined as competitive binding by the analogues to [3H]diazepam. The measured binding affinity data were originally reported by Haefely et al. [26].
The geometries of the compounds were optimized with AM 1 of MOPAC [24]. All the molecules were considered exclusively in the conformation in which the C3 carbon atom is positioned above the plane of the aromatic A ring. The molecules were superimposed on diazepam (I) using the C2 carbonyl oxygen or an 'equivalent' nitrogen atom in that position, the N4 nitrogen or an 'equiva- lent' carbon atom in that position, and the centroids of A and C rings. Details of the molecular modeling performed on these compounds are described in a previous study [12].
Three GRID probes were used in the interaction energy calculations; H20 was used for hydro- phobic (including hydrogen bonding), CH3 for steric, and H + for electrostatic interactions.
The effects of grid lattice position on the correlation were first investigated. The grid box for the lattice points was shifted by -0.5, -1.0, and -1.5 • in each of the directions X, Y, and Z. The statistics from the CoMFA results at these different lattice points are summarized in Table 2. In general, the results from different lattice positions are comparable as we had also observed in other cases [15]. Others sometimes observed significantly different results [2]. The correlations from the lattice points offset by either -1.0 or -1.5 ~ gave better fitted and cross-validated results than those by -0.5 A or the original grid position. The H20 and H + probes also gave more consistent results than the CH3 probe regardless of the locations of the grid box. Based on the results, the lattice position that was shifted from the original position by - 1.0 A was chosen as the best location of the lattice points and used for the following investigations in this study. In this lattice position, all three probes gave good results.
In the chosen lattice position, the HzO probe gave the best correlation (Eq. 2), followed by the CH3 and H + probes. There are high correlations between the latent variables ZHzO'S and ZcH3's especially with the first two components with the set of compounds included in this study (see

TABLE 1 OBSERVED AND CALCULATED Log 1/IC50 VALUES USING EQ. 2
Log l/ICso
No, Compound obs calc dev
267
1 RO-054318 6.34 6.25 0.09 2 RO-053072 6.41 6.39 0.02 3 RO-054528 6.42 7.41 -0.99 4 RO-052921 6.45 6.73 -0.28 5 RO-207736 7.02 7.27 -0.25 6 RO-054619 7.12 7.27 -0.15 7 RO-205397 7.37 7.39 -0.02 8 RO-053061 7.40 6.90 0.50 9 RO-202533 7.44 7.56 -0.12
10 RO-202541 7.52 8.03 -0.51 11 RO-205747 7.62 7.74 -0.12 12 RO-054336 7.68 7.22 0.46 13 RO-203053 7.74 8.42 -0.68 14 RO-052904 7.89 7.91 -0.02 15 Diazeparn 8.09 7.51 0.58 16 RO- 116896 8.15 8.23 -0.08 17 RO-075220 8.26 8.25 0.01 18 RO-143074 8.27 7.94 0.33 19 Flunitrazepam 8.42 8.11 0.3 I 20 RO-053590 8.45 8.50 -0.05 21 RO-079957 8.54 8.32 0.22 22 RO-133780 8.62 8.28 0.33 23 RO-053367 8.70 8.23 0.47 24 Delorazepam 8.74 8.53 0.21 25 Clonazeparn 8.74 8.40 0.20 26 RO-0.54435 8.82 8.08 0.73 27 Meclonazepam 8.92 8.75 0.17 28 RO-053328 7.06 7.91 -0.85 29 Tetrazeparn 7.47 7.37 0.09 30 Bromazeparn 7.74 7.24 0.50 31 Demoxepam 6.51 6.88 -0.37 32 Chlordiazepoxide 6A5 6.39 0.06 33 Alprazolam 7.70 7.41 0.29 34 Triazolam 8.40 8.36 0.04 35 RO-116679 8.40 8.05 0.35 36 RO-221892 7.92 8.18 -0.26 37 RO-215205 8.13 8.38 -0.25 38 Midazolam 8.32 8.32 0.00 39 RO-141359 7.15 7.77 -0.62 40 RO- 158867 7.60 8.14 -0.54 41 RO-147187 6.39 6.32 0.07 42 RO- 159270 8.30 7.99 0.31 43 Desmethylclobazam 6.68 6.84 -0.16 44 Clobazam 6.89 6.69 0.20 45 RO-221251 7.96 8.20 -0.24 46 RO-223245 8.55 8.48 0.06 47 RO-223148 6.38 6.32 0.06 48 Prernazepam 6.77 6.99 -0.22
PLS latent variables
ZI H20 Z2Hz o Z3H2 o
-7,891 -4.754 -2.619 -8,610 -0.030 -2.389 -0573 -0.872 -1.881 -8,002 1,040 0.509 -0.926 -1.289 -2.929 -3.240 3.455 -1.893 -1.417 2.844 -3.027 -7,012 1.641 0.712 -3,494 4,156 2.064
2.501 1.213 -0.089 -3.421 5.131 3.758 -5,569 2.837 1.868
1.419 7.581 3.107 - 1.408 4.912 2.653 -2,029 - 1.325 2.254
6,830 -0.946 -3.524 4.292 0.600 0.200
-2.794 6.660 4.387 3,955 1,332 -1.703 5.990 7.041 -3.490 1,954 2.480 3.949 1,866 1.90i 4.030 0.490 6.195 2.974 3,116 7.694 1.589 5.028 6.935 -3.026 2,513 5,623 -2.189 8,741 5.609 -3.892
-1.602 4.643 3.235 -3.016 -1.660 2.339 -4,530 2.610 0,482 -3.859 0.108 -4.116 -3,850 -9.255 -4.861
0,142 -6.770 0.519 5.732 -3.031 1.378 7.484 -6.548 -3.683 4,875 -9.658 4.722 5.075 -8.476 6.317 4.119 -7.807 6.762 0.693 2.735 -1.555 5.946 3.974 -6.403
-5.105 -10.61 -2.754 7.631 -4.567 -5.981
-3,610 -1,053 -4.262 -2.972 -6.187 -4.185
3.620 -7.213 5.546 5.448 -4.823 4.771
-7.292 -6.585 - 1.465 -7.238 2.537 1.792

r,"
,~
~ z 9
_o
,-r
c)

269
H30~N~ N
N~-'~N .,,IN 4 R8~ V ~ R 2 ,
H3C-,~N, N
/ N 2'
No. R8 R4 Rz
33 CI H H 34 C1 H C! 35 NO 2 (S)-CU 3 F
R~ N [ "N-R 3
No. RI R3 R5
36 H COO-i-Pr O 37 H COOCH3 38 CH 3 H
H 'l O R 7 ~ R 2'
No. R7 R2,
39 C1 F 40 NO, CI
No. R8 R2,
41 H H 42 NO2 C1
al O
No. RI
43 H 44 CH3
I:12
~ N
CI N ~ ~ N ~
~ R 2'
No. Rl Rz
45 CH 3 H 46 H C1
Fig. 1. (continued)
H
' H
~N"~~N N H3C_N~N OHaC~
47 48

270
TABLE 2 SUMMARY OF STATISTICS FROM MODELS AT DIFFERENT LATTICE POSITIONS
Lattice H20 probe CH 3 probe H + probe offset
L s r press s L s r press s L s r press s
0.0A 3 0.436 0.849 0.552 i 0.519 0.765 0.567 4 0.503 0.797 0.573 -0.5A 3 0.411 0.866 0.523 3 0.468 0.823 0.616 4 0.509 0.791 0.588 -1.0A 3 0.383 0.885 0.502 3 0.426 0.856 0.544 4 0.504 0.797 0.579 -1.5A 3 0,395 0.878 0.483 2 0.472 0.815 0.562 4 0.510 0.790 0.587
L = Number of latent variables in the model; s = standard error of estimation; r = correlation coefficient of the fitted model; press s = standard error of estimation of the leave-one-out cross-validation test.
Table 3). For example, the correlation coefficient between ZIH2 o and ZIcH 3 is 0.94. Therefore, it
is not surprising to see a high correlation with the CH3 probe, even though the quality is not as
good as that of the H20 probe. Likewise, there are significant correlations between the latent
variables ZH20'S and ZH+'S especially with the first component. Equation 2 is the 'best' correlation model chosen from the H20 probe. In this equation, pICs0 is the
competitive binding affinity by the analogues of [3H]diazepam to the benzodiazepine receptors. In the correlation equation, n is the number of compounds used, s is the residual standard deviation,
r is the correlation coefficient and press s is the standard deviation from the leave-one-out
cross-validation. F and P are the F-statistics and significance probability, respectively.
pICs0 = 0.127(-+0.012)ZlH2o + 0.046(+0.011)Z2H2O + 0.073(+0.016)Z3H2o + 7.665(+0.055) (2) n = 48, s = 0.383, r = 0.885, F = 53.2, P = 0.0001, press s = 0.502
The hydrophobic effects (H20 probe) alone could explain 78% of the variance in the data. The
observed and calculated biological activity of the compounds using Eq. 2 and the latent variables
used are given in Table 1. Equations 3 and 4 show the effects of steric and electrostatic effects (CH 3 and H + probes). A
rather significant correlation was obtained with the CH3 probe because of the high collinearity between the variables f rom the H20 and CH3 probes with the present set of compounds. Inclusion
of additional latent variables from the H + probe in the model did not significantly improve the
correlation already obtained from the CH3 probe as much as the correlation f rom the H20 probe. There is also a certain amount of collinearity between the first latent variables of the H20 model
and the H + model (see Table 3) when they were derived independently. The correlation coefficient
between Z1H2 o and Z1H+ is 0.69.
pICso = 0.147(+0.015)Zlc. 3 + 0.044(+0.015)Z2cH 3 + 0.083(+0.022)Z3cH 3 + 7.665(+0.062) (3) n = 48, s = 0.426, r = 0.856, F = 40.1, P = 0.0001, press s = 0.544
plCso = 0.076(+0.013)Z1H+ + 0.083(+0.021)Z2H+ + 0.238(+0.055)Z3H+
+ 0.094(_+0.043)Z4H+ + 7.665(+0.073) n = 48, s = 0.504, r = 0.797, F = 18.7, P = 0.0001, press s = 0.579
(4)
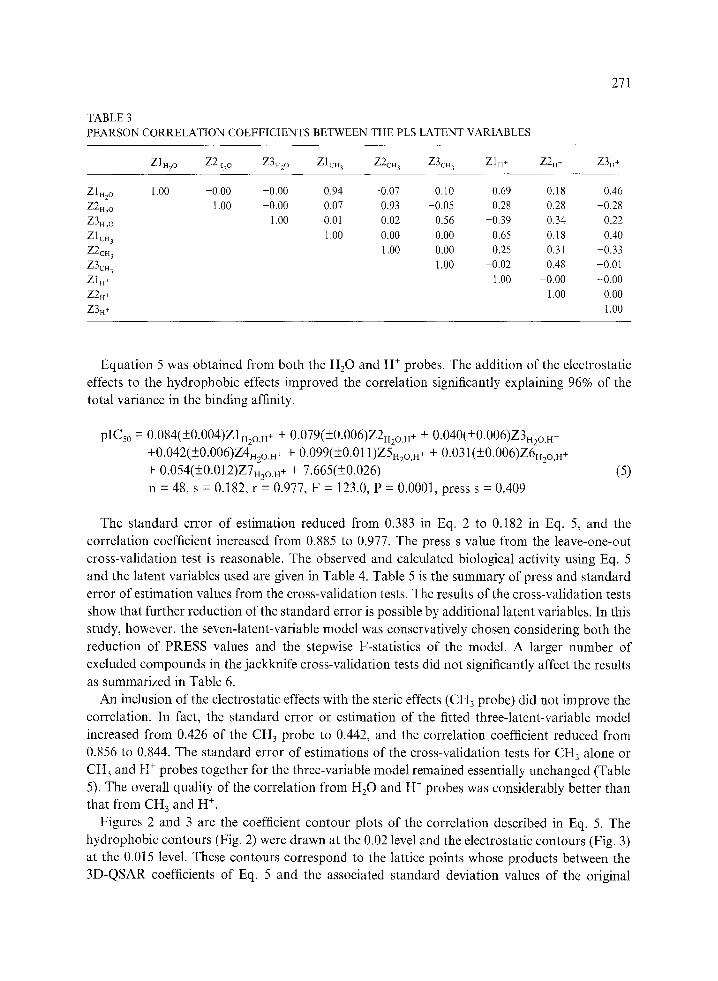
TABLE 3 PEARSON CORRELATION COEFFICIENTS BETWEEN THE PLS LATENT VARIABLES
271
ZIH2 o Z2H2 o Z3H2 o ZlcH 3 Z2c. 3 Z3cn 3 Z1H+ Z2.* Z3H+
Zltt2o 1.00 -0.00 -0.00 0.94 -0.07 0.10 0.69 0.18 0.46 Z2H2 o 1.00 --0.00 0.07 0.93 --0.05 0.28 0.28 --0.28 Z3H2 o 1.00 -0.01 0.02 0.56 -0.39 0.34 0.22
Z1CH 3 1.00 --0.00 0.00 0.65 0.18 0.40 Z2CH 3 1.00 0.00 0.25 0.31 --0.33 Z3CH 3 1.00 --0.02 0.48 --0.01 Z1H+ 1.00 --0.00 --0.00 Z2H+ 1.00 0.00
Z3H+ 1,00
Equation 5 was obtained from both the H20 and H + probes. The addition of the electrostatic effects to the hydrophobic effects improved the correlation significantly explaining 96% of the total variance in the binding affinity.
pICs0 = 0.084(+0.004)Zln2o,H+ + 0.079(+0.006)Z2H20,H+ + 0.040(_+0.006)Z3n20,n+ +0.042(_+0.006)Z4H20,H+ + 0.099(--+0.011)Z5H20.H+ -b 0.031(-+0.006)Z6HRO,H+ + 0.054(-+0.012)Z7H20.H+ + 7.665(-+0.026) n = 48, S = 0.182, r = 0.977, F = 123.0, P = 0.0001, press s = 0.409
(5)
The standard error of estimation reduced from 0.383 in Eq. 2 to 0.182 in Eq. 5, and the correlation coefficient increased from 0.885 to 0.977. The press s value from the leave-one-out cross-validation test is reasonable. The observed and calculated biological activity using Eq. 5 and the latent variables used are given in Table 4. Table 5 is the summary of press and standard error of estimation values from the cross-validation tests. The results of the cross-validation tests show that further reduction of the standard error is possible by additional latent variables. In this study, however, the seven-latent-variable model was conservatively chosen considering both the reduction of PRESS values and the stepwise F-statistics of the model. A larger number of excluded compounds in the jackknife cross-validation tests did not significantly affect the results as summarized in Table 6.
An inclusion of the electrostatic effects with the steric effects (CH 3 probe) did not improve the correlation. In fact, the standard error or estimation of the fitted threeqatent-variable model increased from 0.426 of the CH3 probe to 0.442, and the correlation coefficient reduced from 0.856 to 0.844. The standard error of estimations of the cross-validation tests for CH 3 alone or c n 3 and H ÷ probes together for the three-variable model remained essentially unchanged (Table 5). The overall quality of the correlation from H20 and H" probes was considerably better than that from CH 3 and H +.
Figures 2 and 3 are the coefficient contour plots of the correlation described in Eq. 5. The hydrophobic contours (Fig. 2) were drawn at the 0~02 level and the electrostatic contours (Fig. 3) at the 0.015 level. These contours correspond to the lattice points whose products between the 3D-QSAR coefficients of Eq. 5 and the associated standard deviation values of the original

TA
BL
E 4
t,a
---
,1 O
BS
ER
VE
D A
ND
CA
LC
UL
AT
ED
L
og 1
/IC
s0 V
AL
UE
S U
SIN
G E
Q.
5 ba
Log
1/I
C5o
No.
C
om
po
un
d
obs
calc
de
v
PL
S l
aten
t va
riab
les
Z1H
2o,.+
Z
2H
20
,H+
Z
3tI2
0,H
+ Z
4t12
0,. +
Z
5.2o
,.+
Z
6H2O
,[~I
+
Z7H
2O.I
t+
1 R
O-0
5431
8 6.
34
6.14
0.
20
2 R
O-0
5307
2 6.
41
6.40
0.
01
3 R
O-0
5452
8 6.
42
6.93
-0
.51
4 R
O-0
5292
1 6.
45
6.85
-0
.40
5 R
O-2
0773
6 7.
02
7.02
-0
.00
6 R
O-0
5461
9 7.
12
7.25
-0
.13
7 R
O-2
0539
7 7.
37
7.66
-0
.29
8 R
O-0
5306
1 7.
40
7.28
0.
12
9 R
O-2
0253
3 7.
44
7.50
-0
.06
10
RO
-202
54t
7.52
7.
73
-0.2
1
11
RO
-205
747
7.62
7.
78
-0.1
6
12
RO
-054
336
7.68
7.
55
0.13
13
RO
-203
053
7.74
7.
75
-0.0
1
14
RO
-052
904
7.89
8.
22
-0.3
3
15
Dia
zepa
m
8.09
8.
04
0.05
16
RO
-116
896
8.15
8.
09
0.06
17
RO
-075
220
8.26
8.
30
-0.0
4
18
RO
-143
074
8.27
8.
31
-0.0
4
19
Ftu
nitr
azep
am
8.42
8.
26
0.16
20
RO
-053
590
8.45
8.
39
0.06
21
RO
-079
957
8.54
8.
30
0.24
22
RO
-133
780
8.62
8.
62
-0.0
0
23
RO
-053
367
8.70
8.
52
0.18
24
Del
oraz
epam
8.
74
8.57
0.
17
- 10
.43
-4.0
44
-3
.261
-3
.279
-0
.853
5.
763
-3.0
29
- 10
. 78
-2.4
94
-
1.82
9 -6
.159
2.
041
1.76
7 -
1.72
6
0.92
7 -4
.63
6
0.83
4 0.
989
-3.6
75
-0.7
23
-2
.566
-9.0
35
- 1.
513
-0.3
18
-3.9
87
1.05
3 0.
457
2.15
0
-2.3
62
0.29
6 -0
.11
2
-3.2
89
- 1.
680
3.83
0 -5
.134
-6.1
85
2.61
t 0.
890
-6.4
79
2.34
5 1.
334
-2.5
64
0.05
4 -2
.342
1.
578
-2.9
26
1.51
0 0.
406
1.42
2
-5.3
80
-3.1
02
0.
044
-2.9
42
2.21
0 1.
398
3.14
4
-6.2
32
2.28
4 4.
241
-0.0
34
0.
447
-1.7
65
0.28
4
3.97
1 0.
100
2.86
3 1.
091
-3.4
37
-0.0
81
-1.7
71
-5.4
59
2.68
1 5.
575
1.65
6 1.
409
-1.5
58
-1
.376
-6.3
33
2.78
7 1.
682
-3.9
36
1.42
1 0,
815
2.35
1
0.97
6 2.
956
5.81
0 0.
199
0.09
6 -5
.92
8
-5.3
59
1.68
7 -1
.70
0
3.86
8 1.
482
1.82
5 -1
.01
9
3.34
4
-2.5
98
- 1.
559
2.56
9 4.
831
O. 1
38
8,00
0 2.
869
11.9
54
-4.3
64
-2
.89
2
-1.3
94
-0.3
79
2.
346
-1.7
37
2.37
3 2.
951
3.51
0 3.
169
-2.5
34
3.
779
1.13
2
-3.4
76
4.49
9 5.
459
-0.6
36
5.12
0 2.
293
-3.3
50
9.36
7 -4
.35
2
1.35
9 0.
792
-0.3
97
3.
078
0.23
1
11.5
15
0.48
6 3.
123
5.56
9 -0
.86
4
-4.6
71
1.17
7
-0.8
18
5.76
5 6.
150
4.51
5 -2
.04
2
1.89
0 -0
.701
0.09
7 3.
781
5.65
3 5.
788
-0.9
42
4.
999
2.25
7
0.37
5 4.
509
5.96
8 0.
594
1.46
3 -0
.843
1.
691
2.24
5 4.
956
6.52
3 -0
.294
1.
082
-1.8
38
0.50
3

TA
BL
E 4
(co
ntin
ued)
Log
l/I
Cso
No.
C
om
po
un
d
obs
25
Clo
naze
pam
8.
74
26
RO
-054
435
8.82
27
Mec
lona
zepa
m
8.92
28
RO
-053
328
7.06
29
Tet
raze
pam
7.
47
30
Bro
maz
epam
7.
74
31
Dem
ox
epam
6.
51
32
Chl
ordi
azep
oxid
e 6.
45
33
Alp
razo
lam
7.
70
34
Tri
azol
am
8.40
35
RO
-116
679
8.40
36
RO
-221
892
7.92
37
RO
-215
205
8.13
38
Mid
azo
lam
8.
32
39
RO
-141
359
7.15
40
RO
-158
867
7.60
41
RO
-147
187
6.39
42
RO
- 15
9270
8.
30
43
Des
met
hylc
lo-
6.68
baz
am
44
Clo
baz
am
6.89
45
RO
-221
251
7.96
46
RO
-223
245
8.55
47
RO
-223
148
6.38
48
Pre
maz
epam
6.
77
calc
de
v
PL
S l
aten
t va
riab
les
Zlli
2o,H
+ Z2
1-12
o,1I+
Z3
H20
,H+
Z4H
20,H
+ Z5
H20,
H+
Z6H
20,H
+ Z7
1tzO,
H +
8.72
0.
02
8.56
O
.26
8.90
O
.O2
7.12
-0
.06
7.52
-0
.05
7.50
0.
24
6.40
0.
11
6.41
0.
04
7,59
0.
11
8.57
-0
.17
8.68
-0
.28
8.03
-0
.1 !
8.07
0.
06
8.35
-0
.03
7.20
-0
.05
7.61
-0
.01
6.15
0.
24
8.10
0.
20
6.68
0.
00
6.84
0.
05
7.95
0.
01
8.48
0.
07
6.36
0.
02
6.67
0.
10
10.3
15
-2.8
47
3.27
1 -2
.584
3.
243
0.12
4 1.
261
8.66
3 -3
.366
2.
654
-2.5
12
3.06
8 0.
560
2.04
8
13.6
61
-2.2
04
0.
278
-3.5
52
3.95
2 0.
606
-0.0
77
--1.
762
2.16
0 1.
693
--4.
363
-5.4
04
--
5.58
6 4.
585
-3.1
28
-0.7
76
1.26
7 1.
458
-4.1
39
5.52
0 5.
635
-4.2
08
-0.2
29
3.82
6 0.
442
0.73
2 --
2.16
7 0.
579
--7.
038
-5.1
85
-0.4
08
--0.
210
-0.0
05
-- 5
.757
-
1.29
1
-4.7
99
-12
.04
--
5.48
6 9.
358
2.33
6 --
9.27
9 -0
.348
--2.
027
0.19
2 --
1.67
6 5.
435
-0.9
63
4.99
1 -2
.503
2.60
2 5.
629
1.28
5 5.
354
-0.4
13
5.29
0 -2
.812
11.0
57
-3.0
93
--5.
553
1.86
0 2.
266
9.57
5 -0
.832
-0.7
23
9.56
3 --
16.
43
-2.7
94
3.12
5 --
0.09
4 2.
644
2.04
8 t 3
.034
--
12.
90
- 3.
470
-0.7
86
--2.
251
0.31
5
2.04
9 6.
316
--6.
470
6.03
4 0.
182
0.87
4 -0
.375
2.32
6 2.
449
1.37
2 -4
.914
-4
.245
--
7.85
9 --
0.75
3
12.8
21
-4.2
23
--0.
698
--6.
974
-2.3
57
--6.
844
-0.6
54
--6.
319
-2.4
64
--
7.91
6 -3
.34
4
-4.4
48
4.48
8 -0
.613
12.4
34
--3.
557
-3.9
29
-- 1
.548
-2
.026
4.
960
-- 1
.132
-6.0
67
-4
.13
6
--0.
427
0.20
0 0.
139
--4.
371
-0.4
27
--5.
877
-5.9
51
--1.
631
4.00
3 --
1.30
1 4,
127
0.53
5
2.67
3 0.
635
-4.8
81
10.6
87
-0.0
77
--8.
340
0.40
4
4.57
9 4.
571
--2.
880
8.49
9 1.
191
--7.
650
-0.8
68
-7.5
56
-7
.248
-5
.89
9
1.07
5 0.
782
-2.6
45
1.63
6
--12
.18
2.21
2 2.
252
--2.
320
-0.2
08
--1.
998
-1.2
01
to
--.-3
c~

274
Fig. 2. Coefficient contour plot of the correlation described in Eq. 5. The areas where hydrophobic substituents increase the binding affinity are shown by the positive contours in red (solid line) and the areas where they decrease it are shown by the negative contours in blue (dashed line). The contours were drawn at the 0.02 level. Flunitrazepam (19) was used as a reference compound.
variables were interpolated as +0.02 or +0.015 (positive contours) and -0.02 or -0.015 (negative contours), respectively. Flunitrazepam (19) was shown as a reference compound. The areas where hydrophobic substituents increase the binding affinity are shown by the positive contours in red (solid lined) and the areas where they decrease it are shown by the negative contours in blue (dashed lined). The positive hydrophobic contours around the 7-position are consistent with the positive coefficient of the rt7 variable in the traditional QSAR described in Eq. 1. The results are in contrast to the previous study with SYBYL-CoMFA where the hydrophobic effects of 7- substituents could not be represented in the coefficient contour plot. Additional positive hydro- phobic contours are located around the 2'-position. However, it is not possible to state conclu- sively at the present time that the positive contours around T-position represent the hydrophobic effects, since the structural variance a t this position is rather limited. Nonetheless, the result is consistent with the positive coefficient of the I2, parameter in Eq. 1, and indicates that hydropho-
/..77<" ...... ~ 2
,.~/'2 .... l " ' i " '<°
Fig. 3, Coefficient contour plot of the correlation described in Eq. 5. The areas where the electrostatic effects influence the binding affinity are shown by the positive contours in purple (solid line) and the negative contours in cyan (dashed line). The contours were drawn at the 0.015 level. Flunitrazepam (19) was used as a reference compound.

TABLE5 SUMMARY OFPRESSFROM LEAVE-ONE-OUTCROSS-VALIDATION TESTS
275
L PRESS press s Average error 0 31.1360 0.8054 0.688
(a) H20 probe t 17.0115 0.5953 0.497 2 14.3469 0.5467 0.459 3 12.1165 0.5024 0.400 4 1t.5739 0.4910 0.363 5 11.4987 0.4894 0.379 6 11.5114 0.4897 0.389 7 10.2087 0.4612 0.363 8 9.7317 0.4503 0.352 9 8.8459 0.4293 0.331
10 8.0734 0.4101 0.325 11 7.8654 0.4048 0.327 12 7.7563 0.4020 0.330 13 8.6668 0.4249 0.350
(b) H2OplusH ÷ probe 1 18.9517 0.6284 0.525 2 13.3841 0.5280 0.444 3 11.7096 0.4939 0.403 4 11.1014 0.4809 0,363 5 11.6147 0,4919 0.406 6 10.0454 0.4575 0.359 7 8.0413 0.4093 0.328 8 6.7353 0.3746 0.303 9 5,5662 0.3405 0.281
10 5.1235 0.3267 0.271 11 4.6350 0.3107 0.261 12 4.3848 0.3022 0.254 13 4.4978 0.3061 0.255
(C) CH 3 probe l 17.0605 0.5962 0.486 2 15.6904 0.5717 0.476 3 14.2245 0.5444 0.436 4 15.4576 0.5675 0.473
(d) CH 3 and H + probe 1 19.4118 0,6359 0,526 2 15.4506 0.5674 0,475 3 14.0851 0.5417 0.445 4 14.9438 0.5580 0.461
(e) H + probe 1 23.5705 0.7008 0.584 2 20.1615 0.6481 0.532 3 19.3544 0.6350 0.548 4 16.0677 0.5786 0.480 5 16.2833 0.5824 0.483
(OH + probe (no steric cutoff) 1 21.7678 0.6734 0.562 2 19.1038 0.6309 0.526 3 19.2810 0.6338 0.540 4 18.3645 0.6185 0.533 5 17.0794 0.5965 0.507 6 17.0716 0.5964 0.502 7 16.6933 0.5897 0.490 8 17.8683 0.6101 0.516
276
TABLE6 SUMMARY OF STATISTICS FROM LEAVE-N-OUT CROSS-VALIDATION TESTS FOR EQ. 5(L = 7)
N PRESS Press s Average error
1 8.0413 0.4093 0.328 2 8.3849 0.4180 0.331 3 8.9712 0.4323 0.344 4 8.2463 0.4145 0.332 5 7.8671 0.4048 0.330 6 10.5209 0.4682 0.371 7 7.4478 0.3939 0.333 8 7.4478 0.3939 0.333 9 10.3479 0.4643 0.391
10 10.2290 0.4616 0.363 15 8.8423 0.4292 0.348 20 10.8514 0.4755 0.389
bic groups are preferred for improv ing the affinity at this posit ion. I2, in Eq. 1 is an indicator variable and holds the value of 1.0 if the 2 ' -posi t ion carries a subst i tuent such as C1, 1 =, and C F 3 and 0.0 when the T-pos i t ion is not substituted. The areas where the electrostatic effects influence
the binding affinity are shown by the positive in purple (solid lines) and negative contours in cyan (dashed lines). The positive electrostatic contours a round the 4"-position of the 5-phenyl ring indicate tha t decreased electron density on the phenyl ring, which is related to an electron-
wi thdrawing effect o f the 2 ' -subst i tuent , would increase the binding affinity. Small negat ive
electrostatic contours are located near the 7-position. An e lect ron-withdrawing group at this
posi t ion increases the binding affinity.
.Q & O tt~ (O Q.
9.0
8.5
8.0
7.5- "
7.0
6.5
6.0 t ~ I I i 6.0 6.5 7.0 7.5 8.0 8.5 9.0
plCSO(cal)
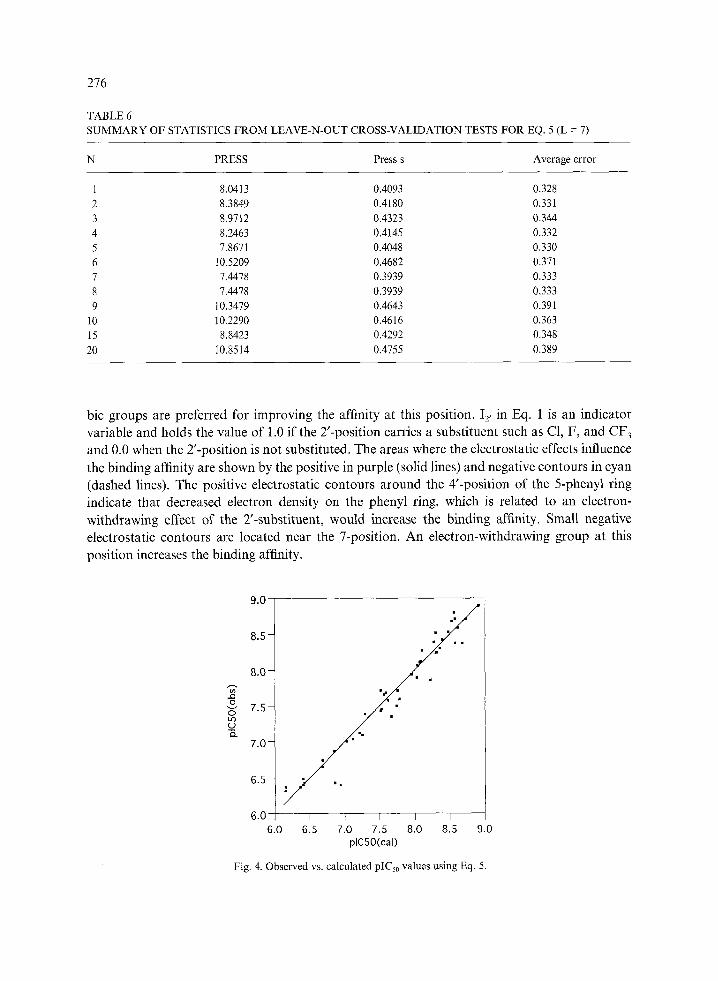
Fig. 4. Observed vs. calculated pICs0 values using Eq. 5.

TABLE 7 RELATIVE CONTRIBUTION OF THE MOLECULAR DESCRIPTORS TO THE CORRELATION
277
Effects QSAR SYBYL-CoMFA GRID-CoMFA (i00 × rcv and H* probe) (H20 and H + probes) a
Electrostatic 25% (EHoMO) 70% (H +) 18% (H +) Hydrophobic 29% (7~7) 30% (rtT) 78% (H20) Others 46% (12,) - -
a Normalized percentage is 19% (H +) and 81% (H20), respectively.
Figure 4 is the plot of the observed vs. calculated plCs0 values using Eq. 5. Table 4 lists the observed and calculated pICs0 values of the compounds using this equation.
The current GRID-CoMFA results are in general comparable to the traditional QSAR (Eq. 1) that Greco et al. [12] described previously. The QSAR of both the homogeneous subset (first 30 out of 48 compounds) and the heterogeneous set (all 48 compounds) indicate that r¢7 explains more variance in the biological data than the electronic parameters (EcvMo or EnoMo). The results of this GRID-CoMFA study suggest that the hydrophobic effects alone explain the majority (78%) of the variance in the data. In the GRID-CoMFA, the H20 probe also explains the portion accounted for by the I2 indicator variable in QSAR. The electrostatic effects explain an additional 18% of the variance. However, since the hydrogen bonding effects accounted for by the H20 probe partially include the electrostatic effects described with the H + probe, it is difficult to accurately evaluate the actual contributions of hydrophobicity and electrostatics in modulating the affinity. The SYBYL-CoMFA results show 70% of the electrostatic effects and 30% of the hydrophobic effects. It appears that the portion explained by the indicator variable 12, (46%) in Eq. 3 is accounted for by the electrostatic effects in the SYBYL-CoMFA model (See Table 7).
The current CoMFA model obtained using the GRID force field improved the correlation significantly over those of the traditional QSAR or the CoMFA obtained using the SYBYL force field. The standard deviation and correlation coefficient of the fitted model from GRID-CoMFA are 0.182 and 0.977, while those of QSAR are 0.410 (0.392) [27] and 0.867, respectively (Eq. 1). The corresponding statistical indices obtained by the SYBYL-CoMFA were quite close (s = 0.401 (0.388) [27] and r = 0.871) to those of QSAR. Those from the H20 alone in the GRID-CoMFA are 0.383 and 0.885, respectively.
In the SYBYL-CoMFA the combined use of the steric and electrostatic fields gave a worse
TABLE 8 SQUARED CORRELATION COEFFICIENTS MATRIX OF THE INDEPENDENT VARIABLES USED IN THE QSAR ANALYSIS
n7 Iz EHOMO ELUMO
n7 1.00 0.03 0.00 0.03 12, 1.00 0.11 0.24 EHOMO 1.00 0.64 ELUMO 1.00

278
TABLE 9 STATISTICS OF THE LATTICE POINTS FOR H20, H +, AND C H 3 PROBES USED IN GRID-CoMFA
Probe No. of points No. of total Mean Standard M i n i m u m Maximum points a deviation value value
HzO 221 10 608 -0.176 1.470 -4.280 4.000 H + 239 64 757 -0.014 0.353 -3.638 2.337 CH3 1349 11 472 0.042 1.365 -2.716 4.000
a Number of points x number of compounds (48).
result than the steric field alone (one component model, press s = 0.599). Similar results were obtained with the G R I D - C o M F A where the three-component CH 3 model gives a best result
(press s = 0.544) and the addition of electrostatic field did not change the results (three-compo- nent model, press s = 0.542). Although the improvement is significant, a higher number of components was required in the G R I D - C o M F A model. It is evident that the SYBYL CsP3 probe with a +1.0 charge is not completely equivalent to the CI-I 3 plus H + probes in the G R I D - C o M F A model.
In CoMFA, before the computed interaction energy values were subjected to the data analysis
by PLS, they were reduced to a smaller number by eliminating points that vary little or that have high-energy values. In the process of reducing the data matrix in this study, one major modifica-
tion was made from the original SYBYL-CoMFA methodology. This involved the lattice points that are outside the molecule but inside some other molecules included in the study. In the original CoMFA procedures, the mean value of the other molecules' electrostatic interactions at the same
location is used for such lattice points. In the G R I D - C o M F A procedures, these points were totally excluded from consideration. When the molecules are placed into the receptor cavity, it appears to us that these points are not likely to represent the charged group of a receptor. The
results that included these points (no steric cutoff) were less good as is shown in Table 5 (f). In the validation tests, a different number of compounds can be excluded for prediction. The
number of cross-validation groups in previous work [12] was 10 (leave-five-out), while it was 48 (leave-one-out) in the present GRID-CoMF A analysis. Thus the two results are not directly comparable. However, the results of cross-validation, in terms of PRESS values, were found relatively insensitive to the variation of the number of excluded and predicted observations in the
cross-validation test (see Table 6). There were no significant correlations among the independent variables used in Eq. 1 of the
traditional QSAR (See Table 8). On the other hand, the CoMFA models from the GRID force field or the SYBYL force field suffer from some cotlinearity problems with the current set of compounds for their interpretations. In the SYBYL-CoMFA model the electrostatic descriptor does not discriminate between the electron effects of the 7-substituent and the unidentified effects of the 2'-substituent. In the GRID-CoMFA model, it is not clear at this point how important the electrostatic effects of the 7-substituent are with respect to its hydrophobic effects. Table 9 summarizes the statistics of the interaction energies at the total lattice points for H20, CH3, and
H + probes used in this study.

279
CONCLUSION
The results presented in this study demonstrate that the use of the H20 probe with the hydrogen bond potential in the GRID-CoMFA has the advantage of describing hydrophobic effects with- out any bias unlike the QSAR-CoMFA approach reported previously. As shown in this study, the correlation suggesting the importance of the hydrophobic and electrostatic effects was obtained without prior knowledge or hypotheses of their effects. Thus, it would have been possible to obtain information about the presence of hydrophobic effects even if no traditional QSAR had previously been derived.
The usefulness of including hydrophobicity in CoMFA as described in this study is evident in the literature when one considers that hydrophobic effects often play one of the critical roles influencing the binding between ligands and receptors. Furthermore, the use of log P in the traditional QSAR studies is often limited by the availability of proper values for the investigated compounds.
REFERENCES AND NOTES
1 Martin, Y.C., In Quantitative Drug Design: A Critical Introduction (Medicinal Research Series, Vol. 8), Marcel Dekker, New York, Basel, 1978.
2 Cramer, III, R.D., Patterson, D.E. and Bunce, J.D., J. Am. Chem. Soc., 110 (1988) 5959. 3 Sffthle, L. and Wold, S., Prog. Med. Chem., 25 (1988) 292. 4 Lindberg, W., Persson, J.-A. and Wold, S., Anal. Chem., 55 (1983) 643. 5 Hoskuldsson, A., J. Chemometrics, 2 (1987) 211. 6 Cramer, III, R.D., Bunce, J.D., Patterson, D.E. and Frank, I.E., Quant. Struct.-Act. Relat., 7 (1988) 18. 7 Wold, S., Technometrics, 20 (1978) 397. 8 Allen, M.S., Tan, Y., Trudell, M.I., Narayanan, K., Schindler, I.R., Martin, M.J., Schultz, C., Hagen, T.J., Koehler,
K.F., Codding, P.W., Skonick, P. and Cook, J.M, J. Med. Chem., 33 (1990) 2343. 9 Bjorkroth, J.-P., Pakkanen, T.A., Lindroos, J., Pohjala, E., Hanjijarvi, H., Laurem L., Hannuniemi, R., Juhakoshi, A.,
Kippo, K. and Kleimola, T., J. Med. Chem., 34 (1991) 2338. 10 Carroll, F.I., Gao, Y., Rahman, A., Abraham, P., Parham, K., Lewin, A.H, Boja, J.W. and Kuhar, M.J, J. Med.
Chem., 34 (1991) 2719. 11 Greco, G., Novellino, E., Silipo, C. and Vittoria, A., Quant. Struct.-Act. Relatsh, 10 (1991) 289. 12 Greco, G., Novellino, E, Silipo, C. and Vittoria, A., Quant. Struct.-Act. Relatsh., 11 (1992) 461. 13 Clark, M., Cramer, III, R.D., Lones, D.M., Patterson, D.E. and Simeroth, P.E., Tetrahedron Comp. Method., 3
(1990) 47. 14 Kim, K,H. and Martin, Y.C., J. Org. Chem., 56 (1991) 2723. 15 Kim, K.H. and Martin, Y.C., J. Med. Chem., 34 (1991) 2056. 16 Kim, K.H., In Wermuth, C.G. (Ed.) Trends in QSAR and Molecular Modelling '92, ESCOM Leiden, 1993, in press. 17 Kim, K.H., Med. Chem. Res., 1 (1991) 259. 18 Goodford, P.J., J. Med. Chem., 28 (1985) 849. 19 Boobbyer, D.N.A., Goodford, P.J., McWhinnie, P.M. and Wade, R.C., J. Med. Chem., 32 (1989) 1083. 20 GRID Program, V7, Molecular Discovery Ltd., West Way House, Elms Parade, Oxford, U.K. 21 SYBYL Molecular Modelling System (Version 5.30), TRIPOS Assoc., St. Louis, MO, U.S.A. 22 Hansch, C. and Leo, A., In Substituent Constants for Correlation Analysis in Chemistry and Biology, Wiley, New
York, 1979. 23 Dewar, M.J.S., Zoebisch, E.G., Healy, E.F. and Stewart, J.J.P., J. Am. Chem. Soc., 107 (1985) 3902. 24 MOPAC (Version 5.00), Quantum Chemistry Program Exchange, No. 455, 1989. 25 The terms GRID-CoMFA and SYBYL-CoMFA are used throughout this paper in order to distinguish the different

280
force fields (GRIDS and SYBYL force fields, respectively) used in the CoMFA study. The term QSAR-CoMFA refers to the study where both the traditional QSAR and CoMFA methodologies are employed in order to investigate structure activity relationships of a set of compounds.
26 Haefely, W., Kyburz, E., Gerecke, M. and Moheler, H., In Testa, B. (Ed.) Advances in Drug Researches, Vol. 14, Academic Press, London, 1985, pp. 156-322.
27 The originally reported standard error of the calibration was transformed into the root mean square of estimation calculated as described in the Methods section and reported in parentheses in order to compare the results.