use of terrestrial laser scanning for engineering geological
TRANSCRIPT

Nat. Hazards Earth Syst. Sci., 11, 807–817, 2011www.nat-hazards-earth-syst-sci.net/11/807/2011/doi:10.5194/nhess-11-807-2011© Author(s) 2011. CC Attribution 3.0 License.
Natural Hazardsand Earth
System Sciences
Use of terrestrial laser scanning for engineering geologicalapplications on volcanic rock slopes – an example from Madeiraisland (Portugal)
H. T. Nguyen1, T. M. Fernandez-Steeger1, T. Wiatr 2, D. Rodrigues3, and R. Azzam1
1RWTH Aachen University, Department of Engineering Geology and Hydrogeology, Aachen, Germany2RWTH Aachen University, Inst. Neotectonics and Natural Hazards, Aachen, Germany3CGUP – University of Madeira, Funchal, Portugal
Received: 9 July 2010 – Revised: 23 November 2010 – Accepted: 3 January 2011 – Published: 14 March 2011
Abstract. This study focuses on the adoption of a modern,widely-used Terrestrial Laser Scanner (TLS) applicationto investigate volcanic rock slopes in Ribeira de JoaoGomes valley (Funchal, Madeira island). The TLS dataacquisition in May and December 2008 provided informationfor a characterization of the volcanic environment, detailedstructural analysis and detection of potentially unstable rockmasses on a slope. Using this information, it was possibleto determine specific parameters for numerical rockfallsimulations such as average block size, shape or potentialsources. By including additional data, such as surfaceroughness, the results from numerical rockfall simulationsallowed us to classify different hazardous areas based onrun-out distances, frequency of impacts and related kineticenergy. Afterwards, a monitoring of hazardous areas can beperformed in order to establish a rockfall inventory.
1 Introduction
Engineering geological applications, e.g. rock mass charac-terization or slope stability analysis in volcanic rock slopes,face many challenges. A volcanic rock slope typically showsa wide range of rock and soil types in a random pattern withoften poor lateral continuity (Del Potro and Hurliman, 2008),together with a high variability of mechanical propertiesboth laterally and vertically (Apuani et al., 2005). Dueto the different material properties and different weatheringresistances, steep slopes with overhangs are common,
Correspondence to:H. T. Nguyen([email protected])
causing frequent landslides, like rockfalls and rockslides.In case of a significant hazard to people, infrastructure orbuildings, engineering geologists usually have to investigatethe potentially dangerous areas to perform slope stabilityanalysis or hazard risk assessments (Bell, 1999). Oftenconfronted with difficult and dangerous accessibility to theexposed rock face, traditional data acquisition is insufficient.Consequently, assumptions have to be made e.g. on materialproperties or distribution of rock and soils from very basicgeometrical and geotechnical models. Compared to theseprevious methods, TLS represents a substantial improvementin accuracy, reliability and such factors as time and safety.In general, terrestrial remote sensing can retrieve morecomprehensive information on rock slopes and data ofinaccessible outcrops. Currently several types of laserscanners are in use (Beraldin, 2004; Kersten et al., 2006).For geotechnical applications, especially for morphologicalstudies and long range applications, laser scanners usingthe time-of-flight technology are the most suitable. It ispossible to determine the distance and position of objectsat up to several hundred meters distance. The resultingpoint-cloud data can be used to process high resolution3-D surface models. Today, detailed TLS surveys are usedin many different geological environments, for differentpurposes like detection, measurement and monitoring ofdeformations or displacements (Slob and Hack, 2004; Jones,2006; Oppikofer et al., 2009; Abellan et al., 2009), back-analysis of rockfalls (Abellan et al., 2006), structural analysis(Slob et al., 2005), rockfall hazard assessment (Rosseret al., 2005) or lithology identification (Pesci et al., 2008).Although most of them have been performed in a non-volcanic environment, a survey of a high-relief volcanicenvironment will share some of the same characteristics
Published by Copernicus Publications on behalf of the European Geosciences Union.

808 H. T. Nguyen et al.: Use of TLS on volcanic rock slopes
and problems, e.g. appearance of occlusions, restrictedaccessibility and vegetation. First studies have shown thatTLS can also be successfully used in volcanic environmentsto characterize the volcanic rock masses (Liu et al., 2007;Pesci et al., 2008) or to precisely measure the morphometryand volumes of volcanic features (Pesci et al., 2007).Other studies describe the monitoring of unstable slopesand active mass movements in volcanic environments todetermine morphologic changes (Jones, 2006). However,few researchers have focused on engineering geologicalissues by analyzing rock slopes on islands of volcanicorigin. These islands are subjected to dynamic change inmorphology due to frequent mass movements. Unique forvolcanic islands are the amount, spatial density and differenttypes of mass movements that occur. This paper presentsthe adaption of TLS applications for engineering geologicalinvestigations on an exemplarily volcanic rock slope on theisland of Madeira (Fig.1). This paper will show how TLSdata can be used to characterize volcanic rock masses using ahigh-resolution digital elevation model (HRDEM), includingsemi-automatic discontinuity analysis and kinematic failureprediction. The output can be used as input for numericalrockfall simulations to identify hazardous areas. Furtherapplications include the analysis of multi-temporal TLSdata for magnitude-frequency analysis and monitoring ofrockfall activity, as well as providing a method with whichto document the in-situ situation. Thus, several expeditionsfor data acquisition were made in May and December 2008to Funchal (Madeira).
1.1 Location
Madeira island is located on a 140 Myr old oceanic crust andrises from more than 4000 m water depth up to 1862 m a.s.l.The geology of Madeira is divided into three main units: abasal unit (late Miocene to Pliocene), consisting primarily ofvolcanic breccias and pyroclastic deposits with minor lavaflows; a middle unit (Pliocene to Pleistocene) composedprimarily of alkalic basalts lava flows and an upper unit(Pleistocene), consisting of scoria cones and intracanyon lavaflows. The middle unit covers most of the island and ismade up of lava sequences thicker than 500 m and are locallycut by dike swarms. The last eruption occurred during theHolocene, approximately 6450 years BP in the S. Vicentevalley (Schmincke, 1998).
The entire island of Madeira is characterized by highmountain ridges and deep valleys within steep slopes, cuttinginto the ancient lavaflows and tuff layers. Therefore, theoccurrence of rockfalls and rockslides is a frequent andserious problem, causing severe damage to the infrastructureand a number of annual fatalities (Rodrigues and Ayala-Carcedo, 2003). In this research, slopes of one of the threemain valleys in Funchal city, the Ribeira de Joao Gomesvalley (Fig.1), have been mapped and investigated regardingthe rockfall hazard potential. The analyzed slope is built-up
Fig. 1. Location of the volcanic island Madeira (Portugal) in theAtlantic Ocean and the extent of the study area in Funchal.
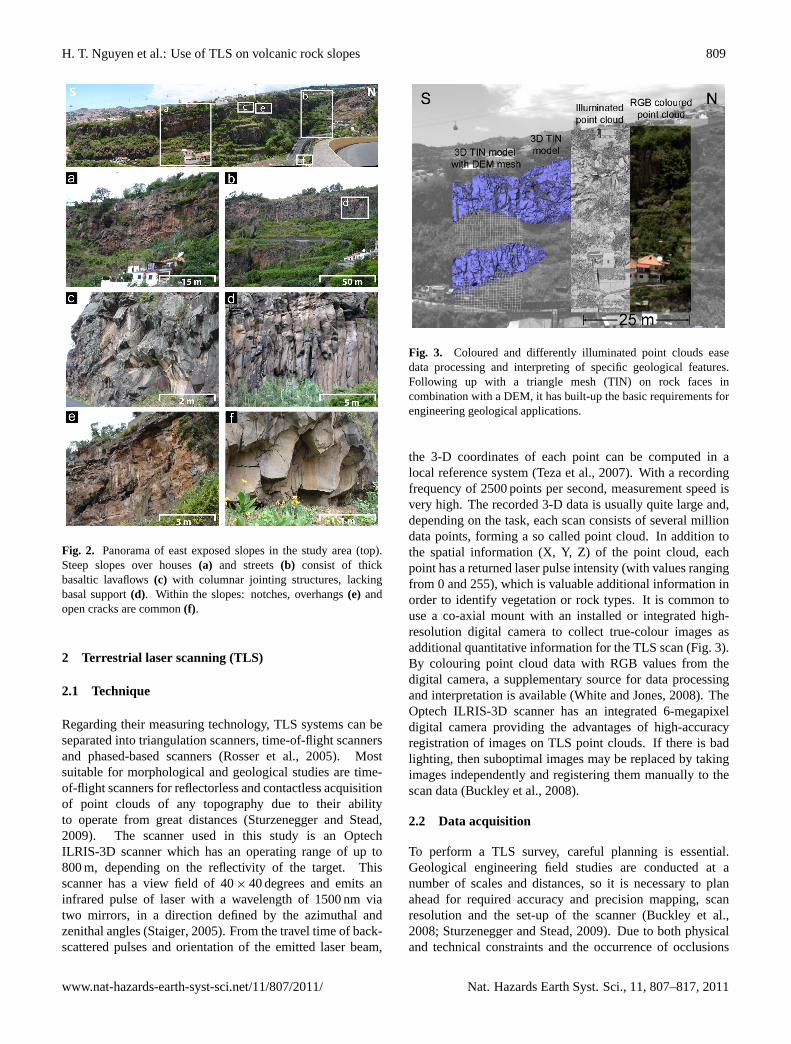
of thick basaltic lava flows with columnar jointing structuresand intercalated breccias and tuff layers (Fig.2). Many ofthe columns already lack basal support and show a widejoint opening (Fig.2d). In the study area, the Joao Gomesriver cut a v-shaped valley into a series of different volcanicrocks, exposing up to 120 m high slopes. Below thesebasaltic cliffs, more shallow dipping areas are located withterraces formerly used for agriculture. Colluvial and alluvialdeposits cover the bottom and the footwall of the valley.Within this unit, precipitation-triggered small landslides arecommon. High-traffic roads at the valley bottom and theirconnecting roads winding up to valley shoulders are exposedto rockfalls from the steep slopes and overhangs of the highlyfractured basaltic cliffs. The entire area is densely coveredby vegetation, with the exception of nearly vertical cliffs(Fig. 2).
Nat. Hazards Earth Syst. Sci., 11, 807–817, 2011 www.nat-hazards-earth-syst-sci.net/11/807/2011/
H. T. Nguyen et al.: Use of TLS on volcanic rock slopes 809
Fig. 2. Panorama of east exposed slopes in the study area (top).Steep slopes over houses(a) and streets(b) consist of thickbasaltic lavaflows(c) with columnar jointing structures, lackingbasal support(d). Within the slopes: notches, overhangs(e) andopen cracks are common(f).
2 Terrestrial laser scanning (TLS)
2.1 Technique
Regarding their measuring technology, TLS systems can beseparated into triangulation scanners, time-of-flight scannersand phased-based scanners (Rosser et al., 2005). Mostsuitable for morphological and geological studies are time-of-flight scanners for reflectorless and contactless acquisitionof point clouds of any topography due to their abilityto operate from great distances (Sturzenegger and Stead,2009). The scanner used in this study is an OptechILRIS-3D scanner which has an operating range of up to800 m, depending on the reflectivity of the target. Thisscanner has a view field of 40× 40 degrees and emits aninfrared pulse of laser with a wavelength of 1500 nm viatwo mirrors, in a direction defined by the azimuthal andzenithal angles (Staiger, 2005). From the travel time of back-scattered pulses and orientation of the emitted laser beam,
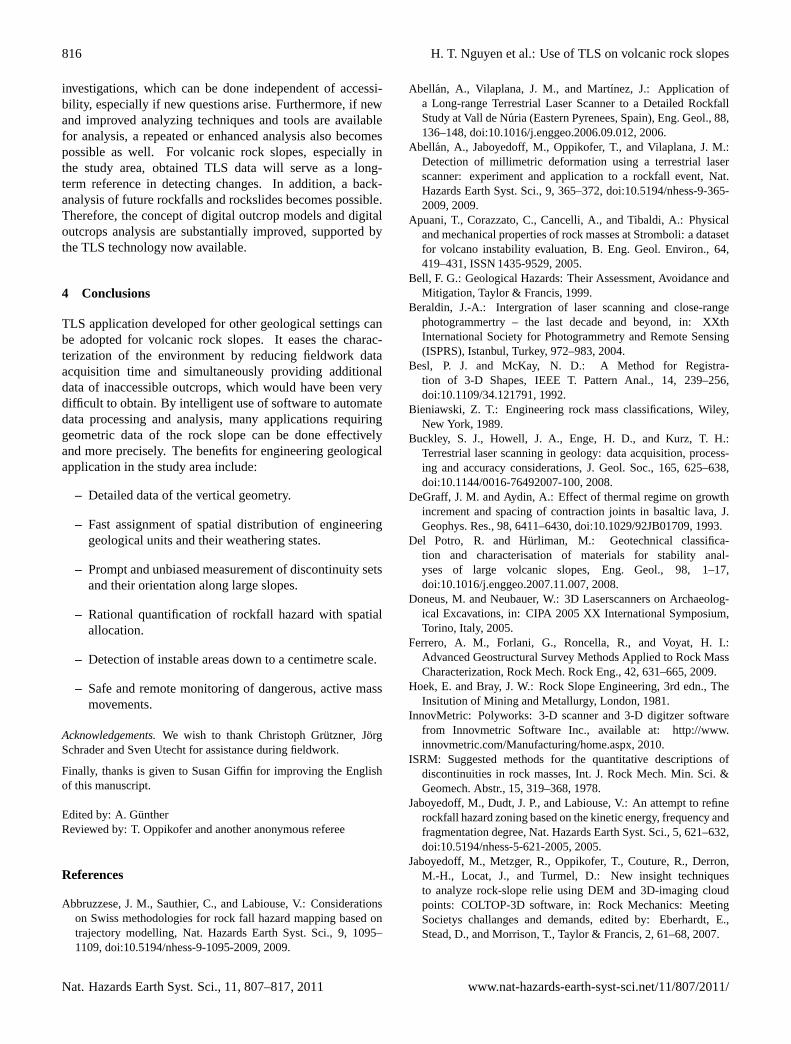
Fig. 3. Coloured and differently illuminated point clouds easedata processing and interpreting of specific geological features.Following up with a triangle mesh (TIN) on rock faces incombination with a DEM, it has built-up the basic requirements forengineering geological applications.
the 3-D coordinates of each point can be computed in alocal reference system (Teza et al., 2007). With a recordingfrequency of 2500 points per second, measurement speed isvery high. The recorded 3-D data is usually quite large and,depending on the task, each scan consists of several milliondata points, forming a so called point cloud. In addition tothe spatial information (X, Y, Z) of the point cloud, eachpoint has a returned laser pulse intensity (with values rangingfrom 0 and 255), which is valuable additional information inorder to identify vegetation or rock types. It is common touse a co-axial mount with an installed or integrated high-resolution digital camera to collect true-colour images asadditional quantitative information for the TLS scan (Fig.3).By colouring point cloud data with RGB values from thedigital camera, a supplementary source for data processingand interpretation is available (White and Jones, 2008). TheOptech ILRIS-3D scanner has an integrated 6-megapixeldigital camera providing the advantages of high-accuracyregistration of images on TLS point clouds. If there is badlighting, then suboptimal images may be replaced by takingimages independently and registering them manually to thescan data (Buckley et al., 2008).
2.2 Data acquisition
To perform a TLS survey, careful planning is essential.Geological engineering field studies are conducted at anumber of scales and distances, so it is necessary to planahead for required accuracy and precision mapping, scanresolution and the set-up of the scanner (Buckley et al.,2008; Sturzenegger and Stead, 2009). Due to both physicaland technical constraints and the occurrence of occlusions
www.nat-hazards-earth-syst-sci.net/11/807/2011/ Nat. Hazards Earth Syst. Sci., 11, 807–817, 2011

810 H. T. Nguyen et al.: Use of TLS on volcanic rock slopes
(shadow zones) the choice of the scan positions is of highimportance. To get a 3-D surface model, generally an or-thogonal setup of the scanner to the outcrop is advantageous,including the change of positions to avoid horizontal andvertical occlusions. Additionally, it is advisable to scan fromhigher elevation for better data quality and signal intensity.If scans are performed at an elevation equal at or below thebottom of the slope, then it is difficult to avoid occlusionsat top faces. Typical methods to solve this problem arescanning from natural or artificially higher positions (Doneusand Neubauer, 2005) or completing TLS data with airborneLiDAR data (Oppikofer et al., 2009). Due to the extendedoperating range of the TLS scanner, data acquisition hasbeen performed from the opposite side of the valley to obtaindata points with a minimum of occlusions in the highestfaces. Although it often makes sense to scan the entire areawith the best acquirable resolution, the enormous amountof data requires a very powerful computing environmentand will slow down data processing substantially. To speedup the process, different scanning windows with differentresolutions may be used, depending on the scale of thegeological features and the requirements for the chosengeological engineering applications (Fig.4). In the area ofinterest, several scans were performed at distances between150 m and 400 m with point densities (resolution) between5.3 cm and 7.2 cm to derive a complete point cloud. Toquantify discontinuity orientation and to monitor surfacedeformation, additional close-range scans at a distance of30 m to 50 m have been performed with a setup resolutionbetween 5 mm and 10 mm. Unfortunately, such small pointspacing leads to an oversampling with the effect that finedetails become blurred, since the beam width of the laseris wider than the point spacing due to the beam divergence(Lichti and Jamtsho, 2006). From these investigations, aTLS dataset comprising approximately 300 million pointswas complied. Thus, for modelling purposes, a subsequentresampling of these raw scans to a resolution wider than20 mm was necessary to achieve good results. However,these scans have been performed at the highest resolution forarchival storage, as they document the recent situation andmight be used for further application in the future.
2.3 Data processing
TLS datasets of the study area were computed, using thesoftware PolyWorks (InnovMetric, 2010). First, the singlescans are registered in a relative coordinate system continuedby transforming (alignment) following scans into the samesystem. Alignment starts manually by identifying commonpoints in the point clouds. Following this rough matching,an automated iterative procedure with a point-to-surfaceIterative Closest Point (ICP) algorithm was carried outin order to minimize the co-registration errors (Besl andMcKay, 1992; Teza et al., 2007). Commonly, overlaps
4 :
artificially higher positions (Doneus and Neubauer, 2005) orcompleting TLS data with airborne LiDAR data (Oppikoferet al., 2009). Due to the extended operating range of the TLSscanner, data acquisition has been performed from the oppo-site side of the valley to obtain data points with a minimumof occlusions in the highest faces. Although it often makessense to scan the entire area with the best acquirable resolu-tion, the enormous amount of data requires a very powerfulcomputing environment and will slow down data processingsubstantially. To speed up the process, different scanningwindows with different resolutions may be used, dependingon the scale of the geological features and the requirementsfor the chosen engineering geological applications (Fig.4).In the area of interest, several scans were performed at dis-tances between 150 m and 400 m with point densities (reso-lution) between 5.3 cm and 7.2 cm to derive a complete pointcloud. To quantify discontinuity orientation and to monitorsurface deformation, additional close-range scans at a dis-tance of 30 m to 50 m have been performed with a setupresolution between 5 mm and 10 mm. Unfortunately, suchsmall point spacing leads to an oversampling with the ef-fect that fine details become blurred, since the beam widthof the laser is wider than the point spacing due to the beamdivergence (Lichti and Jamtsho, 2006). From these investi-gations, a TLS dataset comprising approximately 300 millionpoints was complied. Thus, for modelling purposes, a sub-sequent resampling of these raw scans to a resolution widerthan 20 mm was necessary to achieve good results. However,these scans have been performed at the highest resolution forarchival storage, as they document the recent situation andmight be used for further application in the future.
2.3 Data processing
TLS datasets of the study area were computed, using thesoftware PolyWorks (InnovMetric, 2010). First, the singlescans are registered in a relative coordinate system continuedby transforming (alignment) following scans into the samesystem. Alignment starts manually by identifying commonpoints in the point clouds. Following this rough matching,an automated iterative procedure with a point-to-surface It-erative Closest Point (ICP) algorithm was carried out in or-der to minimize the co-registration errors (Besl and McKay,1992; Teza et al., 2007). Commonly, overlaps of approxi-mately 10 - 20 % between the different scans are necessaryto ensure good matching. In a typical workflow, one scanis held fixed and subsequent scans are matched in turn, fix-ing each as it is solved. This leads to large data amountsslowing down data processing considerably. Therefore, fromthe previously registered scan, only the overlapping area isclipped to a new file and used for registration of the fol-lowing scan scene. Even though these additional process-ing steps extend a typical workflow, the benefit is that theregistration process speeds up effectively. Finally, a globalalignment is carried out to adjust all scan positions relatively,
Fig. 4. A 5 m resolution DEM (blue mesh) derived from contourlines of the study area lacks of geometrical detail such as overhangsor notches. Positioning a 10 cm resolution point cloud (black) intothe data sets improves especially the vertical geometry. Simulta-neously the DEM can be used to close gaps or to cover less in-terest area between different point clouds. For structural analysis,the same procedure has been used with high resolution point clouds(orange) (a). The fusion of the different data sets results in a highquality model which differs up to 10 m in comparison to the 5 mresolution DEM (b).
allowing the point clouds to be merged in the same coordi-nate system. Afterwards, an intelligent point data reductionhas to be done to remove left-overs, such as vegetation andother non-geological points. For this purpose, a square sam-pling grid is used to subdivide the point cloud data, to createthe ground surface and to select data points that are beyonda user-specified distance from the ground surface. After avisual check, vegetation such as trees and bushes, buildingsand infrastructures can easily be removed. In case of a RGBcoloured point clouds, data points of vegetation close to steepslopes and ground can be selected for removal using greenvalues larger than 50. Otherwise a manual removal can beperformed by subdividing the point cloud data into several
Fig. 4. A 5-m resolution DEM (blue mesh) derived from contourlines of the study area lacks geometrical detail, such as overhangsor notches. Positioning a 10-cm resolution point cloud (black)into the data sets improves the vertical geometry in particular.Simultaneously, the DEM can be used to close gaps or to coverless interesting area between different point clouds. For structuralanalysis, the same procedure has been used with high resolutionpoint clouds (orange)(a). The fusion of the different data setsresults in a high quality model which differs up to 10 m incomparison to the 5-m resolution DEM(b).
of approximately 10–20% between the different scans arenecessary to ensure good matching. In a typical workflow,one scan is held fixed and subsequent scans are matchedin turn, fixing each as it is solved. This leads to largedata amounts slowing down data processing considerably.Therefore, from the previously registered scan, only theoverlapping area is clipped to a new file and used forregistration of the following scan scene. Even though theseadditional processing steps extend a typical workflow, thebenefit is that the registration process speeds up effectively.Finally, a global alignment is carried out to adjust all scanpositions relatively, allowing the point clouds to be mergedin the same coordinate system. Afterwards, an intelligent
Nat. Hazards Earth Syst. Sci., 11, 807–817, 2011 www.nat-hazards-earth-syst-sci.net/11/807/2011/

H. T. Nguyen et al.: Use of TLS on volcanic rock slopes 811
point data reduction has to be done to remove left-overs,such as vegetation and other non-geological points. For thispurpose, a square sampling grid is used to subdivide thepoint cloud data, to create the ground surface and to selectdata points that are beyond a user-specified distance fromthe ground surface. After a visual check, vegetation such astrees and bushes, buildings and infrastructures, can easily beremoved. In case of a RGB coloured point clouds, data pointsof vegetation close to steep slopes and ground can be selectedfor removal using green values larger than 50. Otherwise amanual removal can be performed by subdividing the pointcloud data into several strips. On the side view of each strip,vegetation and other non-ground objects appear clearly andcan be easily selected for removal. Special care must betaken to ensure that the elimination does not lead to an over-simplified model. For most applications, this processinglevel is more than sufficient to carry out all measurements,interpretation and modelling tasks. Moreover, the acquiredTLS data often do not cover the entire study area withoutgaps, due to removal or occlusions. To close these gapsand to ease orientation, the TLS data has been inserted intoan ordinary DEM derived from 5-m contour line data fromprecise topographic maps (Instituto Geografico do Exercito:Funchal, Ilha da Madeira. [map], 1:5000, Lisboa, I.G.E.,2004) via a global registration. By merging both datasets,a HRDEM without data gaps can be created (Fig.4). Asit is normally neither effective nor necessary to use thecomplete TLS dataset at once, a hierarchical use of differentTLS datasets (separated by resolution and area) has beenperformed depending on the application. With the optionto select only areas of interest from the whole data set forfurther processing and investigation, the amount of data canbe kept manageable and efficient. This allows us to createa DEM of large areas with lower resolution or to performstructural analysis on small areas with high resolution. Datapreparation finally ends with a virtual outcrop model bytexturing the resulting DEM with georeferenced imagesand orthophotos, providing a 3-D photorealistic model forinvestigation, visualization and education. Techniques fortexturing are presented inBuckley et al.(2008) andWhiteand Jones(2008).
3 Engineering geological applications
3.1 Characterization
The first aim in engineering geological investigations withTLS is the characterization of the volcanic environmentwith digital and field-based mapping. TLS data provide theability to measure and visualize topographic relief down tocentimetre resolution for digital inspection. This may includethe determination of the spatial distribution of low erosion-resistant units such as tuffs, weak-welded pyroclastics andintercalated breccias and their weathering state. Due todifferent erosion-resistance of the rocks, overhangs and
notches form, leading e.g. to a lack of basal support and to apotential rockfall source.
Using ESRIs ArcGIS applications, different levels of in-formation can be added to the outcrop data for an intelligentand interactive data interpretation. Figure5 is an exampleof a scanned outcrop of a lavaflow translated from raw TLSdata into a 2-D grid. Interfering objects (e.g. vegetation) canbe marked in the RGB image and considered in subsequentslope gradient and intensity analysis as non-relevant. Theslope gradient analysis has been performed twice, first at acell size of 1 cm and followed by one of 5 cm. Using thecoarser analysis as a transparent overlay with a stretchedcolouring (inverted to the finer one), neighbouring diverselydipping cells resulted into discoloured areas. Thus, a manualpre-allocation of autoclastic breccias is possible due to itsmore irregular surface with respect to basalt surfaces. Aparticular attention has been paid to rough top faces of basaltcolumns, which are difficult to distinguish from breccias.To avoid misinterpretation, visual cross-checks using theinformation from different sources and data derivations likehillshades or RGB data might be used. Different weatheringconditions within the rock slope can be distinguished bydiscolouring of the host rock, which can in turn be detectedby higher intensity values. Analysis of related intensityvalues of pre-assigned and clarified areas support the semi-automated classification of the outcrop model. Althoughvegetation can usually be identified by low intensity values,sometimes small plants or leaves of plants may mix upwith background intensities of rock mass, depending on themodel and image resolution. This results in misleading orobscure vegetation patterns as shown in Fig.5. Thereforeusing a cross-sourced information (e.g. RGB images or slopeanalysis) can be applied to avoid these problems. The laststep is the manual assignment of unit boundaries by tracing2-D or 3-D lines directly onto a virtual outcrop model.Depending on the joint patterns, traced lines subdivide thelava flow into different structural units, as presented in Fig.5.After reapplication to different outcrops, a correlation of thedifferent units over a wide area makes it possible to set up aconsistent and comprehensible geological model to identifypotential rockfall sources. At these locations, structuralanalysis for discontinuity characterization may follow.
3.2 Structural analysis
Dealing with large rock faces or slopes, a good understandingof present discontinuities is required, as they determinethe mechanical behaviour of the rocks (Bieniawski, 1989).During a field survey, it is common practice to measure thegeometry of discontinuities, such as orientation, roughnessand location (ISRM, 1978) using standardized methods likescan-line surveys or cell mapping (Priest, 1993). However,the manual sampling and measuring is often discussedas erroneous. It has different disadvantages, as there issampling bias due to restricted access to rock faces, or the
www.nat-hazards-earth-syst-sci.net/11/807/2011/ Nat. Hazards Earth Syst. Sci., 11, 807–817, 2011

812 H. T. Nguyen et al.: Use of TLS on volcanic rock slopes
Fig. 5. Transformation of TLS outcrop data into 2-D relief data allows performing a slope gradient and intensity analysis for a pre-allocationof geological units and their weathering conditions in a GIS environment. Supported by the manual assignment of unit boundaries from avirtual outcrop model, evaluation and comparison of different sources allow the characterization of the outcrop.
experiences are time-consuming and labour-intensive (Slobet al., 2005). From the 3-D model, discontinuity charac-terization can be achieved by either manually fitting planeson individual surfaces and traces or by automatically usingcapable analytical software (e.g.Kemeny and Donovan,2005; Slob et al., 2005; Jaboyedoff et al., 2007; Ferrero et al.,2009; Oppikofer et al., 2009; Sturzenegger and Stead, 2009).The only requirement is an accurate positioning of pointcloud data either levelled in a relative coordinate system withrespect to the North or by an absolute system using GPS,conventional surveying or a DEM.
A typical workflow to perform discontinuity characteriza-tion is subdivided into data processing and data analysis steps(Fig. 6). As part of the overall data processing, differentraw data point clouds have been aligned and merged intothe same coordinate system and subsequently cleaned ofnon-geological data. This can be done as described by themethod above and is a prerequisite for further processing.By continuing with data reduction according to the scale ofthe scanned features, and subsequently completing a 3-DDelaunay Triangulation to mesh the entire point cloud, thestrike and dip of each triangle can be measured. Groupingneighbouring triangles with similar orientation results infacets, whose orientation and density can be analyzed in apolar plot. Using clustering techniques (e.g. F-distribution),different rock mass discontinuity sets can be identified andmean orientations computed or plotted (Slob et al., 2005).
The software used (Split FX v1.0 by Split Engineering)detects facets on a triangulated mesh with the followingcriteria: edge length 0.15 m and a minimum of four neigh-bouring facets with a maximal 10◦ deviation of orientationto each other. With a visualization of cluster regionson the 3-D meshed surface and a subsequent colouringto distinguish different clusters, an initial identification ofdifferent discontinuity sets can be done. However, the use ofsemi-automated software may compute false orientation dueto very small patches or discontinuities over several facets asshown in Fig.7a. In addition, larger joints surfaces may havebeen undetected since their more irregular surface resultedin less uniform oriented faces, not fulfilling the used criteria.This conditioned a visual verification and manual editing toremove outliers or to add missing facets before calculatingthe average orientation of discontinuities.
Joint spacing and distribution can be measured andanalyzed directly from acquired TLS data at every position.For this study on Madeira island, only the areas of interestwere processed and analyzed. This is necessary due to theenormous size of high-resolution scans, which can affectcomputing performance substantially, if they are loaded atthe same time. Considering this point, potentially rockfallsources such as uncovered massive lavaflows have beenscanned in high-resolution. Visual inspections of the basalticcliffs on the slope clearly show systematic discontinuity sets.For stability and rockfall analysis, their local orientation, as
Nat. Hazards Earth Syst. Sci., 11, 807–817, 2011 www.nat-hazards-earth-syst-sci.net/11/807/2011/

H. T. Nguyen et al.: Use of TLS on volcanic rock slopes 813
Fig. 6. Workflow describing the processing of TLS data for discontinuity analysis of rock slopes.
well as joint spacing is of high relevance. It is expectedthat due to cooling processes (DeGraff and Aydin, 1993),generally a sub-horizontal and two orthogonal sub-verticaljoint faces should have developed in the lava flows (Moonet al., 2005). Figure7b shows that it is possible to identifyall of them from the point cloud data.
The plotted joint sets may be used for a kinematical failureprediction according toHoek and Bray(1981). Furthermore,the data allows an evaluation of possible rockfall volumesdepending on failure mechanism and spatial joint pattern.Due to the frequent occurrence of rockfalls, average blocksizes are of particular interest. Using the stereographicprojection technique, plane sliding can occur on column-bounding fracture plane CB 5 (Fig.8). Limited by column-normal and column-bounding fractures, block sizes havebeen estimated with average volumes between 0.5 m3 and2 m3. Corresponding to recognizable scars and blocks in thefield, the estimated block sizes have been used for numericalor probabilistic simulation.
3.3 Numerical analysis
Numerical rockfall simulations are a common and importanttask in modern hazard assessments. They provide objectivedecision support for identification of endangered areas,providing run-out distances, impact frequency and energy.Since rockfall simulation is very sensitive to slope geometry,it is necessary to have highly detailed DEMs for 2-D or3-D simulation (Rosser et al., 2005). Cross-sections canbe derived manually or automatically from the TLS pointcloud data, allowing a fast creation at frequent intervals. Amajor advantage compared to a typical DEM used in GISis that overhanging parts of the slope and steep cliffs arerepresented much more realistically and with high details.Considering the option to select view-dependent profiles,orthogonal setups relative to the analysed slopes can beensured, as shown in Fig.9a. Rockfall simulations have beenperformed with Rockfall 6.1 software (Spang and Sonser,1995), which has also been used in further studies for rockfallsimulations (Mikos et al., 2006; Abbruzzese et al., 2009). Itallows a physically exact simulation of the trajectory of arockfall considering also the spin. Required input parameterslike the shape, size and mass of a rock have been determinedby the structural analysis from TLS and lab data. To considergeological uncertainty, a random parameter variation can
www.nat-hazards-earth-syst-sci.net/11/807/2011/ Nat. Hazards Earth Syst. Sci., 11, 807–817, 2011

814 H. T. Nguyen et al.: Use of TLS on volcanic rock slopes
Fig. 7. Software aided semi-automated discontinuity analysis:small patches, discontinuities over several facets and undetectedjoints conditioned visual verification(a). Displaying orientationdata in lower hemisphere stereographic projections at each pointof interest resulted in a discontinuity characterization of the overallslope(b).
be set for the simulations. Special care should be takenregarding the resolution of the simulation. Extremelydetailed data may provide an unrealistically rough surface,which does not necessarily represent surface conditions inthe field, thus producing errors.
The relevance of the surface accuracy becomes obviouswhen comparing the numerical simulations of the sameprofile, using a 5-m DEM and 0.3-m HRDEM, with theidentical input parameters for simulation (Fig.9b). Sincethe results differ critically in the magnitude of kinetic energyand spatial impact, hazard analysis in the study area will beimproved by use of HRDEM data. Therefore, the resultsof the simulation for each profile have been classified byimpact frequency and energy after the matrix diagram shownin Figure (Fig.9c). It defines in case of a rockfall event,the probability of an impact on a given location within adefined energy class. The distribution of the kinetic energyclasses based on the energy absorption capacity of improvedwire cable constructions (100 kJ–300 kJ). Subsequently they
Fig. 8. To determine the size of possible planar sliding blocks atthe outcrop shown, discontinuity sets have been plotted on cross-sections to measure their spacing.
are visualized in ESRIs ArcGIS as polyline data and drapedover the DEM hillshade. To visualize the results a spatialinterpolation has been performed to create 2-D grids withspecific colours assigned to data ranges, allowing a spatialreview of the entire simulation results (Fig.9c). Thebenefits of this attempt are the availability of a spatialdatabase for detailed countermeasure designs, addressing theadministration for local or regional planning.
To this point, the hazardous zones shown are not a hazardmap, since they do not consider the probability of rockfailure. To create a hazard map, such as that proposed byJaboyedoff et al.(2005), the probability of failure has to beestimated using the frequency of historical events or frommonitoring periods (Rosser et al., 2005).
3.4 Monitoring
The previously presented analysis methods determine po-tentially unstable rock masses and their consequences,neglecting the frequency of different magnitudes of rockfallsin the study area. Without historical records, monitoringusing TLS is one option to develop a local magnitude-frequency relationship function for hazard analysis. Itsrequirements are the detection of number and sizes ofrockfall blocks or scars and their changes over time.Furthermore, displacements and deformation rates mightbe monitored. This can be done by comparing TLSdata from different time epochs after an accurate matchingof repeated measurements. Using different applicationsto calculate spatial displacements between two or moresequential scans, information about their spatial distribution,type of movement, total displacements and rates can be
Nat. Hazards Earth Syst. Sci., 11, 807–817, 2011 www.nat-hazards-earth-syst-sci.net/11/807/2011/

H. T. Nguyen et al.: Use of TLS on volcanic rock slopes 815
Fig. 9. Automatically created cross-sections (red lines) on aHRDEM are used to perform rockfall simulations along the slopeat frequent intervals(a). Comparison of numerical simulation ofprofiles at the same location, using DEM and HRDEM data withidentical input parameters(b). Classifying the simulation results, azoning by impact frequency and energy, is possible(c).
determined (Rosser et al., 2005; Oppikofer et al., 2009). Inthe research area, scans from May 2008 and December 2008have been compared focusing on rock cuts next to streets andbuildings. However, even using high-detailed point cloudswith an ICP alignment on the reference data, millimetredisplacements cannot be measured directly due to the TLSinstrumental error (Abellan et al., 2009).
Fig. 10. Multi-temporal comparison of the TLS point clouds fromMay 2008 and December 2008. Changes beyond a basic scattervalue are due to different scan positions and instrumental errors.Small scale rockfalls are visualized in red. The enlarged view of themarked area (box) shows a missing volume of 0.5 m3 between thescan of May 2008 (red mesh) and December 2008.
For a magnitude-frequency analysis of rockfalls, insteadof comparing the shortest distances between the two pointclouds, DEMs were created from the different scans andsubtracted from each other in ArcGIS. Displayed as differ-ential area diagrams in e.g. ArcScene, changes are indicatedas peaks or notches. This highlights moved or havemissing blocks, which can be considered to be related tothe mechanism of deformation. It should be noted, thatagain the use of cross-sourced information is useful todelimit changes from vegetation. Due to instrumental errors,alignment errors and modelling errors (Teza et al., 2007),a comparison error with basic scatter values up to 4.6 cmexist as Fig.10 shows. The error has been calculatedfrom a differential area diagram. It amounts to the doublestandard deviation of difference with respect to the error.Displacements beyond this error can be considered as realdisplacements values. Analysis shows that during a period ofseven months, single small volume rockfalls (up to 0.5 m3)occurred. This dataset can be used to set up a databasefor frequency-magnitude analysis for a defined area. Toestimated rockfall frequency for longer periods, a rockfallinventory by continued documentation is necessary.
3.5 Documentation
An advantage of TLS application in engineering geologyof volcanic slopes is that due to the time-efficiency of dataacquisition, rapid documentation of recent in-situ activitiesfor a given rock slope can be accumulated. Once acquired,the data provide a basis for many engineering geological
www.nat-hazards-earth-syst-sci.net/11/807/2011/ Nat. Hazards Earth Syst. Sci., 11, 807–817, 2011
816 H. T. Nguyen et al.: Use of TLS on volcanic rock slopes
investigations, which can be done independent of accessi-bility, especially if new questions arise. Furthermore, if newand improved analyzing techniques and tools are availablefor analysis, a repeated or enhanced analysis also becomespossible as well. For volcanic rock slopes, especially inthe study area, obtained TLS data will serve as a long-term reference in detecting changes. In addition, a back-analysis of future rockfalls and rockslides becomes possible.Therefore, the concept of digital outcrop models and digitaloutcrops analysis are substantially improved, supported bythe TLS technology now available.
4 Conclusions
TLS application developed for other geological settings canbe adopted for volcanic rock slopes. It eases the charac-terization of the environment by reducing fieldwork dataacquisition time and simultaneously providing additionaldata of inaccessible outcrops, which would have been verydifficult to obtain. By intelligent use of software to automatedata processing and analysis, many applications requiringgeometric data of the rock slope can be done effectivelyand more precisely. The benefits for engineering geologicalapplication in the study area include:
– Detailed data of the vertical geometry.
– Fast assignment of spatial distribution of engineeringgeological units and their weathering states.
– Prompt and unbiased measurement of discontinuity setsand their orientation along large slopes.
– Rational quantification of rockfall hazard with spatialallocation.
– Detection of instable areas down to a centimetre scale.
– Safe and remote monitoring of dangerous, active massmovements.
Acknowledgements.We wish to thank Christoph Grutzner, JorgSchrader and Sven Utecht for assistance during fieldwork.
Finally, thanks is given to Susan Giffin for improving the Englishof this manuscript.
Edited by: A. GuntherReviewed by: T. Oppikofer and another anonymous referee
References
Abbruzzese, J. M., Sauthier, C., and Labiouse, V.: Considerationson Swiss methodologies for rock fall hazard mapping based ontrajectory modelling, Nat. Hazards Earth Syst. Sci., 9, 1095–1109,doi:10.5194/nhess-9-1095-2009, 2009.
Abellan, A., Vilaplana, J. M., and Martınez, J.: Application ofa Long-range Terrestrial Laser Scanner to a Detailed RockfallStudy at Vall de Nuria (Eastern Pyrenees, Spain), Eng. Geol., 88,136–148,doi:10.1016/j.enggeo.2006.09.012, 2006.
Abellan, A., Jaboyedoff, M., Oppikofer, T., and Vilaplana, J. M.:Detection of millimetric deformation using a terrestrial laserscanner: experiment and application to a rockfall event, Nat.Hazards Earth Syst. Sci., 9, 365–372,doi:10.5194/nhess-9-365-2009, 2009.
Apuani, T., Corazzato, C., Cancelli, A., and Tibaldi, A.: Physicaland mechanical properties of rock masses at Stromboli: a datasetfor volcano instability evaluation, B. Eng. Geol. Environ., 64,419–431, ISSN 1435-9529, 2005.
Bell, F. G.: Geological Hazards: Their Assessment, Avoidance andMitigation, Taylor & Francis, 1999.
Beraldin, J.-A.: Intergration of laser scanning and close-rangephotogrammertry – the last decade and beyond, in: XXthInternational Society for Photogrammetry and Remote Sensing(ISPRS), Istanbul, Turkey, 972–983, 2004.
Besl, P. J. and McKay, N. D.: A Method for Registra-tion of 3-D Shapes, IEEE T. Pattern Anal., 14, 239–256,doi:10.1109/34.121791, 1992.
Bieniawski, Z. T.: Engineering rock mass classifications, Wiley,New York, 1989.
Buckley, S. J., Howell, J. A., Enge, H. D., and Kurz, T. H.:Terrestrial laser scanning in geology: data acquisition, process-ing and accuracy considerations, J. Geol. Soc., 165, 625–638,doi:10.1144/0016-76492007-100, 2008.
DeGraff, J. M. and Aydin, A.: Effect of thermal regime on growthincrement and spacing of contraction joints in basaltic lava, J.Geophys. Res., 98, 6411–6430,doi:10.1029/92JB01709, 1993.
Del Potro, R. and Hurliman, M.: Geotechnical classifica-tion and characterisation of materials for stability anal-yses of large volcanic slopes, Eng. Geol., 98, 1–17,doi:10.1016/j.enggeo.2007.11.007, 2008.
Doneus, M. and Neubauer, W.: 3D Laserscanners on Archaeolog-ical Excavations, in: CIPA 2005 XX International Symposium,Torino, Italy, 2005.
Ferrero, A. M., Forlani, G., Roncella, R., and Voyat, H. I.:Advanced Geostructural Survey Methods Applied to Rock MassCharacterization, Rock Mech. Rock Eng., 42, 631–665, 2009.
Hoek, E. and Bray, J. W.: Rock Slope Engineering, 3rd edn., TheInsitution of Mining and Metallurgy, London, 1981.
InnovMetric: Polyworks: 3-D scanner and 3-D digitzer softwarefrom Innovmetric Software Inc., available at:http://www.innovmetric.com/Manufacturing/home.aspx, 2010.
ISRM: Suggested methods for the quantitative descriptions ofdiscontinuities in rock masses, Int. J. Rock Mech. Min. Sci. &Geomech. Abstr., 15, 319–368, 1978.
Jaboyedoff, M., Dudt, J. P., and Labiouse, V.: An attempt to refinerockfall hazard zoning based on the kinetic energy, frequency andfragmentation degree, Nat. Hazards Earth Syst. Sci., 5, 621–632,doi:10.5194/nhess-5-621-2005, 2005.
Jaboyedoff, M., Metzger, R., Oppikofer, T., Couture, R., Derron,M.-H., Locat, J., and Turmel, D.: New insight techniquesto analyze rock-slope relie using DEM and 3D-imaging cloudpoints: COLTOP-3D software, in: Rock Mechanics: MeetingSocietys challanges and demands, edited by: Eberhardt, E.,Stead, D., and Morrison, T., Taylor & Francis, 2, 61–68, 2007.
Nat. Hazards Earth Syst. Sci., 11, 807–817, 2011 www.nat-hazards-earth-syst-sci.net/11/807/2011/

H. T. Nguyen et al.: Use of TLS on volcanic rock slopes 817
Jones, L. D.: Monitoring landslides in hazardous terrain usingterrestrial LiDAR: an example from Montserrat, Q. J. Eng. Geol.Hydroge., 39, 371–373,doi:10.1144/1470-9236/06-009, 2006.
Kemeny, J. and Donovan, J.: Rock mass characterization usingLiDAR and automated point cloud processing, Ground Eng., 38,26–29, 2005.
Kersten, T., Przybilla, H.-J., and Lindstaedt, M.: Integration, Fusionund Kombination von terrestrischen Laserscannerdaten unddigitalen Bildern, Workshop: Anforderungen an geometrischefusionsverfahren, DIN Deutsches Institut fur Normung e.V. undHumboldt-Universitat zu Berlin, 2006 (in German).
Lichti, D. D. and Jamtsho, S.: Angular resolution of terrestrial laserscanners, Photogramm. Rec., 21, 141–160,doi:10.1111/j.1477-9730.2006.00367.x, 2006.
Liu, J.-K., Shih, T.-Y., Chan, Y.-C., and Hsieh, Y.-C.: Lidar DEMfor Characterizing the Volcanic Landforms of Tatun Volcanoesin Metropolitan Taipei, in: International Geoscience and RemoteSensing Symposium (IGARSS) 2007, 2007.
Mikos, M., Petje, U., and Ribicic, M.: Disaster Mitigation of DebrisFlows, Slope Failures and Landslides, vol. 1, chap. Applicationof a Rockfall Simulation Program in an Alpine Valley inSlovenia, Universal Academy Press, Inc., 199–211, 2006.
Moon, V., Bradshaw, J., Smith, R., and de Lange, W.: Geotechnicalcharacterisation of stratocone crater wall sequences, WhiteIsland Volcano, New Zealand, Eng. Geol., 81, 146–178,doi:10.1016/j.enggeo.2005.07.014, 2005.
Oppikofer, T., Jaboyedoff, M., Blikra, L., Derron, M.-H., andMetzger, R.: Characterization and monitoring of theAknesrockslide using terrestrial laser scanning, Nat. Hazards EarthSyst. Sci., 9, 1003–1019,doi:10.5194/nhess-9-1003-2009, 2009.
Pesci, A., Fabris, M., Conforti, D., Loddo, F., Baldi, P., andAnzideil, M.: Integration of ground-based laser scanner andaerial digital photogrammetry for topographic modelling ofVesuvio volcano, J. Volcanol. Geoth. Res., 162, 123–138,doi:10.1016/j.jvolgeores.2007.02.005, 2007.
Pesci, A., Tezua, G., and Ventura, G.: Remote Sensing of volcanicterrains by terrestrial laser scanner: preliminary reflectance andRGB implications for studying Vesuvius crater (Italy), Ann.Geophys.-Italy, 51, 633–653, 2008.
Priest, S. D.: Discontinuity Analysis for Rock Engineering,Chapman and Hall, London, 1993.
Rodrigues, D. and Ayala-Carcedo, F. J.: Rain-induced Landslidesand Debris Flows on Madeira Island, Portugal, Landslide News,14/15, 43–45, 2003.
Rosser, N. J., Petley, D. N., Lim, M., Dunning, S. A., and Allison,R. J.: Terrestrial laser scanning for monitoring the process hardrock coastal cliff erosion, Q. J. Eng. Geol. Hydroge., 38, 363–375,doi:10.1144/1470-9236/05-008, 2005.
Schmincke, H.-U.: Zeitliche, strukturelle und vulkanische En-twicklung der Kanarischen Inseln, der Selvagens Inseln und desMadeira-Archipels, in: Die Reptilien der Kanarischen Inseln,der Selvagens-Inseln und des Madeira-Archipels, Aula VerlagWiesbaden, 27–69, 1998 (in German).
Slob, S. and Hack, R.: 3D Terrestrial Laser Scanning as a NewField Measurement and Monitoring Technique, in: EngineeringGeology for Infrastructure Planning in Europe, edited by: Hack,R., Azzam, R., and Charlier, R., Springer Berlin/Heidelberg,Lect. Notes Earth Sci., 104, 179–189, 2004.
Slob, S., Hack, V., v. Knappen, B., Turner, K., and Kemeny, J.:A method for automated discontinuity analysis of rock slopeswith 3D laser scanning, in: Proceedings of the TransportationResearch Board 84th annual meeting, 16 pp., 2005.
Spang, R. M. and Sonser, T.: Optimized rockfall protection by“Rockfall”, Proceeding of the 8th International Congress onRockmechaniks, Tokyo, 1233–1242, 1995.
Staiger, R.: Terrestrisches Laserscanning - Eine neue Univer-salmessmethode?, in: Terrestrisches Laserscanning (TLS) -Ein geodatisches Messverfahren mit Zukunft. Beitrage zum65. DVW-Seminar am 21. und 22. November 2005 in Fulda,DVW e.V. – Gesellschaft f. Geodasie, Geoinformation u.Landmanagement, 48, 3–16, 2005 (in German).
Sturzenegger, M. and Stead, D.: Close-range terrestrial digitalphotogrammertry and terrestrial laserscanning for discontinuitycharacterization on rock cuts, Eng. Geol., 106, 163–182,doi:10.1016/j.enggeo.2009.03.004, 2009.
Teza, G., Galgaro, A., Zaltron, N., and Genevois, R.: Ter-restrial laser scanner to detect landslide displacement fields:a new approach, Int. J. Remote Sens., 28, 3425–3446,doi:10.1080/01431160601024234, 2007.
White, P. D. and Jones, R. R.: A cost-efficient solution totrue color terrestrial laser scanning, Geosphere, 4, 564–575,doi:10.1130/GES00155.1, 2008.
www.nat-hazards-earth-syst-sci.net/11/807/2011/ Nat. Hazards Earth Syst. Sci., 11, 807–817, 2011