use of stomach tubing as an alternative to rumen...
TRANSCRIPT

1
Use of stomach tubing as an alternative to rumen cannulation to study
ruminal fermentation and microbiota in sheep and goats
E. Ramos-Moralesa1*, A. Arco-Péreza, A. I. Martín-Garcíaa, D. R. Yáñez-
Ruiza, P. Frutosb, G. Hervásb
aINAN, Estación Experimental del Zaidín (CSIC), Profesor Albareda 1, 18008
Granada, Spain
bInstituto de Ganadería de Montaña (CSIC-ULE), Finca Marzanas s/n, 24346
Grulleros, León, Spain
1Institute of Biological, Environmental and Rural Sciences, Aberystwyth University,
SY23 3EB, Aberystwyth, UK.
*Corresponding author: Tel: + 44 01970621673
E-mail address: [email protected]

2
ABSTRACT
Rumen cannulation is the reference method for collection of representative samples of
rumen digesta. However, it is not always viable, which obliges to depend on less
invasive techniques, such as stomach tubing. The aim of this work was to study if the
differences in fermentation parameters and rumen microbial populations observed
between species (sheep and goats), diets (forage and forage plus concentrate) and
sampling times (pre- and post-feeding) are consistent when collecting the samples
through stomach tube or rumen cannula, in an attempt to validate the use of the
former as an alternative to the latter. Four sheep and four goats, fitted with ruminal
cannula, were fed either forage (F diet; alfalfa hay) or forage plus concentrate (1:1;
FC diet), in two 15-d periods. At the end of each period (d 14 and 15), samples of
rumen digesta were taken by stomach tube and rumen cannula, before and 4 hours
after morning feeding, for determination of ruminal fermentation parameters (pH, and
lactate, ammonia and total VFA concentrations). The three main rumen microbial
groups (bacteria, protozoa and methanogenic archaea) and two fibrolytic bacteria
(Ruminococcus flavefaciens and Fibrobacter succinogenes) were quantified by real
time PCR and, additionally, PCR-DGGE analysis of the bacterial community on the
rumen digesta samples collected post-feeding was carried out. Overall, sampling
through ruminal cannula and stomach tube gave similar results regarding fermentation
parameters when comparing species, diets and sampling times. Despite samples for
microbiology assays contained liquid plus solid fractions when collected through
rumen cannula and mostly liquid when collected through stomach tube, both
techniques showed certain consistency in the effects of treatments on the rumen
microbiota (e.g., both revealed no differences between species in total bacteria,
archaea and R. flavefaciens concentrations, and higher protozoa numbers in goats than
3
in sheep). However, there was also some discrepancy regarding microorganism
concentrations, particularly concerning sampling times (e.g., differences between pre-
and post-feeding samplings were only observed in rumen cannula samples for total
bacteria and methanogenic archaea, and in stomach tube samples for R. flavefaciens
concentrations). Therefore, this study supports that non-invasive stomach tubing is a
feasible alternative to surgical rumen cannulation in sheep and goats to examine
ruminal fermentation. Nonetheless, caution should be taken when using this technique
to assess the structure and composition of the rumen microbial community.
Keywords: rumen cannula, stomach tube, small ruminants, fermentation,
microorganisms
Abbreviations: ADF, acid detergent fibre; DMI, dry matter intake; CP, crude protein;
D, diet; DGGE, denaturing gradient gel electrophoresis; DM, dry matter; F, forage;
FC, forage plus concentrate; FM, fresh matter; G, goat; LW, live weight; MEI,
metabolizable energy intake; N, nitrogen; NDF, neutral detergent fibre; OM, organic
matter; PCA, principal components analysis; PCR, polymerase chain reaction; qPCR,
real-time quantitative PCR; S, sheep; Sp, species; VFA, volatile fatty acids; T,
sampling time.

4
1. Introduction
Rumen cannulation is considered the reference method for collection of
representative samples of rumen digesta and is therefore widely used in ruminant
nutrition research (Komarek, 1981; Kristensen et al., 2010). However, rumen
cannulation is not feasible in lactating ewes or goats, because of potential adverse
effects on animal performance, which obliges to depend on less invasive alternatives,
such as oral stomach probing.
Rumen cannulation and stomach tubing have been mainly used to assess
ruminal fermentation (Geishauser and Gitzel, 1996; Duffield et al., 2004) and, more
recently, to analyse the structure of the rumen microbial community (Hook et al.,
2009; Lodge-Ivey et al., 2009; Terré et al., 2013). In the few studies in which the two
techniques were used together, comparisons of fermentation profile and microbiota
resulted in either significant differences (e.g., Geishauser and Gitzel, 1996; Duffield
et al., 2004) or similar results (e.g., Lodge-Ivey et al., 2009; Shen et al., 2012; Terré et
al., 2013) and the reasons for this discrepancy are probably related to the probing
procedure to avoid saliva contamination, the type of sample obtained and the rumen
sampling site.
While negligible amounts of solid material can be collected with stomach
probe, rumen cannula allows collection of both solid and liquid fractions of the rumen
digesta. This may be relevant when the treatments to be studied are not expected to
have the same effect on microbial populations attached to solids or inhabiting the
liquid phase (Martínez et al., 2010).
Regarding the rumen sampling site, Shen et al. (2012) obtained significant
variations in ruminal fermentation parameters (pH, VFA, ammonia N and ion
concentrations) when sampling at different locations through ruminal cannula.

5
Differences between samples collected via cannula or stomach tube were also
observed and attributed to the sampling site when the probe was not inserted to a
depth enough to reach the central sac. Otherwise, no significant differences were
detected between methods (Shen et al., 2012). Unfortunately, probe insertion in an
accurate location of the rumen is very complicated in small ruminants.
To our knowledge, reports analysing methods of rumen sampling are very
scant in sheep and practically non-existent in goats. Therefore, this experiment was
conducted with ruminally-cannulated sheep and goats to validate the use of the
stomach probing as an alternative to rumen cannulation in small ruminants. The main
aim of this work was to assess the ability of both approaches to detect differences
between treatments (i.e., species, diets or sampling times) in ruminal fermentation and
microbial community, rather than a direct comparison of methods.
2. Materials and methods
2.1. Animals, diets and experimental design
Four Segureña sheep (S; mean live weight 56.4 ± 2.66 kg) and four Murciano-
Granadina goats (G; 37.8 ± 1.65 kg), fitted with a ruminal cannula (35 mm internal
diameter), were individually penned and fed alfalfa hay for 2 weeks. After that
adaptation, animals were fed two different diets in two consecutive 15-d periods (for
each period, 2 animals/species and diet): forage (F diet; alfalfa hay) or forage plus
concentrate (1:1; FC diet). Concentrate (Pacsa Sanders, Seville, Spain) was provided
as pellets. Chemical composition of the diets (g/kg DM) and dry matter intake (DMI;
g/kg) and metabolizable energy intake (MEI; MJ/d) is shown in Table 1.
Experimental diets were offered in two meals (60% at 9:00 h and 40% at 18:00 h) at
estimated energy requirements for maintenance for sheep (Aguilera et al., 1986) and

6
goats (Prieto et al., 1990). Clean water and mineral supplement were always
available.
All experimental procedures were approved and completed in accordance with
the Spanish Royal Decree 53/2013 for the protection of animals used for experimental
purposes.
2.2. Measurements and sampling procedures
On days 14 and 15 of each period, samples of rumen digesta were obtained,
via stomach tube and rumen cannula, from each animal.
For stomach tube sampling, a flexible PVC tube (2 mm of wall thickness and
6 mm of internal diameter; Cristallo Extra, FITT S.p.A., Sandrigo, Italy) with about
20 holes of 3 mm diameter in the 12 cm-probe head was warmed-up using hot water
and inserted to a depth of approx. 120-150 cm via the esophagus. Rumen samples (ca.
50 ml) were obtained using an electric vacuum pump (down to 7 mbar; Vacuubrand
MZ 2C, Wertheim, Germany). Before being strained through a nylon membrane (400
µm; Fisher Scientific S.L., Madrid, Spain), these samples were subjected to visual and
tactile examination to ensure that they were not contaminated with saliva. A 20 cm
long handle sampling scoop was used to collect rumen contents samples through the
cannula from different parts of the dorsal sac in the rumen. An average of 5 samples
were taken, composited, aliquoted (ca. 20 mL) and strained through the nylon
membrane. For each animal, samples were first collected via stomach tube and
immediately afterwards via rumen cannula, both before morning feeding and 4 h post-
feeding.
The pH was measured using a pH-meter (Crison GLP 21, Barcelona, Spain)
and a 4 mL subsample was acidified with 4 mL of 0.2 M HCl for ammonia

7
determinations. Further 4 and 0.8 mL aliquots of strained ruminal fluid were taken,
respectively, for the analysis of lactic acid and VFA (deproteinized with 0.5 mL of 20
g/L metaphosphoric and 4 g/L crotonic acids in 0.5 M HCl). All these samples were
stored at –30ºC until analysis. Additionally, on day 15 non-strained subsamples (ca.
30 g) of rumen digesta were collected, before the morning feeding and 4 hours after
feeding, first via stomach tube and subsequently via rumen cannula, immediately
frozen at –80ºC, freeze-dried, and stored again at –80ºC until subsequent molecular
analyses.
2.3. Chemical analysis
Feed samples (i.e., alfalfa hay and concentrate) were prepared (ISO
6498:2012) and analysed for DM (ISO 6496:1999), ash (ISO 5984:2002), and CP
(ISO 5983-2:2009). The aNDF and ADF were determined as described by Mertens
(2002) and the AOAC (2006; Official Method 973.18), respectively, using an
Ankom2000 fibre analyser (Ankom Technology Corp., Macedon, NY, USA). Neutral
detergent fibre was assayed with sodium sulphite and α-amylase and expressed with
residual ash (the latter also for ADF). The content of ether extract in the diets was
determined by the Ankom Filter Bag Technology (AOCS, 2008; Procedure Am 5-04).
Starch content was analysed by a total starch assay kit obtained from Megazyme (K-
TSTA; Megazyme Intl. Ireland Ltd., Wicklow, Ireland).
Ammonia and lactic acid concentrations were determined by colorimetric
methods (Weatherburn, 1967, and Taylor, 1996; respectively) and VFA by gas
chromatography, with crotonic acid as an internal standard (Ottenstein and Bartley,
1971), in centrifuged samples.

8
2.4. DNA extraction, quantitative PCR and Denaturing Gradient Gel Electrophoresis
analyses
Freeze-dried samples of rumen digesta were mixed by physical disruption
using a bead beater (Mini-bead Beater 8, BioSpec Products, Bartlesville, OK, USA).
The DNA extraction was performed from 50 mg samples following the QIAamp
DNA Stool Mini Kit (Qiagen Ltd, West Sussex, UK) manufacturer's instructions but
with higher temperature (95ºC) for lysis incubation. The DNA samples were used as
templates to quantify the copy numbers of 16S rRNA (for bacteria), methyl coenzyme
M reductase A (mcrA) gene (for methanogenic archaea), and 18S rRNA (for protozoa)
by real-time quantitative PCR (qPCR) as described by Abecia et al. (2012b). Primer
set used for Ruminococcus flavefaciens and Fibrobacter succinogenes were described
by Denman and McSweeney (2006).
The PCR-DGGE analysis of bacterial community on the rumen digesta
samples collected post-feeding was carried out as previously described (Abecia et al.,
2012a). The DGGE banding profiles were compared using the similarity matrix
obtained by using the Bray-Curtis algorithm. The Shannon index and richness
(number of bands obtained in the DGGE gel for each sample) were used to estimate
the bacterial diversity in each sample.
2.5. Statistical analysis
For each sampling method, all data (rumen fermentation characteristics and
microbiological results) were analysed by 3-way ANOVA, using the MIXED
procedure of SAS (2012, version 9.3). The statistical model included the fixed effects
of species (Sp), diet (D), sampling time (T) and their interactions. In all cases, the
period (mean values of days 14 and 15) was considered as a blocking term and the

9
animal as a random effect. Since microbiology results did not satisfy the assumptions
of normality, data were log10 transformed before the statistical analysis. The model
for diversity indices included the fixed effects of species (Sp), diet (D) and their
interaction. Differences were declared significant at P<0.05 and considered as
tendencies towards significance at P<0.10. Least squares means are reported
throughout. Principal components analysis (PCA) plots were obtained using R-
statistical software (R Core team, 2013) and Vegan package.
3. Results
3.1. Fermentation parameters
The amount of FC and F diets provided daily was consumed by all animals with the
exception of two sheep that left refusals of the F diet. This was reflected in a lower
MEI intake of the F diet by sheep than it was expected (Table 1).
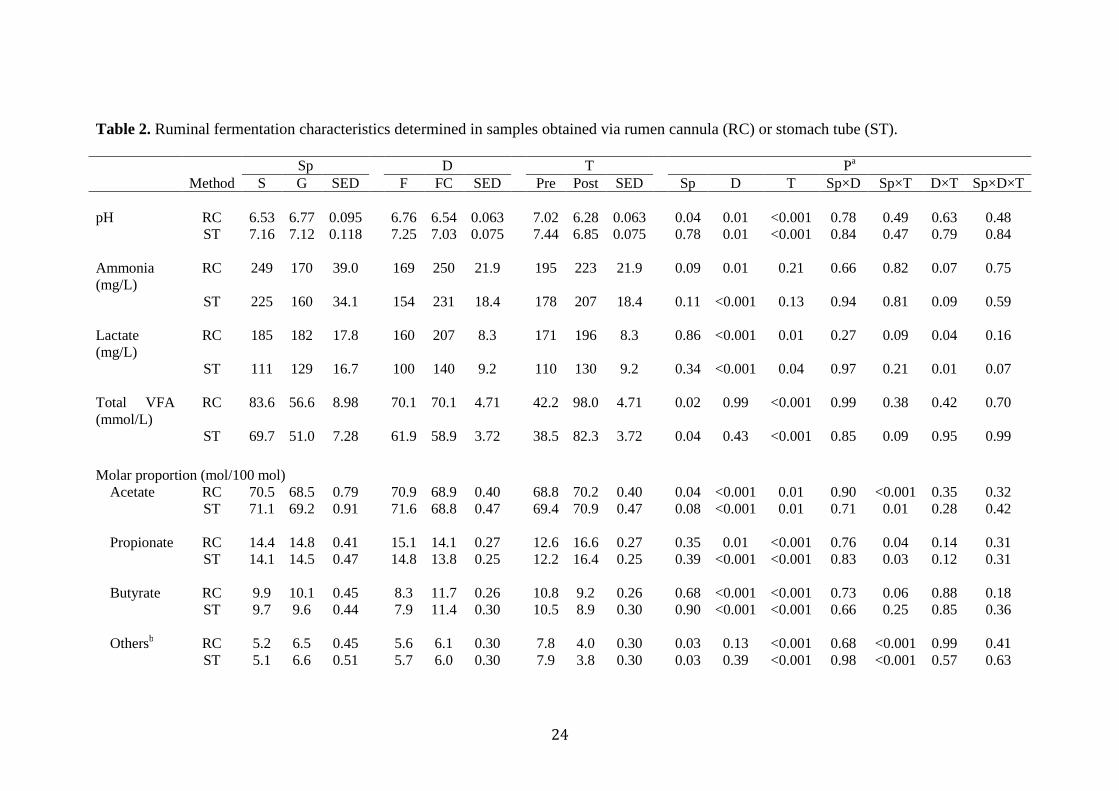
Differences in pH values and ammonia concentrations due to the animal species were
only observed when sampling through rumen cannula. Whereas pH values were lower
(P=0.04) in sheep than in goats, ammonia concentrations tended to be higher (P=0.09)
in the former species. For the rest of fermentation parameters studied, both sampling
techniques gave similar results: either no differences (for lactate concentration, molar
proportions of propionate and butyrate, and acetate/propionate ratio) or higher
concentration of total VFA (P<0.05) and molar proportion of acetate (P<0.10), for
sheep in comparison to goats (Table 2).
Both rumen cannula and stomach tube sampling showed significant differences for
most of the fermentation parameters measured when feeding F or FC diets. The pH
values as well as the molar proportions of acetate and propionate were higher
(P<0.01) for the F diet, whereas the concentration of ammonia and lactate, the molar

10
proportion of butyrate, and the ratio acetate/propionate resulted in higher values
(P<0.05) with the FC diet. For total VFA and the sum of isobutyrate, isovalerate,
valerate and caproate, no differences were detected by any of the two methods (Table
2).
Collecting the samples before the morning feeding or 4 h afterwards, either through
rumen cannula or stomach tube, resulted in significant differences (P<0.05) for all the
parameters considered but the ammonia concentration (Table 2). Both methods
showed that sampling 4 h after feeding resulted in lower pH and higher concentrations
of lactate and total VFA (P<0.05). Molar proportions of acetate and propionate were
higher whereas that of butyrate was lower post-feeding (P<0.01). The ratio
acetate/propionate was, however, lower (P<0.001) when sampling post-feeding.
3.2. Microbial abundances
The concentrations of protozoa in the rumen of goats were higher (P<0.10) than in
sheep for samples obtained using both sampling methods. However, only sampling
through stomach tube revealed differences between animal species (P=0.09) in the
gene copy numbers of F. succinogenes (Table 3). No significant differences between
sheep and goats were detected in the concentration of total bacteria, archaea and R.
flavefaciens, regardless the sampling technique.
With respect to the diets, only sampling through stomach tube was able to detect
differences in the concentration of bacteria, which was higher (P=0.09) when animals
were fed the F diet. However, both sampling methods showed differences in the
numbers of protozoa, methanogenic archaea and R. flavevaciens: the concentrations
of protozoa and R. flavefaciens were greater whereas that of archaea was lower for FC

11
diet in comparison to F diet (P<0.05). Besides, none of the techniques resulted in
changes in F. succinogenes numbers in relation to the diet (Table 3).
With respect to sample collection times (pre- or post- feeding), both techniques
revealed differences in concentrations of protozoa and F. succinogenes (P<0.05),
values being higher before feeding. Nevertheless, differences due to the sampling
time were only observed when samples were taken through rumen cannula for
bacteria (P<0.001) and methanogenic archaea (P=0.07), and through stomach tube for
R. flavefaciens concentrations (P=0.01). Although the abundances of protozoa and R.
flavefaciens were lower than those normally published in the literature (Patra and Yu,
2013 and 2014), the relevance of such underestimation for the purpose of our work
is negligible.
3.3. Analysis of the bacterial community structure and diversity
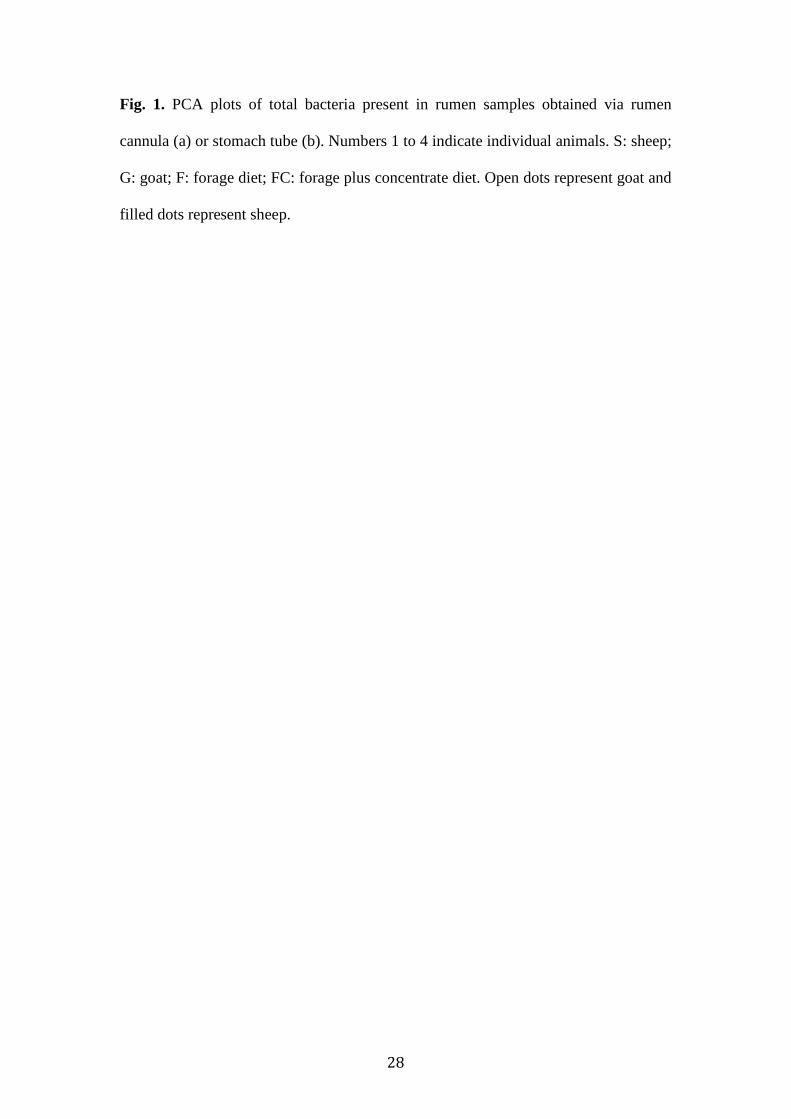
The PCA plot of bacterial community (Figures 1a and 1b) segregated samples by
component 2 in two groups, for both rumen cannula and stomach tube techniques,
corresponding to sampling period regardless of diet or species. Within each period,
samples tended to be grouped by animal species, although the pattern was more
evident for rumen cannula samples than for stomach tube ones. Percentages of
variance explained by the principal components were 54.7% and 46.5%.
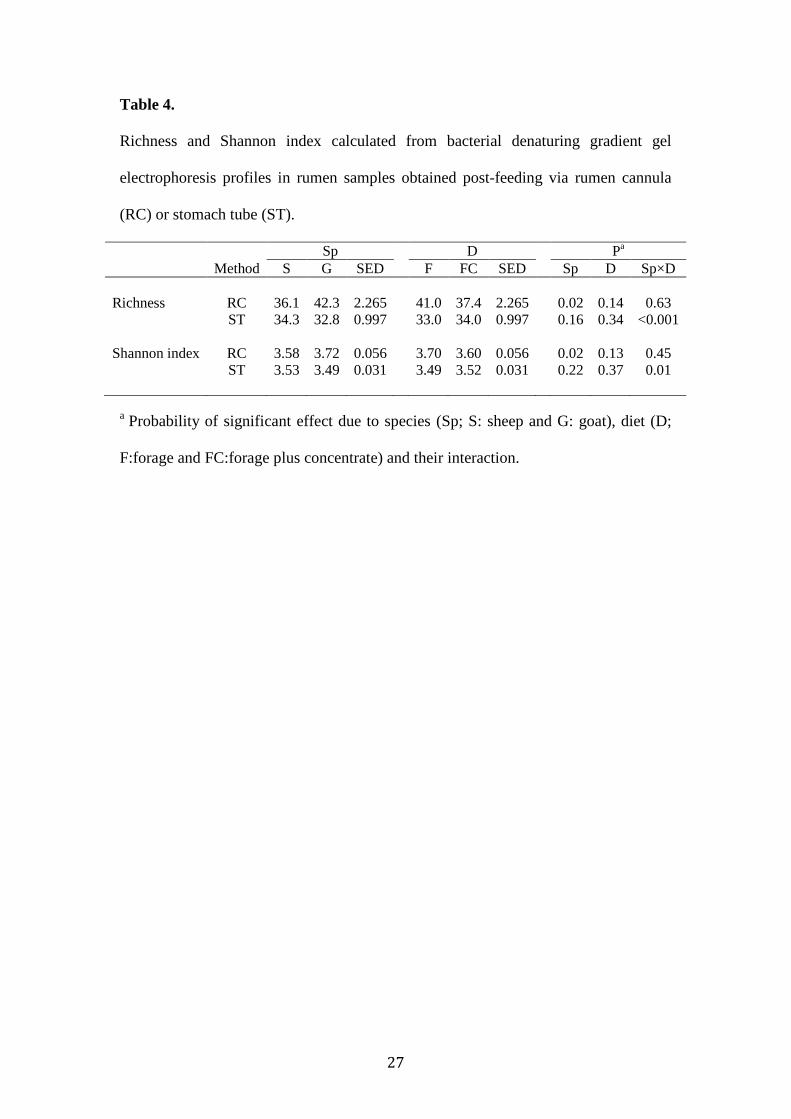
Diversity indexes (Table 4) were higher in goats than in sheep when sampling through
rumen cannula (P=0.02). However, these differences between species were not
observed when sampling through stomach tube. Both techniques were unable to
detect variations due to feeding F or FC diets.
4. Discussion
12
Given the great potential of stomach tubing as non-invasive technique in small
ruminant nutrition research and the very few studies that have evaluated its suitability
in comparison to rumen cannulation in sheep and goats (Geishauser and Gitzel, 1996;
Duffield et al., 2004), the aim of this work was to study if the differences in
fermentation parameters and rumen microbial populations observed between species
(sheep and goats), diets (F and FC) and sampling times (pre- and post- feeding) were
consistent when samples were collected by both approaches.
Rumen samples were obtained first via stomach tube and immediately afterwards via
rumen cannula. Terré et al., (2013) collected samples through rumen cannula first to
avoid a possible contamination of rumen digesta with saliva, due to stimulation of its
flow by the stomach probing. Nevertheless, Geishauser and Gitzel (1996) reported
that differences in fermentation parameters observed when sampling through oro-
ruminal probe and rumen cannula did not depend on the sampling order (probe prior
to cannula or vice versa). Despite a widespread perception that samples obtained by
stomach tube may be considerably contaminated by saliva, it has been demonstrated
that salivary contamination is rarely a problem if the person collecting the sample is
experienced, the tube is not frequently relocated, the probed animal does not move,
and the collection is completed in a short time (Geishauser and Gitzel, 1996; Lodge-
Ivey et al., 2009). After visual and tactile examination of our samples, it seems very
unlikely that they were contaminated with saliva to a considerable extent. However,
the fact that water and saliva are delivered to the reticulo-rumen through the
esophageal orifice, may imply an unavoidable minor dilution of rumen contents when
the sample is collected from that point via stomach tube.
Ruminal fermentation parameters
13
The collection of samples of rumen digesta through stomach tube or rumen cannula
revealed similar differences between animal species, diets and sampling times, with
the exception of pH values in sheep and goats, which were significantly different only
when samples were obtained via rumen cannula. The latter may be related to a
possible saliva contamination. On the other hand, a greater VFA concentration in
rumen cannula than in stomach tube samples has been reported previously
(Geishauser and Gitzel, 1996; Terré et al., 2013) and attributed to saliva
contamination.
Results obtained using any of the two techniques are consistent with those reported by
other authors when comparing species (Yañez Ruiz et al., 2004) and sampling times
(Salles et al., 2003). Ruminal NH3-N and VFA concentrations have been found to be
lower in goats than in sheep, and post-feeding sampling is known to decrease pH and
increase ammonia, lactate and VFA concentrations. Li et al. (2009) attributed post-
feeding differences in fermentation parameters to changes in cells numbers for
particular bacteria species in response to the availability of the substrate over time.
Regarding diets differing in the amount of concentrate, it has been reported that
starch-rich diets may yield greater lactic acid concentration and hence lower ruminal
pH (Cantalapiedra-Hijar et al., 2009), in agreement with the results obtained in this
study for the FC in comparison to the F diet. Increases in NH3-N concentrations in
response to increasing levels of concentrate in the diet have also been observed
previously (Cantalapiedra-Hijar et al., 2009). With respect to total VFA, we did not
detect differences when feeding F or FC diets, which may probably be due to their
similar chemical composition and, especially, the high content of NDF in the FC diet.
Overall, sampling through ruminal cannula and stomach tube gave similar results
regarding fermentation parameters when comparing species, diets and sampling times,

14
which was also supported by the similar average coefficients of variation of
fermentation parameters between techniques (10.24 and 10.98, respectively for rumen
cannula and stomach tube).
Quantification of microorganisms and structure and diversity of rumen bacteria
Recent studies have reported that although there is an overall resemblance in
microbial community structure between samples collected through rumen cannula and
stomach tube, the relative abundance of certain microbial groups differs depending on
the sampling method (Lodge-Ivey et al., 2009; Henderson et al., 2013). This has been
related to the different composition of the samples in terms of liquid and solid
fractions and is in agreement with known variations in the relative abundances of
some microbial groups between liquid (present in both stomach tube and rumen
cannula samples) and solid phases (present only in negligible amounts in stomach
tube samples) (Henderson et al., 2013).
In spite of the different physical composition of the samples, certain consistency was
also evidenced by both techniques in the effects of treatments on the rumen
microbiota. Nevertheless, there was also some discrepancy regarding concentration of
microorganisms, particularly when sampling times were considered. Thus, lower
post-feeding concentrations of total bacteria and methanogenic archaea were only
revealed when samples were obtained via rumen cannula. The decrease in total
bacteria is in line with the pattern observed by Leedle et al. (1982): a decrease in post-
feeding numbers after which these increase steadily, reaching the highest value at 16
h. On the contrary, numbers of R. flavefaciens were lower post-feeding when animals
were sampled with stomach tube. This could be due to the stomach tube not allowing
the collection of small pieces of fibre and therefore underestimating the numbers of

15
microorganisms associated to plant material. However, that was not the case for F.
succinogenes results, which could be explained by differences in preference of plant
tissues as growth substrate by these two fibrolytic bacteria (Shinkai and Kobayashi,
2007).
The higher protozoa numbers detected by both sampling methods in goats than in
sheep agrees with previous reports (Santra et al., 1998; Yáñez Ruiz et al., 2004).
Differences between animal species were also accompanied by a decrease in protozoa
after feeding that has been attributed to the dilution effect of saliva influx as well as to
the sequestration of entodiniomorphs over time (Dehority, 2003). A greater
concentration of protozoa with the FC diet was also detected by both techniques and
is in agreement with other studies (Cantalapiedra-Hijar et al., 2009) on the effect of
increasing proportions of concentrate in the diet on microbial growth.
The PCA plots derived from the DGGE banding profiles suggested that, within
period, animal species was the factor driving the grouping pattern, although this was
more evident in samples collected through rumen cannula. Kong et al. (2010) reported
that richness in bacterial species of the solid fraction is 3.5 times higher than the in the
liquid fraction, which may explain the less evident segregation of samples obtained by
stomach tubing. Furthermore, discrepancy between techniques was observed for the
diversity indexes in goats and sheep, values being higher for goats only when
sampling via rumen cannula. As mentioned above, the fact that samples obtained
through cannula include both liquid and solid fractions would allow the detection of
certain microorganisms associated to the solid phase that would not be included in
samples collected by stomach tube. Terré et al. (2013) reported that, in calves, the
comparison of specific rumen bacteria or fingerprintings of bacteria communities can
be acceptable regardless of the sampling technique (stomach tube or rumen cannula),

16
although these authors did not consider different species, diets or sampling times as in
the present study. However, Lodge-Ivey et al. (2009) compared sampling through
rumen cannula or stomach tubing in sheep and cattle, obtaining similar Shannon index
with both sampling methods (2.1 and 2.2) and therefore supporting the use of stomach
tube for bacterial community studies. It is probably worth mentioning that in this
study only post-feeding samples were analysed so different results could have been
observed if pre-feeding samples had also been considered. Although it has been
reported that sampling time has little impact on the assessment of bacterial diversity
in the rumen (Li et al., 2009), changes in numbers of particular species in response to
the availability of substrate over time may occur.
With respect to diets, none of the techniques detected significant variations in the
bacterial diversity when F and F:C were compared, this result being not expected.
Differences in favour of the rumen cannulation were anticipated as it has been
reported that the diet has a greater effect on solid associated bacteria, assumed to be
much less abundant in samples obtained through stomach tube, than on liquid
associated bacteria (Larue et al., 2005; Martínez et al., 2010). In addition, it cannot be
ruled out that the lack of variations due to the consumption of F or FC diet was due,
as mentioned previously, to the lack of substantial differences in diet composition.
Larue et al., (2005) and Martínez et al. (2010) found higher diversity in solid
associated bacteria when sheep were fed a high forage diet than when it was high in
concentrate.
Nevertheless, the overall effect of different diets on rumen microbiota might not
depend on whether it is assessed in rumen digesta or liquid samples, even if the
microbial composition was significantly changed by the treatments. This have been
observed by Castro-Carrera et al. (2014) who reported that the effect of diet

17
supplementation with marine lipids, evaluated by 454 pyrosequencing, was rather
consistent in rumen content or fluid samples despite inherent differences between
these fractions in their bacterial composition. However, caution should be taken when
the composition of the diets do not differ to a great extent, as occurs in the present
study.
5. Conclusions
This study supports that stomach tubing is a feasible alternative to surgical rumen
cannulation for sampling rumen digesta from sheep and goats to examine ruminal
fermentation. Stomach tubing allows the collection of a highly diverse bacterial
community and is able to detect most of the effects observed when sampling through
cannula. However, further studies including other microbial groups and using high-
throughput sequencing tools, are recommended to explore differences in the
abundances of some microbial taxa.
Acknowledgments
This work was supported by the Spanish Ministry of Economy and Competitiveness
(MINECO; AGL2011-27218 and AGL2011-23700). E. Ramos-Morales acknowledge
the receipt of a research contract from the Spanish National Research Council (CSIC),
Junta de Ampliación de Estudios (JAEdoc) Programme. We gratefully acknowledge
E. Jimenez for the technical assistance and L. Abecia and G. de la Fuente for critical
input in the manuscript.

18
References
Abecia, L., Rodríguez-Romero, N., Yáñez-Ruiz, D.R., Fondevila, M., 2012a.
Biodiversity and fermentative activity of caecal microbial communities in wild
and farm rabbits from Spain. Anaerobe 18, 344–349.
Abecia, L., Toral, P.G., Martín-García, A.I., Martínez, G., Tomkins, N.W., Molina-
Alcaide, E., Newbold, C.J., Yáñez-Ruiz, D.R., 2012b. Effect of
bromochloromethane on methane emission, rumen fermentation pattern, milk
yield, and fatty acid profile in lactating dairy goats. J. Dairy Sci. 95, 2027-2036.
Aguilera, J.F., Molina, E., Prieto, C., Boza, J., 1986. Estimación de las necesidades
energéticas de mantenimiento en ganado ovino de raza Segureña. Archivos de
Zootecnia. 35, 89-96.
AOAC, 2006. Official Methods of Analysis of the Association of Analytical
Communities, 18th ed. (1st revision). AOAC International, Gaithersburg, MD,
USA.
AOCS, 2008. Official Methods and Recommended Practices of the American Oil
Chemist’s Society, 5th ed. (2nd printing). AOCS, Urbana, IL, USA.
Cantalapiedra-Hijar, G., Yáñez-Ruiz, D.R., Martín-García, A.I., Molina-Alcaide, E.,
2009. Effects of forage:concentrate ratio and forage type on apparent digestibility,
ruminal fermentation, and microbial growth in goats. J. Anim. Sci. 87, 622-631.
Castro-Carrera, T., Toral, P.G., Frutos, P., McEwan, N.R., Hervás, G., Abecia, L.,
Pinloche, E., Girdwood, S.E., Belenguer, A., 2014. Rumen bacterial community
evaluated by 454 pyrosequencing and terminal restriction fragment length
polymorphism analyses in dairy sheep fed marine algae. J. Dairy Sci. 97, 1661-
1669.

19
Denman, S.E., McSweeney, C.S., 2006. Development of a real-time PCR assay for
monitoring anaerobic fungal and cellulolytic bacterial populations within the
rumen. FEMS Microbiol. Ecol. 58, 572-582.
Dehority, B.A., 2003. Rumen Microbiology. Nottingham Univ. Press, Nottingham,
UK.
Duffield, T., Plaizier, J.C., Fairfield, A., Bagg, R., Vessie, G., Dick, P., Wilson, J.,
Aramini, J., McBride, B., 2004. Comparison of techniques for measurement of
rumen pH in lactating dairy cows. J. Dairy Sci. 87, 59–66.
Geishauser, T., Gitzel, A., 1996. A comparison of rumen fluid sampled by oro-
ruminal probe versus rumen fistula. Small Rumin. Res. 21, 63–69.
Henderson, G., Cox, F., Kittelmann, S., Miri, V.H., Zethof, M., Noel, S.J., Waghorn,
G.C., Janssen, P.H., 2013. Effect of DNA extraction methods and sampling
techniques on the apparent structure of cow and sheep rumen microbial
communities. PLOS ONE 8(9), e74787.
Hook, S.E., Northwood, K.S., Wright, A.D., McBride, B.W., 2009. Long-term
monensin supplementation does not significantly affect the quantity or diversity of
methanogens in the rumen of the lactating dairy cow. Appl. Environ. Microbiol.
75, 374–380.
ISO 6496; ISO (International Organization for Standardization), 1999. Animal
feeding stuffs − Determination of moisture and other volatile matter content. Int.
Organ. Stand., Geneva, Switzerland.
ISO 5984; ISO (International Organization for Standardization), 2002. Animal
feeding stuffs − Determination of crude ash. Organ. Stand., Geneva, Switzerland.
ISO 5983-2; ISO (International Organization for Standardization), 2009. Animal
feeding stuffs − Determination of nitrogen content and calculation of crude

20
protein content --Part 2: Block digestion and steam distillation method. Int. Organ.
Stand., Geneva, Switzerland.
ISO 6498; ISO (International Organization for Standardization), 2012. Animal
feeding stuffs − Guidelines for sample preparation. Int. Organ. Stand., Geneva,
Switzerland.
Komarek, R.J., 1981. Rumen and abomasal cannulation of sheep with specially
designed cannulas and a cannula insertion instrument. J. Anim. Sci. 53, 790-795.
Kong, Y., Teather, R., Forster, R., 2010. Composition, spatial distribution, and
diversity of the bacterial communities in the rumen of cows fed different forages.
FEMS Microbiol. Ecol. 74, 612–622
Kristensen, N.B., Engbæk, M., Vestergaard, M., Harmon, D.L., 2010. Technical
note: Ruminal cannulation technique in young Holstein calves: Effects of
cannulation on feed intake, body weight gain, and ruminal development at six
weeks of age. J. Dairy Sci. 93, 737-742.
Larue, R., Yu, Z., Parisi, V.A., Egan, A.R., Morrison, M., 2005. Novel microbial
diversity adherent to plant biomass in the herbivore gastrointestinal tract, as
revealed by ribosomal intergenic spacer analysis and rrs gene sequencing.
Environ. Microbiol. 74, 530-543.
Leedle, J.A.Z., Bryant, M.P., Hespell, R.B., 1982. Diurnal variations in bacterial
numbers and fluid parameters in ruminal contents of animals fed low or high
forage diets. Appl. Environ. Microbiol. 44, 402-412.
Li, M., Penner, G.B., Hernandez-Sanabria, E., Oba, M., Guan, L.L., 2009. Effects of
sampling location and time, and host animal on assessment of bacterial diversity
and fermentation parameters in the bovine rumen. J. Appl. Microbiol. 107, 1924-
1934.

21
Lodge-Ivey, S.L., Browne-Silva, J., Horvath, M.B., 2009. Technical note: Bacterial
diversity and fermentation end products in rumen fluid samples collected via oral
lavage or rumen cannula. J. Anim. Sci. 87, 2333–2337.
Martínez, M.E., Ranilla, M.J., Tejido, M.L., Saro, C., Carro, M.D., 2010. Comparison
of fermentation of diets of variable composition and microbial populations in the
rumen of sheep and Rusitec fermenters. II. Protozoa population and diversity of
bacterial communities. J. Dairy Sci. 93, 3699-3712.
Mertens, D.R., 2002. Gravimetric determination of amylase-treated neutral detergent
fiber in feeds with refluxing in beakers or crucibles: Collaborative study. J.
AOAC Int. 85, 1217-1240.
Ottenstein, D.M., Bartley, D.A., 1971. Improved gas chromatography separation of
free acids C2-C5 in dilute solution. Anal. Chem. 43, 952-955.
Patra, A.K., Yu, Z., 2013. Effective reduction of enteric methane production by a
combination of nitrate and saponin without adverse effect on feed degradability,
fermentation, or bacterial and archaeal communities of the rumen. Bioresour.
Technol. 148, 352–360.
Patra, A.K., Yu, Z., 2014. Effects of vanillin, quillaja saponin, and essential oils on in
vitro fermentation and protein-degrading microorganisms of the rumen. Appl.
Microbiol. Biotechnol. 98, 897–905.
Prieto, C., Aguilera, J.F., Lara, L., Fonollá, J., 1990. Protein and energy requirements
for maintenance of indigenous Granadina goats. Br. J. Nutr. 63, 155-63.
R Core Team. 2013. R: A language and environmental for statistical computing. R
foundation for Statistical computing. Vienna, Austria. ISBN 3-900051-07-0,
URL http://www.r-project.org/.

22
Salles, M.S.V., Zanetti, M.A., Del Claro, G.R., Netto, A.S., Franzolin, R., 2003.
Effect of rumen cannula and esophageal probe methods on sampling of rumen
fluid in cattle. Arq. Bras. Med. Vet. Zootec. 55, 438-442.
Santra, A., Karim, S.A., Mishra, A.S., Chaturvedi, O.H., Prasad, R., 1998. Rumen
ciliate protozoa and fiber digestion in sheep and goats. Small Ruminant Res. 30,
13–18.
SAS, 2012. Statistical Analysis System version 9.3. SAS Institute, Cary, NC, USA.
Shen, J.S., Chai, Z., Song, L.J., Liu, J.X., Wu, Y.M., 2012. Insertion depth of oral
stomach tubes may affect the fermentation parameters of ruminal fluid collected
in dairy cows. J. Dairy Sci. 95, 5978–5984.
Shinkai, T., Kobayashi, Y., 2007. Localization of ruminal cellulolytic bacteria on
plant fibrous materials as determined by fluorescence in situ hybridization and
real-time PCR. Appl. Environ. Microbiol. 73, 1646–1652.
Taylor, K.A.C.C., 1996. A simple colorimetric assay for muramic acid and lactic acid.
Appl. Biochem. Biotechnol. 56, 49-58.
Terré, M., Castells, L., Fàbregas, F., Bach, A., 2013. Comparison of pH, volatile fatty
acids, and microbiome of rumen samples from preweaned calved obtained via
cannula or stomach tube. J. Dairy Sci. 96, 5290-5294.
Weatherburn, M.W., 1967. Phenol-hypochlorite reaction for determination of
ammonia. Anal. Chem. 39, 971-974.
Yáñez Ruiz, D.R., Moumen, A., Martín García, A.I., Molina Alcaide, E., 2004.
Ruminal fermentation and degradation patterns, protozoa population, and urinary
purine derivatives excretion in goats and wethers fed diets based on two-stage
olive cake: Effect of PEG supply. J. Anim. Sci. 82, 2023-2032.

23
Table 1. Chemical composition of the diets (g/kg DM) and dry matter intake and
metabolizable energy intake of sheep and goats.
Diet F1 FC2 Organic matter 891 883 Crude protein 192 185 Neutral detergent fibre 397 355 Acid detergent fibre 306 224 Starch 11 107 Ether extract 35 43 Metabolizable energy (MJ/kg DM) Dry matter intake (g/d) Sheep Goats Metabolizable energy intake (MJ/d) Sheep Goats
8.1
1040±97 906±30
8.42±0.8 7.34±0.25
9.25
1050±49 804±29
9.71±0.45 7.43±0.27
1Forage diet (alfalfa) 2Forage plus concentrate diet (1:1). The concentrate (Pacsa Sanders, Seville, Spain) contained wheat flour (35%), sunflower meal (20%), malt sprouts (8%), canola meal (13%), soybean hulls (20%), calcium carbonate (1%), rumen-inert fat (2.5%), sodium chloride (0.50%).
24
Table 2. Ruminal fermentation characteristics determined in samples obtained via rumen cannula (RC) or stomach tube (ST).
Sp D T Pa Method S G SED F FC SED Pre Post SED Sp D T Sp×D Sp×T D×T Sp×D×T pH RC 6.53 6.77 0.095 6.76 6.54 0.063 7.02 6.28 0.063 0.04 0.01 <0.001 0.78 0.49 0.63 0.48 ST 7.16 7.12 0.118 7.25 7.03 0.075 7.44 6.85 0.075 0.78 0.01 <0.001 0.84 0.47 0.79 0.84 Ammonia (mg/L)
RC 249 170 39.0 169 250 21.9 195 223 21.9 0.09 0.01 0.21 0.66 0.82 0.07 0.75
ST 225 160 34.1 154 231 18.4 178 207 18.4 0.11 <0.001 0.13 0.94 0.81 0.09 0.59 Lactate (mg/L)
RC 185 182 17.8 160 207 8.3 171 196 8.3 0.86 <0.001 0.01 0.27 0.09 0.04 0.16
ST 111 129 16.7 100 140 9.2 110 130 9.2 0.34 <0.001 0.04 0.97 0.21 0.01 0.07 Total VFA (mmol/L)
RC 83.6 56.6 8.98 70.1 70.1 4.71 42.2 98.0 4.71 0.02 0.99 <0.001 0.99 0.38 0.42 0.70
ST 69.7 51.0 7.28 61.9 58.9 3.72 38.5 82.3 3.72 0.04 0.43 <0.001 0.85 0.09 0.95 0.99
Molar proportion (mol/100 mol) Acetate RC 70.5 68.5 0.79 70.9 68.9 0.40 68.8 70.2 0.40 0.04 <0.001 0.01 0.90 <0.001 0.35 0.32 ST 71.1 69.2 0.91 71.6 68.8 0.47 69.4 70.9 0.47 0.08 <0.001 0.01 0.71 0.01 0.28 0.42 Propionate RC 14.4 14.8 0.41 15.1 14.1 0.27 12.6 16.6 0.27 0.35 0.01 <0.001 0.76 0.04 0.14 0.31 ST 14.1 14.5 0.47 14.8 13.8 0.25 12.2 16.4 0.25 0.39 <0.001 <0.001 0.83 0.03 0.12 0.31 Butyrate RC 9.9 10.1 0.45 8.3 11.7 0.26 10.8 9.2 0.26 0.68 <0.001 <0.001 0.73 0.06 0.88 0.18 ST 9.7 9.6 0.44 7.9 11.4 0.30 10.5 8.9 0.30 0.90 <0.001 <0.001 0.66 0.25 0.85 0.36 Othersb RC 5.2 6.5 0.45 5.6 6.1 0.30 7.8 4.0 0.30 0.03 0.13 <0.001 0.68 <0.001 0.99 0.41
ST 5.1 6.6 0.51 5.7 6.0 0.30 7.9 3.8 0.30 0.03 0.39 <0.001 0.98 <0.001 0.57 0.63

25
A/P ratio RC 5.0 4.8 0.19 4.8 5.0 0.10 5.5 4.2 0.10 0.24 0.04 <0.001 0.61 0.76 0.02 0.22 ST 5.2 4.9 0.23 4.9 5.1 0.10 5.7 4.3 0.10 0.31 0.04 <0.001 0.63 0.78 0.02 0.26
a Probability of significant effect due to species (Sp; S: sheep and G: goat), diet (D; F:forage and FC:forage plus concentrate), sampling time (T)
and their interactions.
b Calculated as the sum of isobutyrate, isovalerate, valerate and caproate.

26
Table 3.
Ruminal concentration (log10 gene copies/g fresh matter) of bacteria (16S rRNA), protozoa (18S rRNA), methanogenic archaea (mcrA),
Ruminococcus flavefaciens and Fibrobacter succinogenes determined in samples obtained via rumen cannula (RC) or stomach tube (ST).
Sp D T Pa Method S G SED F FC SED Pre Post SED Sp D T Sp×D Sp×T D×T Sp×D×T Bacteria RC 10.43 10.48 0.088 10.49 10.42 0.039 10.54 10.37 0.039 0.65 0.13 <0.001 0.43 0.22 0.44 0.11 ST 9.76 9.89 0.155 9.91 9.74 0.093 9.89 9.77 0.093 0.44 0.09 0.22 0.87 0.42 0.85 0.37 Protozoa RC 4.20 4.33 0.066 4.03 4.50 0.054 4.32 4.20 0.054 0.09 <0.001 0.04 0.26 0.63 0.37 0.93 ST 3.35 3.64 0.082 3.17 3.82 0.076 3.62 3.37 0.076 0.02 <0.001 0.01 0.04 0.21 0.95 0.02 Methanogenic archaea RC 8.30 8.22 0.106 8.38 8.14 0.086 8.35 8.18 0.086 0.47 0.01 0.07 0.92 0.86 0.89 0.82 ST 7.58 7.69 0.187 7.95 7.32 0.133 7.74 7.53 0.133 0.59 <0.001 0.13 0.48 0.87 0.56 0.26 Ruminococcus flavefaciens
RC 3.53 3.44 0.198 3.21 3.76 0.184 3.62 3.35 0.184 0.68 0.01 0.16 0.14 0.57 0.94 0.89
ST 2.19 2.12 0.269 1.73 2.58 0.144 2.41 1.90 0.144 0.78 <0.001 0.01 0.09 0.42 0.14 0.01 Fibrobacter succinogenes
RC 8.71 8.65 0.083 8.69 8.67 0.076 8.85 8.51 0.076 0.49 0.76 <0.001 0.61 0.81 0.27 0.52
ST 9.03 8.47 0.283 8.80 8.70 0.232 9.08 8.42 0.232 0.09 0.66 0.01 0.22 0.19 0.23 0.09
a Probability of significant effect due to species (Sp; S: sheep and G: goat), diet (D; F:forage and FC:forage plus concentrate), sampling time (T)
and their interactions.
27
Table 4.
Richness and Shannon index calculated from bacterial denaturing gradient gel
electrophoresis profiles in rumen samples obtained post-feeding via rumen cannula
(RC) or stomach tube (ST).
Sp D Pa Method S G SED F FC SED Sp D Sp×D Richness RC 36.1 42.3 2.265 41.0 37.4 2.265 0.02 0.14 0.63 ST 34.3 32.8 0.997 33.0 34.0 0.997 0.16 0.34 <0.001 Shannon index RC 3.58 3.72 0.056 3.70 3.60 0.056 0.02 0.13 0.45 ST 3.53 3.49 0.031 3.49 3.52 0.031 0.22 0.37 0.01
a Probability of significant effect due to species (Sp; S: sheep and G: goat), diet (D;
F:forage and FC:forage plus concentrate) and their interaction.
28
Fig. 1. PCA plots of total bacteria present in rumen samples obtained via rumen
cannula (a) or stomach tube (b). Numbers 1 to 4 indicate individual animals. S: sheep;
G: goat; F: forage diet; FC: forage plus concentrate diet. Open dots represent goat and
filled dots represent sheep.