use of solid core chromatography for the analysis of pharmaceutical compounds
TRANSCRIPT

Use of Solid Core Chromatography for the Analysis of Pharmaceutical Compounds
Dafydd MiltonProduct Manager, LC & LC/MS columns
Tony EdgeR&D Principal
March 2014

Introduction
• The Pharmaceutical Process• Mapping out different sectors
Wh t t f h ll f d• What types of challenges are faced• Understanding the drivers in the pharmaceutical industry
• Solid Core Chromatography• Understanding the benefits of the technology• Bar for bar greater efficiency• Bar for bar greater efficiency• How to optimise the separation
• Understanding chemistry• Optimization of the morphology
• Coupling Solid Core Chromatography to Pharmaceutical Analysis• Coupling Solid Core Chromatography to Pharmaceutical Analysis• Design of new workflows• Improving column lifetimes
2
• Improving assay robustness

The Pharmaceutical Process – Beginning
3

The Pharmaceutical Process – Further Development
4
Solid Core Material – Features and Benefits
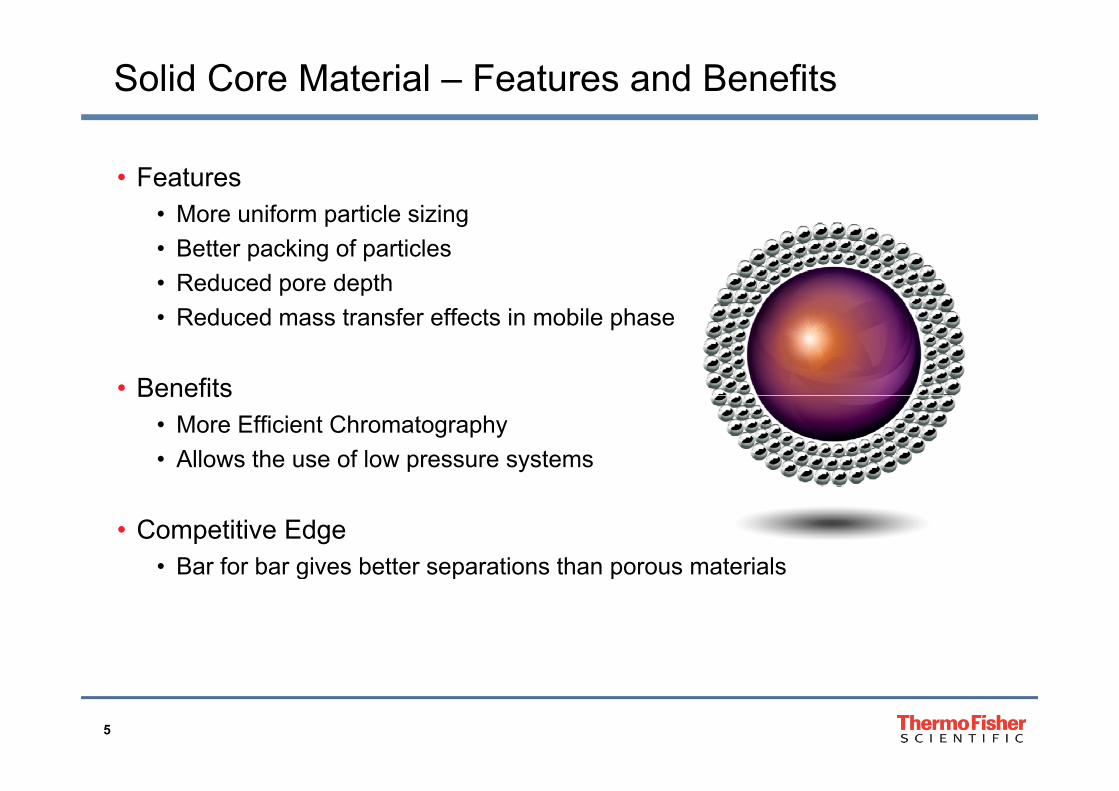
• Features• More uniform particle sizing• More uniform particle sizing• Better packing of particles• Reduced pore depth• Reduced mass transfer effects in mobile phase
• BenefitsBenefits• More Efficient Chromatography• Allows the use of low pressure systems
• Competitive Edge• Bar for bar gives better separations than porous materialsg p p
5

Liquid Chromatography Particle Design
2.6 µm80 Å
Solid Core Particles
80 Å
2.6 µm150 Å
Conventional Fully Porous Non-Porous Solid Core
4 µm80 Å
1.x µm80 Å
Reduce Size to improve kinetics at expense of
operating pressure
Low sample capacity
Very high pressure
Small particle kinetics
Reasonable pressureVery High Sample Capacity
Lower Efficiency
Low Sample Capacity
Very High Efficiency
High Sample Capacity
High Efficiency
6
operating pressurey y g y g y

Pressure Comparison
900
1000 BAP 200
2 11
600
700
800
900
600 bar limit
pp ddL 30
230
400
500
600
ress
ure
(bar
)
HPLC pressure limit
100
200
300Pr
u = 8 7mm/s0
0 200 400 600 800 1000
Flow rate (µL/min)
Accucore RP MS 2 6µm <2µm 3µm 5µm
u = 8.7mm/s
Accucore RP-MS 2.6µm <2µm 3µm 5µm
Columns: 100 x 2.1 mmMobile phase: H2O / ACN (1:1)Temperature: 30 °C
Wide flow rate range with P < 600 bar
7
Temperature: 30 °C

The Theory … the van Deemter equation
CCBAHETP uCuCu
AHETP sm
8

A – Term Eddy Diffusion or Multiple Paths
Packing Efficiency D90/10~1.5
Porous Silica
Packing Efficiency D90/10~1.1Accucore
9
B – Term Longitudinal Diffusion
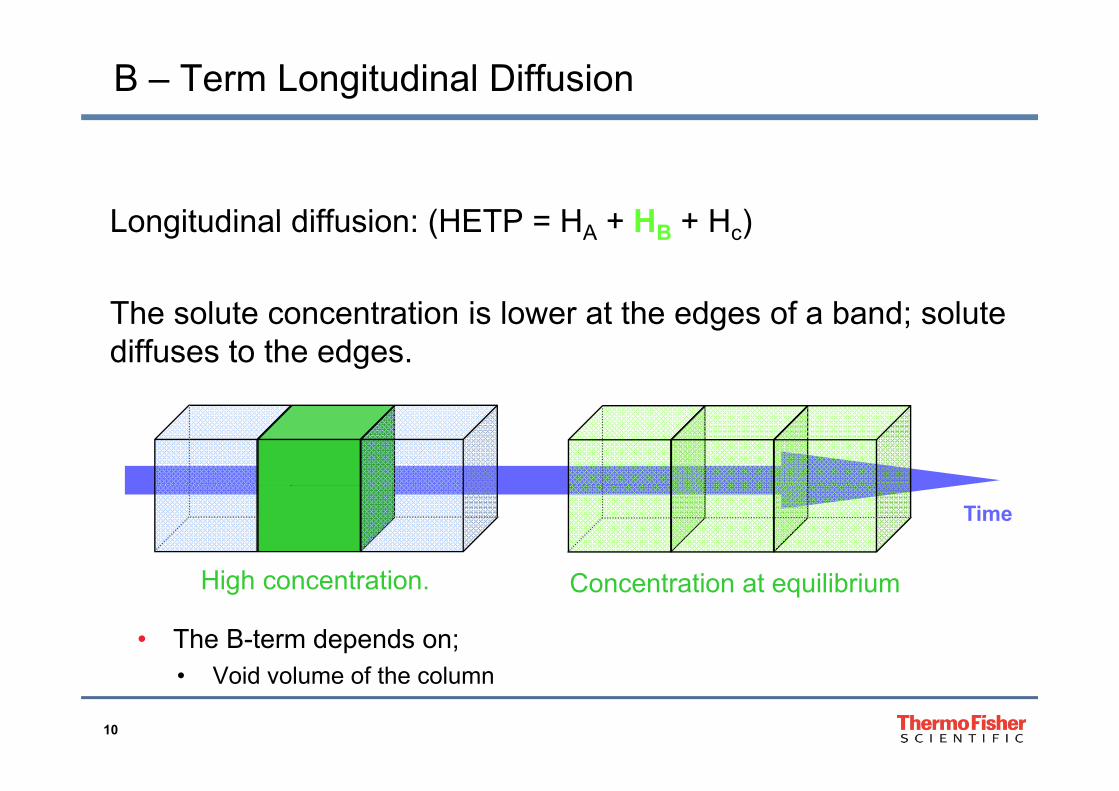
Longitudinal diffusion: (HETP = H + H + H )Longitudinal diffusion: (HETP = HA + HB + Hc)
Th l t t ti i l t th d f b d l tThe solute concentration is lower at the edges of a band; solute diffuses to the edges.
Time
High concentration C t ti t ilib iHigh concentration. Concentration at equilibrium
• The B-term depends on;
10
• Void volume of the column
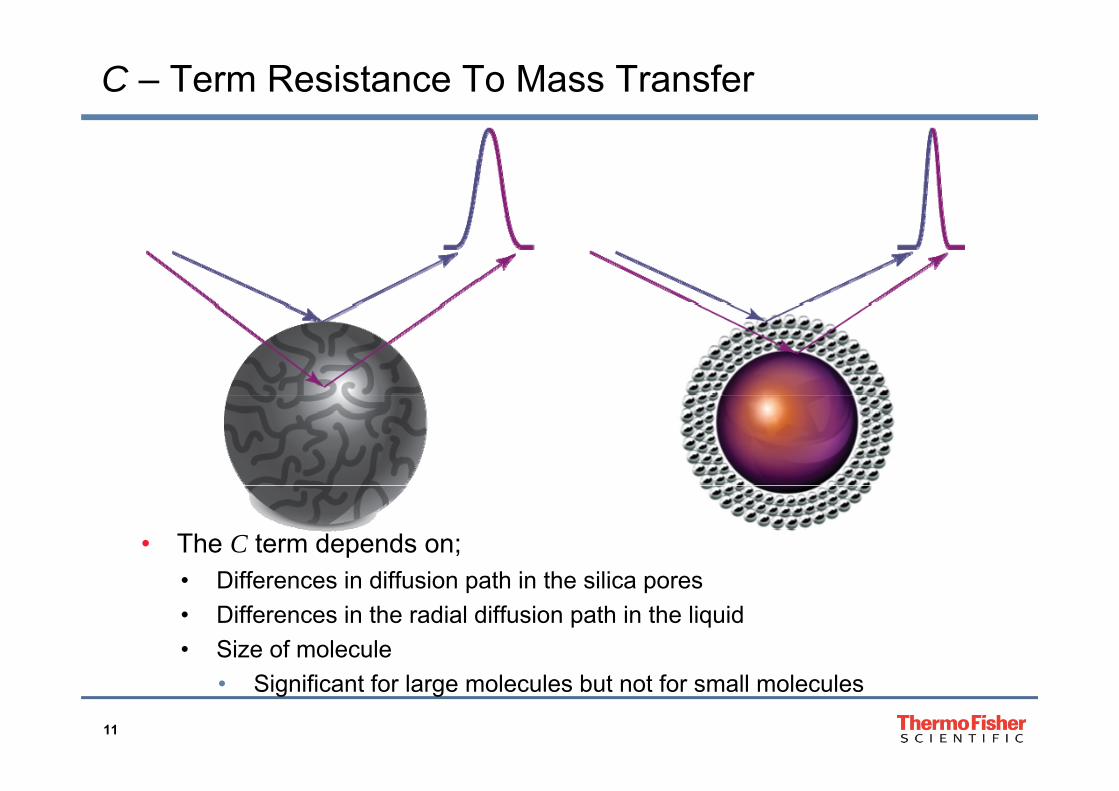
C – Term Resistance To Mass Transfer
• The C term depends on;Diff i diff i th i th ili• Differences in diffusion path in the silica pores
• Differences in the radial diffusion path in the liquid• Size of molecule
11
• Significant for large molecules but not for small molecules

Efficiency Comparison – Van Deemter20.0
tical
10 0
15.0
Theo
ret
5.0
10.0
uiva
lent
Pl
ates
0.00 0 1 0 2 0 3 0 4 0 5 0 6 0 7 0 8 0 9 0 10 0ei
ght E
q
0.0 1.0 2.0 3.0 4.0 5.0 6.0 7.0 8.0 9.0 10.0He
Linear velocity of mobile phase (mm/s)Accucore RP-MS 2.6µm 5µm 3µm <2µm
Columns: 100 x 2.1 mmMobile phase: H2O / ACN (1:1)Temperature: 30 °CDetection: UV at 254 nm Flow rate range: 0.1 to 1.0 mL/min
Highest efficiency and lowest rate of efficiency loss with flow
rate for solid core
12
Flow rate range: 0.1 to 1.0 mL/minAnalyte: o-xylene rate for solid core
Van Deemter – Limitations
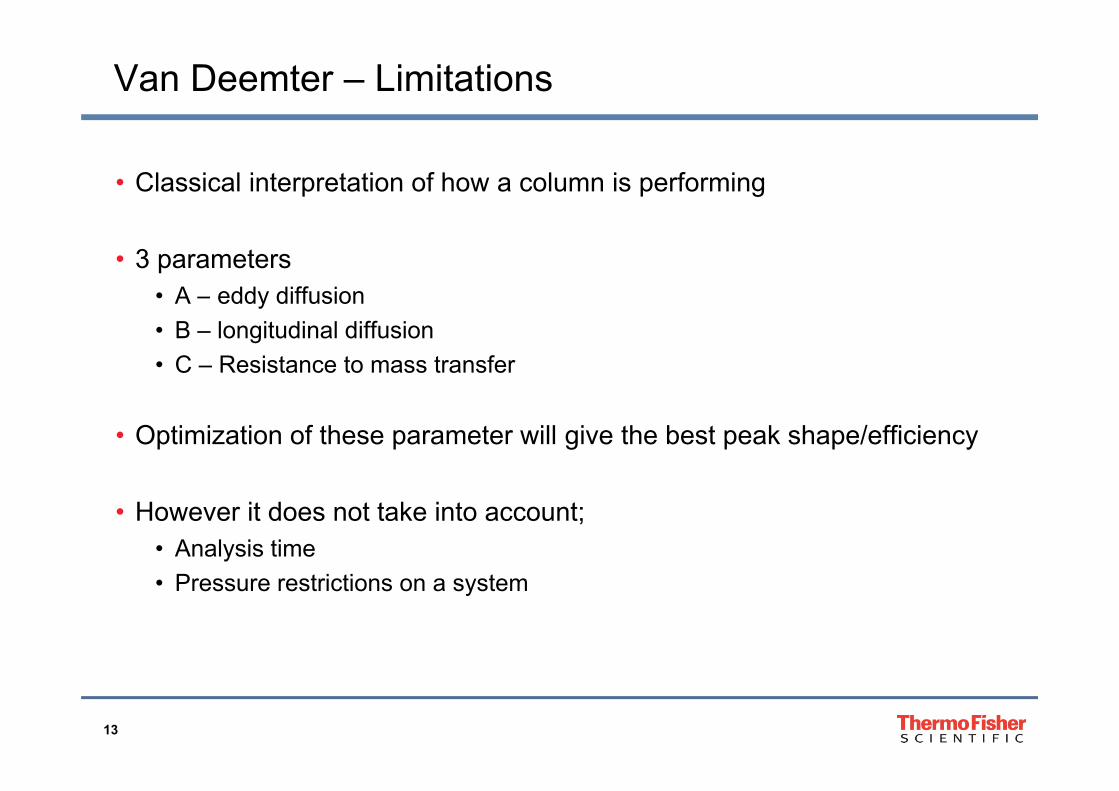
• Classical interpretation of how a column is performing
• 3 parameters• A – eddy diffusiony• B – longitudinal diffusion• C – Resistance to mass transfer
• Optimization of these parameter will give the best peak shape/efficiency
• However it does not take into account;• Analysis time
P t i ti t• Pressure restrictions on a system
13

Kinetic Plots
• Allows for fairer comparisons of analytical systems• Van Deemter just compares pure separation ability• Van Deemter just compares pure separation ability
• Incorporates time of analysisp y• Analysts want FASTER chromatography• Van Deemter plots do not specify the time of analysis
• Incorporates pressure limitations of systems• Van Deemter does not account for a pressure limitation p
on system
• Based on three very simple classical equations• Based on three very simple classical equations
14

Kinetic Plots – Retention Time1000010000
1000(s)
of p
eak
100
ion
time
Accucore allows optimisation of retention times
Ret
enti
Solid core produces sharper peaks in less time
101,000.00 10,000.00 100,000.00
Efficiency
p
15
Accucore RP-MS 2.6µm 5µm 3µm <2µm Efficiency

Impedance
• Devised by Knox and Bristow in 1977Defines the resistance a compound has to moving• Defines the resistance a compound has to moving down a column relative to the performance of that column
• Allows for pressure to be incorporated
Often plotted with a reverse axis• Often plotted with a reverse axis• Mimics van Deemter plot• Minimum value optimum conditions 2
PtE p
• Often plotted as a dimensional form2N
E• t/N2
• t0 or tr both used
16

100,000
Kinetic Plots – Impedance100,000
20
NPtE
ce
2N
10,000
mpe
dan
Im
S lid i lSolid core requires less pressure to obtain sub 2 µm
efficiencies
1,000100.001,000.0010,000.00100,000.001,000,000.00
Accucore RP-MS 2.6µm 5µm 3µm <2µm Efficiency
17
µ µ µ µ Efficiency
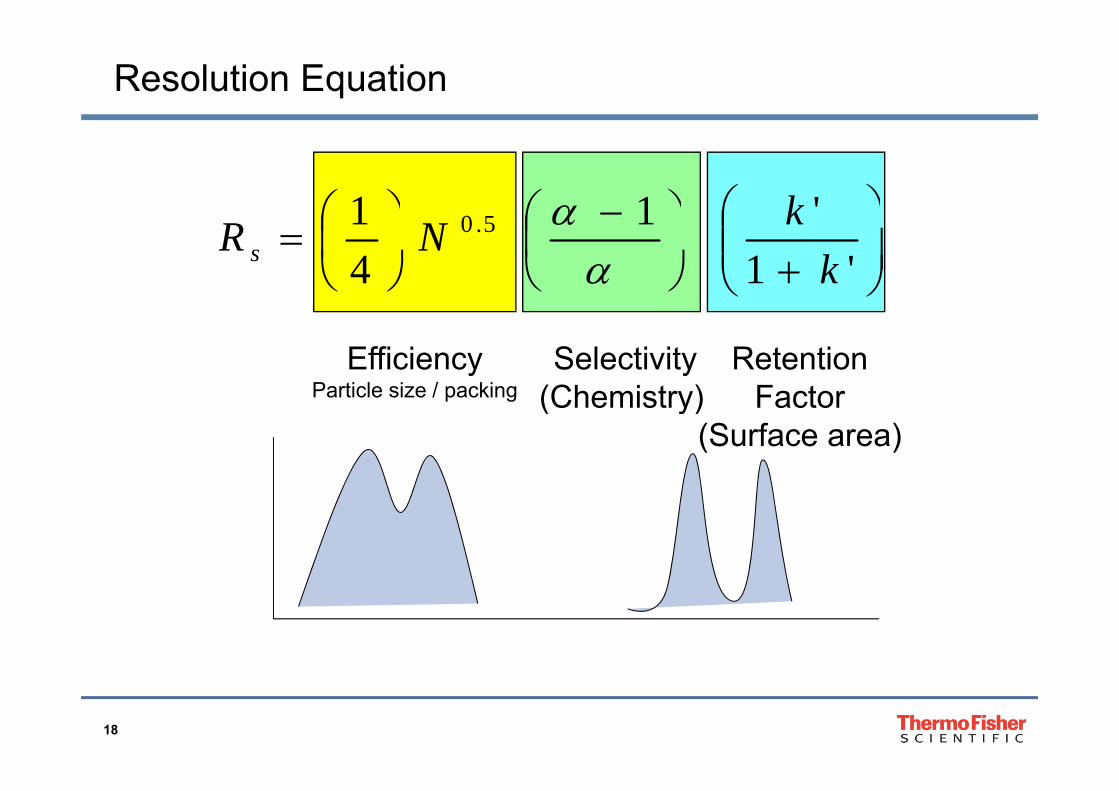
Resolution Equation
'11 50 k
'11
41 5.0
kkNR s
EfficiencyParticle size / packing
Selectivity(Chemistry)
RetentionFactorParticle size / packing (Chemistry) Factor
(Surface area)
18

The Impact of Selectivity on Resolution
Efficiency SelectivityRetentionEfficiency SelectivityRetention2 5
3.0
2 5
3.0
NR=k’
k’+1-14
NR=k’
k’+1k’
k’+1-1-14
2.0
2.5
(R) 2.0
2.5
(R)
k +1 4
k2
k +1k +1 4
k’221.5 N
solu
tion
(
1.5 N
solu
tion
(
=k2k’1
=k2
1 = 2
10.5
1.0kR
es
0.5
1.0kR
esSelectivity () has the greatest impact on 1.00 1.05 1.10 1.15 1.20 1.25
0.0 N
1.00 1.05 1.10 1.15 1.20 1.250.0
Nimproving resolution. 0 5000 10000 15000 20000 25000
0 5 10 15 20 25
Nk
0 5000 10000 15000 20000 25000
0 5 10 15 20 25
Nk
S19
Stationary phase, mobile phase, temperature

Stationary Phase Characterization
• Hydrophobic retention (HR)
Hydrophobic Interactions
y p ( )• k’ of neutral compound
• Hydrophobic selectivity (HS)• α two neutral compounds that have different log P
• Steric Selectivity (SS)• α sterically different moleculesα sterically different molecules
• Hydrogen bonding capacity (HBC)y g g y ( )• α molecule that hydrogen bonds and a reference• Good measure of degree of endcapping
20
• Gives indication of available surface area
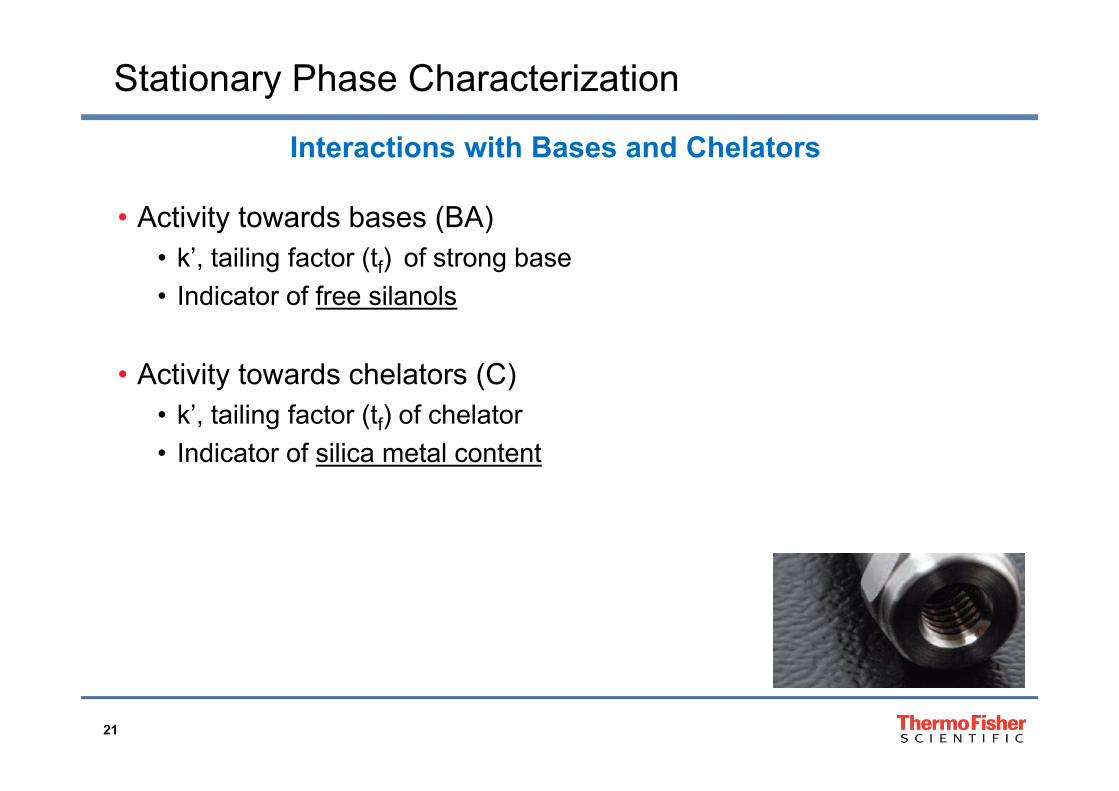
Stationary Phase Characterization
• Activity towards bases (BA)
Interactions with Bases and Chelators
• Activity towards bases (BA)• k’, tailing factor (tf) of strong base• Indicator of free silanols
• Activity towards chelators (C)• k’, tailing factor (tf) of chelator• Indicator of silica metal content
21

Stationary Phase Characterization
Interactions with Acids and Ion Exchanges
• Activity towards acids (AI)• k’, tf acid• Indicator of interactions with acidic compounds• Indicator of interactions with acidic compounds
• Ion Exchange Capacity (IEX pH 7.6)g p y ( p )• α base / reference compound• Indicator of total silanol activity
• All silanols above pKa
I E h C it (IEX H 2 7)• Ion Exchange Capacity (IEX pH 2.7)• α base / reference compound• Indicator of acidic silanol (SiO-) activity
22
• Indicator of acidic silanol (SiO ) activity

Column Characterization (Visualization)
HR /10
HSAI
Accucore C18HR /10
HSAI
Accucore RP-MS
SSIEX (2.7) SSIEX (2.7)
HBC
IEX (7.6)BA
C HBC
IEX (7.6)BA
C
HR /10
HSAI
Accucore PFPHR /10
HSAI
Accucore Phenyl-Hexyl
HS
SSIEX (2.7)
AI HS
SSIEX (2.7)
AI
HBC
IEX (7.6)BA
C HBC
IEX (7.6)BA
C
23

Widest Range of Solid Core Selectivity Options
500mAU 1,2,3 curcuminoids
2 00
2.50HR /10
HSAIAccucore RP-MS
Solid Core C18
0.50
1.00
1.50
2.00 HS
SSIEX (2.7)
AI Accucore C18
Accucore 150-C18
Accucore C8
Accucore 150-C4
Accucore Polar Premium1
0.00
HBCC
Accucore aQ
Accucore Polar Premium
Accucore Phenyl-Hexyl
Accucore PFP
23
Polar Premium shows different selectivity and separates the peaks
IEX (7.6)BA
Accucore Phenyl-X
Accucore C30
0.0 1.0 2.0 3.0
0
Minutes
24

Accucore Columns – Selectivity Choices
Columns: Thermo Scientific™ Accucore™ C30 ColumnAccucore C18 ColumnKi t C181
Different selectivity for K2 isomers
350 mAUAccucore C18
Kinetex C18Dimensions: 2.6 µm, 100 x 3.0 mmMobile Phases: Methanol:buffer, 98:2
Buffer = 2 mM ammonium acetate
1
250
300 2+2’
Flow: 650 µL/minTemperature: 20 ºCInjection: 5 µLDetector: UV 250 nm
2+2’
Ki t C18
200
250
Detector: UV 250 nmPeaks: 1. Vitamin K2, 50 µg/mL
2. Vitamin K1, 50 µg/mLOther peaks formed by UV irradiation1 C30 shows better
separation for K1
Kinetex C18
100
150
2
2’
separation for K1 isomers
Accucore C3050
0
Vitamin K2 Vitamin K10.00 1.25 2.50 3.75 5.00 6.25 8.00-25
min
25

Very Fast Separations with Superb Resolution
• Separation of atorvastatini t di t (ATC AT1
Fully porous C185 μm, 250 x 4.6 mm
intermediates (ATC-AT1 with ATC-AT1-Difluro)
• All customer requirements 60 min• All customer requirements were met
• Reduction of run time from 60 min to
60 min
8 min• Resolution improved using the
Accucore PFP columnAccucore PFP
2.6 μm, 150 x 3.0 mm 8 min• Mobile phase constituents kept
similar
• HPLC compatible method (270 bar)
26

Available Databases for Column Characterisation
http://www.usp.org/app/USPNF/columnsDB.html
27
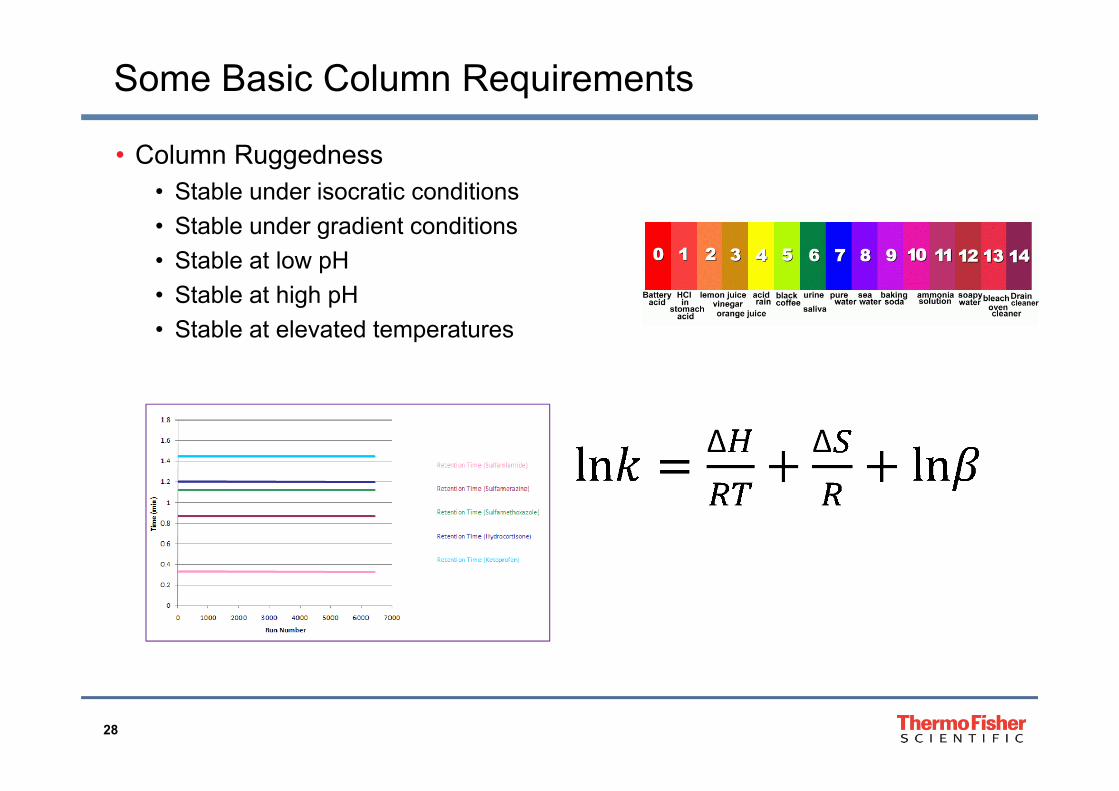
Some Basic Column Requirements
• Column Ruggedness• Stable under isocratic conditions• Stable under gradient conditions• Stable at low pH• Stable at high pHg p• Stable at elevated temperatures
28

Solid Core Column Stability – Ruggedness
Accucore RP-MS 2.6 µm 100 x 2.1 mm IDMobile Phase: 60/40 ACN/H2OFlow Rate: 400 µL/min
Accucore RP-MS 2.6 µm 100 x 2.1 mm IDMobile Phase A: Water (0.05% TFA)Mobile Phase B: Acetonitrile (0.05% TFA)W h H O (0 05% TFA)Injection Volume: 1 µL
Column Temp: 30 °CWash: H2O (0.05% TFA)Injection Volume: 1 µLColumn Temperature: 30 °C
Efficiency (o-Xylene)
Asymmetry (o-Xylene)Asymmetry (o Xylene)
4 000 + isocratic test 6 000 f t di t4,000 + isocratic test injections with no decrease in performance
6,000 + fast gradient injections with no change in retention
29

Solid Core Column Stability – Low pH
40
Column Stability at pH < 2 pH 1.8(0.1% TFA)
30
35
30,000 l
20
25
tion
Fact
or Acetaminophenp-HBAo-HBA
column volumes(5.5 days)
10
15Ret
ent
AmitriptylineNortriptylineDIPPDNPP
(5 5 y )
5
00 5000 10000 15000 20000 25000 30000 35000
Column Volumes
Solid core columns are stable at low pH
30
Solid core columns are stable at low pH

Solid Core Column Stability – High pH
pH 10.5(0.1% ammonia)
30,000 columnr column volumes(5.5 days)nt
ion
Fact
orR
eten
S lid l t bl t hi h H31
Solid core columns are stable at high pH

Solid Core Column Stability – Elevated Temperature
8
9
Column Stability at 70°C Mobile phase: MeOH/H2O (65:35)
Flow rate: 0.4 mL/min
6
7
8
r
Column temperature: 70 °C
Column: Accucore C18 50 x 2.1 mm
Run time: 5 min
4
5
6
entio
n Fa
ctor
Phenol
Butylbenzene
Run time: 5 min
2
3Ret
e o-Terphenyl
Pentylbenzene
0
1
0 2000 4000 6000 8000 10000
9,000 column volumes
(400 i j ti )0 2000 4000 6000 8000 10000
Column Volumes(400 injections)
Solid core columns are stable at high temperature
32
Solid core columns are stable at high temperature
Work Flow Solutions – Generic Methods
• Used where sample throughput is critical• Compound management• Discovery DMPK• Ability to run at high flow rates without compromising chromatographyAbility to run at high flow rates without compromising chromatography
• Require robust methods• Assays cannot afford to fall over• Many samples means long column lifetime• For bioanalytical samples need columns that are robust with plasma extractsFor bioanalytical samples need columns that are robust with plasma extracts
• Require orthogonal chemistries• Reversed phase / HILIC etc.
33

Faster than 5 and 3 µmFully porous 5 µm, 150 x 4.6 mm
Rs = 2.64
5 µL injection
∆P = 59 bar
Gradient and flow rate:• Fully porous 5 μm 150 x 4.6 mm
35–60 %B in 10.0 min1000 µL/min solvent used 17 mL1µL injection ∆P 23 b 1000 µL/min solvent used 17 mL
•Fully porous 5 μm, 100 x 2.1 mm 35–60 %B in 6.7 min210 µL/min solvent used 2.4 mL
F ll 3 100 2 1
Fully porous 5 µm,100 x 2.1 mm
Rs = 1.641µL injection ∆P = 23 bar
• Fully porous 3 μm, 100 x 2.1 mm 35–60%B in 4.0 min350 µL/min solvent used 2.4 mL
• Accucore RP-MS 2.6 μm, 100 x 2.1 mm Fully porous 3 µm, 100 x 2.1 mm
Rs =1.96 1µL injection ∆P = 97 bar
35–60 %B in 3.5 min400 µL/min solvent used 2.4 mL
ACCUCORE 2.6 µm, 100 x 2.1 mm
Rs = 2.50 1µL injection ∆P = 218 bar
Reduced analysis time and solvent costs
Minutes0 1 2 3 4 5 6 7 8 9 10
-100100 x 2.1 mm
34
Reduced analysis time and solvent costs

Shorter Columns – Faster Separations
ACCUCORE 2.6 µm, 100 x 2.1 mm Gradient and flow rate:
• Accucore RP-MS 2.6 μm, 100 x 2.1 mm
Rs = 2.50
35 –60%B in 3.5 min400 µL/min
• Accucore RP-MS 2.6μm, 50 x 2.1 mm 35–60%B in 1.8 min
mA
U
400 µL/min
Rs = 1.51
ACCUCORE 2.6 µm, 50 x 2.1 mm
Double productivity with 50 mm column
Minutes0.0 1.0 2.0 3.0 4.0
35
Double productivity with 50 mm column

Example of a HILIC Separation
Column: Accucore HILIC 2.6 μm, 150 x 3.0 mm
Flow: 0.5 mL/min
B k 290 b
Separation of decitabineand α anomer impurity
Backpressure: 290 bar
Temperature: 40 °C
Injection: 5 µL and α-anomer impurityj µ
Detection: UV @ 244 nm
Mobile phase: 5% A (20 mMammonium acetate)ammonium acetate)95% B (acetonitrile)
36

Regulatory DMPK – Bioanalysis
• Methods can be optimized• Possibilities to optimize stationary phase chemistries• Possibilities to optimize stationary phase chemistries• Analysis times still important for PK studies
• Methods will tend to form final clinical method• Sensitivity can be an issue due to efficacious nature of drug
• Injections with plasma• Injections with plasma• Columns must not block
• Can result in peak splitting• Can result in columns overpressurising• Can result in retention time shift
• Metabolism studies• Need columns with high resolution
37
• Ideally limited sample prep, so columns stable with diluted urine

Lower Pressure than Sub 2m
• Flow rate: 500 μL/min• Mobile phase: A Water; B Acetonitrile
Sub 2 µm, 100 x 2.1 mm
• Mobile phase: A–Water; B–Acetonitrile
Accucore RP-MS 2.6 µm, 100 x 2.1 mm
Accucore RP-MS 2.6 µm, 100 x 2.1 mm
Sub 2 µm, 100 x 2.1mm
Maximum pressure (bar)
171 338
Minutes0.0 0.5 1.0 1.5 2.0 2.5
Equivalent performance, lower pressure
38
(50% lower)
Accucore with TLX – Method Conditions
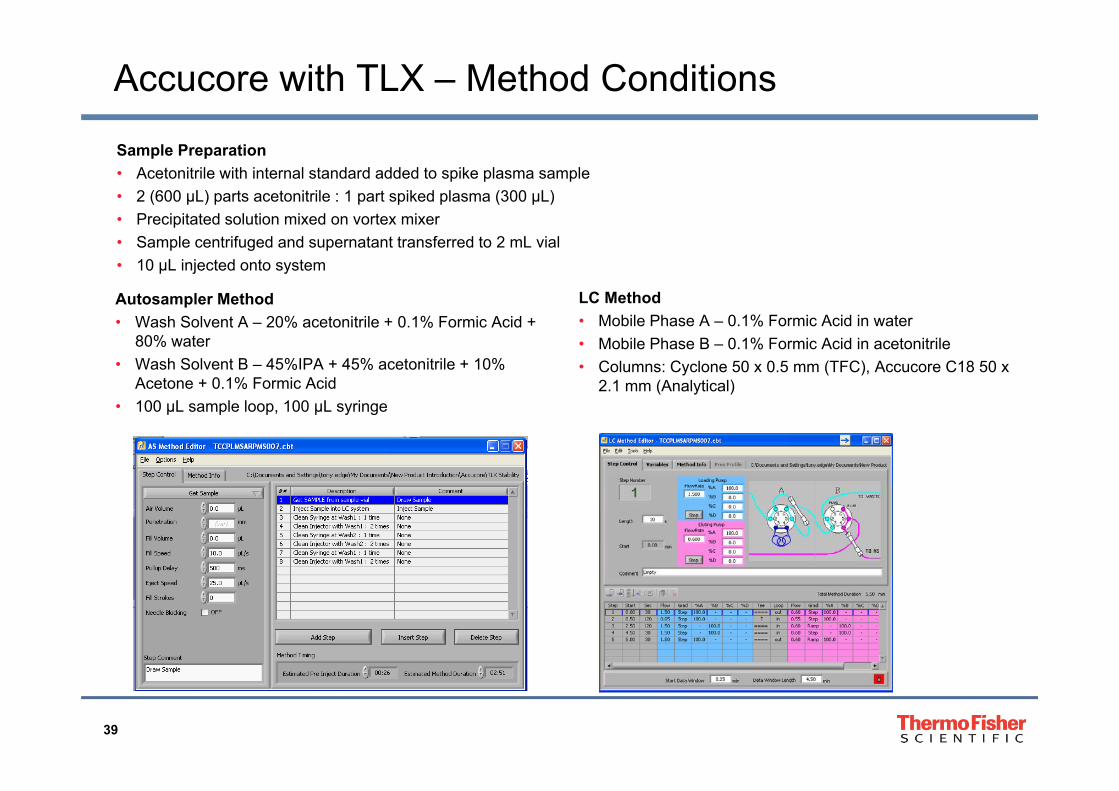
Sample Preparation• Acetonitrile with internal standard added to spike plasma sample• 2 (600 μL) parts acetonitrile : 1 part spiked plasma (300 μL)
Precipitated sol tion mi ed on orte mi er
Autosampler Method LC Method
• Precipitated solution mixed on vortex mixer• Sample centrifuged and supernatant transferred to 2 mL vial• 10 μL injected onto system
p• Wash Solvent A – 20% acetonitrile + 0.1% Formic Acid +
80% water• Wash Solvent B – 45%IPA + 45% acetonitrile + 10%
Acetone + 0.1% Formic Acid
• Mobile Phase A – 0.1% Formic Acid in water• Mobile Phase B – 0.1% Formic Acid in acetonitrile• Columns: Cyclone 50 x 0.5 mm (TFC), Accucore C18 50 x
2.1 mm (Analytical)• 100 μL sample loop, 100 μL syringe
39

Accucore with TLX – Retention Stability
4.4000
Rosuvastatin Retention
4.1000
4.2000
4.3000
3.9000
4.0000
Min
utes
3 6000
3.7000
3.8000
3.5000
3.6000
0 500 1000 1500 2000 2500Injection
~2,400 injections on Accucore column with TLX system – no change in retention
40
y g

Accucore with TLX – Backpressure Stability
140 Backpressure Plots
100
120
60
80
Bar
Linear (Loading Pump Pressure at t=0) Linear (Eluting Pump Pressure at t=0)
20
40
00 500 1000 1500 2000 2500
Injection
~ 2,400 injections on Accucore column with TLX system – no increase in t=0 backpressure
41
y p

Accucore with TLX–Pressure Traces
300Backpressure Traces
250
150
200
Bar
100
Injection 2 Elute
Injection 500 Elute
Injection 2395 Elute
500 50 100 150 200 250 300 350
Seconds
~ 2,400 injections on Accucore column with TLX system – backpressure traces
42
y p
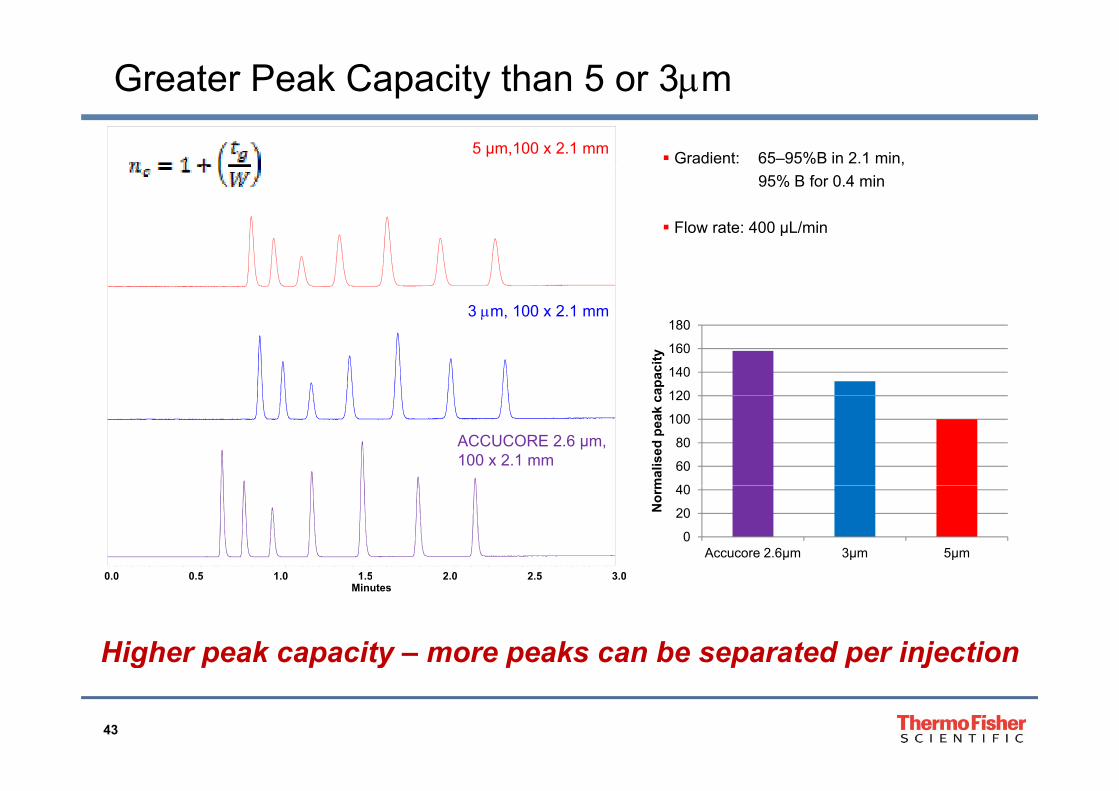
Greater Peak Capacity than 5 or 3m
220
2405 µm,100 x 2.1 mm Gradient: 65–95%B in 2.1 min,
95% B for 0.4 min
3 100 2 1
Flow rate: 400 μL/min
3 m, 100 x 2.1 mm
120
140
160
180
capa
city
ACCUCORE 2.6 µm, 100 x 2.1 mm
40
60
80
100
120
mal
ised
pea
k c
0 0 0 5 1 0 1 5 2 0 2 5 3 0
0
20
40
Accucore 2.6µm 3µm 5µm
Nor
m
Minutes0.0 0.5 1.0 1.5 2.0 2.5 3.0
Higher peak capacity – more peaks can be separated per injection
43
g p p y p p p j

More Sensitive than Fully Porous 5 and 3m
Gradient and flow rate:• 5 μm, 100 x 2.1 mm
35–60 %B in 6 7 min
S/N = 169 5m, 100 x 2.1 mm
35–60 %B in 6.7 min210 μL/min
• 3μm, 100 x 2.1 mm 35–60 %B in 4.0 min350 μL/min
S/N = 368
350 μL/min•Accucore RP-MS 2.6μm, 100 x 2.1 mm
35–60 %B in 3.5 min400 μL/min
mA
U
S/N = 399
3m, 100 x 2.1 mm
S/N = 399
0.00 1.00 2.00 3.00 4.00 5.00 6.00 7.00 8.00
ACCUCORE 2.6m, 100x2.1mm
Higher S/N ratios – detection and quantification of low level impurities
Minutes
44
of low level impurities
Production - Quality Control Workflows
• Robust methods• Loading capacity can be an issue as looking for impurities• Loading capacity can be an issue as looking for impurities• Selectivity important• Resolution also important
• Need to be able to transfer the methods to CRO’s• Need to be aware of differences caused by different instrumentation• Need to be aware of differences caused by different instrumentation
45

Loading Capacity
Columns:
• Accucore RP-MS 2.6 μm,100 x 2.1 mm
• <2 μm,100 x 2.1 mm2,500,000
1 2
Effect of Loading - Accucore
R² = 0.9998
R² = 0.99932,000,000
0.8
1
1.2
d Va
lue
A
R² = 0.9721
1,000,000
1,500,000
eak
area
0.2
0.4
0.6
Nor
mal
ise As
N
Tr
As
NTr500,000
Pe
00 5 10 15 20 25
Load on Column (µg)
00 0.5 1 1.5 2 2.5
Load on column (µg)<2µm Accucore 2 6μm Competitor
No loss in performance with 2 μg loaded on a
<2µm Accucore 2.6μm Competitor
46
2.1 mm ID Solid core column

Method Transfer and Optimisation
5 μm, 150 x 4.6 mmMethod Transfer Calculator:
www.thermoscientific.com/crcRs = 2.645 µL injection
Gradient and flow rate:• 5 μm, 150 x 4.6 mm
35 60 %B in 10 0 minRs = 2 50 35–60 %B in 10.0 min1000 μL/min
• Accucore RP-MS 2.6 μm, 100 x 2.1 mm 35–60 %B in 3.5 min
Rs = 2.50
400 μL/min• Accucore RP-MS 2.6 μm, 50 x 2.1 mm
35–60 %B in 1.8 minutes400 μL/min
ACCUCORE 2.6 μm, 100 x 2.1 mm
Rs = 1.51
1µL injection
400 μL/min
ACCUCORE 2.6 μm, 50 2 11µL injection
Minutes0 1 2 3 4 5 6 7 8 9 10
050 x 2.1 mm
Scalable from fully porous 5 μm columns
µ j
47
Scalable from fully porous 5 μm columns

System Considerations• Column: Accucore RP-MS 2.6 μm, 100 x 2.1 mm
• Gradient: 65–95 % B in 2.1 min
Dwell volume: 100 µL
95 % B for 0.4 min
• Flow rate: 400 µL/minAccela 1250
Dwell volume: 800 L
Surveyor Accela Surveyor Agilent
800 µL
Minutes0.00 1.00 2.00 3.00 4.00
Accela1250
Surveyor Agilent 1100
Run time (min)
2.5 3.0 3.5Dwell volume: 1000 µL
min0 0 5 1 1 5 2 2 5 3 3 5
Agilent 1100 AveragePW (1/2 Height)
0.02 0.02 0.04
min0 0.5 1 1.5 2 2.5 3 3.5
Solid core can deliver performance on a b f diff t t
48
number of different systems
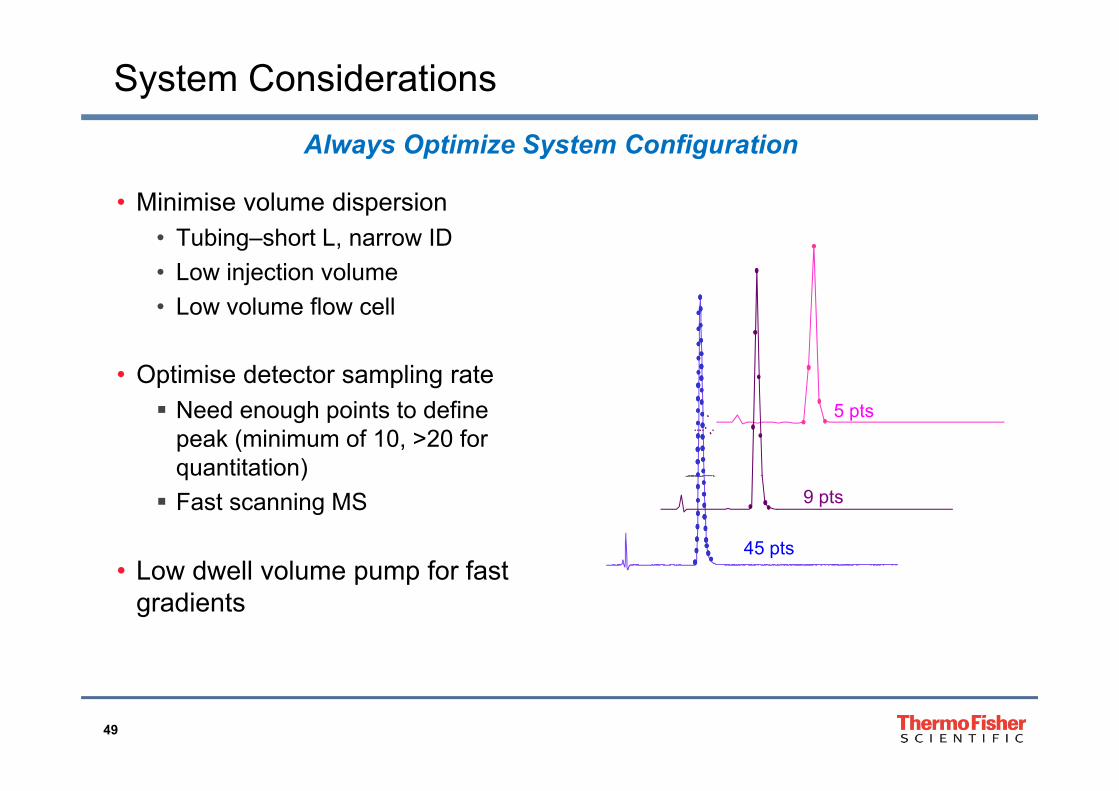
System Considerations
• Minimise volume dispersion
Always Optimize System Configuration
• Tubing–short L, narrow ID• Low injection volume• Low volume flow cell• Low volume flow cell
• Optimise detector sampling rate Need enough points to define
peak (minimum of 10, >20 for quantitation)
5 pts
Fast scanning MS
• Low dwell volume pump for fast45 pts
9 pts
Low dwell volume pump for fast gradients
49
Analyzing Biomolecules
• Move to produce bigger molecules• Difficult to copy• Difficult to copy• Greater success rates
• Chromatography requirements• Need less retentive phase• Need wide pores to cope with larger molecules• Need wide pores to cope with larger molecules
50
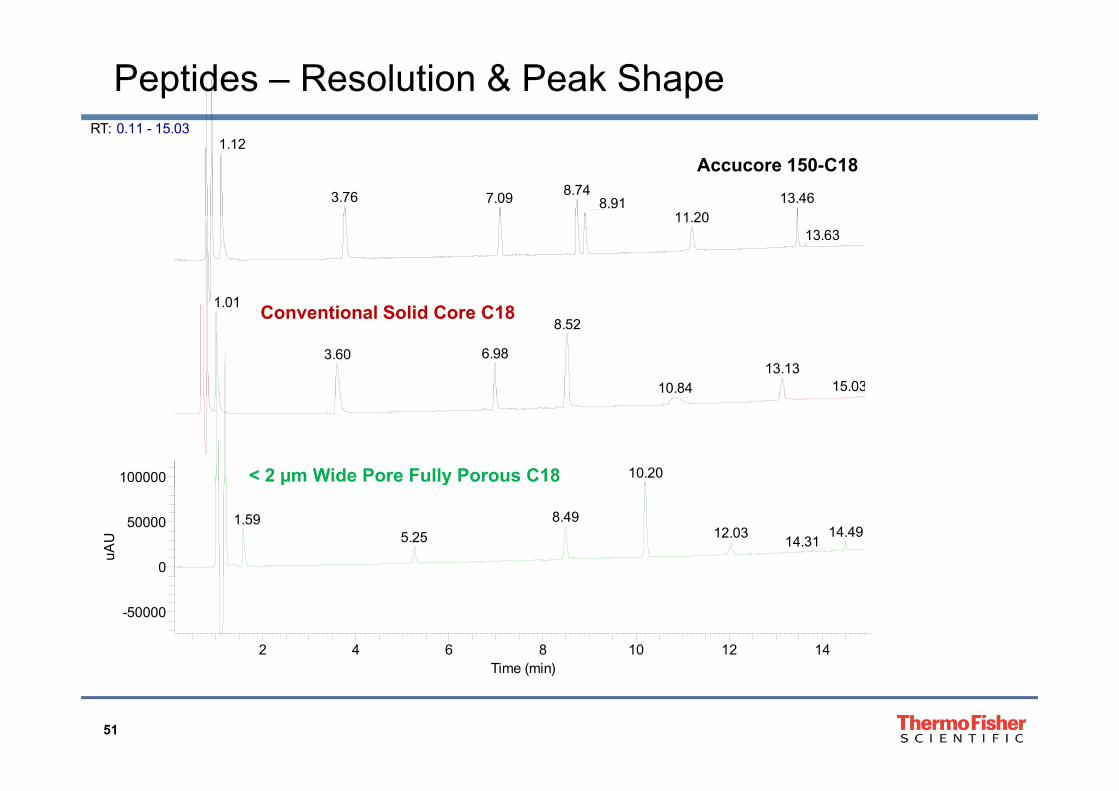
Peptides – Resolution & Peak ShapeRT: 0 11 15 03RT: 0.11 - 15.03
1.12
8.743.76 7.09 13.468.9111 20
Accucore 150-C18
11.2013.63
1.01 C ti l S lid C C181.018.52
6.983.6013.13
15.0310.84
Conventional Solid Core C18
100000 10.20< 2 µm Wide Pore Fully Porous C18
0
50000
uAU
8.491.5914.4912.035.25 14.31
y
2 4 6 8 10 12 14Ti ( i )
-50000
51
Time (min)
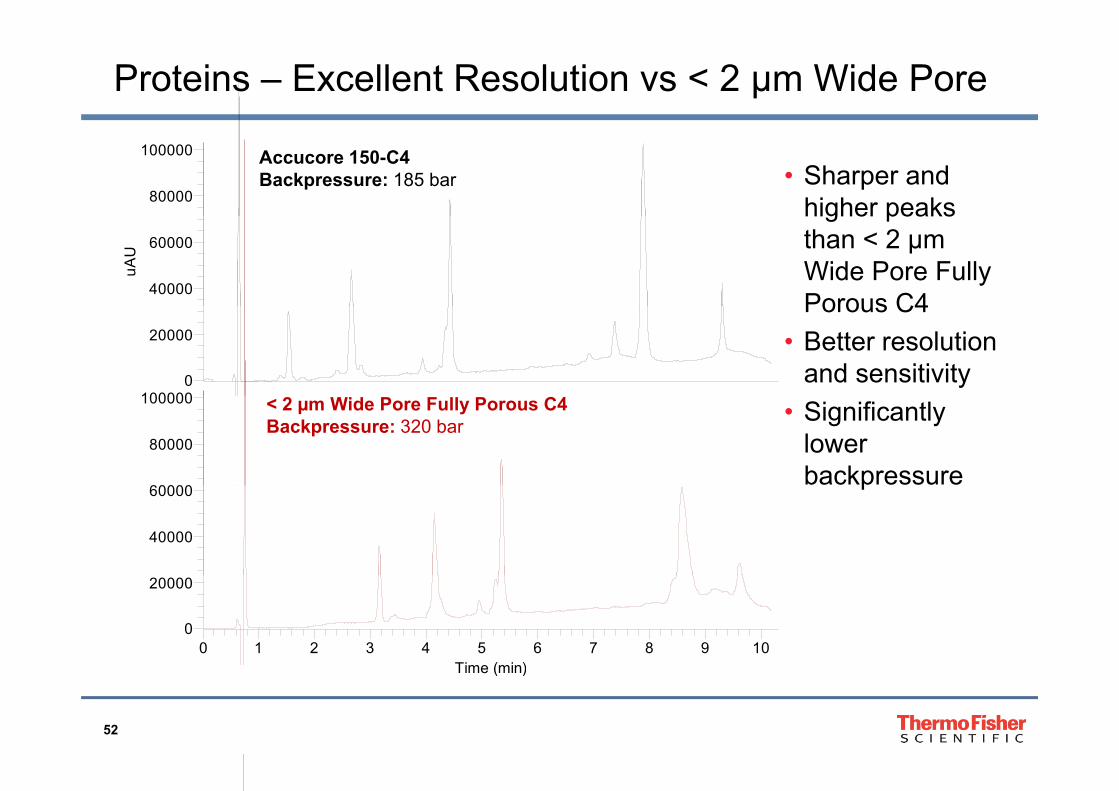
Proteins – Excellent Resolution vs < 2 µm Wide Pore
• Sharper and higher peaks80000
100000 Accucore 150-C4Backpressure: 185 bar
higher peaks than < 2 µm Wide Pore Fully Porous C4
40000
60000
uAU
Porous C4• Better resolution
and sensitivity100000
0
20000
• Significantly lower backpressure
60000
80000
100000 < 2 µm Wide Pore Fully Porous C4Backpressure: 320 bar
p
40000
60000
0 1 2 3 4 5 6 7 8 9 10Ti ( i )
0
20000
52
Time (min)
Conclusions
• The Pharmaceutical Process• Mapping out different sectors
Wh t t f h ll f d• What types of challenges are faced• Understanding the drivers in the pharmaceutical industry
• Solid Core Chromatography• Understanding the benefits of the technology• Bar for bar greater efficiency• Bar for bar greater efficiency• How to optimize the separation
• Understanding chemistry• Optimization of the morphology
• Coupling Solid Core Chromatography to Pharmaceutical Analysis• Coupling Solid Core Chromatography to Pharmaceutical Analysis• Design of new workflows• Improving column lifetimes
53
• Improving assay robustness