use of molecular modeling, docking, and 3d-qsar studies for the determination of the binding mode of...
TRANSCRIPT

ORIGINAL PAPER
Use of molecular modeling, docking, and 3D-QSARstudies for the determination of the binding modeof benzofuran-3-yl-(indol-3-yl)maleimidesas GSK-3β inhibitors
Ki Hwan Kim & Irina Gaisina & Franck Gallier &
Denise Holzle & Sylvie Y. Blond & Andrew Mesecar &
Alan P. Kozikowski
Received: 30 October 2008 /Accepted: 16 April 2009 /Published online: 14 May 2009# Springer-Verlag 2009
Abstract Molecular modeling and docking studies alongwith three-dimensional quantitative structure relationships(3D-QSAR) studies have been used to determine the correctbinding mode of glycogen synthase kinase 3β (GSK-3β)inhibitors. The approaches of comparative molecular fieldanalysis (CoMFA) and comparative molecular similarityindex analysis (CoMSIA) are used for the 3D-QSAR of 51substituted benzofuran-3-yl-(indol-3-yl)maleimides as GSK-3β inhibitors. Two binding modes of the inhibitors to thebinding site of GSK-3β are investigated. The binding mode1 yielded better 3D-QSAR correlations using both CoMFAand CoMSIA methodologies. The three-component CoMFAmodel from the steric and electrostatic fields for the
experimentally determined pIC50 values has the followingstatistics: R2(cv)=0.386 nd SE(cv)=0.854 for the cross-validation, and R2=0.811 and SE=0.474 for the fittedcorrelation. F (3,47)=67.034, and probability of R2=0(3,47)=0.000. The binding mode suggested by the resultsof this study is consistent with the preliminary results of X-ray crystal structures of inhibitor-bound GSK-3β. The 3D-QSAR models were used for the estimation of the inhibitorypotency of two additional compounds.
Keywords Benzofuran-3-yl-(indol-3-yl)maleimides .
Binding mode . CoMFA . CoMSIA . Docking .
GSK-3beta inhibitors . 3D-QSAR . X-ray
Introduction
Originally identified as a modulator of glycogen metabo-lism about 20 years ago, glycogen synthase kinase 3β(GSK-3β) is now found to be a Ser/Thr protein kinase withkey roles in transduction of regulatory role in a variety ofpathways. These include the initiation of protein synthesis,cell proliferation, cell differentiation, and apoptosis. Thiskinase is also essential for embryonic development [1–4].In humans, two genes are present that encode the relatedGSK-3 isoforms GSK-3α and GSK-3β, which exhibitapproximately 98% sequence identity within their catalyticdomains.
J Mol Model (2009) 15:1463–1479DOI 10.1007/s00894-009-0498-x
K. H. Kim (*) : I. Gaisina : F. Gallier :A. P. KozikowskiDrug Discovery Program, Department of Medicinal Chemistryand Pharmacognosy, College of Pharmacy,University of Illinois at Chicago,833 S. Wood St.,Chicago, IL 60612, USAe-mail: [email protected]
D. Holzle : S. Y. Blond :A. MesecarThe Center for Pharmaceutical Biotechnology,Department of Medicinal Chemistry andPharmacognosy, College of Pharmacy,University of Illinois at Chicago,900 South Ashland,Chicago, IL 60607, USA
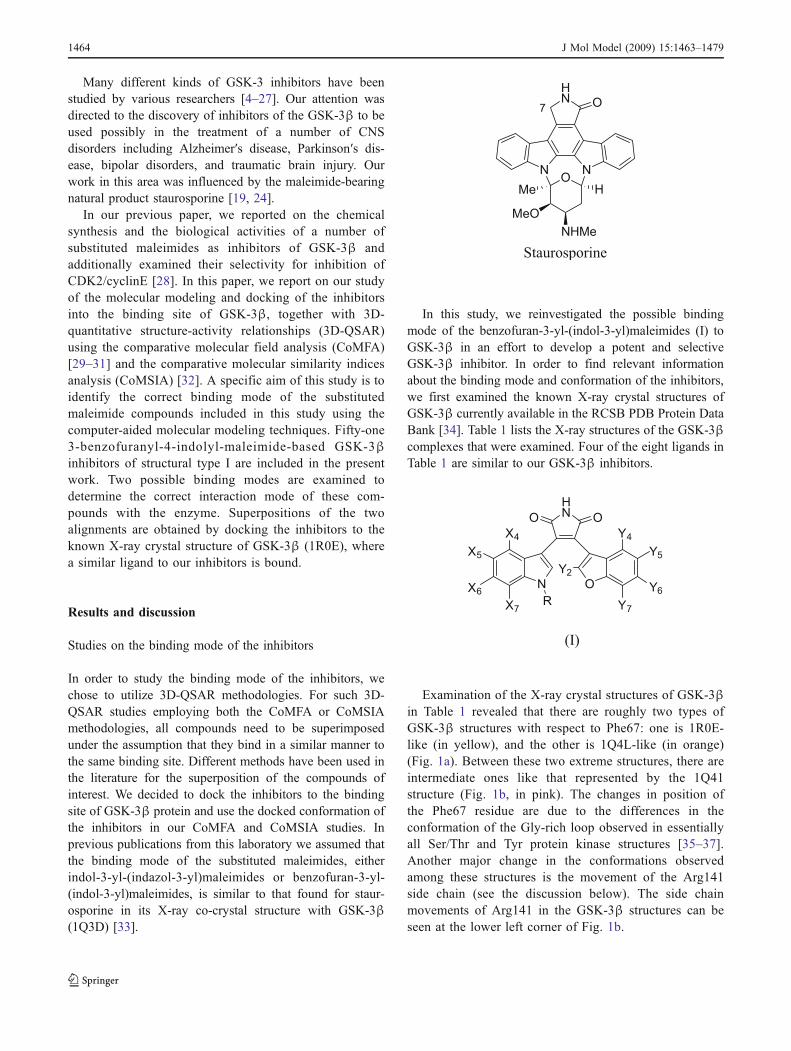
Many different kinds of GSK-3 inhibitors have beenstudied by various researchers [4–27]. Our attention wasdirected to the discovery of inhibitors of the GSK-3β to beused possibly in the treatment of a number of CNSdisorders including Alzheimer′s disease, Parkinson′s dis-ease, bipolar disorders, and traumatic brain injury. Ourwork in this area was influenced by the maleimide-bearingnatural product staurosporine [19, 24].
In our previous paper, we reported on the chemicalsynthesis and the biological activities of a number ofsubstituted maleimides as inhibitors of GSK-3β andadditionally examined their selectivity for inhibition ofCDK2/cyclinE [28]. In this paper, we report on our studyof the molecular modeling and docking of the inhibitorsinto the binding site of GSK-3β, together with 3D-quantitative structure-activity relationships (3D-QSAR)using the comparative molecular field analysis (CoMFA)[29–31] and the comparative molecular similarity indicesanalysis (CoMSIA) [32]. A specific aim of this study is toidentify the correct binding mode of the substitutedmaleimide compounds included in this study using thecomputer-aided molecular modeling techniques. Fifty-one3-benzofuranyl-4-indolyl-maleimide-based GSK-3βinhibitors of structural type I are included in the presentwork. Two possible binding modes are examined todetermine the correct interaction mode of these com-pounds with the enzyme. Superpositions of the twoalignments are obtained by docking the inhibitors to theknown X-ray crystal structure of GSK-3β (1R0E), wherea similar ligand to our inhibitors is bound.
Results and discussion
Studies on the binding mode of the inhibitors
In order to study the binding mode of the inhibitors, wechose to utilize 3D-QSAR methodologies. For such 3D-QSAR studies employing both the CoMFA or CoMSIAmethodologies, all compounds need to be superimposedunder the assumption that they bind in a similar manner tothe same binding site. Different methods have been used inthe literature for the superposition of the compounds ofinterest. We decided to dock the inhibitors to the bindingsite of GSK-3β protein and use the docked conformation ofthe inhibitors in our CoMFA and CoMSIA studies. Inprevious publications from this laboratory we assumed thatthe binding mode of the substituted maleimides, eitherindol-3-yl-(indazol-3-yl)maleimides or benzofuran-3-yl-(indol-3-yl)maleimides, is similar to that found for staur-osporine in its X-ray co-crystal structure with GSK-3β(1Q3D) [33].
HN
NNO
NHMe
MeO
Me
O
H
7
Staurosporine
In this study, we reinvestigated the possible bindingmode of the benzofuran-3-yl-(indol-3-yl)maleimides (I) toGSK-3β in an effort to develop a potent and selectiveGSK-3β inhibitor. In order to find relevant informationabout the binding mode and conformation of the inhibitors,we first examined the known X-ray crystal structures ofGSK-3β currently available in the RCSB PDB Protein DataBank [34]. Table 1 lists the X-ray structures of the GSK-3βcomplexes that were examined. Four of the eight ligands inTable 1 are similar to our GSK-3β inhibitors.
HN
O O
N O
R
X5
X6
X7
Y5
Y6
Y7
X4 Y4
Y2
(I)
Examination of the X-ray crystal structures of GSK-3βin Table 1 revealed that there are roughly two types ofGSK-3β structures with respect to Phe67: one is 1R0E-like (in yellow), and the other is 1Q4L-like (in orange)(Fig. 1a). Between these two extreme structures, there areintermediate ones like that represented by the 1Q41structure (Fig. 1b, in pink). The changes in position ofthe Phe67 residue are due to the differences in theconformation of the Gly-rich loop observed in essentiallyall Ser/Thr and Tyr protein kinase structures [35–37].Another major change in the conformations observedamong these structures is the movement of the Arg141side chain (see the discussion below). The side chainmovements of Arg141 in the GSK-3β structures can beseen at the lower left corner of Fig. 1b.
1464 J Mol Model (2009) 15:1463–1479

The binding mode of staurosporine, the compound thatthe design of our inhibitors was initially influenced by, isshown in Fig. 1c. The X-ray crystal structure shows that thebinding pose of the staurosporine is guided by the two
adjacent intermolecular hydrogen bonds of the pyrrolidin-2-one moiety. The NH group of the pyrrolidin-2-one ring ofstaurosporine forms a hydrogen bond to the backbonecarbonyl oxygen of Asp133, and the carbonyl oxygen of
Table 1 Known GSK-3β X-ray structures
HN
N
HN
OHHO
F
OO
HN
N
OO
N
N
Me2N
HN
NH
OO
HO2C
Cl
Cl
HN
NNO
NHMe
MeO
Me
O
H
(II) (III) (IV) (V)
NH
NH
O
O2N
NH
NH
S
N
O2N
O
OMe
HN
NH
N
BrHO
O
HN O
N
HN
Cl
Cl
OH
HNSO2Me
(VI) (VIII) (IX)
Group PDB Resolution R-value Bound Ligand Ref
A. 1R0E-like 1R0E 2.25 0.225 (II) [47]
2OW3 2.80 0.248 (III) [48]
1GNG 2.60 0.196 [49]
1O9U 2.40 0.233 [50]
B. 1Q4L-like 1Q4L 2.77 0.212 (IV) [51]
1H8F 2.80 0.220 [52]
1I09 2.70 0.242 [53]
1J1B 1.80 0.216 [54]
1J1C 2.10 0.218 [54]
1Q3D 2.20 0.230 (V: Staurosporine) [51]
1Q3W 2.30 0.225 (VI) [51]
1Q5K 1.94 0.222 (VII) [55]
1UV5 2.80 0.193 (VIII) [6]
1PYX 2.40 0.206 [51]
1Q41 2.10 0.229 [51]
2O5K 3.20 0.240 (IX) [23]
(VII)
J Mol Model (2009) 15:1463–1479 1465

the same ring forms a hydrogen bond to the backbone NHof Val135. Hydrophobic side chains of Leu132 and Lys85are present around the methylene group (carbon 7 indicatedin the staurosporine structure) of staurosporine. In addition,there are two water molecules connecting the carbonyloxygen of the pyrrolidin-2-one moiety and Glu97 nearby.The two indole rings of staurosporine are fixed by a phenylgroup connecting the two rings, and so do their bindingpositions.
Figure 1d shows the binding modes of II, III, and IV inTable 1. Compound III has two indole rings as doesstaurosporine, whereas II has only one indole ring, and IVhas an aminophenyl and a phenyl ring instead of the twoindole rings. The two indole rings in III are partiallyrigidified through macrocycle formation encompassing the
two indole rings. Even though the two indole rings aresemi-rigid, the binding conformations of the two indolerings of III are significantly different from that ofstaurosporine, and similar to those of II and IV.
Figure 1e shows the binding modes of II and IV. Theindole ring conformation of II is very similar to that ofIII as well as that of the aminophenyl ring of IV. Theconformation of the phenyl ring of II and IV is similar toone another.
Based on the X-ray structures of II, III, and IV, weproposed that the binding mode of benzofuran-3-yl-(indol-3-yl)maleimides (I) in Table 6 would be similar to those ofII, III, and IV. This is contrary to the binding modesuggested in the earlier publications for 3-indolyl-4-indazolylmaleimides or benzofuran-3-yl-(indol-3-yl)
Fig. 1 X-ray crystal structures of ligand-bound GSK-3β structureslisted in Table 1. (a) Approximately two groups of GSK-3β structuresare shown with respect to the residue Phe67: one is 1R0E-like(yellow), and the other is 1Q4L-like (orange). The two groups ofPhe67 positions of GSK-3β structures are illustrated by the twodifferent positions of the phenyl ring shown in the ball-and-stickmodel in Fig. 1a (labeled 1 and 2 in Fig. 1b). (b) Between the twoextreme structures shown in (a), there are intermediate onesrepresented by 1Q41 in pink (labeled 3 in Fig. 1b). The phenyl ring
of this intermediate ones of GSK-3b is illustrated by the phenyl ring(ball-and-stick model in pink) shown between the two differentpositions of the phenyl rings shown in Fig. 1a. Multiple conformationsof Arg141 can be seen at the lower left corner. (c) Binding mode ofstaurosporine (1Q3D). (d) Binding modes of II (1R0E), III (2OW3),and IV (1Q4L) from the superimposed GSK-3β structures. They showsimilar binding conformation of the three compounds. (e) Bindingmodes of II and IV showing similar binding conformation of thesetwo compounds
1466 J Mol Model (2009) 15:1463–1479

maleimides [19, 24]. Since the indole ring of II is on the leftside and the substituted phenyl ring of II or IV is on theright side in Fig. 1d, it was thought that the indole ring ofthe maleimides in Table 6 is on the left and the benzofuranring is on the right in this view. Therefore, all 51maleimides in Table 6 were docked into the binding siteof GSK-3β (1R0E) in this postulated manner. We chose theGSK-3β structure of 1R0E for our docking study, becauseits bound ligand is the most similar to our inhibitors. Thebinding conformation of the benzofuran ring could besimilar to that of the indole ring of III if the substituent onthe benzofuran ring is not large. However, if the substituenton the benzofuran ring is of sufficient bulk, then there is notenough space for the conformation observed for III. In sucha case, the benzofuran ring would be rotated by 180º. Forthe purpose of the CoMFA and CoMSIA studies, theconformation of the rotated benzofuran ring was selected,because some of our inhibitors have a larger substituentthan can be accommodated by the pocket present in theunrotated-binding conformation. When a large substituentis present at the X5 position of the indole ring of thebenzofuran-3-yl-(indol-3-yl)maleimide, the substituentwould clash sterically with Phe67, which would result inthe movement of the glycine-rich loop. The consequence ofthis movement would result in the conformational changeof Phe67 from the position of 1R0E-like structure to theposition of 1Q4L-like structure (see Fig. 1a). For consis-tency, all the compounds listed in Table 6 were docked inthis conformation to the GSK-3β binding site. (See furtherdiscussion below.) The starting conformation of the initialconformation of each compound was manually super-imposed over the pyrrolidin-2-one ring of the ligand-bound GSK-3β structure (1R0E) because of the reasondiscussed above.
Even though the binding mode of the compounds inTable 6 is likely to be the one (binding mode 1) describedabove, we decided to investigate other possible bindingmodes, especially in light of the fact that a different bindingconformation was previously proposed [19, 24, 56]. First,we examined the relative conformational energy of differentpossible binding conformations of an unsubstitutedbenzofuran-3-yl-(indol-3-yl)maleimide to the GSK-3βbinding pocket. Figure 2 shows eight different bindingmodes with four different conformations that are possible inthe GSK-3β binding site. In 2a and 2b in Fig. 2, thepositions of the indole and the benzofuran rings areswitched. With respect to the indole and the benzofuranring positions, the conformations 2a and 2b in Fig. 2 are thesame when only the ligand is considered, but they would bedifferent in the binding site. The conformational energies ofthese conformations are summarized in Table 2.
The conformational energy differences among these fourconformers are very small, thus suggesting that any of these
conformers may represent their actual binding conformationto the GSK-3β. Nonetheless, it is interesting to note thatconformation 2a (and 2b), which is the one believed torepresent the likely binding mode of the compounds inTable 6, has the lowest conformational energy. Among theeight possible binding modes shown in Fig. 2, bindingmodes 2a and 2b are the two most likely binding modesbased upon an analysis of the known ligand-bound GSK-3β X-ray crystal structures as discussed above. Therefore,we chose to investigate 3D-QSAR based on these twobinding modes in order to determine the binding mode ofthese compounds.
Comparative molecular field analysis
The 51 compounds included in this study are listed inTable 6 along with the IC50 values toward GSK-3β. TheIC50 values were determined for their potency to inhibitGSK-3β. Commercially available human GSK-3β, wasassayed for its ability to phosphorylate the primed peptidesubstrate (RRRPASVPPSPSLSRHSS(P)HQRR; 10 μM)in the presence of 0–10 μM of the maleimides [57]. Theinhibitory potency expressed as pIC50 values is thenegative logarithm of IC50 value. Therefore, the largerthe pIC50 value is, the more potent the compound is as aninhibitor of the kinase. The two binding modes (2a and 2bin Fig. 2) of these compounds were obtained by dockingeach molecule into the binding site of GSK-3β startingfrom two different initial binding conformations asdescribed above.
I. CoMFA for binding model 1
Figure 3 shows all the compounds superimposed of thedocked conformation in binding mode 1. Binding mode 1corresponds to the conformation 2a shown in Fig. 2. Thebest CoMFA model of the 51 substituted maleimidesobtained is a three-component model from the steric andelectrostatic fields with the following statistics (see Table 3):R2(cv)=0.386 and SE(cv)=0.854 for the cross-validation,and R2=0.811 and SE=0.475 for the fitted. F (3,47)=67.034, and Prob. of R2=0 (3,47)=0.000. The stericcomponent of these maleimide analogs on the inhibitorypotency described by this model is 48%, whereas theelectrostatic portion is 52%. The first component explains51% of the variance in the pIC50, and the second and thethird components account for additional 22% and 8% of thevariance, respectively. An essentially identical CoMFAmodel was obtained when the steric and the electrostaticfields were considered separately.
In our previous unpublished study, the classical QSARresult shown below was obtained [28]. It is interesting thatthe statistical quality (R2 and SE) of the classical QSAR
J Mol Model (2009) 15:1463–1479 1467

and the 3D-QSAR method using the CoMFA methodologyis similar. One compound (compound 1 in Table 6) wastreated as an outlier in the classical QSAR, but thiscompound was included in the CoMFA study.
pIC50 ¼ �0:60 �0:18ð Þ pY6 þ 0:51 �0:12ð Þ pY6ð Þ2 þ1:78 �0:21ð ÞpX5 � 0:07 �0:01ð Þ C log Pð Þ2 þ 0:10 �0:02ð ÞMRr � 0:86 �0:17ð Þ pX5ð Þ2 � 1:18 �0:38ð ÞspX6 þ 0:49�0:24ð ÞpR þ 0:34 �0:24ð ÞpX7 þ 7:60 �0:30ð Þ;N = 50, R2 =0.842, RMSE = 0.436
Figure 4 is the coefficient contour map of the three-component model derived from all 51 compounds. In thiscontour map, the sterically favored regions are shown ingreen, and the sterically disfavored regions are shownin yellow. The positive electrostatic contours are shown inblue, and the negative electrostatic contours are shown inred. Table 6 shows the observed and the calculated pIC50
values from this three-component CoMFA model alongwith their observed values. It is interesting to note that
1
2
3
4
a b
Fig. 2 Four representative conformations (1–4) of benzofuran-3-yl-(indol-3-yl)maleimides in binding mode 1 (a) and 2 (b)
Table 2 Relative conformational energy of four representative conforma-tions of 3-(benzofuran-3-yl)-4-(indol-3-yl)maleimides shown in Fig. 2
Binding mode 1 Binding mode 2 ΔEnergy (kcalmol-1)
1a 1b 1.6
2a 2b 0.0
3a 3b 1.4
4a 4b 2.1
1468 J Mol Model (2009) 15:1463–1479

there is a sterically favored region in the steric contour map(colored in green in Fig. 4a) near the Y2 position of thebenzofuran-3-yl-(indol-3-yl)maleimide. The hydrophobicresidue Leu132 and the four methylene groups of Lys85are located near the X2 group and the adjacent carbonylgroup of the pyrrolidine-2-one ring. This indicates that ahydrophobic group at this position may improve theinhibitory potency of the compound. As is the case forthe binding orientation of staurosporine observed in Fig. 1c(1Q3D), the binding orientation of the GSK-3β inhibitorsin Table 6 is fixed by the two hydrogen bonds involvingthe pyrrolidin-2-one rings of the inhibitors. One of thecarbonyl oxygens (left one in Fig. 3) of the pyrrolidin-2-one ring forms a hydrogen bond with the backbone NHof Val135, and the NH group of the pyrrolidin-2-one ringinteracts with the backbone carbonyl group of Asp133residue. Both residues are in the hinge region of GSK-3β.
Four compounds (1–4) in Table 6 have IC50 values insub-nanomolar inhibitory potency. Compounds 2, 3, and 4have a 6-CH2OH at the Y6 position, and compound 1 has a7-CH2OMe at the X7 position. There are other compoundswith 6-CH2OH at the Y6 position among the compounds inTable 6. These compounds are in general potent inhibitors.Two compounds (7 and 8) have a similar substituent 7-CH2OH at X7 position to the 7-CH2OMe of Compound 1.
Figure 5 shows the binding site amino acid residuesaround the 7-CH2OH group at X7 position and the 6-CH2OH at Y6 position of Compound 2 or 8 as arepresentative case, respectively. The 7-CH2OH group ofCompound 8 is in the hydrogen bonding distance with theside chain of Arg141, whereas the 6-CH2OH group ofcompound 2 is in the hydrogen bonding distance with theside chain of Gln185.
Whereas the 7-CH2OH group can act as a hydrogen-bond donor as well as a hydrogen-bond acceptor, the 7-CH2OMe group can only act as a hydrogen-bond acceptor.Because the 7-CH2OMe or 7-CH2OH group would interactwith Arg141, and should act as a hydrogen-bond acceptor,the 7-CH2OMe group would be preferred to 7-CH2OH atthis position if the hydrogen bonding interactions are themajor factor. In addition, if the 7-CH2OH or 7-CH2OMegroup interacts with the hydrophobic methylene groups ofArg141, the 7-CH2OMe group would be preferred to 7-CH2OH. Comparison of compounds 1 and 8 shows this isindeed the case.
Figure 6 is a plot of the observed and the calculatedpIC50 values from the three-component CoMFA model(Eq. 1 in Table 3) from the steric and electrostatic fields.
II. CoMFA for binding model 2
Figure 7 shows all the compounds superimposed in thedocked conformation of binding mode 2. Binding mode 2corresponds to the conformation 2b shown in Fig. 2. Thebest CoMFA model for the 51 substituted maleimidesobtained is a three-component model from the steric andelectrostatic fields with the following statistics (see Table 3):R2(cv)=0.296 and SE(cv)=0.915 for the cross-validation,and R2=0.784 and SE=0.507 for the fitted. F (3,47)=56.784, and Prob. of R2=0 (3,47)=0.000. The stericcontribution of these maleimide analogs toward theirinhibitory potency as described by this model is 49%,whereas the electrostatic portion is 51%. The first compo-nent explains 51% of the variance in the pIC50, and the
Fig. 3 Superposition of 51 substituted maleimides as GSK-3βinhibitors obtained from docking into the binding site of GSK-3βstructure (1R0E) in binding mode 1
Cross-validation Fitted Contribution
Eq. Fields Na Lb SE(cv) R2(cv) SE R2 Steric Electrostatic
Binding mode 1
1 Steric + Electrostatic 51 3 0.854 0.386 0.475 0.811 48% 52%
51 2 0.857 0.370 0.565 0.726 52% 48%
51 1 0.901 0.288 0.745 0.513 47% 53%
Binding mode 2
2 Steric + Electrostatic 51 3 0.915 0.296 0.507 0.784 49% 51%
51 2 0.956 0.216 0.622 0.668 50% 50%
51 1 1.026 0.078 0.746 0.512 50% 50%
Table 3 CoMFA models for 51substituted maleimides from thebinding modes 1 and 2
a Number of compounds used inthe modelb Number of components in themodel
J Mol Model (2009) 15:1463–1479 1469

second and the third components account for additional16% and 12% of the variance, respectively. An essentiallyidentical CoMFA model was obtained when the steric andthe electrostatic fields were considered separately.
Comparison of two binding modes with CoMFA results
It is interesting to examine the CoMFA results from the twodifferent binding modes of the compounds listed in Table 6:
whether the CoMFA results can be used to distinguish thetwo different binding modes and select the correct bindingmode from the wrong one. In general, the two bindingmodes of the inhibitors alone are not significantly different;the entire molecules are rotated about 180° in the bindingpocket as can be seen in Figs. 3, 7, especially for the studyof CoMFA. The differences between the two superpositionsare due to the different X- and Y-substituents and theenvironment of the GSK-3β binding site.
The CoMFA results summarized in Table 3 show that thesuperposition from the binding mode 1 (Eq. 1) accounts forthe variation in the pIC50 values of the compounds studiedmore than the superposition from the binding mode 2(Eq. 2): while Eq. 1 explains 81% of the variance, Eq. 2explains 78%. Even though the difference between the tworesults (percent of the variance explained by the twomodels) is not large, the statistics (SE and R2 for both thecross-validation and the fitted) indicate that the bindingmode 1 is better than binding mode 2. The relatively similarresults are due to the similar superposition of the twobinding modes. It is interesting, in this case, that the correctand the incorrect binding modes (or superpositions) yieldedsimilar CoMFA results, even though the correct binding
Fig. 4 (a) Steric contour of the three-component CoMFA model fromthe binding mode 1. The regions in green represent sterically favored,whereas the regions in yellow represent disfavored. (b) Electrostaticcontour of the three-component CoMFA model from the bindingmode 1. The regions in blue represent electrostatically favored,whereas the regions in red represent disfavored
Fig. 5 Docked binding mode of compounds 2 (a) or compound 8 (b)in the binding site of GSK-3β structure in binding mode 1
Fig. 6 A plot between the observed and the calculated pIC50 valuesfrom the three-component CoMFA model of the ligand-binding mode 1
Fig. 7 Superposition of 51 substituted maleimides as GSK-3βinhibitors obtained from docking into the binding site of GSK-3β(1Ρ0Ε) structure in binding mode 2
1470 J Mol Model (2009) 15:1463–1479

mode gave the better results. Usually in CoMFA, the modelhaving R2(cv)>0.3 is considered significant. Therefore, theCoMFA model for binding mode 2 is at the borderline ofstatistical significance. Therefore, the results overall indi-cate that the binding mode 1 would be favored over bindingmode 2 for the benzofuran-3-yl-(indol-3-yl)maleimidesexamined in this study.
Further validation of CoMFA model from binding model 1
In order to further validate the CoMFA model derived frombinding mode 1, the inhibitory potency values pIC50 werescrambled and used as such to develop a CoMFA model.The resulting CoMFA model was then compared with theCoMFA model developed using the correct pIC50 values.Such procedures have been used to prove the robustness ofthe derived CoMFA model. Five different scrambled pIC50
data sets were used in this validation procedure (See Table 4for further details). The statistics for the CoMFA modelsdeveloped using the scrambled pIC50 values for the 51substituted maleimides are summarized in Table 4. Theresults show that none of the scrambled pIC50 data setsyielded a statistically significant CoMFA model. The resultsprovide additional support for the CoMFA model derivedfrom binding mode 1 of these compounds.
Comparative molecular similarity index analysis
The two binding modes of the compounds (Figs. 2, 5) inTable 6 used in the CoMFA studies described above werealso used to study 3D-QSAR using the CoMSIA approach.The CoMSIA results obtained from binding modes 1 and 2are summarized in Table 5.
I. CoMSIA for binding model 1
The best CoMSIA model obtained from 51 substitutedmaleimides in Table 6 is a three-component model from thesteric and electrostatic fields with the following statistics(see Table 5): R2(cv)=0.414 and SE(cv)=0.835 for thecross-validation, and R2=0.746 and SE=0.550 for thefitted. F (3,47)=45.952, and Prob. of R2=0 (3,47)=0.000.The steric portion of the influences of maleimide analogsfor the inhibitory potency described by this model is 25%,whereas the electrostatic portion is 75%. The first compo-nent explains 53% of the variance in the pIC50, and thesecond and the third component account for additional 14%and 8% of the variance. An essentially identical CoMFAmodel was obtained when the steric and the electrostaticfields were considered separately. Addition of hydrophobicand/or hydrogen donor or acceptor components did not
Table 4 Validation of CoMFA and CoMSIA models for 51 substituted maleimides from binding mode 1 using scrambling pIC50 values
Scramble Cross-validation Fitted
Runa Fields N L SE(cv) R2(cv) SE R2
CoMFA (Eq. 1)
1 Steric + Electrostatic 51 1 1.102 -0.065 0.902 0.287
2 Steric + Electrostatic 51 1 1.057 0.021 0.836 0.387
3 Steric + Electrostatic 51 1 1.042 0.048 0.807 0.430
4 Steric + Electrostatic 51 1 1.098 -0.056 0.828 0.399
5 Steric + Electrostatic 51 1 1.116 -0.090 0.890 0.306
CoMSIA (Eq. 3)
6 Steric + Electrostatic 51 1 1.194 -0.249 0.928 0.249
7 Steric + Electrostatic 51 1 1.077 -0.016 0.918 0.262
8 Steric + Electrostatic 51 1 1.047 0.040 0.877 0.326
9 Steric + Electrostatic 51 1 1.093 -0.047 0.913 0.270
10 Steric + Electrostatic 51 1 1.130 -0.119 0.923 0.253
a The scrambling of the inhibitory potency value (pIC50) values used in this validation were generated as follows: The original pIC50 values in thedata table were initially sorted by the compounds id (not shown). For scramble run 1, the pIC50 values of the entire set of compounds wereresorted in ascending order and then the resulting pIC50 values in the newly sorted order were assigned to the compounds in the initial order as thescrambled pIC50 values. For scramble run 2, the compound id of the entire set of compounds were resorted in ascending order and then theresulting pIC50 values in the newly sorted order were assigned to the compounds sorted in the descending order as the scrambled pIC50 values. Forscramble run 3, the pIC50 values of the entire set of compounds were resorted in descending order and then the resulting pIC50 values in the newlysorted order were assigned to the compounds in the initial order as the scrambled pIC50 values. For scramble run 4, the pIC50 values of the entireset of compounds were resorted in ascending order and then the resulting pIC50 values in the newly sorted order were assigned to the compoundsin the initial order as the scrambled pIC50 values. For scramble run 5, the pIC50 values of the entire set compounds were resorted in ascendingorder and then the resulting pIC50 values in the newly sorted order were assigned to the compounds sorted in the descending order as thescrambled pIC50 values.
J Mol Model (2009) 15:1463–1479 1471

improve the correlation already obtained (However, seefurther discussion below). It is interesting to note that thecalculated pIC50 value of compound 1 has the largestdeviation (1.258) from the observed pIC50 value. Com-pound 1 was also found to be an outlier in the classicalQSAR discussed above. In this aspect, the CoMSIA resultsare similar to the classical QSAR.
As the validation process for the CoMFA model derivedfrom binding mode 1, the inhibitory potency values pIC50
were scrambled and used as such to develop a CoMSIAmodel. The same five different scrambled pIC50 data setsused for the validation of the CoMFA model were used inthis validation procedure. The results are also summarized inTable 4. The results show that none of the scrambled pIC50
data sets yielded a statistically significant CoMSIA model.Figure 8 is the coefficient contour map of the three-
component CoMSIA model derived from 51 compounds. Inthis contour map, the sterically favored regions are shown ingreen. The positive electrostatic contours are shown in blue.The model indicated that there are no sterically disfavoredregions and no electrostatically negative regions at thiscontour level. Table 6 shows the observed and the calculatedpIC50 values from this three-component CoMSIA modelalong their observed values. Figure 9 is a plot of theobserved and the calculated pIC50 values from this model.
II. CoMSIA for binding model 2
The best CoMSIA model obtained from 51 substitutedmaleimides in Table 6 is a two-component model from thesteric and the electrostatic fields with the followingstatistics (see Table 5): R2(cv)=0.281 and SE(cv)=0.915
for the cross-validation, and R2=0.650 and SE=0.638 forthe fitted. F (2,48)=44.89, and Prob. of R2=0 (2,48)=0.000. The steric portion of the influences of maleimideanalogs for the inhibitory potency described by this modelis 22%, whereas the electrostatic portion is 78%. The firstcomponent explains 53% of the variance in the pIC50, andthe second component accounts for additional 13% of thevariance. An essentially identical CoMSIA model wasobtained when the steric and the electrostatic fields wereconsidered separately. Addition of hydrophobic and/orhydrogen donor or acceptor components did not improvethe correlation already obtained.
Comparison of two binding modes with CoMSIA results
In light of the similar CoMFA results from the two differentbinding modes of the compounds studied, it is interesting toexamine the CoMSIA results with respect to the twodifferent binding modes.
The CoMSIA results (Eqs. 3, 4, 5, and 6) summarized inTable 5 show that the superposition from binding mode 1(Eqs. 3 and 4) accounts for the variation in the pIC50 valuesof the compounds studied more than the superposition frombinding mode 2 (Eqs. 5 and 6). These results are consistentwith those of the CoMFA discussed above. The differencesin statistics between the two CoMSIA results are larger thanthe corresponding CoMFA results. The statistics of theCoMSIA analyses (SE and R2 for both the cross-validationand the fitted) also indicate that binding mode 1 explainsthe variation in pIC50 better than binding mode 2. Theresults further support binding mode 1 as the correctbinding modes of the compounds studied. Another inter-
Table 5 CoMSIA models for 51 substituted maleimides from binding modes 1 and 2
Cross-validation Fitted Contribution
Eq. Fields Na Lb SE(cv) R2(cv) SE R2 Ster Elec Hydrophob
Binding mode 1
3 Steric + Electrostatic 51 3 0.835 0.414 0.550 0.746 25% 75%
51 2 0.853 0.375 0.621 0.668 25% 75%
51 1 0.912 0.271 0.735 0.527 26% 74%
4 Ster + Elec + Hydrophob 51 3 0.839 0.408 0.557 0.739 18% 52% 30%
51 2 0.864 0.360 0.622 0.668 17% 51% 32%
51 1 0.913 0.270 0.755 0.500 16% 46% 38%
Binding mode 2
5 Steric + Electrostatic 51 2 0.915 0.281 0.638 0.650 22% 78%
51 1 0.971 0.174 0.737 0.525 22% 78%
6 Ster + Elec + Hydrophob 51 2 0.921 0.272 0.603 0.688 14% 54% 31%
51 1 0.951 0.208 0.758 0.496 13% 47% 40%
a Number of compounds used in the modelb Number of components in the model
1472 J Mol Model (2009) 15:1463–1479

Table 6 Inhibitory potency of 51 GSK-3β inhibitors included in this study
a Calculated using the three-component CoMFA model (Eq. 1) derived from 51 compounds using the binding mode 1b Calculated using the three-component CoMSIA model (Eq. 3) derived from 51 compounds using binding mode 1
J Mol Model (2009) 15:1463–1479 1473

esting aspect of the CoMSIA results is that Eqs. 4 and 6indicate some possible contributions of hydrophobic con-tribution of the substituents toward the observed pIC50
values as in the classical QSAR discussed above. It waspreviously studied that the steric contribution of CoMFAmay include the hydrophobic contribution [38–43]. Thepresent CoMSIA results indicate separate contributionsfrom the hydrophobic contributions even though the stericcontributions may include the hydrophobic contributions ofthe substituents as in the case of CoMFA.
As in CoMFA, the model having R2(cv)>0.3 may beconsidered significant in CoMSIA. Therefore, the CoMSIAmodel for binding mode 2 may not be statisticallysignificant in this standard. Therefore, the results ofCoMSIA are consistent with those of CoMFA, and bothresults indicate that binding mode 1 would be favored overbinding mode 2 for the benzofuran-3-yl-(indol-3-yl)malei-mides examined in this study.
Comparison of 3D-QSAR results with the current X-raystructures
While this manuscript was in preparation, the preliminaryresults of ligand-bound X-ray crystal structures of GSK-3βbecame available. The present 3D-QSAR results areinteresting to compare with the preliminary X-ray crystalstructures of two GSK-3β inhibitors, namely compound 5and compound 14. Compound 5 has Br as X5 and(CH2)3OH as R. Compound 14 has 5-cyclopropylethynylas X5, F as Y5, and CH3 as R. Even though there are cleardifferences in the substituent pattern of these two com-
pounds, the initial X-ray crystal structures could not readilydiscern the relative positions of the indole ring and thebenzofuran ring. In fact, the positions of these two ringswere thought to be switched and be similar to binding mode1 in the initial preliminary X-ray results. This initialobservation was not consistent with the 3D-QSAR results.In the updated X-ray crystal structures of these twocompounds, however, it was determined that the positionsof the two rings are consistent with binding mode 1.
The CoMFA results indicate that binding mode 1 ispreferred over binding mode 2. The same is true for theCoMSIA results. The CoMSIA results indicate more clearlythat binding mode 1 better accounts for the variance inpIC50 than does binding mode 2, even though their statisticsare inferior to those of CoMFA.
Figure 10 shows a superposition of the docked confor-mation and the current X-ray crystal structures of com-pounds 5 and 14. Figure 10a shows that the dockedconformation (shown in purple) and the current X-raycrystal structure (shown in cyan) of compound 5 areessentially identical. Although the superposition of thedocked conformation (shown in green) and the X-raycrystal structure (shown in orange) of compound 14 arevery similar, Fig. 10b shows that there is some movementin the binding pocket of GSK-3β (See further discussionbelow about the flexible binding pocket relating to thebinding mode of compound 14).
Unexplained pIC50 portions by the 3D-QSAR results
The current CoMFA and CoMSIA models account for thevariance of pIC50 values about 80% and 75%, (R2=0.81 forCoMFA and 0.75 for CoMSIA), and the corresponding SEvalues are 0.48 and 0.55, respectively. Unexplained portionor outliers of QSARs can be very important and interesting,especially when the observed biological activity is higher
Fig. 8 (a) Steric contour map (70% level) of the three-componentCoMSIA model. (b) Electrostatic contour map (30% level) of thecorresponding three-component CoMSIA model in the ligand-bindingmode 1
Fig. 9 A plot between the observed and the calculated pIC50 valuesfrom the three-component CoMSIA model from the steric andelectrostatic fields of the ligand-binding mode 1
1474 J Mol Model (2009) 15:1463–1479

than that predicted by the QSAR model. Unexplainedportions or outliers by the QSAR model may imply severalpossibilities in addition to experimental errors. They mayimply that the QSAR may lack certain descriptors todescribe the QSAR of the entire group of compoundsstudied, or that the mathematical model or approach maynot be appropriate. The outliers or unexplained portionsmay also be due to the inappropriate calculation of theparameter values used, may indicate a different mechanismof action, or may result from a different binding mode or aflexible binding site [44, 45].
One possible source of the unexplained component ofthe pIC50 values in the present case, which is about 20% ofthe variance in pIC50 values, is likely due to the flexiblebinding pocket as shown in Fig. 1b. Depending on the sizeof the ligand, the flexible glycine-rich loop of GSK-3β maychange its loop conformation as indicated by the differentposition of Phe67 in the various X-ray crystal structures. (Alsosee the discussion below for Fig. 10b and compound 14.)Another possible source is the flexible side chain conforma-tion as observed by the different side chain conformations ofArg141 (see the lower left corner of Fig. 1b). The thirdpossibility is the bindingmode of the benzofuran ring. The sizeof the binding pocket where the benzofuran ring binds is largeenough to accommodate the unsubstituted benzofuran ring intwo different positions. One possibility is the one shown by thebinding of the corresponding indole ring in staurosporine(Fig. 1c, 1Q3D) or in the bis-(indole)maleimide pyridino-phane (Fig. 1d, 2OW3), and the other is the one seen in theconformation used in the current CoMFA or CoMSIAstudies. Interestingly, two different benzofuran binding con-formations were observed in the compound 14-bound GSK-3β X-ray crystal structure which is shown in Fig. 11.
In QSAR, if the difference between the observed and thecalculated activity values is greater than twice the standarderror of the model, such compounds are normally consideredas outliers. Table 6 shows that one compound (compound 7;X=7-CH2OH, Y=6-CH2OH, and R=CH3) is an outlier ofthe CoMFA model derived from binding mode 1. Thecalculated pIC50 value of this compound is 9.31, whereas theobserved pIC50 value is 8.29. The difference is larger than1.0 in logarithmic unit. Thus, the compound is calculated tobe more a potent binder than observed. Possible reasons forthe discrepancy between the calculated and the observedinhibitory potencies of this compound could be due tovarious reasons as described above, as well as to possibleexperimental error. This discrepancy suggests that thiscompound might be studied further.
Unlike the CoMFA model, the corresponding CoMSIAmodel from binding mode 1 yielded five outliers (com-pounds 1, 7, 10, 12, and 41). The larger number of outliersfrom the CoMSIA model shows that the CoMSIA modeldoes not explain the observed pIC50 values as well as theCoMFA model, and is not as good as the correspondingCoMFA model to describe the 3D-QSAR for the setstudied. However, it is interesting to see that the CoMSIAmodel also suggests that compound 7 would be a morepotent binder than observed. The difference between thetwo values is greater than 1.0 in logarithmic unit. Theseresults are consistent with those of CoMFA.
Further utilization of the 3D-QSAR results
The aim of this study was to identify the binding mode ofthe substituted maleimides (I) to the binding site of GSK-3β. Understanding the binding modes of compounds understudy is critical in drug discovery research. Utilizing the3D-QSAR methodologies of both CoMFA and CoMSIA,the possible binding mode of the maleimides of interest wasdetermined in this study. The CoMFA model was furthervalidated statistically using the scrambled pIC50 values. Thesuggested binding modes of these compounds were furthersupported by the two preliminary X-ray crystal structures ofinhibitor-bound GSK-3β.
Even though the major aim of our study was accom-plished, it was interesting to test the CoMFA model
Fig. 11 Two different bindingmodes of the benzofuran ring of compound14 observed in the X-ray crystal structure of the ligand-bound GSK-3β
Fig. 10 Superposition of the docked and the preliminary X-raycrystal structures of compounds 5 (a) and 14 (b). In Fig. 10a, thedocked structure of compound 5 is shown in purple, while the X-raycrystal structure of the same compound is shown in cyan. In Fig. 10b,the docked structure of compound 14 is shown in green, while theX-ray crystal structure of the same compound is shown in orange
J Mol Model (2009) 15:1463–1479 1475

developed from binding mode 1 for its predictability. Twocompounds were synthesized and their pIC50 values wereestimated using the final CoMFA and CoMSIA modelswhile they were being tested for their biological activity.One compound (52) is X5=Cl, X6=OMe, R=CH3, and theother compound (53) is X7=CH2OMe, Y6=CH2OH, R=CH3. The calculated pIC50 values from the CoMFA modelare 6.13 for compound 52 and 7.67 for compound 53. Thecalculated pIC50 values from the CoMSIA model are 5.95for compound 52 and 5.77 for compound 53. Theexperimentally determined pIC50 values are 7.09 (81.4nM) and 9.14 (0.73 nM) for compound 52 and 53,respectively. The experimentally determined pIC50 valuesare higher than the calculated values for both compoundsfrom both CoMFA and CoMSIA methods. Althoughcompound 53 is not the most potent inhibitor in this series,it is still significantly potent. It provides an example ofutilizing the binding mode and 3D-QSAR of these GSK-3βinhibitors in our drug discovery research. The results ofCoMFA fit better than the results of CoMSIA.
Although we were delighted to see the higher inhibitorypotencies of the newly synthesized compounds, it was alsopuzzling to see the poor predictabilities of both 3D-QSARmodels, at least for these two compounds. For compound52 (5-Cl, 6-OCH3), one can compare the results with thoseof compound 39 (5-OCH3, 6-Cl). The observed pIC50 ofcompound 39 is 6.36, whereas the calculated values are6.54 and 6.51 from CoMFA and CoMSIA, respectively.One can see that while both 3D-QSAR models predictedwell the pIC50 value of Compound 39, those models did notpredict well the pIC50 value of compound 52. The resultsindicate that the current models do not describe the effectsof these structural changes on the inhibitory potencies.However, inclusion of these two compounds in the furtherdevelopment of the CoMFA and CoMSIA models couldimprove the predictabilities of both models for futurecompounds containing such structural modifications. If a3D-QSAR model does not contain certain structuralinformation, it is not surprising to find that the model isgenerally unable to predict the activity of a compoundembodying such structural modifications [30].
Summary and conclusions
The binding modes of GSK-3β inhibitors have beenstudied with molecular modeling and docking methodsalong with 3D-QSAR approaches. The approaches ofCoMFA and CoMSIA were used for 3D-QSAR with 51substituted benzofuran-3-yl-(indol-3-yl)maleimides asGSK-3β inhibitors.
Two binding modes of our inhibitors to the bindingpocket of GSK-3β were investigated. Binding mode 1yielded better CoMFA and CoMSIA correlations. Thebinding mode determined by the results of this study isconsistent with the preliminary results of an X-ray crystalstructure analysis of inhibitor-bound GSK-3β. This studyshows that the 3D-QSAR methodologies are useful inidentifying the correct binding modes of the substitutedbenzofuran-3-yl-(indol-3-yl)maleimides to GSK-3β. Thesemodels will be updated with additional compounds and usedin our continued work to estimate the inhibitory potency ofother novel GSK-3β inhibitors of this structural class.
Several possible sources of the unexplained componentof the pIC50 values by the 3D-QSAR models are discussed.
The present study provides the first example of identify-ing the correct binding mode of GSK-3β inhibitors using themolecular modeling, docking, and 3D-QSAR approaches.
Experimental section
The publicly available protein structures used in this studyand listed in Table 1 were obtained from the RSCS proteindata bank [34].
Two binding modes of the 51 compounds in the GSK-3βbinding site were obtained by docking each compound intothe binding site (see the discussions in the text) startingfrom the initial 2a and 2b conformations in Table 2.
The ligands were manually docked into the binding siteof GSK-3β (1R0E). The initial binding position of theligands was set by superimposing the pyrrolidin-2-one ringof the inhibitors over the corresponding ring of the ligand inthe ligand-bound X-ray crystal structure of GSK-3β, 1R0E.
HN
O O
N O
Cl
MeO
HN
O O
N O
R
MeO
OH
(52) (53)
1476 J Mol Model (2009) 15:1463–1479

Initial docking conformations of the substituted indole ringand the substituted benzofuran ring of the inhibitors wereset to be similar to the two conformations (2a and 2b)shown in Fig. 2. The orientation of each side chain of themolecules were set in such a way that the substituentswould exhibit minimal steric clashes with any amino acidresidues of the protein, but would be able to engage inpossible hydrogen bonding interactions with nearby aminoacid residues.
The geometry optimizations of the ligand-bound GSK-3β complexes were then performed using the molecularmodeling software Sybyl version 7.3 of Tripos. Theoptimization of the protein-ligand complex was done bythe Powell method without any initial optimization usingthe MMFF94 force field, the Gasteiger-Marsili charges,constant dielectric function, NB cut-off of 8.0, anddielectric constant of 1.0. The default settings were usedfor others with termination when the gradient reaches0.05 kcal mol-1. The maximum iteration for the geometryoptimizations was set to be 1000.
The 3D-QSAR models were developed using thetechniques of CoMFA and CoMSIA available in the Sybylsoftware package. The superpositions of the inhibitors usedfor each CoMFA and CoMSIA models were those of thedocked positions and conformations obtained as describedabove. The CoMFA and CoMSIA modules of the molecularmodeling software Sybyl version 7.3 of Tripos were usedfor these 3D-QSAR analyses. Default settings for allparameters were used using CH3
+ as the probe, a 2-angstrom lattice box, and the Gasteiger-Marsili charges.Leave-one-out method was used for the cross-validationstep. The PLS analysis was done using the SAMPLSmethod available through Sybyl. The selections of the finalCoMFA and CoMSIA models were based on the results ofthe cross-validation, and are summarized in Table 3(CoMFA) and Table 5 (CoMSIA). Further validation ofthe CoMFA and CoMSIA models from binding mode 1using scrambling pIC50 values are summarized in Table 4.
All the figures were generated using the UCSF chimeramolecular modeling program production version 1 [46].
Acknowledgments Ki Kim thanks Dr. Pavel Petukhov for the use ofmolecular modeling software. Andrew Mesecar is supported by grantsfrom the National Cancer Institute of the National Institutes of Health(CA92744 and CA48112). This work was supported in part by NIHgrant (1R01 MH072940-01, Grantee Alan P. Kozikowski)
References
1. Martinez A (2008) Preclinical efficacy on GSK-3 inhibitors:Towards a future generation of powerful drugs. Med Res Rev5:773–796
2. Jope RS, Yuskaitis CJ, Beurel E (2007) Glycogen synthasekinase-3 (GSK3): Inflammation diseases and therapeutics. Neuro-chem Res 32:577–595
3. Bhat R, Haeberlein SLB, Avila J (2004) Glycogen synthase kinase3: a drug target for CNS therapies. J Neurochem 89:1313–1317
4. Martinez A, Castro A, Alonso M (2002) Glycogen synthasekinase 3 (GSK-3) inhibitors as new promising drugs for diabetes,neurodegeneration, cancer, and inflammation. Med Res Rev22:373–384
5. Martinez A, Alonso M, Castro A, Pérez C, Moreno FJ (2002)First non-atp competitive glycogen synthase kinase 3 (GSK-3)inhibitors: thiadiazolidinones (TDZD) as potential drugs for thetreatment of alzheimer′s disease. J Med Chem 45:1292–1299
6. Meijer L, Skaltsounis AL, Magiatis P, Polychronopoulos P,Knockaert M, Leost M, Ryan XP, Vonica CA, Brivanlou A,Dajani R, Crovace C, Tarricone C, Musacchio A, Roe SM,Pearl L, Greengard P (2003) GSK-3-selective inhibitors derivedfrom Tyrian purple indirubins. Chem Biol 10:1255–1266
7. Kuo G-H, Prouty C, DeAngelis A, Shen LQ, O′Neill DJ, Shah C,Connolly PJ, Murray WV, Conway BR, Cheung P, Westover L,Xu JZ, Look RA, Demarest KT, Emanuel S, Middleton SA,Jolliffe L, Beavers MP, Chen X (2003) Synthesis and discovery ofmacrocyclic polyoxygenated bis-7-azaindolylmaleimides as anovel series of potent and highly selective glycogen synthasekinase-3â inhibitors. J Med Chem 46:4021–4031
8. Witherington J, Bordas V, Gaiba A, Garton NS, Naylor A,Rawlings AD, Slingsby BP, Smith DG, Takle AK, Ward RW(2003) 6-Aryl-pyrazolo[34-b]pyridines: potent inhibitors of gly-cogen synthase kinase-3 (GSK-3). Bioorg Med Chem Lett13:3055–3057
9. Witherington J, Bordas V, Gaiba A, Naylor A, Rawlings AD,Slingsby BP, Smith DG, Takle AK, Ward RW (2003) 6-Heteroaryl-pyrazolo[34-b]pyridines: potent and selective inhibi-tors of glycogen synthase kinase-3 (GSK-3). Bioorg Med ChemLett 13:3059–3062
10. Bregman H, Williams D, Atilla GE, Carroll PJ, Meggers E (2004)An organometallic inhibitor for glycogen synthase kinase 3. J AmChem Soc 126:13594–13595
11. Engler TA, Henry JR, Malhotra S, Cunningham B, Furness K,Brozinick J, Burkholder TP, Clay MP, Clayton J, Diefenbacher C,Hawkins E, Iversen PW, Li Y, Lindstrom TD, Marquart AL,McLean J, Mendel D, Misener E, Briere D, O’Toole JC,Porter WJ, Queener S, Reel JK, Owens RA, Brier RA,Eessalu TE, Wagner JR, Campbell RM, Vaughn R (2004)Substituted 3-imidazo[12-a]pyridin-3-yl-4-(1234-tetrahydro-[14]diazepino-[671-hi]indol-7-yl) pyrrole-25-diones as highly selec-tive and potent inhibitors of glycogen synthase kinase-3. J MedChem 47:3934–3937
12. Kunick C, Laurenroth K, Wieking K, Xie X, Schultz C, Gussio R,Zaharevitz D, Leost M, Meijer L, Weber A, Jorgensen FS,Lemcke T (2004) Evaluation and comparison of 3D-QSARCoMSIA models for CDK1, CDK5, and GSK-3 inhibition bypaullones. J Med Chem 47:22–36
13. Peat AJ, Garrido D, Boucheron JA, Schweiker SL, Dickerson SH,Wilson JR, Wang TY, Thomson SA (2004) Novel GSK-3inhibitors with improved cellular activity. Bioorg Med Chem Lett14:2127–2130
14. Meijer L, Flajolet M, Greengard P (2004) Pharmacological inhibitorsof glycogen synthase kinase 3. Trends Pharmacol Sci 9:471–480
15. Zhang HC, Ye H, Conway BR, Derian CK, Addo MF, Kuo GH,Hecker LR, Croll DR, Li J, Westover L, Xu JZ, Look R,Demarest KT, Andrade-Gordon P, Damiano BP, Maryanoff BE(2004) 3-(7-Azaindolyl)-4-arylmaleimides as potent selectiveinhibitors of glycogen synthase kinase-3. Bioorg Med Chem Lett14:3245–3250
J Mol Model (2009) 15:1463–1479 1477

16. Polychronopoulos P, Magiatis P, Skaltsounis AL, Myrianthopoulos V,Mikros E, Tarricone A, Musacchio A, Roe SM, Pearl L, Leost M,Greengard P, Meijer L (2004) Structural basis for the synthesis ofindirubins as potent and selective inhibitors of glycogen synthasekinase-3 and cyclin-dependent kinases. J Med Chem 47:935–946
17. Martinez A, Alonso M, Castro A, Dorronsoro I, Gelpi JL,Luque FJ, Perez C, Moreno FJ (2005) SAR and 3D-QSARstudies on thiadiazolidinone derivatives: exploration of struc-tural requirements for glycogen synthase kinase 3 inhibitors. JMed Chem 48:7103–7112
18. Zeng M, Jiang Y, Zhang B, Zheng K, Zhang N, Yu Q (2005) 3DQSAR studies on GSK-3 inhibition by aloisines. Bioorg MedChem Lett 15:395–399
19. Kozikowski AP, Gaisina IN, Petukhov PA, Sridhar J, King LT,Blond SY, Duka T, Rusnak M, Sidhu A (2006) Highly potent andspecific GSK-3b inhibitors that block tau phosphorylation anddecrease a-synuclein protein expression in a cellular model ofparkinson's disease. Chem Med Chem 1:256–266
20. Dessalew N, Bharatam PV (2007) 3D-QSAR and moleculardocking study on bisarylmaleimide series as glycogen synthasekinase 3 cyclin dependent kinase 2 and cyclin dependent kinase 4inhibitors: An insight into the criteria for selectivity. Eur J MedChem 42:1014–1027
21. Dessalew N, Patel DS, Bharatam PV (2007) 3D-QSAR andmolecular docking studies on pyrazolopyrimidine derivatives asglycogen synthase kinase-3beta inhibitors. J Mol Graph Model25:885–895
22. Hamann M, Alonso D, Martin-Aparicio E, Fuertes A, Perez-Puerto MJ, Castro A, Morales S, Navarro ML, del Monte-Millan M,Medina M, Pennaka H, Balaiah A, Peng J, Cook J, Wahyuono S,Martinez A (2007) Glycogen synthase kinase-3 (GSK-3) inhibitoryactivity and structure–activity relationship (SAR) studies of themanzamine alkaloids potential for alzheimer’s disease. J Nat Prod70:1397–1405
23. Shin D, Lee SC, Heo YS, Cho YS, Kim YE, Hyun YL, Cho JM,Lee YS, Ro S (2007) Design and synthesis of 7-hydroxy-1H-benzoimidazole derivatives as novel inhibitors of glycogensynthase kinase-3beta. Bioorg Med Chem Lett 17:5686–5689
24. Kozikowski AP, Gaisina IN, Yuan H, Petukhov PA, Blond SY,Fedolak A, Caldarone B, McGonigle P (2007) Structure-baseddesign leads to the identification of lithium mimetics that blockmania-like effects in rodents. possible new GSK-3β therapies forbipolar disorders. J Am Chem Soc 129:8328–8332
25. Stukenbrock H, Mussmann R, Geese M, Ferandin Y, Lozach O,Lemcke T, Kegel S, Lomow A, Burk U, Dohrmann C, Meijer L,Austen M, Kunick C (2008) 9-Cyano-1-azapaullone (Cazpaul-lone. a Glycogen Synthase Kinase-3 (GSK-3) inhibitor activatingpancreatic β Cell protection and replication. J Med Chem51:2196–2207
26. Voigt B, Krug M, Schachtele C, Totzke F, Hilgeroth A (2008)Probing Novel 1-Aza-9-oxafluorenes as selective GSK-3b inhib-itors. Chem Med Chem 3:120–126
27. Taha MO, Bustanji Y, Al-Ghussein MAS, Mohammad M,Zalloum H, Al-Masri IM, Atallah N (2008) Pharmacophoremodeling quantitative structure-activity relationship analysis, andin silico screening reveal potent glycogen synthase kinase-3inhibitory activities for cimetidine, hydroxychloroquine, andgemifloxacin. J Med Chem 51:2062–2077
28. Gaisina IN, Gallier F, Kim KH, Ougolkov AV, Guo S, Holzle D,Luchini DN, Kurome T, Blond SY, Billadeau D, Kozikowski AP.Identification of Potent and Selective GSK-3β Inhibitors thatSuppress Proliferation and Survival of Pancreatic Cancer Cells. JMed Chem 52:1853–1863
29. Kim KH (1995) Comparative molecular field analysis. In:Dean PM (ed) Molecular similarity in drug design. Chapman &Hall, London, pp 291–331
30. Kim KH, Greco G, Novellino E (1998) A critical review of recentCoMFA applications. Perspect Drug Discovery Des 12–14:233–255
31. Martin YC, Kim KH, Lin CT (1996) Comparative MolecularField Analysis: CoMFA, vol 1. JAI Press, pp 1-52
32. Klebe G (1998) Comparative molecular similarity indices analy-sis: CoMSIA. In: Kubinyi HFG, Martin YC (eds) Three-dimensional quantitative structure activity relationships, 3d qsarin drug design, recent advances. Vol 3. Springer, Netherlands, pp87–104
33. Bertrand JA, Thieffine S, Vulpetti A, Cristiani C, Valsasina B,Knapp S, Kalisz HM, Flocco M (2003) Structural characterizationof the GSK-3β active site using selective and non-selective ATP-mimetic inhibitors. J Mol Biol 333:393–407
34. Berman HM, Westbrook J, Feng Z, Weissig H, Shindyalov IN,Bourne PE (2000) The protein data bank. Nucleic Acids Res28:235–242
35. Hubbard SR (2000) Protein tyrosine kinase structure and function.Annu Rev Biochem 69:373–398
36. Huse M (2002) The conformational plasticity of protein kinases.Cell 109:275–282
37. Johnson LN (1996) Active and inactive protein kinases: structuralbasis for regulation. Cell 85:149–158
38. Kim KH (1991) A novel method of describing hydrophobiceffects directly from 3D Structures in 3D-quantitative structure-activity relationships study. Med Chem Res 1:259–264
39. Kim KH (1992) Description of nonlinear dependence directlyfrom 3D structures in 3D-quantitative structure-activity relation-ships. Med Chem Res 2:22–27
40. Kim KH (1992) Quantitative structure-activity relationships:nonlinear dependence described directly from 3D structures usingcomparative molecular field analysis (CoMFA). Quant Struct-ActRelat 11:309–317
41. Kim KH (1993) Nonlinear dependence in GRID-comparativemolecular field analysis (CoMFA). J Comput Aid Mol Design7:71–82
42. Kim KH (1993) Quantitative structure-activity relationships:describing hydrophobic interactions directly from 3D structuresusing a comparative molecular field analysis (CoMFA) approach.Quant Struct-Act Relat 12:232–238
43. Kim KH (1995) Calculation of hydrophobic parameters directlyfrom three-dimensional structures using comparative molecularfield analysis (CoMFA). J Comput Aid Mol Design 9:308–318
44. Kim KH (2007) Outliers in SAR and QSAR: 2 is flexible bindingsite a possible source of outliers? J Comput Aid Mol Design21:421–435
45. Kim KH (2007) Outliers in SAR and QSAR: is unusual bindingmode a possible source of outliers? J Comput Aid Mol Design21:63–86
46. Pettersen EF, Goddard TD, Huang CC, Couch GS, Greenblatt DM,Meng EC, Ferrin TE (2004) UCSF Chimera - a visualization systemfor exploratory research and analysis. J Comput Chem 25:1605–1612
47. Allard J, Nikolcheva T, Gong L, Wang J, Dunten P, Avnur Z,Waters R, Sun Q, Skinner B. From genetics to therapeutics: theWnt pathway and osteoporosis, to be published
48. Zhang HC, Bonaga LV, Ye H, Derian CK, Damiano BP,Maryanoff BE (2007) Novel bis(indolyl) maleimide pyridino-phanes that are potent selective inhibitors of glycogen synthasekinase-3. Bioorg Med Chem Lett 17:2863–2868
49. Bax B, Carter PS, Lewis C, Guy AR, Bridges A, Tanner R,Pettman G, Mannix C, Culbert AA, Brown MJ, Smith DG,Reith AD (2001) The structure of phosphorylated GSK-3betacomplexed with a peptide FRATtide that inhibits beta-cateninphosphorylation. Structure 9:1143–1152
50. Dajani R, Fraser E, Roe SM, Yeo M, Good VM, Thompson V,Dale TC, Pearl LH (2003) Structural basis for recruitment of
1478 J Mol Model (2009) 15:1463–1479

glycogen synthase kinase 3beta to the axin-APC scaffold complex.EMBO J 22:494–501
51. Bertrand JA, Thieffine S, Vulpetti A, Cristiani C, Valsasina B,Knapp S, Kalisz HM, Flocco M (2003) Structural characterizationof the GSK-3beta active site using selective and non-selectiveATP-mimetic inhibitors. J Mol Biol 333:393–407
52. Dajani R, Fraser E, Roe SM, Young N, Good V, Dale TC,Pearl LH (2001) Crystal structure of glycogen synthase kinase3 beta: structural basis for phosphate-primed substrate speci-ficity and autoinhibition. Cell 105:721–732
53. ter Haar E, Coll JT, Austen DA, Hsiao HM, Swenson L, Jain J(2001) Structure of GSK3beta reveals a primed phosphorylationmechanism. Nat Struct Biol 8:593–596
54. Aoki M, Yokota T, Sugiura I, Sasaki C, Hasegawa T, Okumura C,Ishiguro K, Kohno T, Sugio S, Matsuzaki T (2004) Structuralinsight into nucleotide recognition in tau-protein kinase I/glycogensynthase kinase 3 beta. Acta Crystallogr Sect D 60:439–446
55. Bhat R, XueY, Berg S, Hellberg S, OrmoM,NilssonY, Radesater AC,Jerning E, Markgren PO, Borgegard T, Nylof M, Gimenez-Cassina A,Hernandez F, Lucas JJ, Diaz-Nido J, Avila J (2003) Structural insightsand biological effects of glycogen synthase kinase 3-specific inhibitorAR-A014418. J Biol Chem 278:45937–45945
56. Kim HJ, Choo H, Cho YS, No KT, Pae AN (2008) Novel GSK-3binhibitors from sequential virtual screening. Bioorg Med Chem16:636–643
57. GSK-3β in vitro kinase assay was done as described previously:The in vitro kinase assay was performed in a 40 μL reaction
volume containing 250 ng GSK-3β Calbiochem, 10 μM pGSpeptide (RRRPASVPPSPSLRHSS(P)HQRR), 10 μM ATP, plus1 μCi γ32P ATP and increasing concentrations of the inhibitors inkinase buffer (20 mM MOPS pH 7.2, 15 mM MgCl2, 2 mMEGTA, 25 mM β-glycerol phosphate, 1 mM Na3VO4, 1 mMDTT). The inhibitors were allowed to bind GSK-3β for 10 minprior to the addition of peptide. The reaction was started by theaddition of the ATP solution and was carried out at 30 °C for30 min after which 25 μL of the reaction mixture was spotted onP81 Whatman filters, dried, washed twice with 0.75% H3PO4, andrinsed with acetone. The dried filters were placed in scintillationvials containing 2 ml of Scinti-safe Econo 2 solution and read in aBeckman Coulter LS 600IC scintillation counter. IC50 determina-tion as below: The data were plotted as average percent activityversus the log of the concentration of inhibitor. The IC50 wasdetermined according to NIH guidelines and the 4-parameterlogistic plot (4PL), which calculates the relative IC50 based on themaximum (top) and minimum (bottom) percent activity as well asthe Hill slope. In some cases the 4PL did not give an accuratefitting of the data (error fit above 40%) and thus a 3-parameterlogistic fit top (3PLFT) or 3-parameter logistic fit bottom (3PLFB)were used to obtain the IC50 using the equation y = Bottom +(Top-Bottom)/(1 + 10^((LogIC50-x)*HillSlope)) from GraphpadPrism 5. This program displays the LogIC50 as well as the IC50
and gives the standard error of the LogIC50, this was convertedback to the % fitting error of the IC50 by using the equation %FE(IC50) = FE(LogIC50)*Ln(10)*100.
J Mol Model (2009) 15:1463–1479 1479