use of isotope techniques in lake dynamics … of isotope techniques in lake dynamics investigations...
TRANSCRIPT

IAEA-TECDOC-1206
Use of isotope techniques inlake dynamics investigations
Proceedings of a final Research Co-ordination meetingheld in Rehovot, Israel, 10-13 March 1997
INTERNATIONAL ATOMIC ENERGY AGENCY /A\
March 2001

The IAEA does not normally maintain stocks of reports in this series They are howevercollected by the International Nuclear Information System (INIS) as non-conventional literatureShould a document be out of print, a copy on microfiche or in electronic format can bepurchased from the INIS Document Delivery Services
INIS ClearinghouseInternational Atomic Energy AgencyWagramerStrasse 5P 0 Box 100A-1400 Vienna, Austria
Telephone (43) 1 2600 22880 or 22866Fax (43) 1 2600 29882E-mail chouse@iaea org
Orders should be accompanied by prepayment of 100 Austrian Schillings in the form of acheque or credit card (VISA, Mastercard)
More information on the INIS Document Delivery Services and a list of national documentdelivery services where these reports can also be ordered can be found on the INIS Web site athttp //www laea orq/mis/dd srv htm

PLEASE BE AWARE THATALL OF THE MISSING PAGES IN THIS DOCUMENT
WERE ORIGINALLY BLANK

The originating Section of this publication in the IAEA was:
Isotope Hydrology SectionInternational Atomic Energy Agency
Wagramer Strasse 5P.O. Box 100
A-1400 Vienna, Austria
USE OF ISOTOPE TECHNIQUES INLAKE DYNAMICS INVESTIGATIONS
IAEA, VIENNA, 2001IAEA-TECDOC-1206
ISSN 1011-4289
© IAEA, 2001
Printed by the IAEA in AustriaMarch 2001

FOREWORD
Lakes and surface water bodies represent an important component of the global watercycle. In many countries, they remain one of the most easily accessible freshwater resources.Lakes play an important role in regulating carbon, nitrogen and phosphorus cycles oncontinents. In addition, sediments accumulating in lakes and surface reservoirs are among themost valuable archives of past climatic and environmental changes on continents, providing arange of time scales from a single year to thousands of years.
Unfortunately, these valuable resources are under a continuous and increasing threat dueto growing anthropogenic impacts, mostly in the form of (1) increasing pumping directly fromthese highly sensitive surface water resources, (2) sewage effluents and, (3) industrialpollutants being discharged directly into lake systems or into rivers and groundwater thatform their catchment areas.
Indeed, the scarcity of water resources is becoming one of the major impediments tosocial and economic development and affects large arid and semi-arid areas. Rapidly growingpopulation as well as unfavourable climatic events and recurrent droughts emphasize the evergrowing need for intensive use of water resources for human agricultural and industrialpurposes.
A large percentage of freshwater supplies are derived from groundwater resourceswhich are being extensively exploited in many parts of the world. However, groundwaterreserves suffer either from high pumping rates often at the limit of the natural recharge rate, orfrom human or naturally induced salinization and pollution. Furthermore, when the rate ofwater withdrawal exceeds the natural replenishment rate of aquifers, especially in arid andsemi-arid areas, groundwater resources are effectively being mined. In order to limit theeffects of this, the use of surface water reservoirs, either natural (lakes and ponds) orconstructed dams and basins used for artificial recharge via infiltration have been developed.Human activities on catchment areas that cause accelerated erosion, salinization, widespreadcontamination of soil by agrochemicals accelerate processes such as the eutrophication ofopen water bodies, and contribute to deterioration of their water quality and aesthetic value.
Therefore, adequate knowledge of internal lake dynamics as well as quantification oftransport and fate of pollutants in such systems is becoming a key issue in management ofsurface water resources in many parts of the world.
The contents of this technical document provide a cross section of different isotopicallybased methodologies that provide an important contribution towards a better understanding ofthe dynamics of lakes and surface reservoirs, as well as to better understand their vulnerabilityto pollution which thus may help to design adequate prevention and remediation strategies.
The IAEA officer responsible for this publication was L. Gourcy of the Division ofPhysical and Chemical Sciences.

EDITORIAL NOTE
This publication has been prepared from the original material as submitted by the authors. The viewsexpressed do not necessarily reflect those of the IAEA, the governments of the nominating MemberStates or the nominating organizations.The use of particular designations of countries or territories does not imply any judgement by thepublisher, the IAEA, as to the legal status of such countries or territories, of their authorities andinstitutions or of the delimitation of their boundaries.The mention of names of specific companies or products (whether or not indicated as registered) doesnot imply any intention to infringe proprietary rights, nor should it be construed as an endorsement orrecommendation on the part of the IAEA.The authors are responsible for having obtained the necessary permission for the IAEA to reproduce,translate or use material from sources already protected by copyrights.

CONTENTS
Summary..................................................................................................................................... 1
Isotopic study of the "Laguna Mar Chiquita", Cordoba, Argentina, and itshydrogeological and paleoclimatological implications.........................................................7C. Dapena, H.O. Panarello
Isotope studies on dynamics and sedimentation in Lake Naini, India......................................17S.M. Rao, U.S. Kumar, K. Shivanna, U.K. Sinha, S. Sharma
The Dead Sea: A model of a desiccating terminal salt lake......................................................33J.R. Gat
Stable isotopic composition of East African lake waters..........................................................43E.O. Odada
Stable isotopes in lakes of High Tatra Mountains, Western Carpathians, Slovakia.................49J. Michalko, D. Bodis, P. Malik, K. Marhevkovd, S. Scherer
3H-3He ages in Lake Baikal ......................................................................................................67R. Hohmann, R. Kipfer, D. Imboden
Dynamics of Lake Koycegiz, SW Turkey: An environmental isotopicand hydrochemical study ....................................................................................................73C.S. Bayari, T. Kurttas, L. Tezcan
Stable isotope study of Lake Turkana, East Africa...................................................................97R.D. Rickets, R.F. Anderson
The lakes of the Jordan rift valley...........................................................................................105J.R. Gat
List of Participants..................................................................................................................115

SUMMARY
The Coordinated Research Programme (CRP) on the "Use of Isotope Techniques inLake Dynamics Investigations" was initiated in 1994. The programme was aimed at assessingthe potential of environmental isotope techniques in studying the dynamics of lakes andrelated problems such as solute dynamics, sediment focusing, establishing the water balancecomponents, and vulnerability of surface water bodies to pollution.
Five research contracts and three research agreements were awarded to the followingMember States, respectively: Argentina, India, Israel, Kenya, the Slovak Republic,Switzerland, Turkey and the United States of America.
This publication is a compilation of the papers presented at the final ResearchCoordination meeting (RCM) held in Rehovot, Israel, from 10 to 13 March 1997, whichbrought the CRP to a successful conclusion. The meeting was organized by the IAEA in co-operation with the Weizmann Institute of Science, Israel. Preliminary results of theprogramme were presented at the first RCM held in Duluth, USA, organized jointly with theLarge Lakes Observatory of the University of Minnesota in 1995.
The CRP enabled a number of isotope and geochemical studies to be carried out onsmall and large surface water bodies, with the general aim of better understanding of thedynamics of these systems under the growing anthropogenic influence. The programme alsoallowed free exchange of information among the most experienced groups from the developedcountries and those teams from the developing world who are just starting to apply isotopetechniques in lake investigations.
The IAEA recognizes the valuable collaboration of the participants in the CRP and theirsignificant contribution to the overall success of the programme. It is expected that the resultspresented in this publication will serve as a valuable reference for future studies related to theassessment and management of surface water resources.
CRP— "Isotope techniques in lake dynamics investigations"
Main objectives
The Coordinated Research Programme (CRP) on the Use of Isotope Techniques in LakeDynamics Investigations was launched with the aim of assessing the potential ofenvironmental isotope techniques in studying the dynamics of surface water bodies andrelated problems, such as:
• dynamics of solutes;• sediment focusing;• establishment of the water balance components;• vulnerability to pollution.
Both large surface water systems such as Lake Baikal, the Dead Sea, the Caspian Seaand Lake Turkana, and relatively small lakes, i.e. Lake Koycegiz, Lake Mar Chiquita andLakes Naini were studied and discussed within the framework of the programme, hi somecases, the work was already well advanced while in others; the CRP gave an impetus toinitiate more comprehensive studies.

The projects implemented in the framework of the present CRP can be grouped into twogeneral categories:
• Methodological developments
The methodological developments are related to the use of isotope techniques in (i)determining the different components of water balance and deciphering dynamics ofsurface water bodies on different spatial and temporal time scales, and (ii)deciphering part behavior of lacustrine systems from isotope proxy data preserved insediments;
• Case studiesCase studies correspond to the application of isotope methods along with othergeochemical tools to investigate specific characteristics of the given surface watersystem (e.g. water level fluctuations, internal mixing processes, salinization, fate ofpollutants).
Overview
During the first IAEA consultants meeting on "Isotope Techniques in LakeInvestigations" held in 1992 in Vienna Headquarters, the major problems were summarised asthree key-questions mainly concerning the state of the-art in lake balance and lake dynamicsstudies:
(i) What is the input of isotope (tracers) in the system as a function of time? What are thelosses by outflow, evaporation and sedimentation?
(ii) What are the average concentration and the mean residence time of isotopes (tracers) inthe lake?
(in) What is the significance of internal recycling?
The main outcomes of the consultants meeting were the definition of four key-points tobe investigated for the study of lakes through nuclear-related techniques:
• Lake balance (hydrological, chemical and isotopic balances), taking into accountsampling at different time-scales (seasonal and long term records) of precipitation (inputfunction), lake water along selected water columns, tributaries, surrounding aquifers,etc. It has to be noted that in lakes with periods of strong vertical mixing, thedetermination of mean concentrations may require only a small number of samples.(a) Precipitation: stable isotope ratios such as !80/160,2E/1H, and 3H/'H.(b) Evaporation rate estimation: 18O/160, 2H/!H, WH and 36C1. All together with in-
situ measurements, and meteorological data collection.(c) Underground and surface inflow and outflow: 18O/16O, 2H/1H, WH, 37C1, and
87Sr/86Sr.
• Lake water dynamics(a) Water movements and mixing: stable isotope ratios such as 18O/16O, 2H/1H, and3H/1H. All together with in-situ measurements, and chemistry (chemical composition ofsolutes).

(b) Water-atmosphere exchanges, and estimation of segregation time of deep watersfrom any contact with the atmosphere: (i) 3H/3He, (ii) rare gases such as 3He, 4He, 20Ne,and 222Rn, and (iii) anthropogenic compounds such as freons, and chlorinatedhydrocarbons.
• Particle and solute dynamics(a) Particle and solutes balances, particles deposition, vertical and horizontaltransport, adsorption/desorption properties, re-suspension, soil erosion on thecatchment, etc.: Nuclear Weapon Testing nuclides such as 137Cs, 90Sr, 10Be, 21° Pb,226Ra, and U/Th series.(b) Seasonal cycling of biological active tracers: I8O/160,13C/12C, 15N/14N, 34S.
13 1*?(c) Redox processes, recycling of carbon and lake ventilation (deep waters) : C/ C,and 14C/12C on both TDIC (total dissolved inorganic carbon) and DOC (dissolvedorganic carbon).
(d) Changes of bottom conditions (e.g. methanogenesis) in association to theconsumption of dissolved oxygen, NOs", Fe3+, etc.: 13C/12C.
• Sediment dynamics(a) Sediment focusing and sedimentation rate: different time scales (0-30 a.: Nuclear
Weapon Testing nuclides; 0-100 a.: 210Pb; up to 500 a.: 32Si; up to 40,000 a.: 14C,10Be; above 40,000 a.: U/Th series).
(b) Sediment mixing and dispersive processes: short lived isotopes (7Be, 228Th,234Th).
In response to these key points, the major themes covered during the wholeimplementation of the CRP, as well as the results of scientific and technical investigations areas follows:
• Lake dynamics
Within this CRP, Hohmann, Kipfer and Imboden have determined the apparent age of bottomwaters in Lake Baikal, the deepest and largest lake by volume on Earth, through combined 3H-3He measurements. The 3H-3He ratio of water gives an estimate of the residence time of deepwaters, and thus allows investigation of their renewal. Maximum 3H-3He ages found are in theorder of 15, 17 and 10 years in the Southern, Central and Northern Basins respectively, with amean renewal rate of about 10 to 15% a"1. As a major result, the authors have also pointed outa decrease in the renewal time of deep waters, from 9.6 a in 1992 to 11 a in 1995.
The Caspian Sea project launched by the IAEA in 1995 aimed at assessing and establishingthe water balance of the Caspian Sea as a prerequisite for the understanding of the water levelfluctuations (2-m rise in almost 20 years). Up to now (results presented during theInternational Symposium on Water Resources, Vienna, 10-14 April 1999), thecomparison/correlation of sea level fluctuations and freshwater inflow variations alreadyobserved has indicated the sea level variations is caused by changes in the river input in thewater budget. The I8O enrichment of deep water of the Central and Southern sub-basin withrespect to surface water indicates that (1) deep water corresponds most probably to theprevious lowstand (1950-1977) and (2) the present-day total inflow exceeded the evaporationby about 10% during the recent level rise. Moreover, the use of isotopic tools (mainly 3H-3Hewhich were detected in the whole water columns of the above mentioned sub-basins

indicating a quite intense water exchange/mixing) allowed the calculation of water residencetime, indicating maximum "ages" of 20 to 25 years for deep water.
The reaction of terrestrial ecosystems, hydrological systems and landscapes to climate changesis clearly one of the most important aspects of global change research. The Caspian Sea canserve as the most characteristic example of the drastic and spectacular changes of suchsystems to hydroclimatic changes. The Caspian Sea has a drainage area that covers some3.5 million square kilometers, from 62°N to 36°N, thus extending across several hydroclimaticregions. However, over geological time, the Caspian Sea has experienced important levelfluctuations which had tremendous consequence firstly, on the natural environments of theneighboring regions. Hydroclimatic changes are reflected in continuous fluctuations of the sealevel of this huge terminal lake, occurring on different time scales, the most recent one beingthe rise of almost 2.5 meters over the past 20 years, which has had disastrous consequencesfor the coastal regions of the riparian countries.
In such problems of hydroclimatic changes, the use of isotope techniques help inunderstanding how "surface water body" systems function at present, and how they functionedin the past, by:
(1) studying the interrelationships between the lake/reservoir and its catchment area(drainage basin),
(2) reconstructing the past climatic and environmental variations which have occurred at alocal, regional and global scale.
• Lake water balance
The study implemented by Dapena and Panarello has focused on the hydrological andisotopic study of the endoreic Lake Mar Chiquita, Argentine Republic, a huge water bodywhich has experienced during the last century (1890-1973) a growth in its size by 3000 km2,and a corresponding decrease in salinity. The establishment of the lake water balance hasconfirmed that (i) the level drop is due to an increase in precipitation, and consequently, todifferent palaeoclimatic conditions, and (ii) lake outputs only correspond to evaporationlosses, implying no downward leakage toward groundwater.
Bayari and co-authors presented the results of the study of Lake Koycegiz located in SouthWestern Turkey. Lake Koycegiz is a meromictic lake, composed of two sub-basins (theSutaniye sub-basin at the South, and Koycegiz sub-basin at the North, connected by a shallow12m deep strait), and located on impermeable ophiolitic rocks, river deposits and karstifiedlimestones. Environmental isotopic and chemical data reveal that Lake Koycegiz has acomplicated mixing dynamics, mainly controlled by density-driven water flow from differentorigins, i.e. (1) rainfall and streamflow as low density waters and (2) high density thermalgroundwater inflowing in the Southern sub-basin, this groundwater input being the majorfactor controlling the lake dynamics. Complete annual mixing cannot be achieved because ofthe density difference between mixolimnion and water inputs, and only about 60% of themixolimnion in both basins is replenished annually. However, turnover times for mixolimnionand monimolimnions of both sub-basins have been estimated at ca 2, 5 and 3.5 yearsrespectively.
Rao and co-authors have employed isotope techniques to study dynamics and sedimentationpatterns of Lake Naini, India. One of the major results of the study is that the lake

groundwater system is a flow through type. Moreover, and in contrast to what was previouslyreported, the lake is not shallowing. A tritium- and water-balance coupled model wasdeveloped and allow for the estimation of lake and groundwater residence time, i.e. 1 and 13to 37 years respectively.
• Development/assessment ofisotopic techniques
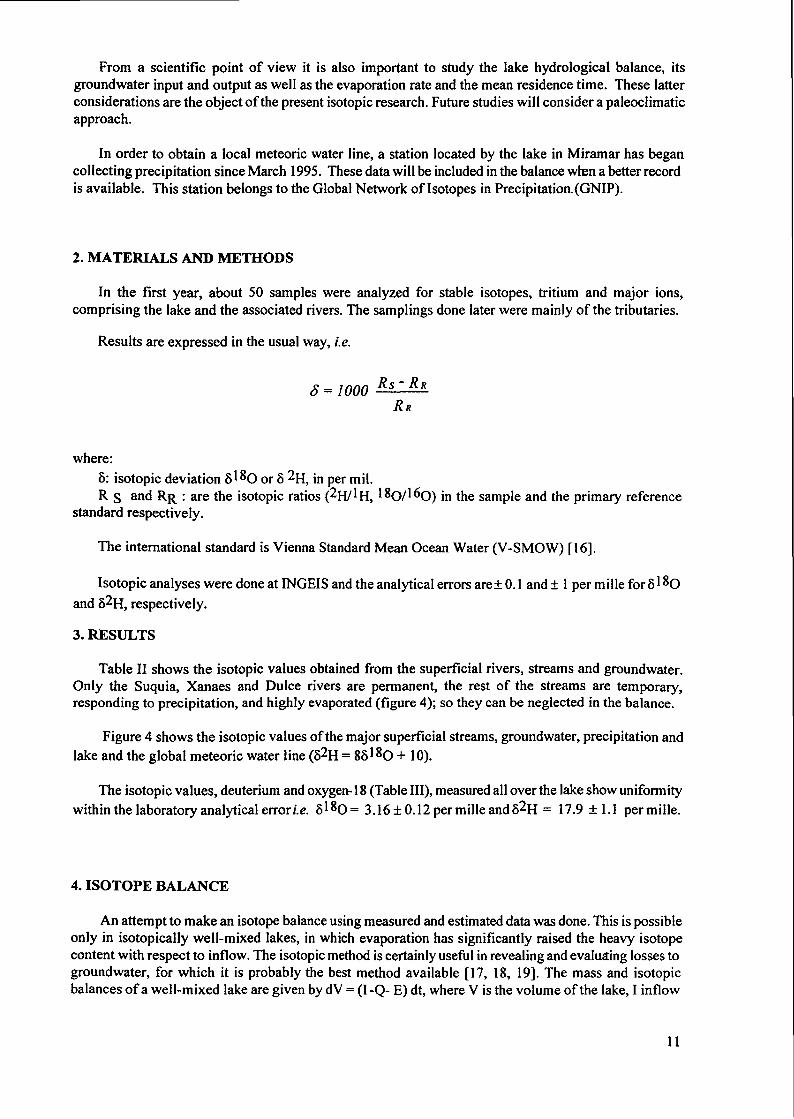
J. Gat presented the first set of 37C1 measurements in the Dead Sea environment. The DeadSea is being submitted to a continuous decline in water level, an increase in salinity and amassive precipitation of evaporites, all points considered as an irreversible evolution of itsstructure. Superimposed to changes in the hydrological regime of the Dead Sea from itsoriginal holomictic regime to short meromictic phases, halite precipitation as well as the re-introduction of the end-brines of the potash plant, have modified the chemical composition ofwaters, with the major consequence of inducing halite precipitation earlier every year.
Michalko and co-authors took their study sites, i.e. lakes, from the Vysoke Tarry Mounts,Slovakia, and obtained the first set of oxygen, hydrogen and sulphate sulphur stable isotopedata in that area within this CRP. The isotope contents of water samples from the two siteshave evidenced that (i) the isotopic enrichment of water from the Furkotska Dolina Valleysystem is related to an altitude effect without signs of evaporation, and (ii) the isotopicenrichment of water from the Strbske pleso lake is due to evaporation, due to either a longerresidence time of water or by recharging it from last (climatic) phases of snow melt.
• Hydroclimatic changes and isotope techniques
E. Odada presented some results on the isotopic composition of surface water samples takenfrom several East African Lakes. Generally, the evolution of stable isotope contents of lakewater are considered as reflecting both water residence time and precipitation/evaporationratio at a global scale. However, lakes from East Africa evolve differently, and one of themaui results indicates that the modern stable isotope composition of lake surface waters seemsto be an interplay between basin size (drainage area), altitude and local hydrological patterns.
Ricketts and Anderson made a detailed study of the relationships between hydroclimaticchanges and the isotopic composition of inorganic carbonates found in Lake Turkanasediments (East Africa). The water level of Lake Turkana has fluctuated widely in response tovariations in climatic conditions, dropping up to 20 m over the last 105 years. This study wasinitiated to compare the historic record of Lake Turkana level to several records of theisotopic composition of fossil carbonates, and to evaluate the use of the stable isotopecomposition of carbonates as a proxy for palaeo-lake level. This investigation evidenced that
i fi(i) the wide range of 8 O values measured on inorganic carbonates could reflect the spatialvariability in lake water isotopic composition rather than higher palaeotemperatures, (ii) thepreliminary use of normalized/stacked data to define the palaeo-lake level curve for LakeTurkana was a much better estimation of the lake past fluctuations than any other lake levelcurve generated with non-normalized data.
Conclusion
The large amount of results gathered during this CRP over eight study sites located inseven countries and presented during the successive meetings confirms the great scientific and

socio-economic interest in using isotope techniques to investigate lake dynamics, lakegroundwater/lake surface watershed interrelations, and sedimentation processes..
Among the new isotopic tools being applied in the framework of the CRP one shouldmention the use of the 3H-3He technique to determine the ventilation rate of deep, large lakes.From the results established within this CRP, it turned out that the two largest and deepestlakes in the world, i.e. Lake Baikal and the Caspian Sea, are relatively well mixed. Thissurprisingly low apparent ages of deep water in both cases points to a high vulnerability tosurface pollution and should be viewed as an important factor in designing propermanagement strategies for these unique systems.
Isotopic tools have also been successfully applied to relatively small lake systemsstudied in the framework of the CRP. Stable isotope measurements helped to determine thecomponents of water balance and the source of salinity in the case of Lake Mar Chiquita,Argentina. Through the present CRP, it has been demonstrated that the value of an inter-disciplinary approach, combining environmental isotopes with hydrochemistry and a classicalhydrometric survey is indispensable for the determination of complex mixing patternsoccurring in small lakes such as Lake Koycegiz, Southwest Turkey and Lake Naini, India.
Isotope techniques played an important role in extensive, ongoing studies of uniquesystems of global significance which are the Dead Sea and the Caspian Sea. These studiesfocused mainly on evolution and recent changes in the dynamics of these waterbodies, and theuse of isotopic tools coupled with hydrological investigations allows for the deciphering ofchanges induced either by anthropogenic forcing or by climate changes.
As a conclusion, and although slightly emphasized in the contributions submitted to thisvolume, the role of lake sediments in deciphering past climatic and environmental changes oncontinents using isotope proxy data was extensively discussed during both meetings of theCRP. Furthermore, reconstruction of past behaviour of lacustrine systems and their responseto external forcing, including climatic changes, always give a better understanding/knowledgeof the functioning of these systems under the present-day conditions, and helps to makeprojections of their response to the ever growing anthropogenic impact more reliable.

XA0100608ISOTOPIC STUDY OF THE "LACUNA MAR CHIQUITA",CORDOBA, ARGENTINA AND ITS HYDROGEOLOGICAL ANDPALEOCLIMATOLOGICAL IMPLICATIONS
C. DAPENA, H.O. PANARELLOInstitute de Geocronologia y Geologia Isotopica,Pabellon INGEIS, Ciudad Universitaria,Buenos Aires, Argentina
Abstract
This work presents the results obtained during the first stage of the investigations carried out in theMar Chiquita lake (Cordoba Province, Argentine Republic) within the framework of the CoordinatedResearch Programme (CRP) on "Isotope Techniques in Lake Dynamics Investigations" of theInternational Atomic Energy Agency. The main objectives are to contribute to the study of this huge waterbody that in the past two decades increased its size almost three folds, to establish its water balance and toasses the influence of the climatic changes on the water budget. This water body is the final receptacle of alarge closed basin formed mainly by the rivers Dulce, Suquia and Xanaes. During 1890-1973 it occupied1800 to 2000 km2 with a salinity of 310-250 g/L. At present, it has around 5000 km2, a maximum depthof 10-12 m and a salinity rounding 42 g/L. The changes in salinity and size are related to an increase inprecipitation which, at the same time, depends on different palaeoclimatic conditions. From a scientificpoint of view it is also important to study the lake hydrological balance, its groundwater input and outputas well as the evaporation rate and the mean residence time. These latter considerations are the object ofthe present isotopic research. Future studies will consider a paleoclimatic approach.
1. INTRODUCTION
This work presents the results obtained during the first stage of the investigations carried out in theMar Chiquita lake (Cordoba Province, Argentine Republic) within the framework of the CoordinatedResearch Programme (CRP) on "Isotope Techniques in Lake Dynamics Investigations" of theInternational Atomic Energy Agency. The main objectives are to contributeto the study of this huge waterbody that in the past two decades increased its size almost three fold, to establish its water balance and toasses the influence of climatic changes on the water budget.
The study of the Mar Chiquita Lake is of great importance since it is the major body of surface waterin our country. Its geology and the chemical characteristics of its waters were studied by many researchers[1, 2, 3, 4, 5, 6, 7, 8]. The geochemical knowledge has a special scientific signification due to theinfluence the lake has over a great coastal environment.
The Mar Chiquita lake lies in a great plain in the Northeast of the Cordoba province, between 30 D20' and 31° 00' South latitude and 62° 10', 63° 10' West longitude. The lake has a tectonic origin, its amean altitude is about 65 m a.s.l. and since 1973 it has had an area of about 5000 km2 (Figure 1).Historic records show that at the beginning of the XXth century and towards 1950 the lake had a minimumsize, while in 1982 it reached the maximum size, generally showing an inverse correlation between sizeand salinity. During 1890-1973 it occupied 1800 to 2000 km2 with a salinity of 310-250 g/L. At present,it is 100-110 km from North to South, 90-95 km E-W, a maximum depth of 10-12 m and a salinity ofabout 42 g/L (Table I).

Research area
Figure 1 Map of South America, showing the research area
TABLE I: Some salinity historic records of the Mar Chiquita Lake.
Year Reference IDS [g/L]
1911 Frank [3] 360.01912 Frank [3] 290.01915 Frank [3] 87.01923 Kanter [3] 137.01930 Frenguelli [5] 258.51953 Bertoldi de Pomar [5] 291.01970 D.P.H. [7] 269.51977 Durigneux [6] 78.71982 CIQAPA [7] 29.81986 Martinez [7] 28.71989 Martinez [7] 35.01991 Michelutti[13] 50.01994 Michelutti [14] 35.01996 Michelutti [15] 42.0

Paso de los Oscaresbridge T
30" 30' S
0 10 20 30k.
rv ° ' ' ' *Balneana/ i /Colonia f 6
San Rafael
OMorteros
Obispo Trejo
Santa Rosa
0Devoto
Figure 2. Schematic map ofLagvna Mar Chiquita, main tributary rivers and sampling points.
This water body is the final receptacle of a large closed basin formed mainly by the rivers Dulce,Suquia (Primero) and Xanaes (Segundo) and a lot of temporary creeks (arroyos) (Figure 2).
The Dulce river originates in the Aconquija Mountain System at 5500 m a.s.l. (Tucuman and Saltaprovinces), it is then dammed at Rio Hondo city and Los Quiroga town, it flows along a great plain for600 km and finally reaches the North shore of the Mar Chiquita lake forming small temporary ponds andwetlands.
The Suquia an Xanaes rivers originate in the Sierras of Cordoba (to the SW of the lake) and reach thelake from the South, forming lowlands.
From a geological poin of view it belongs to a big basin named the "Llanura Chaco Pampeana"province [9]. Both the outcrops in this area and the lake are in Quaternary sediments. In the post-Pliocene a fault system affected the area and the Selva-Tostado horst [ 10]rose. The scarp is around 30m

high and thus acts as a barrier for the water flow (Figure 2). The age of the lake has been related to thatof the Lujanense Stage (approximately 30 ka BP) [11].
Present climate is semi-arid to semi-humid. Precipitation (700-800 mm/year) falls mainly in summerdecreasing from East to West. The mean summer temperature is 24.S3C and the mean temperature for therest of the year is 11,5°C, which decreases from N to S [12].
The chemical composition of the lake water is of the sodium-chloride-sulphate type.
The changes in the salinity and size of the lake are associated with an increase in precipitation and aethus related to different paleoclimatic conditions. Figure 3 shows the annual discharge of the Dulce Riversince 1926. It is the main river carrying water into the lake. In this figure we can see the increase indischarge that occurred since 1973.
oAnnual Volume [ hm 1
26-27 31-32 36-37 41-42 46-47 61-62 67-68 62-63 67-68 72-73 77-78 82-83
YearsFigure 3. Annual discharge of river Dulce.
Martinez [7,8] studied the geochemistry of the lake. He concluded that the composition of its watersoriginated from the concentration by evaporation of the mean tributary water composition. Thecomposition of the concentrated solution was then modified by equilibrium and redox chemicalprocesses.
The high concentration of total dissolved solids results from the progressive accumulation of saltbecause of the deficit in the hydrological balance of the basin. The dissolved salts are carried mainly bythe inflowing rivers, especially the Dulce [8]. In addition, a tributary of the Dulce, named Saladillo,brings salts from the Ambargasta salina during periods of high discharge. These salts are then carried bythe Dulce River to the lake.
Therefore, the hydrodynamic of this lake is complex. Historic records of total dissolved solids showimportant variations with time (Table I) and are also associated with the changes in its volume.
10
From a scientific point of view it is also important to study the lake hydrological balance, itsgroundwater input and output as well as the evaporation rate and the mean residence time. These latterconsiderations are the object of the present isotopic research. Future studies will consider a paleoclimaticapproach.
In order to obtain a local meteoric water line, a station located by the lake in Miramar has begancollecting precipitation since March 1995. These data will be included in the balance when a better recordis available. This station belongs to the Global Network of Isotopes in Precipitatioa(GNIP).
2. MATERIALS AND METHODS
In the first year, about 50 samples were analyzed for stable isotopes, tritium and major ions,comprising the lake and the associated rivers. The samplings done later were mainly of the tributaries.
Results are expressed in the usual way, i.e.
Rs'RR= WOORR
where:6: isotopic deviation 8^O or 8 ^H, in per mil.R s and RR : are the isotopic ratios (^H/^H, l^O/l^O) in the sample and the primary reference
standard respectively.
The international standard is Vienna Standard Mean Ocean Water (V-SMOW) [16].
Isotopic analyses were done at INGEIS and the analytical errors are± 0.1 and ± 1 per mille for 818Oand S^H, respectively.
3. RESULTS
Table II shows the isotopic values obtained from the superficial rivers, streams and groundwater.Only the Suquia, Xanaes and Dulce rivers are permanent, the rest of the streams are temporary,responding to precipitation, and highly evaporated (figure 4); so they can be neglected in the balance.
Figure 4 shows the isotopic values of the major superficial streams, groundwater, precipitation andlake and the global meteoric water line (82H = 8S18O + 10).
The isotopic values, deuterium and oxygen-18 (Table III), measured all over the lake show uniformitywithin the laboratory analytical error i.e. 5^0 = 3.16 ±0.12 per mille and S^H = 17.9 ±1.1 permille.
4. ISOTOPE BALANCE
An attempt to make an isotope balance using measured and estimated data was done. This is possibleonly in isotopically well-mixed lakes, in which evaporation has significantly raised the heavy isotopecontent with respect to inflow. The isotopic method is certainly useful in revealing and evalualng losses togroundwater, for which it is probably the best method available [17, 18, 19]. The mass and isotopicbalances of a well-mixed lake are given by dV = (I -Q- E) dt, where V is the volume of the lake, I inflow
11

Table II: Deuterium and oxygen-18 content of surface water (sw) and groundwaters (gw)
I I II-3.1 -19
-1.7-4.5
-1.8 -17 -6.1-6.4
1.6 8 -7.52.3 7 -5.2
-1.1 -13 -6.3-0.7 -12 -6.8-2.2 -17
-6.3-6.6-6.6
2.3 8 -4.72.1 9 -5.3
-6.5-5.4-5.1-4.1-5.8
1.3 1-2.1 -11-1.5 -13-1.0 -10
-0.22.1
etr\oO62H40 -
2 0 - . - . . . . .
0 ———————
-20 -jf-I* yri isjf >*<•*
-40 -•••-^xf-
ftn '-DO-8 -6
D Suquia ri• Lake: 2m
II III-4.7
-11-24-37 -4.8-40 -6.5-48 -4.6-28-37 -3.4-44 -2.5
-34-41-39-33-37-42 -6.7-31-30-24-37
-2.3-2.3
-113
»
^....... ^Q-.
:£P°#*^^V*
1
-4ver *deep +
III TYPE L O C A T I O N
-27 sw 1 - Suquia river, bridge route 17sw 2 - Suquia river (old river-course)sw 3 - Suquia river mouth
-28 sw 4 - Xanaes river, bridge route 1 7-41 gw 4 -Bridge route 17, 55/70m-30 sw 5 - San Antonio creek
sw 6 - Canada I creek-25 sw 7 - Canada II creek-17 sw 8 - Canada Saladillo creek
sw 9 - Canada Saladillo creek mouthsw 1 0 - Plujunta rivergw 1 0 - Plujunta site, 55/70mgw 1 0 - Phreatic near Plujunta river 20msw 1 1 - San Jose creeksw 1 2 - Cristale creek
-45 gw 13 - Miramar Station, 5 5/70msw 14 - Xanaes River, San Rafael Colonysw 15 - Xanaes river, El Vencedorsw 16 - Suquia river, La Para Stationgw 17 -La Para Station, 5 5/70msw 18 - Utis riversw 19 - Dulce river, Paso de Oscares bridge
-13 sw 20 - Dulce river, Paso de la Cina bridge-11 sw 20 - Dulce river, Paso de la Cina bridge
sw 2 1 - del Plata lake near shoresw 22 - Mar Chiquita lake near shore
1
^^^ tJlstr f^Hisiiiitol.^ iviai v/iiiijuiici
x V^e .^ (~\ lake^^.^ \jf)
. e\.e°x ^^^^
^* * SMOW^
i i i i
- 2 0 2 4 8180 6Xanaes river * Dulce riverGround water ~£~ Precipitation
Figure 4. Deuterium and oxygen- 18 plot of the Mar Chiquita system.
12

Table III: Deuterium and oxygen-18 content of Mar Chiquita Lake at a depth of 2 meters.
SAMPLE NQ[1]
23 - LM1M24 - LM2M25 - LM3M26 - LM4M27 - LM5M28 - LM6M29 - LM7M30 - LM9M31 -LM10M32-LM11M33-LM12M34-LM13M35-LM14M36-LM15M37 - LM16M
S2H
3.23.03.23.33.23.13.03.33.23.23.13.23.13.02.9
161617191916182018181816171818
Averages
SAMPLE ND HI
38-LM17M39-LM18M40-LM19M41-LM20M42-LM21M43 - LM22M44 - LM23M45 - LM33M46 - LM34M
LM36MLM37MLM40MLM41MLM59MLM60M
818O 82H3.16 17.90.12 1.1
52H
3.23.23.23.23.23.03.23.33.33.13.13.22.93.33.3
191818171818182018181717181820
rate, Q outflow rate, E net evaporation rate, considering that the volume of the lake does not changesignificantly with time (steady state). So dV/dt=0 and I=Q+E. Then, by making Efl=k and Q/I=l-k, beingk the fraction of the inflowing water lost by evaporation, and writing this equation in isotopic terms, weobtain [17, 19]:
e_a'
-a
where:SL , 8a = isotopic composition of lake and atmospheric moisture,81 = isotopic composition of inflow: rivers, groundwater and precipitation (La Suela and Santiago delEstero GNIP stations),k = ratio of net evaporation against input fluxes = E/I,h = relative humidity,e = a - 1 + Ae = total isotopic enrichment factor, resulting from the addition of the equilibrium (a-1) andkinetic enrichment factors (Ae),As = kinetic term [19]
a = isotopic equilibrium fractionation factor between liquid water and vapour,x = water activity
13

The input values and the 8O used were:
Precipitation = 5200 hm3 (800 mm/y over 6500 km2)Dulce river =4440hm3 [20]Suquia river = 347 hm3 [21]Xanaes river = 451 hm3 [21]Total =10438hm3
5j = -3.8 %o (weighted value)8a = -15 Xo6L = 3.1696oh = 60-70% (estimated 66 %)Ae = 0.0048288= 9.86%o [22]x = 1
The value obtained for k was: k = E/I = 1.01. This indicates that all the output is by evaporation andsuggests that the lake is not leaking to groundwater, confirming its present steady state.
Variations in the isotope contents of air moisture and in the humidity values significantlyaffects the kvalue. Thus, it will be important to make a record of these parameters, together with temperature, bymeans of thermographic and hydrographic stations located in and around the lake.
ACKNOWLEDGEMENTS
This work was partially supported by the International Atomic Energy Agency (IAEA) through theContract 8066/RB and it is the Contribution ND 159 of the Institute de Geocronologia y GeologfaIsotopica (INGEIS).
The authors thank to Mr. P. Michelutti, keeper of the Provincial Reserve of Laguna de Mar Chiquitay Banados del Rio Dulce by his logistic support, to Dr. H. Nicolli and Dr. D. Martinez who provided uswith the first samples. To the stable isotope staff of INGEIS and in particular to Lie. E. Ducos for herhelp with the language.
REFERENCES
[ 1] BODENBENDER, G., La cuenca del valle del rio Primero en Cordoba, Academia de Ciencias deCordoba, Boletin XII, Cordoba (1890).
[ 2] FRANK, H.,Contribucion al conocimiento de las Salinas Grandes y la Mar Chiquita de la provinciadeCordoba, Centro de Estudiantes de Ingenieria, Revista III, Cordoba (1915).
[ 3] KANTER, H., Das Mar Chiquita in Argentinien, Provincia de Cordoba, Hambugische Universitat,Abhandlungen aus dem Gebiet der Auslandskunde, B.19, Reihe C. Naturwissenschaften, B7, Hamburg(1925).
[ 4] KANTER , H. , La Cuenca cerrada de la Mar Chiquita en el norte de la Argentina, AcademiaNacional de Ciencias de Cordoba, Boletin XXXII, Cordoba (1935) 285-322.
[ 5] BERTOLDI de POMAR, H., El origen de la laguna Mar Chiquita. Tesis Doctoral, UniversidadNacional de Cordoba, Cordoba (1953) 215pp.
[ 6] DURIGNEUX, J. Composition quimica de las aguas y de los barros de la laguna Mar Chiquita en laprovincia de Cordoba. Academia Nacional de Ciencias de Cordoba, Miscelanea 29,Cordoba (1977) 12p.
14

[ 7] MARTÍNEZ, D.E., Caracterización Geoquímica de las aguas de la Laguna Mar Chiquita, Provinciade Córdoba. Tesis Doctoral, Facultad de Ciencias Exactas, Físicas y Naturales, Universidad de Córdoba.República Argentina. Córodba (1991) 274pp.
[ 8] MARTÍNEZ, D., Changes in the ionic composition of a saline lake, Mar Chiquita, Province ofCórdoba, Argentina, International Journal of Salt Lake Research 4, (1995) 225-44.
[ 9] RUSSO, A., FERELLO, A. y CHEBLI, G., Llanura Chaco-Pampeana. En Segundo Simposio deGeología Regional Argentina. Tomo I, Academia Nacional de Ciencias, Córdoba, República Argentina,Córdoba (1979) 139-183.
[10] STAPPENBECK, R., Geología y aguas subterráneas de la pampa. Editorial Pangea, Córdoba,Argentina (1926) 510pp.
[11] CASTELLANOS, A., Posibles desplazamientos morfológicos en el pasado de la redespotamográficas en la llanura cordobesa. Boletín de Estudios Geográficos, Universidad Nacional de Cuyo,19, Argentina (1956).
[12] CAPITANELLI, R.A., Clima. En Vázquez et al. (Editores) Geografía física de la provincia deCórdoba. Fundación Banco de Córdoba, Córdoba (1979).
[13] MICHELUTTI, P., Informes de la Reserva Mar Chiquita y Bañados del Río Dulce. Miramar,Córdoba (1991). Inédito.
[14] MICHELUTTI, P., Informes de la Reserva Mar Chiquita y Bañados del Río Dulce. Miramar,Córdoba (1994). Inédito.
[15] MICHELUTTI, P., Informes de la Reserva Mar Chiquita y Bañados del Río Dulce. Miramar,Córdoba (1996). Inédito.
[16] GONFIANTINI, R., Standards for stable isotopes measurements in natural compounds. Nature 271(1978) 534-536
[17] CRAIG,H. and GORDON, L.I., Deuterium and oxygen-18 variations in the ocean and the marineatmosphere. In: E. Tongiorgi (De.), Stable Isotopes in Oceanographic Studies and Paleotemperatures.C.N.R., Laboratorio di Geologia Nucleare, Pisa (1965) 9-130.
[ 18] FONTES, J. Ch., BOULANGE.B., CARMOUZE, J.P. and FLORKOWSKI,T., Preliminary oxygen-18 and deuterium study of the dynamics of lake Titicaca, Isotopes in lake studies, IAEA, Vienna (1979)145-150.
[19] GONFIANTINI, R., Environmental Isotopes in lake studies, In: Handbook of Environmental IsotopeGeochemistry, Volume 2, The Terrestrial Environment, B (Ed. P. Fritz and J. Ch. Fontes) (1986) 113-168
[20] AGUA Y ENERGIA ELÉCTRICA, Estadística hidrológica hasta 1987, Pluvimetría, Buenos Aires(1988)
[21] AGUA Y ENERGÍA ELÉCTRICA, Estadística hidrológica hasta 1980, Pluvimetría, Buenos Aires(1980).
[22] KAKIUCffl, M. and MATSUO,S., Direct measurements of D/H and 18O/! 6O fractionation factorsbetween vapor and liquid water in the temmperature range from 10 to 40 C, Geochemical Journal 13(1979)307-311.
15

ISOTOPE STUDIES ON DYNAMICS AND XA01 °0609
SEDIMENTATION IN LAKE NAINI, INDIA
S.M. RAO, U.S. KUMAR, K. SHIVANNA, U.K. SINHA, S. SHARMAIsotope Division,Bhabha Atomic Research Centre,Trombay, Mumbai, India
Abstract
Understanding hydrodynamics of a water body like a lake is a prerequisite forplanning and managing its use. In the present study, isotope techniques are employed to studythe dynamics and sedimentation pattern of Lake Naini, in India. From the study a fewobservations are made: (i) the Lake is a warm monomictic one; (ii) the presence of a centrallysubmerged ridge in the Lake plays a vital role in the intermixing of the Lake's two sub-basins;(iii) the Lake-Groundwater system is a flow-through type and (iv) the Lake is not shallowingat a rate reported by earlier investigators and has different depositional zones withconstant/varying sedimentation rates. A Tritium and Water Balance Model is developed toestimate the water retention time of the Lake and also the groundwater residence timebetween precipitation and input to the lake.
1. INTRODUCTION
Lakes, among the various hydrological environments, are usually well suited forstudies using isotope techniques. Lakes, in fact are systems which, although complex, aregenerally accessible at all points for tracer injections, sample collection and in-situmeasurements. An Advisory Group Meeting organised by IAEA in 1977 [1], summarised themajor problems in physical limnology and attempted to indicate solutions which arepracticable with isotope methods.
In the present study, environmental isotope (namely 818O, 5D and 3H) levels andconventional physical & chemical parameters (like Temperature [T in °C], Dissolved Oxygen[DO in rng.L"'], and Electrical Conductivity [EC in uS.cm"1]) are employed to study dynamicsof Lake Naini, in the State of Uttar Pradesh, India. Also environmental 137Cs and 210Pb datingtechniques are employed to estimate the recent sedimentation rate and pattern in the lake. Thestudy was carried out in collaboration with the National Institute of Hydrology at Roorkee.
2. ABOUT THE SYSTEM2.1. Morphometry & Hydrography
Crescent shaped lake Naini (Fig. 1) is a tectonically formed sub-tropical and eutrophiclake situated at an altitude of about 1937 m above mean sea level [latitude 29°24' N &longitude 79°23' E] in the Nainital district of Kumaun Himalayas. The lake is divisible intoMallital (Northeast) basin and Tallital (Southwest) basin due to presence of a submergedtransverse ridge running east-west about 8 m below the lake surface. Maximum and averagedepth of the lake are 27.3 and 18.5 m respectively; the surface area and volume being 465,000 m2 and 8.5 Mm3 respectively. Catchment area of the lake is about 4.9 km2 and fromconventional techniques it is believed that the groundwater contribution to the lake issubstantial. The lake, in addition being a tourist spot, is the only source of drinking water tothe Himalayan city, Nainital.
17

NalnKal /Club /
V.on*. \B.D.Pand, Ho.olt
Fig.l: Location map of Lake Naini [with core sampling stations indicated]
2.2. Meteorology
The annual rainfall in the catchment of Lake Naini ranges from 2200 to 2500 mm. Themonthly maximum rainfall is about 630 mm in August and the minimum is 3 mm in March.Besides rainfall there are occasional snowfalls in and around the lake basin during winter,varying between 20 to 60 mm in recent years. To know the nature of influence of differenthydrometeorological parameters (like water level, rainfall, relative humidity, water & airtemperature, wind velocity & direction etc.) on the dynamics and sedimentation pattern of thelake, a Data Acquisition System (DAS) with 13 sensors has recently been installed at the lakesite by the National Institute of Hydrology, Roorkee.
2.3. Geomorphology and geology of the catchment area
The Naintal Hill forms a synclinorium which is cut diagonally by a fault called Naini Fault(Fig. 2) into two parts. The north-western part is made up exclusively of argillaceouslimestone and marlites whereas the south-western part comprises of dolomite with limestoneand black carbonaceous slates [2]. It is believed that the sub-recent rotational movementswere responsible for blockade of a stream called Balia, in its upper reaches, resulting in theformation of lake Naini. The lake (also other lakes in this region) is related to neotectonicmovements on the Main Boundary Thrust and with the genetically related faults.
18

M II »U *x. •Mdn*r
S-(^ .--feT\y:V;;p^• ™ • zzoz •_•% . r>v . . • -^ • \____";V. X • -X 'XT
LEGEND
Taf
j____j Upper Krol
Fig. 2: Geology map of Lake Naini and its surrounding
3. SAMPLING & ANALYTICAL TECHNIQUES
3.1. Water samplingUsing a depth water sampler a reconnaissance water sampling programme was carried out inMay'94 and water samples from different depths and locations of the lake for environmentalisotope analysis (5D, 5I8O and 3H) were collected, and in-situ measurement of physical &chemical parameters like T, DO and EC made. Subsequently a series of water samplingprogrammes were carried out during Oct. & Dec.'94 and Feb., Mar., May, Jun., Aug., Sep., inFigs. 3a and 3b respectively and Nov.'95 at selected locations & depths of the lake, groundwater, streams and from the springs within and outside the catchment for the analysis of theabove parameters. A few monthly rain samples were also collected near the lake and atdifferent altitudes in its catchment for the isotope analysis. The water sampling locations inthe lake and in its catchment are shown.
3.2. Analysis of water samplesDeuterium analysis of the water samples was carried out on the hydrogen gas obtained
by quantitative reduction of water with granulated zinc at about 450°C [3]. For thedetermination of oxygen-18 in the water samples, the most commonly used technique of CO2equilibration method was employed. In this method, the isotopic exchange at 25°C, betweenthe water samples and CO2 of known oxygen - 18 content is carried out [4]. The overallprecision of the measurement is ± 0.2 and ± 1 %o (at 1 a criterion) for 8I8O and 5Drespectively. All values are relative to V-SMOW. For the measurement of tritium in the water
19

samples, the liquid scintillation counting technique, subsequent to electrolytic enrichment,was employed. The overall measurement error is about ± 0.5 Tritium Units (TU) at lacriterion (equivalent to 0.12 Bq.L"1).
Fig. 3a: Water sampling locations in Lake Naini
Fig. 3b: Water sampling locations in the catchment
20

3.3. Core samplingCore samples were collected at different locations in the lake using a gravity corer, its
outer and inner diameter being 6.0 and 5.2 cm respectively. Most of the sampling stations (ref.Fig.l) are from the eastern side of the lake since a large number of gullies loaded withconsiderable amount of sediments join the lake basin at those stations. The length of the coresobtained ranged in size from 15 to 60 cm. With the help of an adjustable piston rod withsilicone packing, the obtained cores were extruded vertically and sliced at 2 cm intervals.Sliced core sections were stored in the laboratory. Measurements were made of the bulkdensity before drying samples in an oven at a temperature slightly above IOO°C for about 7 to8 hours prior to analysis. The dry unit weight, water content, and porosity were also estimatedafter drying. The textural composition of the core samples was mainly clay and silt. The claymineralogy assemblage of this lake mainly consists of montomorillonite, illite, kaolinite, andchlorite besides the mixed layer minerals, which are typical high altitude clays [5].
3.4. Analysis of core samples
The determination of 210Pb content is based on the a - measurement of its grand-daughter, namely 2l°Po, which is assumed to be in secular equilibrium with its parent. Thebasic radiochemical procedure involves adding of 208Po as a yield tracer, leaching thesediment samples with aqua-regia, the residual solids are filtered off and the solution is driedand converted to chloride with concentrated HC1. The final solution is taken in 0.5 M HC1.Polonium nuclides are then spontaneously deposited on silver planchettes by adding ascorbicacid in the HC1 solution prior to a counting using Si surface barrier detector connected to amultichannel analyser. The standard counting error of measurement is generally less than 10% in the upper sections of the cores and slightly higher values at the deeper sections since thecounting time is kept constant for the entire core sections. As the supported 210Pb results fromthe decay of 226Ra present in the sediment core with which it is in equilibrium, estimation of226Ra activity is determined directly by a counting. The I37Cs activity in each section isdetermined by gamma counting of the oven-dried samples using high purity Germaniumdetector coupled with a 4096 channel analyser system. A 137Cs standard, having essentiallythe same geometry and density is used. The samples are counted for about 500 min to obtain agood statistical accuracy. The detection limit for 137Cs by this method is about 0.25 mBq.g"1
and the standard counting error is less than 10 % in the core sections.
4. ISOTOPIC RESULTS
4.1. Lake
From the monthly SD and 818O values of the lake water samples, it is observed that thesurface water samples showed highly enriched isotopic values compared to the bottomsamples. This is due to evaporation of water at the surface of the lake. Also a clear seasonalvariation in the stable isotopic values of lake water samples were observed.4.2. Precipitation & altitude effect
From fig.4, it can be seen that the 8D and 8I8O values of the precipitation fall close toGlobal Meteoric Water Line (GMWL). It is known that there is an altitude effect in the 8Dand SI8O values of precipitation [6]. This is in the range - 0.2 to - 0.7 %o per 100 m for 8I8O.Figs. 5a and 5b show the 8D and 8I8O values of precipitation samples as a function of altitude(h, in meters) and the relationships obtained are:
818O = - (4 .0xlO°)h-3 .07 (1)
(n = 12, r2 = 0.85, significant at 0.05 level) and
21

5D = - ( 3 x l ( T 2 ) h - 2 8 (2)
(n = 12, r2 = 0.75, significant at 0.05 level)
I8Thus the altitude effect is - 0.4 %o and - 3.0 %» per 100 m for 5O and 6D respectively
-20-
-40-
g -60
-80-
100
ooooo Feb.'95DODOO Jul.'95AAAAA Axig.'95
Sep.'95-15 -10 -5 0
Fig. 4: 5D Vs 518O plot of rainwater
Q•o
-7Ui o
-80
-90
£>-.o
-100 i . . . . . ^—————, , , . ,1750 2000 2250 2500
Alti tude (m)
Fig. 5a: Variation of 5D values inrainwater with altitude
oCO
-y-
-10
-11-
-12-
-13
o
1750
o
o
2000 2250 2500Altitude (m)
:!&/•Fig. 5b: Variation of 5 O values in rainwaterwith altitude
5. DISCUSSION
5.1. Lake dynamicsThe water dynamics of lakes (i.e. mixing and transport of water) is of interest for
planning their usage for domestic and industrial purposes, flood control or power generation.In the latter two cases, knowledge of flow dynamics of the lake helps to predict how theoutflow rate, or the capacity of the lake will be affected by changes in the inflows. Wheneverthe water is to be used for irrigation or for drinking, the concentration dynamics of
22

conservative and/or non-conservative pollutants is of interest. The concentration dynamicswill describe the outflow response to change in inflow concentration of a given substance.
A conservative (inert) component is not degraded (physically, chemically orbiologically) during its passage through the lake, while non-conservative components undergoa process of loss or accumulation. The concentration dynamics of inert soluble matter is ageneral property of the lake, being determined by the flow, mixing pattern and the residencetime distribution in the lake. The concentration dynamics of a specific non-conservativecomponent is obtained by superimposing its kinetics of loss (or accumulation) on theconcentration dynamics of inert soluble matter. Dynamics of Lake Naini is thus a pre-requisite for more quantitative applications like water balance studies, determination of waterretention time etc. In the following section a few observations on the dynamics of lake Nainiis made from the spatial and temporal distribution of all the parameters under discussion.
The (monthly) depthwise distribution of environmental isotopes (8D and 618O) alongwith in-situ physical & chemical parameters of the lake water are shown in Figs. 6a to 6f.From the figures, it is clearly seen that the change in the in-situ physical & chemicalparameters as well as the isotope contents with depth show correlative trends. The lake isstratified for 7 to 9 months a year (usually form March/April to October/November). Thestratification builds up quickly in March and is very strong in summer. During thestratification periods, the metalimnion (i.e. the region of relatively rapid change of density) isseen at a depth of 3 m during the months of March/April to June/July and at a depth of 6 mduring the remaining periods of the stratification. The winter overturn is during Novemberand since then the lake is well mixed for 3/4 months (i.e. from November/December toFebruary/March). During the well mixed condition the whole water mass or just parts of itcirculate if there is enough wind. The EC of lake waters, during stratified periods and duringthe well mixed periods, is more or less constant. Therefore it appears that the stratificationseen here is, by and large, a thermally induced one and not one induced by soluteconcentration. The vertical distribution of all the above parameters (ref. Figs. 6a to 6f)indicates a higher levels at a few deepest points. This may be due to the groundwater recharge(in the form of underwater springs) at those points & depths. Most of the inferredgroundwater recharges are seen near the submerged ridge in the centre, through the majorfractures are in the north-east of the lake boundary, along the existing fault plane and near theexisting dyke in the south-west sub-basin (ref. Fig. 2).
The isotopic composition of hypolimnion does not remain constant during the periodof stratification and the 6 values of hypolimnion and those of the epilimnion are not correlatedwell. This probably indicates the water retention time of the lake is very short and lack ofcorrelation between the 8 values of hypolimnion and epilimnion indicate independent inflowcomponents to the two regions. The uniform tritium content of the lake during thereconnaissance survey in May 1994 (i.e. about 11.2 ± 0.5 TU) gave a clear indication, inadvance, that the stratification seen during that period could be a seasonal and the lake isexpected to be well-mixed during winter.
The presence of the submerged transverse ridge about 8 m below the lake surface hasan important control on the dynamics of the lake. Its presence inhibits the mixing of deeperwaters of Mallital with Tallital and thus the two sub-basins of the lake exhibit differentialbehaviour. This is confirmed by the slight variations in the levels of all the tracers underdiscussion, particularly at deeper depths (ref. Figs. 6a to 6f).
The stratification in the lake has profound consequences on the physical, chemical andbiological phenomena in the lake. For example, aeration occurs in the epilimnion, while in thehypolimnion anaerobic conditions prevail. In lakes the vertical component of water transportis of greatest interest in the understanding of mass flux and mass balance. Traditionally,vertical transport is expressed by the generalised Picks' law with a vertical turbulent diffusioncoefficient. Since no satisfying theory exists to calculate the coefficient from basichydrodynamic principles, field data on temperature or chemical tracers are commonly used to
23

Temperature (t)12 18
Dissolved Oxygen (mcM)2 4 6 6 200 350 520 680 »W 1000
. I ... I . -T ... I n_ . i i T .. I i I
O O May 94a Oct 94
A A Dec 94• • Feb 95* * Mar 95—— May 95
Temperature (t)6 12 IB
I o o May 94o ° Feb 95
4 Mar 95• Aug 95
o «May 94 „o nDec 94 1Z
• • Feb 95 »+ -t Mar 95—— May 95
EC (A 3 em'1) 4ttO C'..)200 360 520 680 640 1000 Jl -10 -9 -8 -7 -6 -5 -t. -60 -54 -«» -42 -36 -30
oMay 94" Dec 954 Feb 95« Mar 95• May 95* Aug 95
I Feb 95- «• Mar 95
• May 95* Aug 95
Fig. 6a to 6c: Monthly depthwise distribution of environmental isotopes and in-situ physical& chemical parameters of the Lake waters at locations A3, C2 and El, respectively
Fig. 6d to 6f: Monthly depthwise distribution of environmental isotopes and in-situ physical& chemical parameters of the Lake waters at locations E3, H2 and Jl, respectively
24

determine vertical eddy diffusivity [7]. Therefore, assuming that the change in depth of thethermocline in Lake Naini is predominantly governed by wind induced mechanical stirring,the following hydraulic parameters of the Lake Naini are obtained from the record of periodicvertical temperature structure of the lake based on a methodology suggested by Blanton [8]:(i) an approximate value of the vertical diffusion coefficient (Kz) is about 0.1 to 0.05cm2.s"'; (ii) the rate of entrainment, which indicates the mixing process in the epilimnion isabout 1.3 x 10"3 to 6.7 x 10"5 cm.s"1 and (iii) an empirical value of the mean static stability, aparameter which is a measure of the resistance to an exchange- supporting force, such aswind, during the period of stratification is in the range of 9 x 10"5 to 1.5 x 10"3 s"2.
5.2. Determination of Water Retention Time of the Lake and Residence Time of its sub-surface input using a Tritium- Water- Balance Model
The injection of tritium (3H, half-life ~ 12.43 a) into the atmosphere via thermonuclearbomb tests carried out during early 1950's and '60s has provided a useful tracer forinvestigating hydrological balances, water residence times, and mixing in lakes, rivers, andoceans [9 & 10]. Tritium from these tests was rapidly incorporated into precipitation andbecame part of the hydrologic cycle. Thus, tritium levels in precipitation compiled by theInternational Atomic Energy Agency [11] from the World Meteorological Organisationmonitoring network for the peak fallout years can be used as a quantitative function of tritiuminput for hydrological studies. In this study an attempt is made to calculate hydrologicalproperties such as water retention time (T) of Lake Naini and residence time of itsgroundwater T using the (fallout) tritium balance and (conventional) water balance equations.
5.2.1. Formulation of the Tritium- Water- Balance Model
The volume of water contained in Lake Naini changes as a function of inputs andoutputs. The inputs consist of direct precipitation (//•) and inflow of stream water (Is) andground water (la), and the outputs consist of evaporation (On) and outflow as groundwater(Go) or stream water (0s)- Therefore the lake water balance is given by:
dV(3)
dt
-3 -1where — is the rate of change of lake volume, either in units of m.a" or m .a" . Since thedtmeasured tritium content of the lake in 1994 was fairly uniform (i.e. about 11.2 ± 0.5 TU)throughout the lake, the lake can be considered isotopically well mixed (i.e. the tritiumcontent of the outflow components of groundwater and stream water are equal to that of thelake, (Ti.); usually this is a case for a water body wherein mixing is fast relative to theresidence time of water). Assuming that the Lake Naini has been at hydrological steady state(i.e., the inputs and outputs have been balanced) during the past four decades, thecorresponding tritium balance of Lake Naini would be:
—- = 7>. IP + Ts. Is + TG. IG - TE. OE - TL. OG - TL. Os-TL.A.V (4)dt
where T, represents the respective tritium content of the above water balance component (inTritium Units, TU) and last term being the decay term (where X is the radioactive decayconstant of tritium [0.0557 a"1]). In Lake Naini, Os refers to the sum of quantity of water that
25

is being pumped out from the lake for drinking purpose and that which is being releasedthrough an existing sluice gate during the periods of incessant rains. Ti is defined by [9] as:
a.Ts-h.TATE = —— 7——— (5)c& (1 -h)
In Eq. 5, h is the relative humidity, TA is the tritium content of the water vapour over the lake,a is the equilibrium fractionation factor for tritium between liquid and vapour phases (~ 0.9),Ts is the tritium content of the lake surface water, and a. is the kinetic fractionation factor (~1.1) . The change produced by evaporation and molecular exchange can be positive ornegative, depending on the relative tritium content of the lake water and precipitation.
Eq. 4 is divided by volume, V to give
— - = 7>. KIP + Ts. Kis + To. KIG - TE. KOE - TL. Koc - TL. Kos - 71. A (6)dtwhere KIP, Kis, and Kit, are the ratio of volume rate of water that enters the lake as directprecipitation, stream water, and groundwater, respectively, to that of the lake volume and/Cos, KOI,, and KOE being the fractions that leave the lake as stream water, groundwater, andevaporation, respectively. For a steady-state system (i.e. no increase or decrease of volumewith time), the Water Retention Time (T) is defined as the inverse of sum of either KIP, Kis,and KK, or of /Cos, K<x,, and KOE [12]. Since the lake volume is assumed to be a constant (i.e.hydrologic steady state), from eq.3 it can be obtained that:
Kit- + Kis + KIG = Kos + Koc + KOE (7)
In addition, the tri t ium content in the water vapour over the lake is assumed to be inequi l ibr ium with local meteoric water, (i.e. TA = a.Tp, which is a reasonable assumption for amid-continental, temperate-zone setting [13]). Tritium measurements in water vapour andlocal precipitation in the arid Dead Sea region of Israel have shown this approximation to bevalid [10]. Even tritium in water vapour over the ocean has been shown to be in equilibriumwith precipitation rather than with the ocean water [14]. Now assuming piston-flow ofgroundwater:
TG,t = Tp,,-r.e-*r (8)
where To,/ is the tritium content of the groundwater at any time, t and 7>,» - r is the tritiumcontent of the precipitation at a time t-r (where T is the residence time of groundwater).Now discretising the eq. 6 in a time step of one year (chosen based on the availability ofhydrological and isotopic data of the lake) it becomes:
Ti,<-Ti.,-\ = Ti;t.Kir+Ts,t.Kis + Tr,i-T.e~i* .KiG-0' *"', '"'-''' .Koi.a>\\-h\-Ti.i. KOG - TL, ,. Kos - TV., i. A (9)
Since the catchment of Lake Naini is small, for practical purposes it can be assumed that7\ , = Tr i (i.e. the stream waters entering the lake undergo negligible change in their tritiumcontent during their travel from the catchment to the lake in the form of atmosphericexchange). Therefore the above equation can be rearranged to get:
T-h\
h.a.KoE
Ti\ «4l -h
, rTP. i.\ KIP + Kis +
26
— -r —— rai\\-h\J
(10)

Using Eq. 7, the most difficult water balance components, namely Koc and KK;, in the
above equation are expressed in terms of T
K/G = — - Kis - KIP respectively.
as Koc = — - Kos - KOE and
TL,,.\\-KOE! 1-a
a«(\-h)_ ,,\ KIP+KIS+ h.a.KoE
Tp,i-r.e~Ar\--Kis-Kip' I T"1
^ 1
(ID
5.2.2 Model output
Now for a known value of Kip,K/s,KoE,h,a, and a., the tritium content of LakeNaini in 1994 is calculated using the above equation for different values of T, pre-1953trit ium content of the lake, and T. The values of T/-, for the period 1953 to 1987, werereconstructed from the nearest available IAEA-WMO precipitation network stations, namelyKabul and New Delhi. An explanation of the development and use of this correlation isavailable in IAEA Technical Bulletin #206 [15]. For the periods before 1953 and after 1988, aTV value of 5 to 15 TU was assumed. Changing the pre-1953 tritium content of the lake from0 to 20 TU results in a change of less than 0.5 TU in the model calculated tritium content ofthe lake in 1994. So the uncertainty in the pre-1953 tritium content of the lake and in the pre-1953 TV values does not significantly affect the results.
The tritium content that would be present in lake Naini water in 1994 were computedusing the model for different values of T and T.. If the value of WRT ~ 25 years, the amountof water entering the lake is less than that lost by evaporation, indicating that the Lake Nainiis a terminal lake. This solution is not possible, so calculations were carried out only for WRTless than 25 years and found that for a single value oft, the calculated tritium content of theLake in 1994 does not change beyond a WRT of 2 years. It was also observed that the modelcalculated tritium value of the Lake water in 1994 (for different values oft) would match themeasured value of 11.2 ± 0.5 TU in 1994 only when the WRT is about 1 year.
Therefore, for a T of 1 year, the model calculated tritium content of Lake in 1994 fordifferent values oft is shown in Fig. 7. As seen from the figure, the calculated tritium content
W R T of lake = 1 year
0 10 20 30 40 50Residence Time of Groundwater (year)
Fig. 7: Model calculated tritium content of the Lake in1994 for WRT = I year and different values ofgroundwater residence time
27

of Lake in 1994 reaches as high as 76 TU for a T of 30 years and a lower value of 10.3 TU fora \ above 42 years. The measured tritium content of 11.2 + 0.5 TU in 1994 lake watersmatches only for T of 0, 13 and 37 yrs. Since one of the u/s springs in the Lake catchmentmeasured a tritium value of 9.2 ± 0.5 TU and the lake tritium level is lower than the presentday precipitation of about 14.2 ± 0.7 TU, T cannot be zero. Therefore the T could be either 13or 37 years. This ambiguity in the interpretation of the i is mainly due to the variable tracer(tritium) input function. Therefore for springs with a constant outflow, at least two tritiumlevels determinations taken in a large time span are required to estimate the age of its water.Or this ambiguity can also be overcome to certain extent by a proper hydrogeologicalinterpretation of the isotopic data. However, the lower value appears more acceptable fromthe local hydrogeology. The model calculated yearwise tritium content of lake Naini with its tbeing 13 years and 37 years (WRT being 1 year) is shown in Fig. 8.
1500 -T
1000 -
3 500 -
Residence time of GW = 13 yearsW R T of lake = 1 yeat
Measured lake H level in 1994
-I—I—I—• •l"""l—I1950 1960 1970 1980 1990 2000
Year
1500
Residence time of GW = 37 yearsW R T of lake = 1 year
O Measured lake M level in 1991
1950 1960 1970 1980 1990 2000Year
Fig. 8: Model calculated yearwise for a) WRT = 1 year and groundwater residence time of13 years, b) for WRT = 1 year and groundwater residence time of 37 years
5.3. Estimation of recent sedimentation rate and pattern of lake Naini usingenvironmental l37Cs and 2IOPb dating technique
In tracing the history of man's impact on the environment it is evident that in manyplaces the period of greatest impact lies within the last 150 years. Lake sediments provide abasis for reconstructing many aspects of this impact, for estimating rates of change, and forestablishing a baseline in environmental monitoring programmes [16]. In such studies theestablishment of accurate chronologies of sedimentation is of vital importance not only fordating events but for determining sediment accumulation rates also. Furthermore,sedimentation rates based on palynological or stratigraphy methods often provide onlyhistorical averages involving many meters of sediment. Such measures not only lack thenecessary accuracy and detail, but may not adequately reflect the rates within the upper 20 cmor so of sediment where significant sediment water exchanges are occurring at the presenttime [17]. Application of radiometric methods to sedimentary geochronology has enjoyedconsiderable success [18]. In the present study, environmental 2l°Pb and '37Cs datingtechniques are employed to determine the recent sedimentation rates and pattern in LakeNaini .
A few selected core sample, namely samples collected from locations V and S [inTal l i ta l basin] and Q [in Mallital basin] in the lake, (ref. Fig. 1), were analysed for 210Pb andlj7Cs. The depth profiles of (total) 210Pb and l37Cs in the core samples, and also the availableporosity and water content profiles are shown in Fig. 9. There are three different models;CONSTANT FLUX and CONSTANT SEDIMENTATION RATE [CFCS], CONSTANTFLUX [CF] and CONSTANT INITIAL CONCENTRATION [CIC], that are being widely
28

used for dating Pb deposits with or without significant mixing during deposition [19].However none of the models is universally applicable. In practice the type of model to beused is usually decided on the depthwise distribution of (total) 210Pb concentration [19]. Theestimated sediment accumulation rates in Lake Naini at different locations, both in linear andmass units, obtained from I37Cs and 210Pb dating techniques, are given in table 1, along withthe 210Pb model used. From the table, it appears that the lake is not shallowing at a ratereported by earlier investigators [20 & 21]. The possibility exists that Lake Naini is subsidingapproximately at the same rate it receives the sediments [5]. It seems that the Lake hasdifferent depositional zones with constant/varying recent sedimentation rates. Thesedimentation rate at Tallital basin is comparatively higher than at Mallital basin. In a study toknow the factors affecting distribution of lead and other trace elements in sediments of LakeMichigan, it was observed that organic matter is more important in the complexation of lead
Total J1"Pb cone (mBq/g.)
0
10
I 20
** 30
f « O J
50
SO
0
10
? 20
J, 4O
SO
BO
0
1O
f 20
3 30
1*0
50
SO
1OO 200 30O 4OO
/?
10 :
20:
3O-
4Oi
so;
6O
mC» cone. (mBq/g)
.50 ......1.00 ISO 2QO
f
100 200 30O 400
50 100 ISO 2OO
SO 100 1SO 200
_ZO
10:
20
30-
40
SO:
80
10
20
3O
4O-
SO-
BO-
Poroaity («)
36 60 I
Wot.r conUnt («)
35 50 65 BO
2O 35 SO Si 6O
0
10
20
30
40
SO'
60
0
10
20
3O
40-
SO-
SO
10-
20:
30J
40-
50:
GO-
40 6O
20 40 6O BO 10O
40 6O 80 1OO
Fig. 9: Depthwise distribution of 2l°Pb, l37Cs, (available) porosity and water content in thecore samples.
in lake water and sediments than absorption on clay of hydrous oxides [22]. On the otherhand, the dominant mechanism of ion-exchange with the clay component of sediment and soilresults in the removal of l37Cs from the water column [23]. Therefore, the observed spatialdistribution of superficial (i.e. top 2 cm core section) l37Cs and (total) 2l°Pb in the sedimentsof lake Naini may reflect patterns of deposition of two major sedimentary components,namely clay and organic carbon respectively.
An attempt was also made to use the textural properties of the lake sediments (likeporosity and water content) to identify and assess the possible effect of sediment focussing,slumping, inhomogenity in the sediment composition etc. on the obtained 2l°Pb (and l37Cs)profiles (ref. Fig. 9). Sediment focusing is a process whereby water turbulence movessedimented material from shallower to deeper zones of a lake. According to Hakansons'scheme [24], the 50% water content of surficial sediments in a lake sediment core marks thetransition between zone of erosion and transportation, and 75% water content of surfacialsediments marks the transition between zone of transportation and accumulation. However asit can be seen from Fig. 9, the surfacial water content in the obtained core sediments of lake
29

Table 1. Sedimentation rates and inventories of 210Pb and l37Cs in Lake Naini.
Samplingstation (waterdepth in m) average sedimentation rate
uPb "Cs superficial inventory'
model linear mass linear mass total 137Cs ratioused (cm.a"1) (g.cm"2.a'') (cm.a"1) (g.cm"2.a~') 210Pb
V(24) CFCS 0.48 ± 0.112 ± 0.60 ± 0.140 ±0.016 0.30 0.12 2.460.40 0.010 0.07
Q(20) CF 0.64 ± 0.150 ± 0.70 ± 0.168 ±0.007 1.06 0.16 6.620.18 0.041 0.03
S(20) CF 1.24 ± 0.289 ± 1.35 ± 0.315 ±0.018 1-53 0.26 5.870.44 0.104 0.05
surficial inventories are in Bq.cm"'
Naini is above 75% and therefore there is no sediment focusing taking place in the samplinglocation of the lake.
The porosity profile for homogeneous sediments with uniform compaction usuallyshow an exponential decrease with depth [25]. But in Lake Naini, the profiles are notexponential type. Also the lake bottom slopes gently at the sampling locations and do notfavour any major slumping. This probably indicates that the non-monotonic 10Pb profiles (atlocations Q and S) and/or lower sediment-water interfacial 2l°Pb concentration (at alllocations) in lake Naini is the result of the actual change in the sedimentation rate withvarying sediment composition and dissimilar histories of deposition taking place at thosesampling stations.
6. CONCLUSIONThus from the present study a few conclusions are made: (i) the lake is a warm
monomictic lake and the two sub-basins show a differential behaviour; (ii) it seems that thelake-ground water system is a flow through type; (iii) the WRT of the lake is about 1 year; (iv)the possible age of groundwater is 13 or 37 years and (v) the lake is not shallowing at a ratereported by earlier investigators and has different depositional zones with constant/varyingsedimentation rates.
ACKNOWLEDGEMENTS
The present study was carried out within the framework of the IAEA's Co-ordinatedResearch Programme on "Isotope Techniques in Lake Dynamics Investigations". Theinvestigators express a deep sense of gratitude to their colleagues (S.V. Navada, A. R. Nair,T.B. Joseph and U. P. Kulkarni) for their help in the isotope analysis of water samples andalso to K.M. Kulkarni and Noble Jacob for their help in the preparation of this manuscript.The help provided by Bhishm Kumar and Nachiappan of Nuclear Hydrology Division,National Institute of Hydrology, Roorkee during the field visits is highly acknowledged. Wesincerely thank T. M. Krishnamoorthy, S. K. Jha and V.K. Shukla of EnvironmentalAssessment Division of our centre for their help in the analysis of core samples.
30

REFERENCES
[I] Studies (Proc. Panel Vienna, 1977), IAEA, Vienna (1979).[2] VALDIA, K.S., Geology and natural environment of Nainital Hills, Himaun
MORTIMER, C.H., Some central questions of lake dynamics. Isotopes in LakeHimalaya. Gyanodaya Prakashan - Nainital (1988).
[3] NAVADA, S.V., Applications of Environmental Isotope Geochemistry inHydrological Studies, Ph.D. Thesis (1988) 1 - 40.
[4] EPISTEIN, S., MAYED, T.K., Variation of oxygen-18 content of waters from naturalsources. Geochim. Cosmochim. Acta, 4 (1953) 213 - 224.
[5] JAUHARI, P., HASHMI, N.H., On the surfacial sediments of the fresh water NainiLake, Himaun Himalaya, India. Proc. Indian natn. Sci Acad. 60, A, (1994) 675 - 682.
[6] DANSGAARD, Stable isotopes in precipitation, Tellus, 16 (1964) 436 - 468.[7] IMBODEN, D.M., JOLLER, TH., Turbulent mixing in the hypolimnion of
Baldeggersee (Switzerland) traced by natural radon-222. Limnol. Oceanogr. 29(1984)831 -844.
[8] BLANTON, J.O., Rates of vertical entrainment in stratified lakes. (Proc. Hydrology ofLakes Symposium, 1973), Helsinki, Juillet (1979) 301 - 305.
[9] IMBODEN, D.M., WEISS, R.F., CRIG, H., MICHEL, R.L. AND GOLDMAN, C.R.,Lake Tahoe geochemical study. Limnol. Oceanogr., 22 (1977) 1039-1051.
[ 10] CARMI, I., GAT, J.R., STILLER, M., Tritium in the Dead Sea. Earth Planet. Sci. Lett.71 (1984)377-389.
[ I I ] INTERNATIONAL ATOMIC ENERGY AGENCY Environmental isotope data:World survey of isotope concentration in precipitation. IAEA-TECHDOC-96,117,129,147,165,192,VIENNA(I969,1970, 1971,1973,1975,1979).
[12] MICHEL, R.L., KRAEMER, T.F., Use of isotopic data to estimate water residencetimes of Finger Lakes, New York. J.Hydrol. 164 (1995) 1-18.
[ 13] JACOB, H., SONNTAG, C., An 8-year record of the seasonal variation of 2H and 18Oin atmospheric water vapour and precipitation of Heidelberg. Germany. Tellus 43B(1991)291-300.
[14] WEISS, W., ROETHER, W., The rate of tritium input into the world ocean's. EarthPlanet. Sci. Lett. 49 (1980) 435-446.
[15] INTERNATIONAL ATOMIC ENERGY AGENCY, Statistical Treatment ofEnvironmental Isotope Data in Precipitation. IAEA-TECDOC- 331, VIENNA (1992)
[16] WALLING, D.E., HE, Q., Towards improved interpretation of l37Cs profiles in lakesediments. In geomorphology and sedimentology of lakes and reservoirs, (Mamanus,J., Duck, R.W., ED.), Wiley (1993) 31-52.
[17] ROBBINS, J.A., EDGINGTON, D.N., Determination of recent sedimentation rates inLake Michigan using Pb-210 and Cs-137. Geochim. Cosmochim. Acta 39, (1975) 285-278.
[18] DURHAM, R.W., JOSHI, S.R., Recent sedimentation rates, 210Pb fluxes and particlesettling velocities in Lake Huron, Laurentian Great lakes. Chem. Geol. 31 (1980) 53 -66.
[19] CRICKMORE, M.J., TAZIOLI, G.S., APPLEBY, P.G., OLDFIELD, F., The use ofnuclear techniques in sediment transport and sedimentation problems. TECHDOC inHydrology. UNESCO, Paris (1990).
[20] SHARMA, A.K., Structural Study of Area East of Nainital with Special Reference tothe Hillslide instability. Unpubl. Ph.D. Thesis, Kumaun University, Nainital (1981)126pp.
[21] RAWAT, J.S., Morphology and morphometry of Naini lake, Kumaun, LesserHimalaya. Geol. Soc. India. 30 (1987) 493 - 498.
[22] LEYLAND, H.V., SHUKLA, S.S., Factors affecting distribution of lead and othertrace elements in sediments of southern Lake Michigan. In Trace Metals and Metal-Organic Interactions in Natural waters, (SINGER, P.C., Ed.),.Ann Arbor Science,ANN Arbor. Mich. (1973) 89-129
[23] JENNE, E.A., WAHLBERG, J.S., Role of certain stream-sediment components inradio-ion sorption. U.S. Geol. Surv. Prof. Papers 433-F (1968) 16 pp.
[24] HAKANSON, The influence of wind, fetch and water depth on the distribution ofsediments in Lake Vanern, Sweden. Canadian J. Earth Sci. 14 (1977) 397 - 412.
[25] ATHY, L.F. Density, porosity and compaction of sedimentary rocks. Bull. Amer.Assoc. Petrol. Geol. 14 (1930) 1-24.
31

THE DEAD SEA: A MODEL OF A DESICCATING TERMINAL SALT LAKE
J.R. GATDepartment of Environmental Sciences and Energy Research,Weizman Institute of Science, XA0100610Rehovot, Israel
Abstract
The continuing decline in the water level of the Dead Sea and the commensurate increasein salinity and precipitation of evaporates results in an irreversible evolution of the structure ofthe sea. The Dead Sea has been switching from its holomictic regime to short meromicticphases of up to 4-year duration, following the particular rainy winters of 1980 and 1992. Themassive precipitation of halite in recent years, as well as the re-introduction of the end-brines ofthe potash plant, is changing the ion composition of the Dead Sea waters. This necessitates theadjustment of the equation-of-state of the brine and the solubility curve of halite. Oneconsequence is that the onset of halite precipitation during the summer occurs earlier and earlierin the annual cycle. New isotopic measurement of 837C1 of the brine and evaporate depositsand of 518O in dissolved oxygen in the water column have yielded new information ongeochemical processes in the Dead Sea system. A systematic monitoring of the oxygen andhydrogen isotopes in the Dead Sea waters has, unfortunately not been continued in recent yearsand should be encouraged for the future.
1. INTRODUCTION
The Dead Sea represents the ultimate, highly mineralized, terminal lake of the JordanRiver system whose water balance is under extreme anthropogenic stress. The resultanteverchanging situation of the lake and, in particular, the changing water level, increase insalinity, precipitation of salts and the exposure of new coastal land areas have provided themajor motivation for research. (Fig. 1).
An intensive measurement campaign of hydrographic and other parameters, during theyears from 1975 to the beginning of the nineties have established the general pattern ofbehavior. Many of the findings were published in the literature and summarized in the book"The Dead Sea - the Lake and its Setting (T. Nieni, Z. Ben-Avraham. and J.R. Gat, editors) justnow published by Oxford Press [1].
Compared to the rather intensive research effort during these 15 years, lack of funding hascurtailed field operations in recent years. A minimal record of the ever-changing lake systemhas, however, been provided by Anati and coworkers [2] through periodic hydrographicmonitoring of the water column at the deepest part in the center of the lake (bottom at -729,MSL)offEin-Gedi.
2. HYDROGRAPHIC DEVELOPMENT OF THE LAKE
The hydrographic development is being triggered by the decline of the surface waterlevel, which resulted in the historic termination of the centuries-long meromictic state by anoverturn of the water column early in 1979 [3]. Fig. 2 shows the position of the surface levelduring the recent years. The general trend is a secular drop of about 60 cm per year of the lake
33

Sea of Beth
Galilee SheanBasin
•1500 100 r200 300
Distance (km)
Fig. 1: Location plan and section
34

Year
-3851!
-390920
~ -395
-400in"S -405Q
-410
-415 L
1930 1940 1950 1960 1970 1980 1990 2000
Fig. 2: Hydrograph of the Dead Sea level since 1929
surface level. In 1980 and 1992, following relatively large amounts of freshwater inflows thelake level rose. Apart of these two special years, the levels dropped even faster, 80 cm per yearwith very little variability of <2%.
Following the overturn observed in February 1979 a very weak stratification wasestablished during summer 1979 by virtue of a temperature balance which scarcelyoverbalanced the inverse salinity gradient [4]. An imminent overturn in the fall of 1979, whichwould have established a monornixis, was prevented by the early onset of freshwater inflows ofthe 1979/80 rainy season. A further overturn only took place in Dec. 1992.
From that time to the present, the Dead Sea entered a phase in which it switches from onemixing regime to another. Hutchinson [5] defines a "meromictic1 lake as one in which part ofthe deep water is stabilized, and a "holomictic" lake as one which can go freely through annualcirculation periods. A new and more precise definition of these regimes became necessary thenfor the case of the Dead Sea, which was formulated by Anati as follows: a period is defined as"meromictic" if it is longer than one seasonal cycle; it begins with the onset of a stablestratification, and terminates with the first overturn. A "holomictic" period is a non-meromicticperiod which comes between meromictic periods. According to this definition, it begins withan overturn and terminates with the onset of a stable stratification.
The bars at the bottom of Fig. 3 indicate these changes of regime. According to thisdefinition, the 1979-1980 holomictic period is revealed as considerably shorter than a wholeholomictic year as it was previously considered to be. During the two decades represented inFig. 3, the Dead Sea has been switching from holomictic to meromictic at particularly rainywinters, staying then meromictic for a typical period of four years.
Judging from these two decades of Dead Sea hydrography since 1977, the combinedcontribution of rain, floods, springs, and minor rivers runoff, has been almost negligible incomparison with the Jordan river surges which followed the openings of the Degania dams.
35
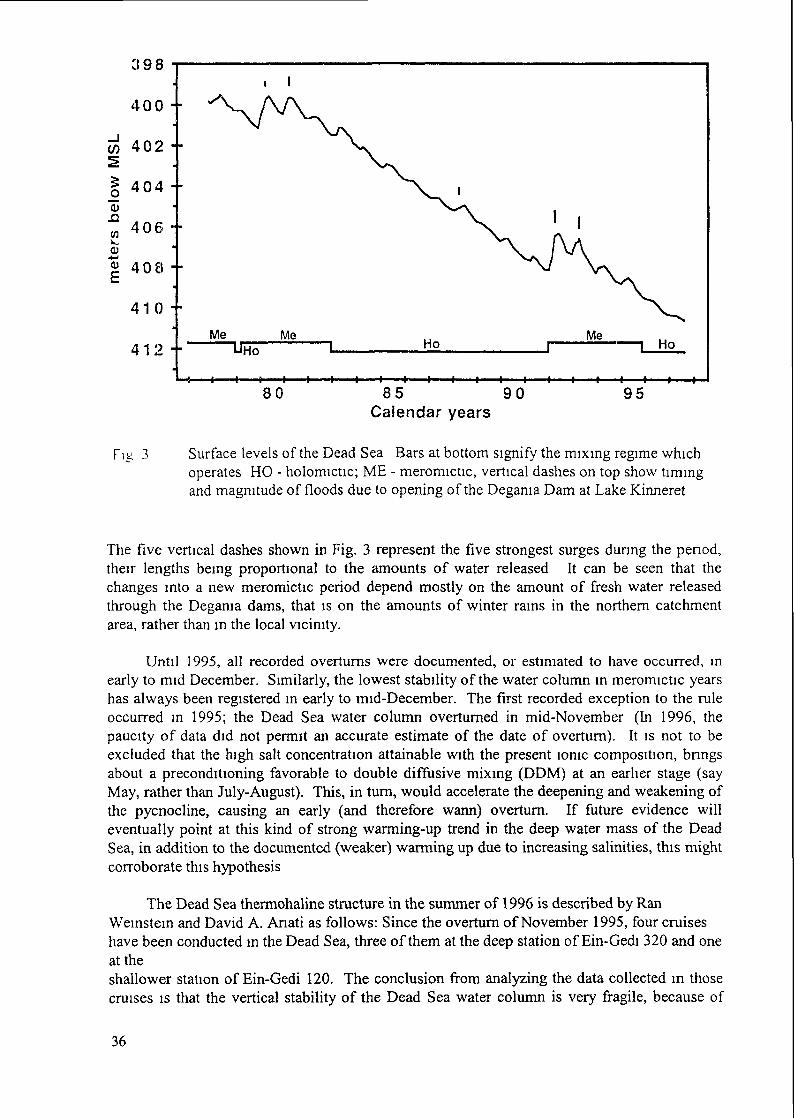
398
400 -•
GO 402 ••2
4 0 4 -0).aw 406 ••
408 - •
410 -•
412 -•Me Me Ho Me
-I——I——«——I——i——H80 85 90
Calendar years95
Fig 3 Surface levels of the Dead Sea Bars at bottom signify the mixing regime whichoperates HO - holomictic; ME - meromictic, vertical dashes on top show timingand magnitude of floods due to opening of the Degama Dam at Lake Kinneret
The five vertical dashes shown in Fig. 3 represent the five strongest surges during the period,their lengths being proportional to the amounts of water released It can be seen that thechanges into a new meromictic period depend mostly on the amount of fresh water releasedthrough the Degama dams, that is on the amounts of winter rains in the northern catchmentarea, rather than in the local vicinity.
Until 1995, all recorded overturns were documented, or estimated to have occurred, inearly to mid December. Similarly, the lowest stability of the water column in meromictic yearshas always been registered in early to mid-December. The first recorded exception to the ruleoccurred in 1995; the Dead Sea water column overturned in mid-November (In 1996, thepaucity of data did not permit an accurate estimate of the date of overturn). It is not to beexcluded that the high salt concentration attainable with the present ionic composition, bnngsabout a preconditioning favorable to double diffusive mixing (DDM) at an earlier stage (sayMay, rather than July-August). This, in turn, would accelerate the deepening and weakening ofthe pycnocline, causing an early (and therefore warm) overturn. If future evidence willeventually point at this kind of strong warming-up trend in the deep water mass of the DeadSea, in addition to the documented (weaker) warming up due to increasing salinities, this mightcorroborate this hypothesis
The Dead Sea thermohaline structure in the summer of 1996 is described by RanWemstem and David A. Anati as follows: Since the overturn of November 1995, four cruiseshave been conducted in the Dead Sea, three of them at the deep station of Ein-Gedi 320 and oneat theshallower station of Ein-Gedi 120. The conclusion from analyzing the data collected in thosecruises is that the vertical stability of the Dead Sea water column is very fragile, because of
36

destabilizing salinity gradient, and apparently, we can expect an overturn of the Dead Seabefore winter.
The thermocline is very sharp just below 21 in. The temperature difference between theepilimnion and the hypolimnion is 11.5°C; that gives the column stability of 5 su. Thisdifference is seasonal and it builds during spring and summer. This year (1996) the temperaturestructure is maintaining the stability of the water column.
The detailed salinity structure of the uppermost 40 m shows that there is an unstablestructure resulting from poor inflow of fresh water during the winter, and evaporation of surfacewater that increase the concentration of salinity below the surface.
2. SALINITY
The chemistry of the Dead Sea waters, and in particular its mineral load, is its mostnotable attribute. Aptly, the Hebrew name for the Dead Sea is the "Salt Sea". Many studieswere concerned with explanation of the particular ion composition of the brine.
Zak summarizes the situation as follows: the waters of the present-day Dead Sea are a Ca-chloridic brine, with over 330 g/1 dissolved ions, and with unique high Br content of about 5g/1. The same brines occur as interstitial water in formations adjacent to the lake, as do anumber of other brines known from springs and boreholes around the lake. All these brines arederived from three basic types: 1) Diagenetic type brine, originally evaporated seawater of theGulf of Sedom and later modified by Mg'Ca exchange into Ca-Mg-Na-K-Cl-Br water (withCa2+ > HCC>3 + SC>42~, which has obtained its Ca by exchange of its original (marine) Mg withthe Ca of carbonate sediment of the Dead Sea Group and of the surrounding pre-rift Cretaceousand older carbonate rocks, and which has lost most of its original sulfate by precipitation withthis sequestered Ca; 2) Meteoric waters, dilute to mesohaline, whose composition has seawateraffinity (airborne seasalts); 3) Metamorphic brine, the result of incongruent alteration anddissolution of hydrous evaporate minerals of the Dead Sea Group, which represent phases ofdesiccation of the successive marine and lacustrine water bodies.
The Dead Sea, which reaches a depth of about 325 m, may be regarded as an outcrop ofbrine, partly fossil, partly of recent derivation, which pervades both the Dead Sea Group and thedownfaulted Mesozoic formations flanking and underlying it.
The waters of the open lake, the Dead Sea brine sensu stricto, maintain their compositionby mixing processes with the above solutions combined with multiple progressive andregressive evaporation cycles, with periodic precipitation of halite, and occasionally ofcamallite. The processes also take place along hydraulic pathways created by the Rift'smarginal faults, which provide porosity and moreover enable brines to sink to depths ofgeothermal heating. The evolution of the Dead Sea brines can be considered a characteristicmodel for the hydrochemistry of continental rift-basins, temporarily connected with the ocean.
The relative ionic composition of the Dead Sea brine changes through the years, andtherefore the equation of state of its waters [r = f (T, S, P)] also changes through the years, andmust be revised periodically. It was assessed in 1980 [6], and then again in 1990 [7]. Althoughthe rate of salt deposition has not been measured since 1992, indirect evidence points to asubstantial increase during the present holomictic period of 1995-97. This massive saltdeposition, combined with the reinjection of extremely dense "end brines" to the main water
37

body, is expected to have changed the relative ionic composition of Dead Sea brines at anenhanced rate, and the latest assessments of the equation of state may well deserve beingupdated already. The same can be said of other properties: saturation, heat capacity, viscosity,etc.
The change of salt composition affects not only its equation of state, but also that of thesolubility of the evaporitic salt and foremost that of halite. In a multicomponent solution suchas the Dead Sea brine, solubility is not only a function of total salinity and of temperature, butalso of the ion composition. The effect of components other than NaCl, especially of thealkaline earth cations Mg and Ca, is to decrease the thermodynamic activity of the Na and Clions, and thus one witnesses a salting out effect. Indeed in the Dead Sea brine the halitesolubility is only about one third of that of pure NaCl solution. Thus every time that massivehalite deposition occurs, the NaCl solubility line is shifted in temperature-salinity space, and theonset of halite precipitation occurs earlier in each annual cycle.
The detailed and accurate prediction of this effect on the pattern of evaporate depositionis of concern but has not been fully resolved.
In addition to the geochemistry of major ions, some minor components have come toattention. Recently the mass balances of nitrogen and phosphorus have been addressed byNissenbaum and Stiller. In the Dead Sea the very limited biota provides the opportunity ofstudying long-term mass balance of nutrients while decoupling geochemical factors frombiological effects. Average ammonia in the water column rose from about 5.9 - 6.7 mg N L"1 inthe pre-1979 overturn period to 7.5 mg N L"1 in 1981 and 8.9 mg N L"1 in 1991. This increasecould not be accounted for by the decrease of lake volume due to the decline in lake level. In1977, during the destratification process, the water below 150 m depth still retained the sameammonia values as in the lower water mass during the stratified stage, indicating that theisolation of the deep waters still persisted. Following the 1979 overturn, the dissolvedammonia concentration became fairly homogeneous. Calculation of the quantity of inputs ofammonia from surface sources, such as runoff, perennial saline and fresh water springs and theJordan River are shown to be of secondary importance as compared with diffusion from thesediments. Pore waters from the sediments in the deepest part of the lake showed increasingconcentration of ammonia with depth, of up to 58.5 mg N-NH3 L"' at 45 cm depth. However,calculation of the 1981 and 1991 nitrogen inventories showed that there must be an additionalsource of ammonia. It is tentatively assumed that the oxygenation of the entire water columnafter the 1979 overturn, and especially during the 1982-1991 monomictic stage resulted inmineralization of much of the dissolved organic nitrogen reservoir. Nitrate and nitrite are verylow in the Dead Sea (about three orders of magnitude less than ammonia) and it can be shownthat the nitrate load is compatible with recent, pollution-derived, sources. Dissolved andparticulate phosphorous concentrations in the lake are quite low, at about 35 mg P L"1 dissolvedphosphate, and 30 to 50 mg P L"1 for particulate phosphate. The dissolved phosphatedistribution in the water column is fairly homogeneous, except for somewhat higher values nearthe sediment-water interface. Particulate phosphate, on the other hand, shows greater vertical,spatial and temporal variability. Mass balance calculations showed that the two major sourcesof phosphate are diffusion from the sediments (mostly) and phosphate introduced by the JordanRiver. The mean residence time of dissolved phosphate is about 60 years. The exact mode ofits removal is unknown, but co-precipitation with authigenic aragonite seems a plausiblemechanism.
38

3. GAS EXCHANGE
Gases are another chemical component whose geochemistry is strongly affected by thehigh salinity so that freshwater studies have little relevance to the Dead Sea story. Dissolvedoxygen was scrutinized by Shatkay et al. [8]. They concluded that the oxygen profiles in theDead Sea follow the hydrographic structure of the water column, as determined by the physicalvariables (namely salinity, temperature and density), but also suggest the presence of chemicalprocesses, such as oxygen reduction in the deeper part of the water column. It seems that thedominant source of reducing material is allogenic organic matter, brought in mainly by floodsduring the winter months.
From the data so far accumulated, it is evident that gas exchange rates are high onlyduring winter months when strong winds and higher energy wave regime conditions prevail. Atother times (especially during summer months), the deduced piston velocities are extremelylow, lower even than the values found in the laboratory for conditions of diffusive transportacross a fully developed boundary layer. Possibly this might indicate the presence of organicfilms at the water surface, which inhibit gas transfer across that interface. As a result the DeadSea is mostly undersaturated with respect to DO, and thus seems to be a 'permanent sink' forincoming atmospheric oxygen.
A more recent study on the isotopic composition of dissolved oxygen by Luz andBarkan, who found a 7%o enrichment in 818O (62) in the deep waters relative to the surfacewaters, suggests that there occurs bacterial oxidation in the deep waters of the Dead Sea. Theirreasoning is based on a decline in the (VAr ratio, from which an isotopic discrimination of-18%o is calculated which is typical for bacterial oxygen consumption.
4. ISOTOPIC MEASUREMENTS
The measurements of the stable isotope composition of the Dead Sea waters, which werereported in detail in two papers in the past [9,10], were unfortunately not continuedsystematically.
However, some new measurements of other isotopic tracers were conducted, foremost onchlorine isotopes. An abstract of this work by Stiller and coworkers [11] which was accepted inApplied Geochemistry for publication in 1998 reads as follows:
This study presents the first set of 837C1 measurements in the Dead Sea environment.837C1 values for the meromictic (long-term stratified) Dead Sea water column prior to itscomplete overturn in 1979 were -0.47%o SMOG for the UWM (Upper Water Mass) and+0.55%o SMOG for the LWM (Lower Water Mass). The 537C1 values for the pre-overtumDead Sea cannot be explained by the prevailing model on the evolution of the Dead Sea duringthe last few centuries and require corroboration by more measurements. The 1979 overturnwiped out almost completely the isotopic differences between the UWM and LWM. Even so,chlorine isotope data could be used to decipher physical processes related to the overturn suchas incomplete homogenization of the deep water mass. Inputs into the lake, comprising freshwaters (springs and the Jordan River) and saline springs gave a range of -0.37%o to + 1.0%o withthe fresh water sources being more enriched in 637C1. Based on the 837C1 measurements of theEnd-Brine (the effluent from Dead Sea evaporation ponds) and of recent Dead Sea halite, thechlorine isotopic composition of the originating brines have been estimated. They gave a
39
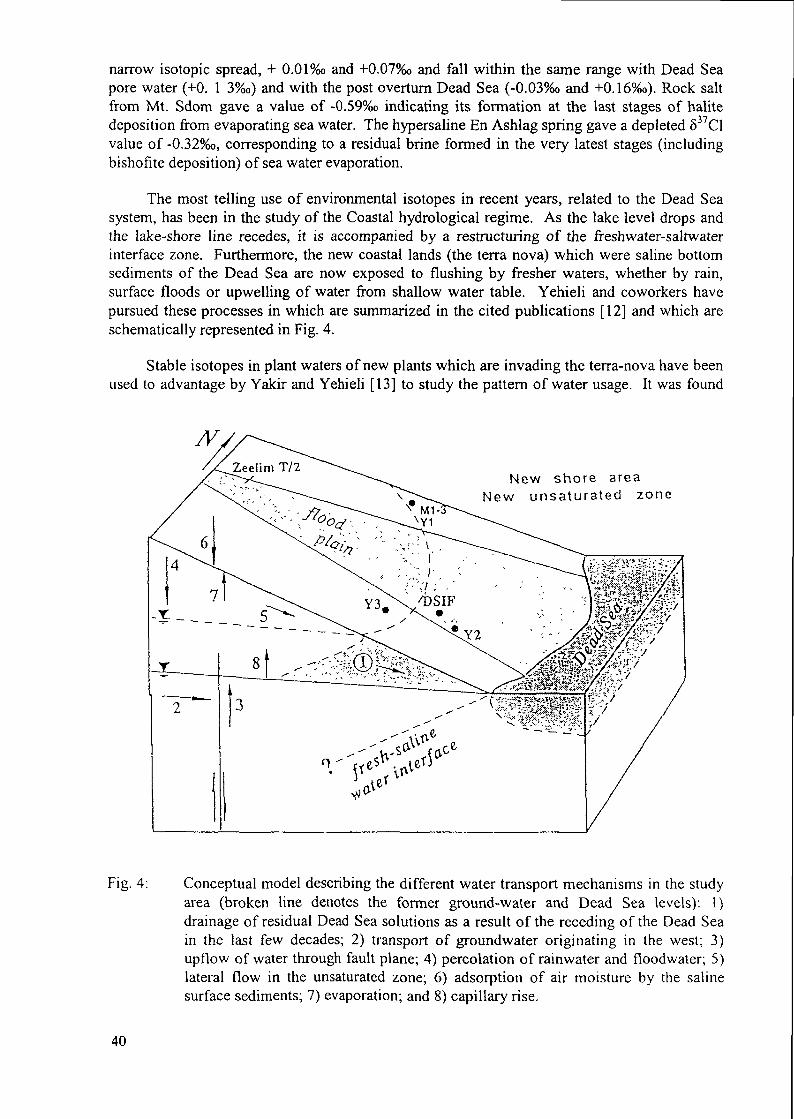
narrow isotopic spread, + 0.01%o and +0.07%o and fall within the same range with Dead Seapore water (+0. 1 3%0) and with the post overturn Dead Sea (-0.03%o and +0.16%o). Rock saltfrom Mt. Sdom gave a value of -0.59%o indicating its formation at the last stages of halitedeposition from evaporating sea water. The hypersaline En Ashlag spring gave a depleted 837C1value of -0.32%o, corresponding to a residual brine formed in the very latest stages (includingbishofite deposition) of sea water evaporation.
The most telling use of environmental isotopes in recent years, related to the Dead Seasystem, has been in the study of the Coastal hydrological regime. As the lake level drops andthe lake-shore line recedes, it is accompanied by a restructuring of the freshwater-saltwaterinterface zone. Furthermore, the new coastal lands (the terra nova) which were saline bottomsediments of the Dead Sea are now exposed to flushing by fresher waters, whether by rain,surface floods or upwelling of water from shallow water table. Yehieli and coworkers havepursued these processes in which are summarized in the cited publications [12] and which areschematically represented in Fig. 4.
Stable isotopes in plant waters of new plants which are invading the terra-nova have beenused to advantage by Yakir and Yehieli [13] to study the pattern of water usage. It was found
New shore areaNew u n s a t u r a t e d zone
SP•/Ft^yy??/mm/rc^
Fig. 4: Conceptual model describing the different water transport mechanisms in the studyarea (broken line denotes the former ground-water and Dead Sea levels): 1)drainage of residual Dead Sea solutions as a result of the receding of the Dead Seain the last few decades; 2) transport of groundwater originating in the west; 3)upflow of water through fault plane; 4) percolation of rainwater and floodwater; 5)lateral flow in the unsaturated zone; 6) adsorption of air moisture by the salinesurface sediments; 7) evaporation; and 8) capillary rise.
40

that the plants appear to ignore the more saline water pockets in the soil zone (which aremarked by enrichment of heavy water isotopes and preferentially use up fresh water lenseswhich can be related to recent floodings of the area.
REFERENCES
[I] NIEMI, T., BEN-AVRAHAM, Z., GAT, J.R. (Eds.). The Dead Sea: - The Lake and itsSetting. OXFORD MONOGRAPHS ON GEOLOGY AND GEOPHYSICS, no. 36,Oxford University Press, 281 pages, (1997).
[2] ANATI, D., Private communication (1997) on results of hydrographic survey of theDead Sea water masses.
[3] STEINHORN, I., ASSAF, G., GAT, J.R., NISHRY, A., NISSENBAUM, A., STILLER,M, BEYTH, M, NEEV, D., GERBER, R., FRIEDMAN, G.M., WEISS, W., The DeadSea: deepening of the mixolimnion signifies the overture to overture of the watercolumn, Science 206 (1979) 55-57.
[4] ANATI, D.A., STILLER, M., SHASHA, S., GAT, J.R., Changes in the thermo-halinestructure of the Dead Sea, 1979-1984, Earth and Planetary Science Letters 84 (1987)109-121.
[5] HUTCHINSON, G.E., A treatise on limnology, Wiley Press, NY (1957).[6] STEINHORN, I., The density of Dead Sea waters as a function of temperature and salt
concentration, Israel J. Earth Science 29 (1980) 191-196.[7] ANATI, D.A., How much salt precipitates from the brines of a hyper-saline lake? The
Dead Sea as a case study, Geochem. Cosmoch. Acta 57 (1993) 2191-2196.[8] SHATKAY, M., ANATI, D.A., GAT, J.R., Dissolved oxygen in the Dead Sea seasonal
changes during the holomictic stage, Internal. J.Salt Lake Research 2 (1993) 93-110.[9] GAT, J.R., The stable isotope composition of Dead Sea waters, Earth and Planetary
Science Letters 71 (1984) 361-376.[10] HORITA, J., GAT, J.R., Deuterium in the Dead Sea: remeasurement and implications
for the isotopic correction in brines, Geochem. Cosmochem. Acta 53 (1989) 131-133.[ I I ] STILLER, M., KAUFMAN, R.S., LONG, A., NISSEMBAUM, A., CI-37 in the Dead
Sea system - Preliminary results, Applied Geochemistry (in press).[12] YEHIELI, Y., GAT, J.R., "Geochemical and hydrological processes in the coastal
environment of the Dead Sea", In: The Dead Sea, the Lake and its Setting (NIEMI, T.,BEN-AVRAHAM, Z., GAT, J.R., Eds.), Oxford University Press, (1997) 252-265.
[13] YAKIR, D., YECHIELI, Y., Plant invasion of newly exposed hypersaline Dead Seashores, Nature 374 (1995) 803-805.
41

STABLE ISOTOPIC COMPOSITION OF EAST AFRICAN LAKE WATERS
E.G. ODADAChief Research Investigator,Department of Geology, XA0100611University of Nairobi,Nairobi, Kenya
Abstract
The investigation of stable isotopic composition of East African lake waters was conducted byscientists from the Department of Geology, University of Nairobi as part of the International Decadefor the East African Lakes (IDEAL) project and in close collaboration with the scientists from LargeLakes Observatory of the University of Minnesota and the Isotope Hydrology Laboratory of theIAEA in Vienna. The Research Contract was part of the IAEA Co-ordinated Research Programmeon Isotope Techniques in Lake Dynamics Investigations, and was sponsored by the Agency.
Water and grab sediment samples were obtained from East African Lakes during the month ofJanuary and February, 1994 and July/August 1995. Water samples were analysed for oxygen anddeuterium isotopic composition at the IAEA Laboratories in Vienna, Austria. In this final paper wereport the results of the study of oxygen and deuterium isotopic composition from the East Africanlake waters.
Introduction
Since 1990, we have observed that most if not all lakes in East Africa had a rapid decrease in lakelevel. Rocky shorelines in Lake Baringo for example indicate a decrease of at least 1 metre duringthis period. Lakes Elmenteita and Nakuru have almost run dry. Whether the current trend in lakelevels in East Africa is a local response to current drought conditions in sub-Saharan Africa or toglobal warming is subject to speculation. This situation provided a unique opportunity to monitorand study the changes in the isotopic composition of the lake waters as well as the chemical andecological responses of small lakes to these changes.
Objective
The primary objective of this project is to study temporal changes in the chemical and isotopiccomposition of lake waters induced by climate change in the tropics, and the ecosystem response tothese changes. The other objective was to establish a lake water sampling programme in East Africacovering different climatic setting, altitude, mean annual temperature, rainfall and chemistry (Table1, Fig. 1) in order to investigate seasonal variability in isotopic composition of precipitation in theregion.
Methods
Lakes that were sampled (Fig. 1) were selected to cover a wide latitudinal as well as altitudinal,range (Table 1). This selection was done with the aim of trying to establish anevaporation/precipitation gradient as well as a temperature gradient. In each lake, between one andthree grab sediment samples were obtained using an Ekman dredge. Surface water samples wereobtained coincidentally with the grab samples. The waters were filtered with a .45m filter paper andthree 250 ml portions were saved to be later analysed for major anions, cations and isotopes. Fieldtitrations were also performed to determine alkalinities. Measurement of water temperature pH,conductivity and total dissolved solids (TDS) were also carried out.
43

Water samples were analysed for oxygen and deuterium isotopic composition at the InternationalAtomic Energy Agency Laboratory in Vienna, Austria. Sediment samples were analysed at theUniversity of Minnesota, and at the University of Nairobi.
Results
The deuterium and 18O content of lake waters in East Africa is presented in Table 2. The result isreported in conventional delta notation (5) as parts per thousand deviation of the isotope ratios H/'Hor 18O/I6O relative to the standard V-SMOW (Vienna Standard Mean Ocean Water). The deuteriumexcess, defined as 5 =62H - 8818O, describes the location of individual data points on the plot withrespect to the so-called Global Meteoric Water Line (GMWL) defined by the equation 62H - 8518O +10. Using this equation the 518O and 8D values of lake waters in East Africa was plotted in Figure 2.The range of 818O values of the lake waters is from -3%o to 12%o while 6D varies from about -16%o
30°E 32° 34° 36° 38° 40°
KENYAc, L. Baringo" L. Bogoria
^Mt. KenyaL.Nakuru nL 0|Bo|ossat
L. Elmenteitaa L. Naivasha
o L. LgaryaL. Eyasi^ ^ H. Chala
L. Manyara v^L. Jipe9L Kitangiri
L. Balangida
INDIANOCEAN
0 100 200 Km \
4°N
Fig.1 Location map for the East African Lakes of this study
44

Table 1 Descnption of East African lakes sampled in this study
Lake
Turkana(16GC)
Jipe
•Chala
*Katwe+
Edward+
Kitagata+
Banngo
*Nyamusigire+
*Kamweru+
'Nkugute+
Manyara
'Nyabikere-t-
Nymbuhta+
*Katanda+
*Saka+
Babati
Smgidai
Kmdai
*Dululi
Nkunga
Small Momela
Naivasha
Ol Bolossat
'Rurundu
Altitude
375
701
838
895
913
925
975
975
1160
1220
1235
1265
1327
1340
1520
1540
1540
1540
1600
1840
1850
1880
2320
3079
Latitude
2°50-N
3°35'S
3°19'S
0°08'S
0°25'S
0°03'S
0038TM
0°17'S
0°15'S
0°19'S
3°35'S
0°30T>1
0°3fN
0°29'N
0°42'N
4015'S
4°47'S
4°51'S
3°23'S
0°07'N
3°14'S
0°46'S
0°09'S
0°19'S
Longitude
36°28'E
37°45'E
37°41'E
29°52'E
29°30'E
29°58'E
36°05'E
30°02'E
30°07'E
30°06'E
35°50'E
30°20'E
30°19'E
30°16'E
30°14'E
35°44'E
34°45'E
35°44'E
36°4TE
37°36'E
36°54'E
36°21'E
36°26'E
37°28'E
Lake Area(Km2)
7500
30
5
245
2800
-
160
44
03
105
400
-
-
04
001
5
10
3
1
-1
-0.5
175
40
1
Zm(m)
110
-
-100
245
120
-
4
49
33.5
58
-
40
65
146
85
-
-4
-
-
-
-
-5
-2
-10
Z(Mean) Vegetation(m)
3 1 Semi and, shrubs
-3 Savanna
Open forest
033
Open forest
-
Savanna
Forest
22 7 Forest
20 Farms, forest patches
Savanna
Farms, forest patches
Farms, forest patches
Forest
2 7 Open forest, grasses
Farms, -50% forest
Savanna
Savanna
Forest
Forest
Open forest
-90% farms, grasses
-90% farms, grasses
Alpine
to -70%o (Table 2). The plotted 618O and 8D values relative to SMOW of meteoric waters is shownin Figure 2.
Discussions
The lakes sampled in this research contract range in altitude from 360 m to 3,000 m (Table 1, Fig.1). The altitudinal distribution of these lakes provide two major climatic gradients; aprecipitation/evaporation gradient and a temperature gradient. These climatic gradients should bereflected in the isotopic and chemical composition of the lake waters in East Africa. The resultsobtained in this work clearly indicate that lake waters from East Africa behave differently, perhapsdue to excessive evaporation that characterises this region.
The isotopic composition of precipitation in the East African region reflects the regional circulationpattern (Rozanski, 1995). The region experiences recurrent events of extremely low deuterium and618O isotope composition of precipitation, often persisting for more than one month, which mostprobably are associated with unusually strong convective activity within the air column, associatedwith passage of the intertropical convergence zone (ITCZ). In general, isotopically depleted watersare associated with the rainy seasons (Table 2).
45

Table 2 Values of Isotope (6D, 618O) in East African lakes in this study
Location
L Manyara
L Manyara
L Momela
L Momela
L Singmdai
L Smgmdai
L Babati
L Babati
L Kindai
L Kjndai
L Duluti
L Dulub
LT95-1WS
LT95-1WS
LT95-2WS
LT95-2WS
LT95-3WS
LT95-3WS
TURK R -5WS
TURK R.-5WS
LT95-5WS
LT95-5WS
OmoR.-6WS
OmoFL-WS
Sample Code
Al/1
Al/2
A2/1
A2/2
A3/1
A3/2
A4/1
A4/2
A5/I
A5/2
A6/1
A6/2
A7/1
A7/2
A8/1
A8/2
A9/1
A9/2
A10/1
A10/2
Al l /1
All /2
A12/1
A 1 2/2
delta (O-18)
-244
-242
392
269
732
719
416
437
601
600
342
358
570
570
541
569
573
572
-060
-068
601
605
-081
-089
delta (H-2)
-89
-109
237
244
476
456
254
259
372
362
187
192
364
409
388
399
399
410
35
27
413
41 2
30
-1 9
Location
L Edward, 0 m
L Kjrvuuka,0m
L Saka,0m
L KatandaOm
L KamweruOm
L Nkugute, Om
L Nyinabunta, 0 m
L Nyabikere, 0 m
L Kitagata,0m
L Nyambusm, 0 m
L Nyantonde, 0 m
L Nyantonde 10m
L Nyantonde, 20 m
L Nyantonde, 30 m
L Nyantonde, 60 m
L Nyantonde 1 50 m
delta (CMS)
404
580
187
665
325
340
545
083
616
684
464
459
452
3 15
328
368
delta (H-2)
297
321
173
392
223
250
350
139
348
394
28 1
323
278
234
237
218
d-excess
-26
-143
24
-140
-37
-22
-86
73
-145
-153
-90
-44
-83
-1 8
-25
-76
46

200-,
100-
Q
0-
-100-10
Slope of evaporationtrajectory ~5
0 10 206180%. (SMOW)
30
Fig.2 Plot of818O and 6D values relative to SMOW of meteoricwaters of this study.
In lakes with seasonally dry climate, the oxygen isotopic composition of a lake's water is mainly theresult of evaporative evolution and residence time of the water body (Beadle, 1974; Gat, 1981;Gonfiantini, 1986). This does not seem to be the case in East Africa. The isotopic composition ofthe lake waters studied in this contract seems to be an interplay between basin size, altitude andhydrology. However, further research is required in order to have a better understanding of thephysical and chemical factors that cause the observed variability in the isotopic composition of lakewaters in this region.
ACKNOWLEDGEMENTS
This Research Contract No. 7541 was supported by the International Atomic Energy Agency(IAEA). We are most grateful for the funding support obtained from the Agency. Field equipmentfor water sampling was provided by Large Lakes Observatory, University of Minnesota. Isotopiccomposition of the lake waters was analysed in the Isotopic Hydrology Laboratory of the Agency.We would like to acknowledge these assistance. Finally, we would like to thank the Department ofGeology, University of Nairobi for all the support for the IDEAL project.
47

REFERENCES
Beadle, L.C., 1974. The Inland Waters of Tropical Africa: An Introduction to Tropical Limnology.London, Longman Group Ltd., 365 pp.
Craig, H., 1961. Isotopic variations in meteoric waters. Science, 133: 1702-1703.
Gat, J.R. 1981. Lakes. In: J.R. Gat and R. Gonfiantini (eds.). Stable Isotope Hydrology: Deuteriumand oxygen-18 in the water cycle. IAEA Technical Report No. 210, Vienna, p. 203-221.
Gonfiantini, R., 1986. Environmental isotopes in lake studies. In: P. Fritz and J.C. Fontes (eds.),Handbook of Environmental Isotope Geochemistry: V.2. The Terrestrial Environment B. Elsevier.
Rozanski, K.L., 1995. Isotope patterns of precipitation in the East African region. In: TheLimnology, Climatology and Palaeoclimatology of the East African Lakes. T.C. Johnson and E.O.Odada (eds.), 1996.
Johnson, T.C. and Odada, E.O., 1996. The Limnology, Climatology and Paleoclimatology of theEast African Lakes. Gordon and Breach Science Publishers SA, 664p.
48

STABLE ISOTOPES IN LAKES OF THE HIGH TATRA MOUNTAINS,WESTERN CARPATHIANS, SLOVAKIA
J. MICHALKO*, D. BODIS*, P. MALIK, K. MARHEVKOVA**, S. SCHERER** Geological Survey of Slovak Republic,
** Faculty of Natural Sciences, Comenius University• .._.! •••••II mi ••HI Hill IIHI IIUI HID |
Bratislava, Slovakia XA0100612
AbstractData of oxygen, hydrogen and sulphate sulphur stable isotopes from the lakes of
the Vysoke Tarry Mts., acquired in the framework of IAEA No. 8675/RB project "Stable
isotopes in lakes of High Tatra mountains, Western Carpathians, Slovakia" represent the
first set of this kind information on the territory of Slovakia. Moreover a complete set ofchemical composition of waters was taken and compared to preceding results and
contemporary state of acidification was evaluated. Values of studied chemical compounds
respond to their source - initial precipitation waters and bedrock character with influence
of biochemical processes. Acidification is due to inactive geological background
(granites), high contribution of SOX and NOX from atmospheric deposition and low
buffering ability of soil. Acidification of lakes is lowered from 1980 and is approaching
to level before acidification, probably as consequence of industry crisis in Eastern Europeafter 1989. Water samples from the Furkotska dolina valley water system follow the
MWL with natural trend of increasing content of heavy isotopes with lowering altitude.In depth profiles of single lakes' isotope composition does not change - due to naturalconditions during sampling campaigns (spring and fall homothermy?), all waters are
meteoric in origin without signs of evaporation. Water of the Strbske pleso lake isenriched to heavy isotopes, all samples fit an evaporation line. This could be explained by
longer residence time of water, or by the recharging from the last phases of the snowmelt.
Sulphate sulphur isotope ratios from lakes are the same and they are identical with these
of snow packs.
49

1. INTRODUCTIONMountain lakes formed in the Vysoke Tatry (High Tatra) Mts. were chosen for
intended research of IAEA No. 8675/RB project "Stable isotopes in lakes of High Tatra
Mts., Western Carpathians,
Slovakia". Vysoke Tarry Mts. are
the highest part of WesternCarpathians and whole Carpathian
arc as well. They form natural
border between Slovakia on the
south and Poland on the north (Fig.
1.). Acquired data of oxygen,
hydrogen and sulphate sulphurstable isotopes from the lakes of the
Vysoke Tatry Mts., represent the first set of this kind information on the territory of
Slovakia. Moreover a complete set of chemical composition of waters was taken andcompared to preceding results and contemporary state of acidification was evaluated.
Fig. 1: General situation of the investiga-ted area
2. NATURAL CONDITIONS OF THE INVESTIGATED AREA2.1 Geomorphology
Main ridge of the Vysoke Tatry Mts. is in the form of an arc shaped to the south.
It is some 26,5 km long, its mean altitude is 2279, mean altitudes of summits is 2357 and
saddles 2179 m. a. s. 1. Highest summits on the main range are Ladovy stit (Ice peak)with 2627 and Lavinovy stit (Avalanche peak) with 2606 m. a. s. 1.. Placement of highest
summits (Gerlachovsky stit 2654, Lomnicky stit 2634 m. a. s. 1.) on southern side-ridges
which are separated by deep valleys, forms typical asymmetric structure of the VysokeTatry Mts.. Studied lakes are situated in such valley - Furkotska dolina valley and Strbske
pleso lake in between Furkotska dolina and Mlynicka dolina valleys (Fig. 2).
2.2 Geology
From the geological point of view the Tatry is a relatively highly elevated block,
almost completely lined by overlying sediments of the Central Carpathian Paleogene
Basin. Southern and central parts are covered by the Mesozoic sediments. Scare Mesozoic
outcrops are present inside the Paleogene and Quaternary sediments, to the south of theTatry block.. The lowermost structural unit incorporated in the Tatry block is called the
50

Fig. 2: Detailed situation of the investigated area
Tatricum. This unit is formed by the crystalline basement and by the Permian - Mesozoic
sequences. The basement prevailingly consists of the granitoids and metamorphic rocks.
The basement comprises several tectonic slices made by both the Alpine and pre-Alpine
events. The lowermost basement unit is formed by complex of mica schists and gneisses,
overlaid by granitoids and migmatites in the south-western part of Tatra Mts. region. Theupper basement unit of Tatricum is formed by a complex of granitoids which are
underlain by migmatites and amphibolites. The cover of the granitoid intrusion consistsof the metamorphic rocks.
The oldest formation of the Tatrikum cover unit (Tatric Permian - Mesozoic
sequences) is conglomerate which is believed to have started its deposition already in
Permian. Younger Mesozoic formations consist of various limestones, dolomites, marls
and sandstones. Abundant fossils (pelecypods, brachiopods, ammonites, crinoids,
foraminifers etc.) prove their deposition in the marine environment. However, there are
some exceptions. Shallow marine even continental sediments are present in the sequencesin the western part of Tatra Mts. region. Here its continental origin proved by the
occurrence of the tracks of Coelurosaurichnus tatricus on the bedding planes [8].The Tatricum is overlaid by the Fatricum. The Fatricum in the Tatry region is
represented by a very complicated nappe structure - Krizna nappe - which only consists of
51

the Mesozoic sequences ranging in age from the Lower Triassic to Lower Cretaceous. Acomplicate internal structure of the Krizna nappe can be seen on the western slopes of
Tatra Mts. There are small-scale nappes, thrust slices and duplexes.
The Choc nappe represents the upper unit called Hronicum, which overlies the
Fatricum. The Choc nappe occurs in a form of the two partial nappes in a Tatra Mts.region.
The Upper Cretaceous - Lower Eocene sediments are missing in the Tatry region.It is presumed that the erosion of the Paleoalpine structures took place during this time
period. A presence of the outcrop with Eocene transgressive sediments overlying directly
the crystalline basement indicates how intensive this erosion was. It is believed that the
erosion took place during the whole Late Cretaceous - Early Paleogene time period.
Thickness of Quaternary sediments and the area they cover is given by direct
relationship to the Pre-Quaternary base. Existing geophysical data (supported by the
hydrogeological borehole logging results) revealed that the major thickness is
concentrated in the area of the 1.5 - 4.0 km belt along the southern edge of the VysokeTatry Mts.. Boreholes had proven the thickness up to 400.0 m. In the S and SE direction,
towards the Poprad and Biely Vah river valleys, the Quaternary thickness are gradually
reduced. Quaternary sediments are including many genetic types - glacigenic (wiirm, riss
and mindel period), glaciofluvial, fluvial and polygenetic accumulations with very
variable granulometric compositions. According to their age, we can distinguish members
ranging from late Pleistocene up to Holocene. Basement in the studied area is practically
built only from granitoids with Quaternary mainly glacigenic sediments.
2.3. ClimateMain influence on climatic conditions has slope exposition to prevailing western,
North-Western winds. Southern winds influence is not so important because of the
influence of the Nizke Tatry (Low Tatra) mountains (main ridge altitude is near 2000 m.
a. s. 1.) rain shadow from the south. Mean annual temperature on the Vysoke Tatry Mts.
main ridge oscillate from -2 to -4 °C, in Strbske pleso altitude level from +3 to +5 °C.Amount of precipitation highly depends on slope exposition. Total year amount of
precipitation moves from 1000 to 3500 mm. Snow cover lasts on the slopes of the Vysoke
Tatry Mts. meanly 140 - 180, on the ridge to 240 days per year. Mean evaporation is
about 400 - 500 mm per year.
52

2.4. Hydrogeology
Groundwater in granitoids of the Vysoke Tatry Mts. is bound to fissures of
various origin, first of all fissures of the weathered zone and sub-surface expansion up to
the 50 m of the depth. Bedrock aquifer is closely connected with overlaying Quaternary
deposits, and the mutual exchange of groundwater between them is constantly going on.
To distinguish the "pure granitoids" groundwater runoff in this area, discharge gagings on
the Beliansky potok stream were established on the Tri studnicky station in the period of1977 - 1980 [3]. Average specific groundwater runoff in these climatic and hydraulic
conditions, not too much influenced by presence of Quaternary sediments, was calculated
as 7.8 l.s"'.km~2 using Foster method and 6.8 Ls^-km"2 using Kille's method. Minimal
(base) specific flow was ranging from 1.2 l.s^.km^to 4.2 l.s"'.km"2 in the same period.
The most important aquifers on the territory of the Central part of the Vysoke Tatry Mts.are glacigenic and glacifluvial deposits. For glacifluvial sediments, transmissivity proven
by pumping tests was ranging from 4,40 .lO^.m^.s"1 up to 6.52 10"5.m"2.s"1. Permeability
of all genetic types of Quaternary sediments is connected with their granulometriccomposition. Permeability coefficient of glacifluvial sediments is therefore ranging from
4.93 .10"7 m.s"1 to 9.75 .10'2m.s''. The thickness of glacifluvial deposits is usually 25 - 35
m, in tectonic depressions 40 - 80 m, but the permeability there is influenced by higher
content of pelitic components. Permeability coefficient of glacigenic sediments is ranging
from 1.84.10"8 to 1.98 .10° m.s"1. Transmissivity from pumping tests ranging from 1.57 .
10"4 m"2. s"1 up to 9.93.10"3 m^.s"1. For their permeability, the granulometric composition
of the filling between the stony material is important.The groundwater regime gagings [3] had shown that the lowest values of both
discharges and groundwater levels are present in January - February period in lower
altitudes and in March - April period in higher altitudes. The highest levels are then
reached in May - July or July - August respectively. Based on gagings in the 1975 - 1980period, the prognostic natural groundwater resources were calculated for the central part
of the Vysoke Tatry Mts.. Total area of outcropped crystalline rocks in the central part ofthe Vysoke Tatry Mts. represents 150.5 km2. 15.5 km2 is represented by the Mesozoic
carbonates present in "islands" along the mountain edge and the rest - 312.9 km2 is
covered by thick Quaternary deposits.
From the groundwater protection point of view is important, that classical pollutionsources are influencing the chemical composition of the Vysoke Tatry Mts. groundwater
only in limited way. The major pollution sources there are mainly liquid and solid waste as
53

the result of presence of tourist centres and tourist activities, negative impacts of traffic on
roads and forest exploration activities. Because of the limited buffering ability of
crystalline rock environment, noticeable are also influences of emissions transported by air
masses and precipitated over the area. Self-purification and filtration ability of the major
aquifers, present in the Vysoke Tarry Mts. region, is generally very low.
2.5. Hydrology
Continental main water divide between (Black and Baltic sea) pass across westernbank of the Strbske pleso and Solisko ridge to the main ridge. Furkotska dolina water
system (Fig. 2) belongs to Black Sea watershed and Mlynicka dolina valley to Baltic Sea
watershed. Water flow of streams is quick (about 2 m.s"1) and lowest discharge is duringwinter (December - March), highest in June - combined influence of snow thawing and
high precipitation period in high altitudes.
Table I Basic characteristic of the largest Vysoke Tatry Mts. lakes (modified from [4])Lake
Morskie Oko
Wielki Staw zPieciu Stawow
Czarny Staw nad Morskim Okiem
Velke Hincovo pleso
Strbske pleso
Czarny Staw Gasienicowy
Czarny Staw z Pieciu Stawow
Vysne Wahlenbergovo pleso
altitude[m a.s.l.)
1393
166415801965
1350
1620
1722
2157
exposition
N
N
N
S
sN
N
S
surfacearea[ha]
34,93
34,35
20,64
20,08
19,76
17,94
12,69
5,18
depth[m]
max. mean
51
79
76
53
20
51
5021
28
38
38
23
6
21
22
Period
thaw freeze
V-VI
V - V I
V - V I I
IV- V
V-VII
VII - VIII
X
X-XI
X - X I
XI
X - X I
IX -X
During glacial period a lot of lakes were formed in the Vysoke Tatry Mts. Theirnumber is about 138 now. The most of them (88 %) is in the area over the forest line.
Small lakes with surface to 1 ha and maximal depth (up to 2 m) are prevailing. Second
group is formed by lakes with surface area 1 - 10 ha and maximal depths from 2 to 10m.
In the Vysoke Tatry Mts. there is only 6 lakes larger than 15 ha and 6 lakes with maximaldepth bigger then 50 m (Tab.I).
Majority of lakes has not visible surface inflow, water is recharging into them
from Quaternary sediments, with the exception of lakes that were created on streams.
Outflowing water deepened surface channels in bedrock - beginning of fluvial net.
Moraine lakes characteristic outflow is inside of moraine. Strbske pleso represent specific
phenomena - it is so named "dead ice" lake.
54

3. SAMPLE PROCESSINGSamples for chemical and isotopic analyses were taken in two campaigns - in June
(5-6th) and September (25-26th). Samples were taken from rubber boat from the surface
level and from every five meters. When this was not possible (frozen or shallow lake),
more samples were taken to characterise whole water profile. Temperature andconductivity were measured on the boat in 3 1 water volume sampling vessel. This
probably could influenced measured temperature especially during September sampling
of Vysne a Nizne Wahlenbergovo pleso lake because of bad weather. VysneWahlenbergovo pleso lake was found in June frozen and in September half frozen, Nizne
Wahlenbergovo pleso lake was completely frozen in September. For sulphur isotope
analyses about 50 litres of water samples were taken from the surface of lakes. Samples
for oxygen and hydrogen isotopic composition were taken into 50 ml glass bottles with
sealing cup and to analyses stored in refrigerator.
Ratio of 18O/I6O (water) was measured on CO2 equilibrated with the water in a
special equilibration device that was connected on line with a MAT 250 mass
spectrometer. The unknowns are measured against an internal standard calibrated against
SMOW. Reproducibility of preparation method (n = 48) was better than ± 0.07%o.Hydrogen gas for isotope analyses was produced by a zinc reduction technique.
Approximately 5ul of a water sample are reduced under vacuum with 150 mg of zinc at
490 °C during 30 minutes. The obtained results are normalised to internationally accepted
standards (V-SMOW, SLAP) and reported in the usual 8-notation. The standard deviation
calculated from replicate 8D analyses of a sample was generally better than ±16.
Sulphate sulphur from waters was precipitated with BaCl2 (hot, acidified withHC1) as BaSO4 and converted into H2S by reaction with hot mixture of HC1, H3PO4 a HI.
Such H2S was purged by nitrogen via zinc acetate, resulting in precipitation of ZnS.
Subsequently, a mixture of ZnS/CuO reacts gradually under temperatures 320 °C and 770°C. SO2 was storage in glass ampoules for measurement. Measurement was characterisedby reproducibility of ±0.3 %o.. Calibration of laboratory standard was carried out by
IAEA international standards (NZ1 and NZ2) and recommended comparation materials
(NBS122andNBS127).
4. RESULTS AND DISCUSSIONIn the spring (June 5-6th) and fall (September 25-26th) periods were the lakes and
streams in High Tatra Mts., chosen for the research, sampled for isotopic (hydrogen,
55

oxygen, and in fall also sulphate sulphur) and chemical composition. This was first
attempt to check stable isotope composition of water of these lakes. There was some basic
information on chemical composition of water and evaluation of acidification of lakes [1],
[2], [5], [9], [10]. For research were chosen different types of lakes in different altitudes
and differently influenced by geogenic and anthropogenic factors. We chose water system
in Furkotska dolina valley with: the uppermost Vysne (Upper) Wahlenbergovo pleso lake
(VW), Nizne (Lower) Wahlenbergovo pleso lake (LW), Vysne Furkotske pleso lake
(VF), stream between Vysne Wahlenbergovo pleso lake (VW) and Nizne Wahlenbergovo
pleso lake (NW) - VWs and stream under the Nizne Wahlenbergovo pleso lake (NW) -
NWs. The Strbske pleso lake (SP) lake vicinity is the main tourist and sports (especially
winter sports) centre.Results of performed analyses, both isotopic and chemical, are given in enclosed
Tables III, IV and V. Vertical profiles of the chosen parameters (T, TDS, Na, Cl) of
individual lakes (Fig. 3) and the altitudinal profile of the Furkotska dolina valley lakesincluding Strbske pleso lake as the lowest point (Fig. 4) are shown. In the reality SP lakeis not connected to the Furkotska dolina water system. Results of snow pack analyses [6]
as the source water representative are enclosed for comparison.Sampling was organised to admit characterisation of the chemical and isotopic
composition of the lake, stream and initial water (mainly after snow melting). Chemical
parameters of VW water (Tab. Ill, IV, V) are in good concordance with chemical
composition of snowpack - main input of the water into the lake - and inactive bedrock
Table II Contemporary and preacidificated alcalinity values of lakes. Ca + Mg, Cg,A - contentrations from single years, API, AP2 - calculated estimates preacidificationalcalinities, DAi, DA2 differences between API -A and Ap2 - A, all in meq/1, (1980 valuesare taken from [9]).
Year
1980
1980
1980
1980
1996
1996
1996
1996
Locality
Strbske pleso
Vysne Furkotske pleso
Vysne Wahlenbergovo pleso
mean
Strbske pleso
Vysne Furkotske pleso
Vysne Wahlenbergovo pleso
Mean
Ca + Mg
201
203
126
177
243
131
100
157
Api
173
185
103
154
212
109
75
132
Ca
141
170
116
142
165
116
80
120
AP2
163
199
133
165
192
132
88
138
A
121
32
-6
40
171
118
57
115
DA1
52
143
109
101
42
-9
18
17
DA2
42
167
139
116
8
15
32
18
56

Table III: Results of the water isotope analyses with basic site and water characteristic
No.
1234567891011121314151617181920212223242526
Locality
Vysne Wahlenbergovo plesoVysne Wahlenbergovo plesoVysne Wahlenbergovo plesoVysne Wahlenbergovo plesoVysne Wahlenbergovo plesoVysne Wahlenbergovo plesoVysne Wahlenbergovo plesostream under VW pleso (VWs)stream under VW pleso (VWs)Nizne Wahlenbergovo plesoNizne Wahlenbergovo plesoNizne Wahlenbergovo plesoNizne Wahlenbergovo plesostream Furkota (NWs)stream Furkota (NWs)Vysne Furkotske plesoVysne Furkotske plesoStrbske plesoStrbske plesoStrbske plesoStrbske plesoStrbske pleso (bottom)Strbske plesoStrbske plesoStrbske plesoStrbske pleso
Altitude[m a s 1 ]
21452145214521452145214521452075207520532053205320531800180017501750135013501350135013501350135013501350
Date
05 06 9605 06 9605 06 9626 09 9626 09 9626 09 9626 09 9605 06 9626 09 9605 06 9605 06 9605 06 9626 09 9606 06 9625 09 9606 06 9625 09 9606 06 9606 06 9606 06 9606 06 9606 09 9625 09 9625 09 9625 09 9625 09 96
Depth[m]
0,010200,04,010,515,00,00,00,03,06,30,00,00,00,00,00,04,59,013,517,90,05,010,018,0
Tair[°C]
-2,0-2,0-2,0-2,0
0,0
0,5
2,0
1,0
3,64,03,53,5
T water[°C]
0,31,03,21,62,12,22,31,21,63,64,34,40,917,24,210,64,517,011,16,76,46,38,18,08,06,1
pH
5,225,565,555,855,875,805,826,655,806,786,005,575,855,926,056,105,936,426,126,325,726,056,506,556,416,05
Conduct.[nScm1]
1616131313121410131315141521183418373339394030303039
Oi
8,88,48,68,3
11,1
10,8
10,1
8,3
8,58,98,03,5
5'80H20SMOW
I%«1-13,79-13,88-13,98-12,22-12,11-12,19-12,13
14,04-12,47-13,40-13,40-13,26-12,21-13,18-11,58-13,20-11,36-7,45-7,51-7,16-7,16-7,16-7,03-7,00-6,98
6DH2oSMOW
[%«]
-94,3-98,7-98,8-85,3-84,2-84,485,4-98,0-86,2-96,2-91,4-85,5-85,2-90,6-80,4-89,2-75,9-65,1-61,3-56,0-56,4-62,2-60,1-59,8-60,9-60,5
d34Ss04CDT[%o]
4,5
4,3
4,7
4,8
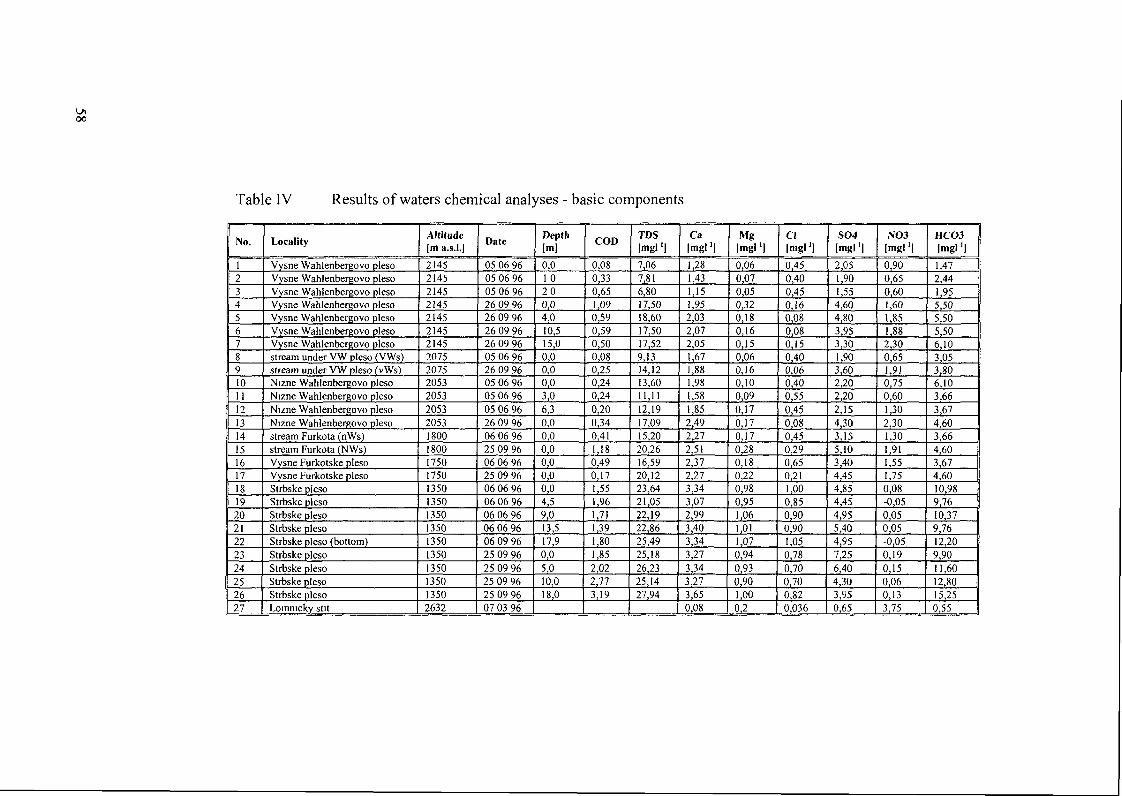
00
Table IV Results of waters chemical analyses - basic components
No.
123456789101112131415161718192021222324252627
Locality
Vysne Wahlenbergovo plesoVysne Wahlenbergovo plesoVysne Wahlenbergovo plesoVysne Wahlenbergovo plesoVysne Wahlenbergovo plesoVysne Wahlenbergovo plesoVysne Wahlenbergovo plesostream under VW pleso (VWs)stream under VW pleso (vWs)Nizne Wahlenbergovo plesoNizne Wahlenbergovo plesoNizne Wahlenbergovo plesoNizne Wahlenbergovo plesostream Furkota (nWs)stream Furkota (NWs)Vysne Furkotske plesoVysne Furkotske plesoStrbske plesoStrbske plesoStrbske plesoStrbske plesoStrbske pleso (bottom)Strbske plesoStrbske plesoStrbske plesoStrbske plesoLommcky slit
Altitude[m a.s.l.j214521452145214521452145214520752075205320532053205318001800175017501350135013501350135013501350135013502632
Date
05 06 9605 06 9605 06 9626 09 9626 09 9626 09 9626 09 9605 06 9626 09 9605 06 9605 06 9605 06 9626 09 9606 06 9625 09 9606 06 9625 09 9606 06 9606 06 9606 06 9606 06 9606 09 9625 09 9625 09 9625 09 9625 09 9607 03 96
Depth[m|0,01 0200,04,010,515,00,00,00,03,06,30,00,00,00,00,00,04,59,013,517,90,05,010,018,0
COD
0,080,330,651,090,590,590,500,080,250,240,240,200,340,411,180,490,17
,55,96,71,39,80,85
2,022,773,19
TDS[mgl '|7,067,816,8017,5018,6017,5017,529,1314,1213,601 1 , 1 112,1917,0915,2020,2616,5920,1223,6421,0522,1922,8625,4925,1826,2325,1427,94
Ca[mgl'l1,281,431,151,952,032,072,05
,67,88,98,58,85
2,492,272,512,372,273,343,072,993,403,343,273,343,273,650,08
Mg[mgl ']0,060,070,050,320,180,160,150,060,160,100,090,170,170,170,280,180,220,980,951,061,011,070,940,930,901,000,2
Cl[mgl1]
0,450,400,450,160,080,080,150,400,060,400,550,450,080,450,290,650,211,000,850,900,901,050,780,700,700,820,036
SO4[mgl1]2,051,901,554,604,803,953,301,903,602,202,202,154,303,155,103,404,454,854,454,955,404,957,256,404,303,950,65
NO3[mgl ']0,900,650,601,601,851,882,300,651,910,750,601,302,301,301,911,551,750,08-0,050,050,05-0,050,190,150,060,133,75
HC03Imgl ']
1,472,441,955,505,505,506,103,053,806,103,663,674,603,664,603,674,6010,989,7610,379,7612,209,9011,6012,8015,250,55

Table V Results of waters chemical analyses - metals
No.
12345678910111213141516171$191921222425262728
Locality
Vysne Wahlenbergovo plesoVysne Wahlenbergovo plesoVysne Wahlenbergovo plesoVysne Wahlenbergovo plesoVysne Wahlenbergovo plesoVysne Wahlenbergovo plesoVysne Wahlenbergovo plesostream under VW pleso (VWs)stream under VW pleso (VWs)Nizne Wahlenbergovo plesoNizne Wahlenbergovo plesoNizne Wahlenbergovo plesoNizne Wahlenbergovo plesostream Furkota (NWs)stream Furkota (NWs)Vysne Furkotske plesoVysne Furkotske plesoStrbske plesoStrbske plesoStrbske plesoStrbske plesoStrbske pleso (bottom)Strbske plesoStrbske plesoStrbske plesoStrbske plesoLomnicky stit
Altitude|m.a.s.l.|
214521452145214521452145214520752075205320532053205318001800175017501350135013501350135013501350135013502632
Date
05 06 9605 06 9605 06 9626 09 9626 09 9626 09 9626 09 9605 06 9626 09 9605 06 9605 06 9605 06 9626 09 9606 06 9625 09 9606 06 9625 09 9606 06 9606 06 9606 06 9606 06 9606 09 9625 09 9625 09 9625 09 9625 09 9607 03 96
DepthIm]
0,01 0200,04,010,515,00,00,00,03,06,30,00,00,00,00,00,04,59,013,517,90,05,010,018,0
Sr(mgi'l
0,0160,0350,0320,0780,1800,0700,0780,0370,0550,0450,0410,0340,0730,0510,0520,0530,0530,1300,0390,0390,0460,0890,0770,0780,0700,0600,046
FeImgl'l
0,0190,0080,0180,077-0,0010,009-0,001 _j0,008-0,0010,0100,0150,1700,0050,0060,0020,006-0,0010,0240,0170,0230,0310,0700,0080,0440,0290,2600,036
Cu[mgl'l
0,000550,000830,001600,000740,000990,001020,000400,000650,000380,006070,000800,000650,000450,000320,000230,000240,000400,001660,002820,004440,003900,000760,000640,000960,001150,000740,0001
ZnImgl'l
0,00980,01600,01530,01200,00900,00700,00300,00970,00400,02250,01010,03370,00700,01930,00200,00900,00400,01170,01450,01740,01900,02730,00900,00500,01000,01400,0466
CdImgl'l
0,000120,000100,000030,0000720,0000590,0000870,0000590,000080,0001240,000160,000070,000100,0000560,000030,0000560,000020,000010,000040,000020,000050,000010,000030,000020
^0,0000330,0000200,0001370,0003
PbImgl'l
0,000700,000530,000880,000310,000470,000410,000200,000700,000330,001530,000550,000560,000070,000080,000210,000180,000870,000300,000120,0004103000220,0001 10,000220,000240,000360,000770,0073
HgImel'l
0,000060,000030,000090,000260,000260,000260,000260,000030,000260,000030,000030,000060,000530,000060,000800,000060,000530,000030,000060,00003-0,000030,000030,000530,000530,000530,000530,00056
Al[mgl'l
0,15400,09350,08320,09280,02460,03330,01680,09380,03430,08870,07270,05300,06960,06100,02270,0313Ot06520,01110,01130,01550,01200,01710,02280,07650,06570,05440,066

built by granitoid rocks and their Quaternary derivatives Homogeneity of VW waters is
visible from data as well It is important to notice that VW belongs to lakes with very
long lasting reverse layenng, mexpresiveness spnng homothermy, very short normal
i vi m- b V I — e — s i x * b IX
j — B- — s VI m- b V! — e — s IX • b IX Q snow
o
" t„ f
t
. ———t
-/
1=1
/
/
/
^"*
I
W"^^-^*-ef
-""'
I-——-"
^
—&
0 , ———————— » . , . , _ . - . -o o o o o o o oo o o o o o o oCO <O ^ (N O CO <O it( N C * ) I N ( N C 4 T - T - * -
Altitude [m a s 1 ]
0»„
Ii a
Q.EoI-
S §CM o
CJ t01 If
— B —— sVI m- bVI —— e —— six •- b IX H| snow
N£I«b— _— —— — '^— —-r*^
_^"^
•
=1 ^-D>E.
0 1 —————————— - - - , —— —— ————————— , ——————— __—— —————— , ————— . ————— , ———— ----- ——————————— ,t ir o S ° S o § § § ° 8
Altitude [m a s 1]
O
O
IO
• t?Altitude (m a s 1 ]
}'
fM'—
—— B- — S VI •- b VI -— e —— s IX • bX B
^-"
snow i
Fig 3 Selected parameters m altitudmal profile
60

« .
ff J1-
V
o .
TDS
[mgf
l]
0 2
if
c
,
i
'———— j
c
1
i
>
• c
> c
)
"G
i O - -
<--—' — •• •
> a
h- —— -*-
\ • -;-•>„> u
• - o -
°
> C
Depth [m]
. - - -O
— —— — — __
- O
> c
Depth [ml
""-"~rvrr
u
- - -O "
•• —————— 1
> u
-- ,-„
g
1
> C
•
34
- -B- -VWj—— • —— VWs
X SVW-0 NWj
*. NWs
+ SF
i. VF
- -0 SF)
—- •-- SPsjf SNOW
- - Q - VWj
—— • —— VWs
x svw- - 0 - NWj
• NWs
+• SF
A VF0 SPj
--••—SPsB SNOW
COo
too
u O"
5
CMo"
———————— |
-
• i;___ __ _ ^ - _ -j -Q -a
0 - „---<>---
IO O 1O O H' i- i
Depth [m]
"~~~ o
1
- - Q - VWj
—— • —— VWs
x svw0 NWj
* NWs
+ SF
A VF
e - -SF)— • — SPs
_ SNOW
2 5
<M
COo ,
f lD '. . o
0
O
CMo"
o
*>' < ' '^
4r^-^-
. . . - - -
^
- «-
— — — • — ~"
^————^«•> o ui o «"
Depth [m]
.0
1
- - e - vwj—— • —— VWs
x svw0 NWj
• NWs
+ SF
A VF
0 SF)
—— • —— SPs
B SNOW
ow
Fig. 4: Selected parameters in depth profiles for individual lakes
layering period and important fall homothermy. Period of ice cover lasts in mean 270days per year. This is the reason for good water homogeneity in vertical profile of VWlake. Differences in chlorides content (typical conservative tracer, exclusively originating
61

in precipitation) in June and September are very probably due to variability chemical
composition of precipitation (Fig. 4). Similar is behaviour of the other studied
constituents (see Tabs. IV and V).
The hydrogeochemical characterisation of natural waters of Furkotska dolina
valley can be documented on the profile where input is represented by chemicalcomposition of snow pack (Lomnicky stit altitude 2632 m a.s.l., average values from 20
years observations) and water chemistry is watch gradually with lowered altitude (Fig. 3).
The TDS increase with the lowering altitude is in correspondence with the hydrologic and
hydrogeologic natural water conduit. Values of pH in profile are rising up due to lowering
of CO2 content (stripping effect) in surface streams. Values of other compounds (Cl, SO4,
Mn) respond to their source - initial precipitation waters and water-rock interaction with
influence of the biochemical processes.
The acidification is evaluated by empirical line dividing not acidified lakes (SP)
from acidified lakes VW and VF. Calculated alcalinity values before beginning of
acidification are shown in Tab II. In this table are used results from 1995 and November
1996 [7].
Acidification is due to inactive geological background (granites), high
contribution of SOX and NOX from atmospheric deposition and low buffering ability of
soil, which is practically not developed in the high altitudes. It is noticed that the
acidification of lakes is lowered and state is slightly improving in comparison to the 1980state and is coming back to the level before the acidification. This could be in response to
the crisis of industry in Eastern Europe (and maybe even more environmental legislative
measures) after 1989 changes, which led to drastic reduction of exhalates.
Based on relation of 518O and 5D of studied waters and MWL said (Fig. 5) could
be that all waters are meteoric in origin. For comparison snow pack values from localities
Lomnicky stit, Skalnate pleso and Tatranska Lomnica [6] are shown. Water samples from
Furkotska dolina valley follow MWL with natural trend of increasing content of heavy
isotopes with lowering altitude.
In depth profiles of single lakes (Tab. Ill) isotope composition does not change -
due to the natural conditions during sampling campaigns (spring and fall homothermy?).
In the Furkotska dolina valley lakes (VW, NW, VF) are differences in isotope ratio of
water at least between upper water layers. Similar is the isotope ratio in snow pack,
differences could be understood as because there were whole year snow pack samples
taken. Samples from Strbske pleso lake have specific position. They are enriched to the
62

heavy isotopes; we know only a few so "heavy" natural waters from Slovak territory -
some mineral waters, some summer rains and some snow melt waters. Practically allsamples fit an evaporation line - water in the sampled part of the lake is very
homogeneous in the stable isotope composition. Evaporation could be explained by much
longer residence time of water or by fact that the lake recharge is only from the last
phases of snowmelt. Quite big differences between temperatures are excluding idea about
homothermic state. It is necessary to keep in mind that Strbske pleso lake has no apparentsurface inflow and outflow. Lake is fed and emptied due to hidden subsurface flows. It is
true that only one of two known depressions (deep about 20 m and separated by 14 m
shallow ridge) was sampled. In this way the Strbske pleso lake (SP) is not a typicalterminal lake - seasonal oscillation of water level are very low. Sulphate sulphur isotope
ratio of surface water from every lake was measured from September sampling period
(Tab. Ill, Fig 6). Because of this, we could not observe seasonal differences. The 634SS04
are practically the same and they are identical with these of snow packs. From Fig. 6 it is
-20 - , - —— . _ . . _ . ..._ ..... ——
-40-
sr -60-§ 80 J0>
•S -100-Q40 -120-
-140 -
4cir\
I/*>.
JS
&/
/
A/ ^/
-25 -20 -15 -10 -5 0
818O(permil)
H snowD WWI• VWKX VWs0 NWVI• NWIX+ NWsA VFo SFVI• SRX
Fig. 5 Hydrogen and oxygen isotopes in snowpack and lakes
10 -, ————— ———————— -- - — -
=• 8-
f*
8.
o ; . . . .0
X
X & .
X snow• vw*NW
AVF
• SP
2 3 4 5 6 7 8SO4 [mg/l]
Fig. 6: Sulphur isotope composition in snowpack and lake water
63

clear that samples of water and snows are very near in the isotope composition of sulphur
and sulphate content as well. Different 834SS04 in snow sample from Tatranska Lomnica
could be explained by the influence of the local sources (maybe hotels in the
neighbourhood). Higher concentration of sulphate in the Strbske pleso (SP) water is in
good coincidence with idea of dominant evaporation influence on this lake water.
5. CONCLUSIONSIn the framework of International Atomic Energy Agency No. 8675/RB project
"Stable isotopes in lakes of High Tatra mountains, Western Carpathians, Slovakia" were
sampled water of selected lakes in this region. Under this project were collected data of
the oxygen, hydrogen and sulphate sulphur stable isotopes from the water of lakes
Furkotska dolina valley (Vysne Wahlebergovo pleso, Nizne Wahlenbergovo pleso and
Vysne Furkotske pleso) and stream between them and "dead ice lake" Strbske pleso in
the Vysoke Tatry Mts., Slovakia. This data set represents the first set of this kind ofinformation on the territory of Slovakia. Moreover a complete set of chemical
composition of waters was taken and compared to preceding results and contemporarystate of acidification was evaluated.
Values of studied chemical compounds respond to their source - initialprecipitation waters and bedrock character with influence of biochemical processes.
Acidification is due to inactive geological background (granites), high contribution of
SOX and NOX from atmospheric deposition and low buffering ability of soil. Acidification
of lakes is lowered from 1980 and is approaching to level before acidification, probably
as consequence of industry crisis in Eastern Europe after 1989.
Water samples from the Furkotska dolina valley water system follow the MWL
with natural trend of increasing content of heavy isotopes with lowering altitude. In depth
profiles of single lakes isotope composition does not change - due to natural conditions
during sampling campaigns (probably lakes were reached in the state of the spring andfall homothermy), all waters are meteoric in origin. The water of the Strbske pleso lake is
enriched to heavy isotopes, all samples fit an evaporation line. This could be explained by
longer residence time of water or by recharging mainly from last phases of snowmelt, orby combination of both factors. Sulphate sulphur isotope ratio from lakes is the same and
they is identical with this of the snow packs.
64

REFERENCES[l ] ERTL, M., 1985: Hydrocenozy jazier Tatranského narodneho parku,. Záv re ná
správa VI-4/02, Laboratorium rybá stva a hydrobiologie Bratislava
[2] ERTL, M., 1964: Chemizmus Popradského plesa. Zbornik prá o Tatranskomnarodnom parku, 8, 55 p.
[3] HANZEL, V. - GAZDA, S. - VASKOVSKY, I. 1984: Hydrogeologia juznej astiVysokých Tatier a ich predpolia. (Hydrogeology of the southern part of the VysokéTatry Mts. and its forerland). Zapadne Karpaty, ser. hydrogeologia a inzinierskageologia, 5, 206 p. Geologicky ustav Dionyza Stura, Bratislava, 1984
[4] KONCEK, M. ed, 1974: Klima Tatier. Veda, Bratislava, p. 855
[5] KOPA EK, J. - STUCHLÍK, E., 1994: Chemical characteristics of lakes in the HighTatra mountains, Slovakia. Hydrobiologia, 274: 49 - 56
[6] MALIK, P., MICHALKO, J., RAP ANT, S., SCHERER, S. 1997: Sulphur Isotopesin Atmospheric Precipitation on the Territory of Slovak Republic. Final Report of theIAEA Research Contract No. 8673/RB, Archive of Geological Survey of SlovakRepublic, Bratislava
[7] MARHEVKOVA, K., 1997: Niektore aspekty z hladiska geochemie v povrchovýchvodách Furkotskej doliny. Diplomová praca. P írodov decká fakulta UniverzityKomenského, Katedra geochemie, Bratislava, s. 67
[8] MICHALIK, J.. - FLANDEROVA, E. - SÝKORA, M. 1976: Stratigraphic andpaleo-geographic position of the Tomanova - formation in the uppermost Triassic ofthe West Carpathians. Geol. Zbor. Geologica Carpath., 27, Bratislava, 299 - 318
[9] STUCHLÍK, E. - STUCHLÍKOVA, Z. - FOTT, J. - R ŽI KA, L. - VRBA, J.,1985:Vliv kyselých srážek na vody na uzemi Tatranského národního parku. Zbornik prá oTatranskom Narodnom Parku 26: 173-212
[10]TOMAJKA, J., 1996: K problému acidifikacie jazier vo Vysokých Tataach. Studie oTatranskom narodnom parku, l (34), 1996:33-54
65

3H-3He AGES IN LAKE BAIKAL XA01 °0613
R. HOHMANN*, R. KIPFER, D.M. IMBODENSwiss Federal Institute of Technology (ETH),Swiss Federal Institute of Environmental Science and Technology (EWAWAG),Dubendorf, Switzerland
Abstract
The 3H-3He age of a water mass is a measure of the time that has passed since the watermass was last in contact with the atmosphere. Between 1992 and 1995 a detailed study of 3H-3Heages was conducted in Lake Baikal, the deepest and largest lake by volume on Earth, toinvestigate deep water renewal in its three major basins. Maximum 3H-3He ages found were 14-17 years in the Southern Basin, 16-18 years in the Central Basin, and 10-11 years in theNorthern Basin. Rates of renewal of deep water with surface water, deduced from volume-weighted mean 3H-3He ages below 250 m depth, are about 10% yr""1 in the Southern and CentralBasins and 15% yr"1 in the Northern Basin. In the Southern Basin the mean 3H-3He age below250 m depth increased steadily from 9.6 years in 1992 to 11 years in 1995, indicating a slightdiminution in deep water renewal during this time. Correlating oxygen and dissolved helium-4concentrations with 3H-3He age allowed us to determine the mean hypolimnetic oxygen depletionrate in the water column (4.5 nmol L"1 yr"1), as well as mean helium fluxes from the lake bottom(2.8-1011 atoms m"2 s"1 in the Northern Basin, and 1.3-1011 atoms m"2 s"1 in the Central andSouthern Basins).
1. INTRODUCTION
Lake Baikal (Fig. 1), located in east Siberia, is the deepest (1632 m) and largest (23015km3) lake by volume on Earth. It holds about one fifth of the global fresh surface water. The lakeis divided by underwater sills into three main basins: the Southern Basin (max. depth: 1432 m),the Central Basin (1632 m), and the Northern Basin (897 m). The three major rivers entering thelake, the Selenga, the Upper Angara and the Barguzin, account for more than 70% of the totalannual river inflow. The only outflow is the Lower Angara at the south-western end of the lake.
Despite the lake's great depth, dissolved oxygen concentrations exceed 80% relativesaturation throughout the entire water column. CFC-12 ages determined from the verticaldistribution of chlorofluorocarbons (CFCs) are less than 16 yr in the entire lake [1]. Bothobservations indicate that deep-water renewal is surprisingly rapid and raise the question of howit occurs in such a deep lake.
A thorough theoretical analysis of stability and neutrally buoyant transport in deep, coldlakes was developed in Ref. [2]. Based on these concepts, a general analysis of processes ofdeep-water renewal in Lake Baikal was presented in Ref. [3]. Helium and tritium concentrationsmeasured in Lake Baikal from 1992 to 1995 were discussed in Ref. [4]. A six box model of LakeBaikal which bases on these data and on CFC-11 and CFC-12 concentrations was presented byRef. [5].
* Present address: Lamont-Doherty Earth Observatoiy, Route 9W, Palisades, NY, 10964, USA.
67

56
55~-
54o
0>
53
52
51
Upper Angara/1
AN
Lake Baikal
Barguzin
Selenga
50 100 km-I—————I
104 105 106 107 108 109 110
Longitude [°E]
Figure 1. Map of lake Baikal with isobaths at 400, 700 and 1000 m depth. The lake is dividedinto three basins: SJ, Cl and Nl mark the deepest points (%) of the southern, central andnorthern basins, respectively.
2. FIELD DATA AND DISCUSSION
2.1. Potential temperature, ionic salinity and oxygen concentration
Profiles of potential temperature q, ionic salinity Sc, and oxygen concentration [O2]measured at the deepest station of each basin (marked by • in Fig. 1) in May 1995 are shown inFig. 2. All temperature profiles (Fig. 2a) show inverse stratification with respect to temperature inthe top 200 m of the water column. At about 200 m depth, the temperature reaches its maximum,the so-called mesothermal temperature maximum (MTM), where it is equal to the temperature ofmaximum density (thin dotted line in Fig. 2a). Below the MTM, temperature decreases steadily.In the deepest 20 to 50 m of the Central Basin temperature decreases by 0.05 - 0.1°C. Similarbottom layers were also found in the other basins [3].
68

\N l
\
94.5 95.0 95.5SJmgkg'1]
Figure 2. (a) Potential temperature q, (b) ionic salinity sc, and (c) dissolved oxygenconcentration [o2] at stations SI (dotted line), Cl (solid line), and Nl (dashed line) measuredfrom May 18-24, 1995. The straight line in (a) is the temperature of maximum density, tmd-
Ionic salinity (Sc) is low and varies by less than 1 mg-kg"1 within the water column andbetween the basins (Fig 2b). The vertical salinity distribution in the Southern and Central Basinsis similar The destabilising effect of the slight decrease in Sc with depth in the interior of thesebasins is small and compensated for by the gradient of q (Fig 2a) In the Northern Basin, salinityis significantly lower than in the other basins Here, it increases steadily with depth and thuscontributes to the vertical stability of the water column.
Oxygen concentrations are high throughout the entire water column (Fig. 2c) Even at thebottom of the lake, the relative oxygen saturation generally exceeds 80 %.
2.2.3H-3He ages
The 3H-3He age (t) was calculated from the concentrations of tritium (3H) and tritiogenichelium (3Hefr,), i e. the helium produced by the decay of tritium, using the following equation [6]-
(1)
where X = 0.05576 yr'1 is the decay constant of tritium [7]. The 3H-3He age of a water mass is ameasure of the time that has passed since the water mass was last in contact with the atmosphereSince it is a non-linear function of 3H and 3He*n, mixing may result in a discrepancy between itand the true age [4].
3H-3He ages in the three basins from 1992 to 1995 are shown in Fig. 3 The similarity of thecurves in all three basins is remarkable: the 3H-3He ages increase steadily with depth from valuesclose to zero at the lake surface to their maxima at about 100-300 m above the lake bottom Thegreatest 3H-3He ages found were 13-17 yr in the Southern Basin (Fig. 3a), 16-18 yr in theCentral Basin (Fig. 3b) and 10-11 yr in the Northern Basin (Fig 3c). In the bottom waters of allbasins, the increase in 3H-3He age with depth is halted (Southern and Central Basins) or evenreversed (Northern Basin, sometimes in the Central Basin) implying that the bottom layer isrenewed more efficiently than the water masses found directly above the bottom layer.
69

5 10 153H -3He age [yrl
5 10 153H -3He age [yrl
0 5 10 153H -3He age [yr]
Figure 3. 3H-3He ages calculated from eq. (1) at stations Si, Cl, andNl in 1992 (b), 1993and 1995 (CJ).
Between 1992 and 1995, the 3H-3He age in the surface and intermediate layers of all basinsremained approximately constant, i.e., the increase in 3He concentration due to the radioactivedecay of tritium was balanced out by the decrease due to the flux of excess 3He to theatmosphere by vertical mixing and gas exchange. A different picture was found in the bottomlayers (lowermost 200 m). In the Southern Basin, the 3H-3He age increased steadily during theobservation period, indicating that the renewal of the bottom layer was proceeding less efficientlythan in previous years. In the Central and Northern Basins, renewal of the bottom layer variedfrom year to year, but on average the 3H-3He age was practically constant.
2.3. Deep-water renewal rates
The volume-weighted mean 3H-3He ages below 250 m depth (Table 1) provide reasonableestimates of the mean residence time of the waters in this layer. Deep-water renewal rates derivedfrom these values are about 10 % yr"1 in the Southern and Central Basins, and about 15 % yr"1 inthe Northern Basin. Corresponding mean vertical exchange velocities across the 250 m isobathare 71 - 81 m yr"1 in the Southern Basin, 73 - 77 m yr"1 in the Central Basin and about 58 - 61 myr"1 in the Northern Basin. These values are in good agreement with the mean value of 75 m yr"1
reported by Ref. [1].
In the Southern Basin, the mean 3H-3He age of the deep water increased steadily from9.6 yr in 1992 to 11 yr in 1995, which caused the vertical exchange velocity to drop from 81 myr"1 to 71 m yr"1. This is consistent with the observation made above that the renewal of thedeepest 200 m of the basin was slight during the observation period.
**
2.4. Oxygen consumption rate and He flux from the lake bottom
The 3H-3He age provides a natural time scale for the determination of oxygen consumptionrates in aquatic systems. Fig. 4a shows the oxygen saturation anomaly calculated at the in situtemperature plotted against 3H-3He age below 200 m in all three basins for the years 1993 and1995. The average oxygen consumption rate per unit volume, given by the slope of the regressionline, seems to be constant in space and time: °2 = (4.5 ± 0.3) nmol I"1 yr"1. Oxygen is consumedboth in the water column and at the sediment surface. Thus, °i combines both the volume
70

Table 1: Mean 3H-3He age below 250 m depth and mean vertical velocity vz of wateracross the 250 m isobath, h is the mean depth of the basin below 250 m.
Basin /, [r
South 781
Central 807
North 438
-30
^ -40
•3 -50|" -600
-70
-80
JT 8'60O.H^° 6gu
*k 4*
EC 2
0
n] year199219931995199219931995199219931995
Bo\
• 1 • • ! 1 1 I I
_
_r*
'. a -'B *B- ' n
• ^?o *&±J^£>• r^^^, ,
D 5
3H-3Heage[yr] vz9.64±0.479.86±0.8211.01±0.5110.5410.3811.1010.5210.4710.557.1910.857.6210.737.5210.80
1 '
a) :•i •
f f i f f l ^
v x oo v x
X O
*•*\
s —
^^x -
o1 1 — 1 — I I I I I I — h -
b) :.a .
-ffl % O O '"'OB *
0 AA ^
A -£ -::J:>^7^D
O ^-^"~~~^^ ~^^-^~f^ A AA o ft
1 . 110 15 2
[m yr1]81.179.270.976.572.777.061.057.658.3
.03H-3He age [yr]
Figure 4. (a) Correlation between oxygen deficit and 3H-3He age, and (b) between 4He excessand3H-3He age in the southern (t), central (O) and northern (B) basins in 1993 and 1995. Theregression lines in (b) have been forced through the origin.
( °2>F) and the areal ( °i>A) oxygen sinks [8]. A rough estimate of the volume oxygen sink,J°T.y •= (4.2 ± 0.5) umol I"1 yr"1, is yielded by neglecting the data from the 200 m thick bottomlayer of each basin where the ratio of sediment area to water volume is particularly large and theareal sink therefore expected to be dominant.
A similar approach can be adopted to determine the helium flux from the lake bottom.Excess 4He plotted against the 3H-3He age is shown in Fig. 4b. As a first approximation, the 3H-
71

3He age is assumed to be independent of the flux of terrigenic helium from the lake bottom, andthus the 4He-flux per unit volume from the sediment (^) can be estimated as the slope of theregression curve. Multiplying by the mean basin depth h yields the He flux per unit area, FHe .Helium fluxes in the Southern and Central Basins are similar (Fne A 1.3.1011 atoms m"2 s"1). In thetechnically most active Northern Basin, where the largest 4He excess is observed [4], the flux issignificantly larger (FHe A 2.8.1011 atoms m"2 s"1). The He flux in Lake Baikal is about one orderof magnitude larger than the average flux from the continental crust (A 3.1010 atoms m"2 s"1 [9]),but smaller than the fluxes related to the injection of mantle helium into lakes in active tectonic orvolcanic regions (e.g. Refs. [10, 11]).
The helium isotope ratio of the terrigenic helium component injected from the lake bottom,determined from measurements of water from hydrothermal springs in the vicinity of the lake,was reported to be ~ 2.2.10~7 [4].
ACKNOWLEDGEMENTS
This work was supported by the Baikal International Center of Ecological Research(BICER) and the Limnological Institute of the Siberian Division of the Russian Academy ofSciences, in Irkutsk. It was made possible by financial support from the Swiss Federal Institute ofEnvironmental Science and Technology (EAWAG), the Swiss Federal Institute of Technology(ETH), the Swiss Federal Office for Science and Education (BBW) and the International AtomicEnergy Agency (IAEA).
REFERENCES
[I] WEISS, R. F., et al., Deep-water renewal and biological production in Lake Baikal,Nature 349 (1991) 665-669.
[2] PEETERS, F., et al., Description of stability and neutrally buoyant transport in freshwaterlakes, Limnol. Oceanogr. 41 (1996) 1711-1724.
[3] HOHMANN, R., et al., Processes of deep-water renewal in Lake Baikal, Limnol.Oceanogr. 42 (1997) 841-855.
[4] HOHMANN, R., et al., Distribution of helium and tritium in Lake Baikal, J. Geophys.Res. (1998), in press.
[5] PEETERS, F., et al., Modelling transport rates in Lake Baikal: gas exchange and deepwater renewal, Env. Sci. Technol. (1997).
[6] TORGERSEN, T., et al, A new method for physical limnology - tritium-helium-3 ages -results for Lakes Erie, Huron and Ontario, Limnol. Oceanogr. 22 (1977) 181-193.
[7] UNTERWEGER, M. P., et al., Preparation and calibration of the 1978 National Bureauof Standards tritiated-water standards, Int. J. Appl. Radiat. 31 (1980) 611-614.
[8] LIVINGSTONE, D. M., IMBODEN, D. M., The prediction of hypolimnetic oxygenprofiles: a plea for a deductive approach, Can. J. Fish. Aquat. Sci. 53 (1996) 924-932.
[9] O'NIONS, R. K., OXBURGH, E. R., Helium, volatile fluxes and the development ofcontinental crust, Earth Planet. Sci. Lett. 90 (1988) 331-347.
[10] AESCHBACH-HERTIG, W., et al., Quantification of gas fluxes from the subcontinentalmantle: the example of Laacher See, a maar lake in Germany, Geochim. Cosmochim. Acta60(1996)31-41.
[II] KJPFER, R., et al., Injection of mantle type helium into Lake Van (Turkey): the clue forquantifying deep water renewal, Earth Planet. Sci. Lett. 125 (1994) 357-370.
72

DYNAMICS OF LAKE KOYCEGIZ, SW TURKEY: AN ENVIRONMENTALISOTOPIC AND HYDROCHEMICAL STUDY
C.S. BAYARI, T. KURTTAS, L. TEZCANInternational Research & Application Center for XA0100614
Karst Water Resources,Hacettepe University,Ankara, Turkey
Abstract
Lake Koycegiz, located in southwestern Turkey, is a meromictic lake with a surface area of 55km2. Impermeable ophiolitic rocks, and groundwater bearing alluvium and karstified limestoneare the major geologic units around the lake. K6ycegiz lake, fed mainly by rainfall and streamflow, discharges into the Mediterranean Sea via a 14 km long natural channel. The average waterlevel is estimated to be slightly above the sea level and the estimated lake volume is 826 millionm3. Lake level fluctuations are well correlated with rainfall intensity. Lake Koycegiz comprisestwo major basins; Sultaniye basin (-32m) at the south and Koycegiz Basin (-24m) at the northwhich are connected by a 12m deep strait. Environmental isotopic and chemical data reveals thatthe Lake Koyceg has complicated mixing dynamics which are controlled mainly by density-drivenflow of waters from different origins. The lake is fed mainly by rainfall and stream flow as lowdensity waters and by high density thermal groundwater inflow at the southern coast. Completeannual mixing can not be achieved, because of the density difference between mixolimnion andrecharge. Continuous high-density thermal water input into the Sultaniye basin is the major factorcontrolling the lake dynamics. The high density thermal groundwater discharging into the lakesinks to the bottom of Sultaniye basin and overflows toward the north along the bottom surface.During its travel, dense bottom water is mixed with mixolimnion water and as the distance fromthe thermal water inflow increases, the density tends to decrease throughout the lake. Calculationsbased on long-term average electrical conductivity data reveal that about 60% of mixolimnion inboth basins is replenished annually, whereas the annual mixing with mixolimnion for Sultaniyeand Koycegiz Basins is 20% and 30%, respectively. Turn-over times for mixolimnion andmonimolimnions of Sultaniye and K6ycegiz Basins are estimated to be 2 years, 5 years and 3.5years, respectively.
1. INTRODUCTION
Lake Koycegiz, located in southwestern Turkey, is among the "Specially Protected" areasbecause of its natural beauty and ecological and archeological importance. The lake is connectedto the Mediterranean Sea coast, Iztuzu, where endangered sea turtle species, Caretta caretta, nestand breed (Figure 1). Studies for the protection of this environment which is also among thepromising touristic development sites, from anthropogenic activities have been initiated in the1980's Biological inventory of the area has been prepared, and some preliminary informationregarding the hydrochemical structure has also been produced in these studies [1,2].
However, since the proper design and management of the activities directed to develop thetouristic potential of the region need more accurate and reliable information on the hydrologicsystem, a detailed study has been initiated by the International Research and Application Center
for Karst Water Resources (UKAM) of the Hacettepe University, Ankara, Turkey.International Atomic Energy Agency (IAEA) supported these activities under the scope ofCoordinated Research Program entitled "Isotope Techniques in Lake Dynamics Investigations".National institutes such as, Electrical Power Resources Research Authority (EIE) which is in
73

charge with the operation of national hydrometric observation network, and the Technical andScientific Research Council of Turkey (TUBITAK) has also participated to/contributed in theproject.
Because of the complicated geologic, hydrologic and hydrogeologic nature of the area,wide variety of investigation techniques such as, hydrometric measurements, in-sitehydrochemical measurements/analyses, spatial depth-specific physical and chemicalobservations, environmental isotopic evaluations etc. have been employed to produce mostreliable data that characterize the hydrologic system [2].
MEDITERRANEAN SEA
Figure 1: Location map of the Lake Koycegiz.
2. MORPHOLOGIC CHARACTERISTICS OF LAKE KOYCEGIZLake Koycegiz has a shape of slightly distorted rectangle extending in NNE-SS W direction
(Figure 2). Maximum length and width of the lake are 12km and 6.5km, respectively. Theaverage surface area is 55 km2. The lake is permanently stratified in terms of distinct chemicaland isotopic composition and thus, it is classified as meromictic. Lake level does not fluctuate toa great extend and usually is at its equilibrium level which is ca. 2 m asl. During episodic winterrainfalls and streamflow fed by these events, the lake level rises temporarily about 1m above itsnormal, but the excess water is rapidly discharge into the Mediterranean Sea via a 14km longnaturally formed channel which is a part of estuary located between the lake and the sea.
The area where Lake Koycegiz is located is a tectonically active horst-graben region. TheAsia Minor "or the Anatolian Plate" has been pushed northward by the Arabian plate toward"Russian Plate" located to the north. Since the "Russian Platform" forms a resistant barrier, theAnatolian Plate moves westerly against "European Plate" which is another relatively stablecrustal component. The Anatolian and European plates meet along the Aegean Sea where, theweaker Anatolian Plate spreads in north-south direction to form horst and graben structures alongthe coastal zone. Horst-graben tectonics in the western Anatolia is characterized by ridges andplains extending perpendicular to the sea. Deep faults and hydrothermal activity associated withthese faults are common in this area. Two of these graben structures form the Koycegiz and, tothe east, Dalaman Plains. The Lake Koycegiz extend in the Koycegiz plain between themountains in the northeast and the Mediterranean Sea in the southwest.
74

Current geomorphologic features suggest that the formation of Lake Koycegiz is a result ofinterplay of tectonic and fluvial processes. Whereas, the plain is being filled by alluvium broughtfrom mountainous part via large rivers, such as, Namnam9ay and Yuvarlak9ay, horst-grabenfaulting causes the plain surface to subside continuously. Echo-sounding profiles indicate activefault lines along the lake bottom.
DALYAN
Figure 2: Bathymetric profiles and the site names mentioned in the text.
The lake comprises of two basins; first located at the northern part named as "KoycegizBasin" and, secondly located at south, named as "Sultaniye Basin". These names have beenattributed from the settlements situated nearby the respective basins. The maximum depths in theKoycegiz and Sultaniye basins are 24m and 32m from the mean lake surface, respectively. Thebasins are connected by the Yogun Strait that extends between Cape Yogun and Gedova Hillwhere the distance between the facing coasts of lake reduces to 1,750m. The lake depth becomesshallow (max. 6 m) in most parts of the Yogun Strait, but suddenly deepens at the western end
(Cape Yogun) where a normal fault extending in NNE-SSW direction passes through. Here, thelake bottom comprises the down-thrown block of the fault, and the maximum depth is 12m. Threeyears' observation carried out in this study indicated that the depth of Cape Yogun has a drasticcontrol over the permanent stratification of lake water, especially in the Sultaniye basin. Theboundary between mixolimnion (top water zone) and monimolimnion (bottom water zone) passesalong 12m depth in both basins of the lake during most of the year. However, the thickness ofmixolimnion in Koycegiz Basin deepens up to 16m in high water season, whereas it is absolutelyconstant at 12m in the Sultaniye Basin.
75

3. DATA COLLECTION AND QUALITY
A vast amount of hydrologic, chemical and environmental isotopic data has been collected inthis investigation. Since the volume of data is well beyond the limits of this paper, only a briefsummary is given here. Readers willing to access all the data should refer to progress reportsprepared under IAEA Research Contract RB/7997 [2, 3]. However, in order to provide an insightfor the quality of data which have been evaluated in this paper, detailed explanations regardingthe data collection, field measurements and analyses are given in the following paragraphs.
Stream flow-rate measurements based on the velocity-area method were carried out once amonth in all streams discharging into the lake. In the wet season, when episodic floods occur, thesampling frequency was increased up to four measurements per site per month. The quality ofmeasurement is +/- 10% of the measured value. Meteorological observation data have beencollected from the records of nearby stations operated by the State Meteorological Affairs (DMI).Locations of hydrometric measurement and meteorological observation stations are shown inFigure 3.
Water samples for in-situ measurements and laboratory analyses of hydrochemical andisotopic parameters have been collected from thermal and cool karstic springs, streams, sea,rainfall and the lake. Seasonal (four times a year) samples have been collected from thermal andcool karstic springs located around the lake. Sampling procedures suggested by APHA et al. [4]such as filtration through 0.45micron filter, acidification of cation samples etc. have been followedin these studies. Depth-specific water samples from the lake have been collected in two ways. At
LfcCEND32-«m
4-
KOYt^<J^z ^ay* MOmm 0
*r , —— -| Laki fevcl obtervaiioa tiauoo ^tknuk Str
^ ^| 1 Mke wHntrn. A hydmcbeuacaJ «npling Mjrijon "^*
1m~ SdT«iifl*y. tiBwuretreni Hcbon 2&-20m
Hj^chcB.oJpnffl.BK
Ma|i« spnng
Stream
Nonul fault(+ upchtuwn downchro«m I
^UIMNI im J«! ikpili
Figure 3: Map of hydrometric, meteorological and lake hydrochemical / isotopic sampling andprofiling stations in and around Lake Koycegiz.
76

the initial stage of research, a "Ruttrier type" sampler made of PVC (polyvinylchloride) has beenused. In order to assure a better sampling quality, later on, a peristaltic pump with tygon tubinghas been used. The inlet end of tubing has been fixed to Hydrolab Data Sonde 3 TMmultiparameter water quality probe which is equipped with a depth gauge to determine thesampling depth within +/- 0.5m. Because of the permanent stratification in lake water, utmost carehas been spent to collect water samples exactly from the pre-determined depths. Usually but notalways, sampling works have been carried out when the lake water stands still in order to increasethe sampling quality. Maximum error of sampling depth is estimated to have been +/- I meter.Lake water sampling locations have been pre-determined on a 1/25000 scale topographic map byconsidering the echo-sounding profiles obtained in a previous study by Bayari et al. [2]. A GlobalPositioning System (GPS) navigator has been used to locate the sampling sites within +/- 100m.
Physical and chemical parameters such as temperature, pH, specific electrical conductivity,dissolved oxygen, redox potential and turbidity have been measured in-situ. At the initial stage,these parameters were measured in water samples brought to the boat. However, after the fifth(inclusive) field campaign, they are measured in-situ, that is at the desired depth bymeans of a water quality probe equipped with relevant sensors. YSI (Yellow SpringsInstruments™) Model 33 Salinity-Conductivity-Temperature (SCT) meter, YSI Model 54Dissolved Oxygen Meter, ORION™ Model 290A digital pH meter have been used for the in-boat measurements. All instruments have been precisely calibrated according to manufacturers'instructions which conforms to APHA et al. Standards [4]. Alkalinity which is subject to rapidchange upon CO2 equilibration with atmosphere, has been measured in the field by means ofGran's potentiometric method [5].
Major cations (Ca2+, Mg2+, Na+, K+) and anions (Cl', SO42\ CO3
2VHCO3-) have beenanalyzed from samples collected at each campaign, whereas trace metals (Fe, Mn, Cr, Cu, Pb,Zn) and nutrients (PO4~, NO3", NO2" and NH3
+) have analyzed when needed. Major cations andtrace metals have been analyzed on a Perkin Elmer™ Model 280 Atomic AbsorptionSpectrometer according to the methods suggested in APHA et al. [4]. Nutrients and SO4
2" havebeen analyzed on a Bausch Lomb™ Model Spectronic 21 UV-visible spectrometer following themethods given in APHA et al. [4]. Chloride analyses have been performed by means ofArgentometric method [4]. Water samples collected for environmental isotope content (2H, 3Hand I8O) have been analyzed IAEA's Vienna laboratories.
4. HYDROLOGY, GEOLOGY AND HYDROGEOLOGY4.1. Hydrology
Most of the surface water into the Lake Koycegiz is supplied by two perennial streams,which are Namnam Cay and Yuvarlakfay discharging into Koycegiz Basin. Namnam Cayhaving the largest drainage area that lays over impermeable ophiolitic rocks supply most of thesurface inflow, whereas Yuvarlak9ay stream, fed mainly by a karstic spring, has a relativelysmall contribution. Mean annual discharges of Namnam Cay and Yuvarlak9ay streams are 11mVsec and 4.5 mVsec, respectively. Other streams distributed around the lake dischargeintermittently only in wet season. The only outflow of Lake Koycegiz is via Dalyan Channel,which is a 14km natural channel that connects the lake to the Mediterranean Sea. Simultaneousflow rate measurements carried out in flowing streams and the lake outlet indicates that theoutflow exceeds the total inflow by streams and the difference is supplied by direct rainfall inputover the lake surface.
Most of the annual inflow to the lake is provided between November and May.Accordingly, most of the discharge from the lake occurs in this period when the lake levelreaches its maximum (Figure 4a and b ). The response of lake level to the rainfall and streamflowinput is rather fast, and the lake level reduces to its normal within several days. During summer
77

~3Kurmmi-M YuvvUk
I I
Figure 4: a. Variation of the rates of inflowing streams and the outlet (top). Discharge scale onthe right is for Namnamcay and Outlet, b: Correlation of the outflow rate from the LakeKoycegiz and the monthly precipitation of surrounding meteorological stations(bottom). Average lake level is given as "14-15 Average".
months, when the lake is fed only by small contributions from Namnam Cay and Yuvarlak9aystreams, the lake level stands still slightly above the sea level. In Figure 4b, variation of meanlake level (average of northern and southern stations) is shown together with the monthlyprecipitation values of neighboring meteorological observation stations (i.e. Dalaman andKoycegiz). Comparison of Figures 4a and 4b reveals that the lake level is more closely related toprecipitation amount rather than flow rate of feeding streams.
4.2. Geology and Hydrogeology
The Koycegiz Lake Basin is located at the western end of the Taurus mountain ridge whichis a part of Alpine-Himalayan orogenic belt. As this tectonic belt has formed as a result ofcompression tectonics during the closure of Tethys ocean, the geologic structure comprisesmainly of imbricated units. The geology of the Koycegiz Lake basin has been studied byGraciansky [6]. Geologic structure comprises of three structurally different sequences of rockunits, namely autochthonous carbonates and detritics, allochthonous Lycien Nappes, andophiolite nappe (Figure 5). This tectono-stratigraphic sequence is overlain by the post-orogenicsediments of Plio-quateraary that expose in lowlands such as, riverbeds and Koycegiz andDalaman Plains.
The tectono-stratigraphic sequence starts with the metamorphic basement rocks belongingto Menderes metamorphic massive located to the northwest. Metamorphic rocks are covered byslightly metamorphosed carbonate rocks which in turn overlain by autochthonous Beydaglaricarbonates of Cenomanian-Early Miocene age. This formation is made up of thinly bedded
78

MEDITERRANEAN SEA
sg
6<
EXPLANATION
|j[||[| Post-tectonic units (Pllo-quaternary sediments)
p3T] Ophiolite nappe (Perldotlte, Harzburglte, Dunlt, and Serpentine)
t -. J Flysch and Tectonic ComplexI" • (clayslone, marl, sandstone, blocks of limestone, diabase and radiolarite)
li'i' 11 Lyden Nappes (limestone, dolomite) karstte
Flysch (sandstone, marl, claystone, limestone) ImperviousBeydaglan Carbonates (llmestome) karstlc
Basement rocks (schist, marble, limestone) pervious
-_ - ' Surface water divide
tOI Hydrochemical-lsotoplc sampling pointO Township
Figure 5: Geologic map of the Lake Koycegiz Basin.
micritic limestone and thick bedded calcarenite. A Miocene flysch, comprising of alternating se-quences of claystone, marl, sandstone and limestone, conformably overlies the Beydaglancarbonates. Small outcrops of autochthonous sequence are observed in the northwestern part ofthe Koycegiz Lake basin. The Lycien Nappes, which technically overlie the autochthonoussequence, are made up of limestone formations, each coming from a different paleogeographicorigin and containing various stratigraphic units [6]. Another nappe unit, called the tectoniccomplex, lies tectonically in between the Lycien Nappes and the overlying ophiolite nappe. Thetectonic complex is made up of limestone, radiolarite and diabase blocks. The ophiolite nappe,
79
containing peridotite, dunite, harzburgite and serpentine locally overlie the former geologicformations, where they form lowlands during the emplacement of the ophiolite nappe.
Two major tectonic phases that contributed the geologic evolution of the area is inferred[6]. At the initial stage, lateral tectonic movements were dominant and this phase were resultedin the settlement of allochthonous units over the basement rocks and autochthonous carbonates.After the Late Miocene period when the nappe settlement terminated, vertical (mostly normal)faulting leading to today's horst-graben morphology started to develop. As a result of the horst-graben tectonics, a number of normal faults trending NE-S W and forming horst-graben structuresthroughout the basin occurred. The present day thermal springs located in and around the basinare associated with recent faulting extending possibly down to the basement rocks. During thePliocene, the lowlands (grabens), which form Koycegiz and Dalaman Plains, were filled withterrigenous material comprised of marl, conglomerate and limestone. The Koycegiz Lake started
to form during the Plio-quatemary time as a result of the terrigenous material depositionbetween the lake and sea.
Allochthonous limestone formations (Lycien Nappes) and the Plio-quaternary alluvium arethe major water-bearing units in the Koycegiz Basin. Alluvium surrounding the lake is feddirectly from rainfall and from the karstic limestone by means of seepage. The allochthonous
limestone exposing to the north of lake is also fed by underground drainage from thenorthern part of the Dalaman Basin located to the northeast [7, 8]. The ophiolite nappe, whichcrops out in many parts of the basin, is practically impermeable and, therefore is not significantfrom the hydrogeological point of view. The springs discharging from this unit are of localorigin. The thermal and karstic springs discharge from allochthonous limestone where it isintersected by faults. The thermal springs are located in the southern part of the basin, whereasmost of the karstic springs are located in the northeastern part. Hydrogeology of Koycegiz LakeBasin has been studied in detail by Giiner [9].
5. ENVIRONMENTAL ISOTOPIC EVALUATIONS5.1. Data
Environmental isotopes (3H, 2H and I8O) have been utilized in this study to identify theinter-relation among waters of different origin and to understand the interaction betweenmonimolimnion and mixolimnion waters. Apart from the data produced from the samplescollected in this study, those given by previous studies [2, 8] have also been used. Allenvironmental isotope samples have been analyzed by the IAEA under various research projects.
5.2. End-Members and Lake Water
Variation of oxygen-18 and deuterium composition of all water samples imply that thereexist four isotopically distinct water types in the study area (Figure 6). Starting from the onemost isotopically depleted, these are 1: Sea water, 2: Thermal waters, 3: Lake waters (3a:monimolimnion, 3b: mixolimnion), 4: Local precipitation and fresh groundwater fed by thisprecipitation. Sea water (group 1) and fresh waters (group 4) represent the isotopic end-membersin the area. Samples from group 4 scatter around a Local Meteoric Water Line (LMWL) with adeuterium excess value of+16 which is apparently higher than that of Global Meteoric WaterLine (GMWL). Same deuterium excess value has also been reported by Yurtsever [10] for theprecipitation observed in Antalya IAEA-WMO network station which is located 250 km to theeast of study area.
Water samples other than fresh waters and precipitation deviate from the LMWLindicating a mixing between fresh waters (group 4) and sea water (group 1). Thermal waters(Kubbeli Hamam: Dommed Bath and Camur Banyosu: Mud bath) are more closely located to
80

sea water samples. Position of thermal water samples on the 18O/D graph implies that thethermal waters should have formed as a result of mixing of fresh water (group 4) and sea water(group 1) with dominant sea water component. This argument is supported by the chemicalcomposition of water samples. Thermal waters have electrical conductivity values (35000microS/cm) in between those of fresh water (max. 1000 microS/cm) and sea water (55000micro S/cm). Although, some of the ionic composition of thermal water should have been gainedfrom the aquifer rock by dissolution, it is apparent that there is also substantial sea watercontribution to the evolution of thermal waters. Considering the geologic structure in the area, itis concluded that the deep circulating fresh groundwater comes in contact with sea water (eitherconnate or recent) and rises to the surface through the deep fault planes to form thermal springsin the area. Two of the thermal water samples (Kubbeli Hamam: Dommed Bath and CamurBanyosu- Mud bath) deviate from the "mixing line" connecting fresh waters, lake waters,
thermal waters and sea water. Even if, these deviations may be explained by measurementerrors, it is also possible that they may have undergone oxygen isotope shift because of exchangebetween thermal aquifer rock and water. However, degree of isotope shifty observed in thesesamples is also much greater than those observed in waters in major geothermal fields of Turkeywhere reservoir and fluid temperatures as much as 130 °C and 250 °C have been observed,respectively.
Lake water samples which deviate from LMWL and cluster around the mixing line thatconnects these samples to thermal waters comprise of two groups each representing waters frommixolimnion (Group 3a) and monimolimnion (Group 3b). Monimolimnion (bottom) waters aremore depleted isotopically and therefore, located more closely to thermal waters. The deviationof mixolimnion waters implies that they have subject to evaporation as expected from such anopen water body. However, their shift from the original water located on the LMWL is alsofollows the mixing line between fresh water and thermal water. In other words, the mixing andevaporation effects upon isotopic composition of lake waters can not simply be separated on theI8O/D graph.
Oxygen-18 (%oSMOW)
DCD
Ic'
toO
Figure 6: Meteoric water, evaporation and mixing lines fitting to waters samples collected fromvarious points in and around the Lake Koycegiz.
81

Closer inspection of I8O/D indicates although, the samples from monimolimnion andmixolimnion are clustered roughly in separate groups, the monimolimnion samples fromSultaniye Basin are more depleted compared to those of from Koycegiz Basin. It is clear thatamount of stable isotopic depletion of monimolimnion samples increase with increasing depth.Similarly, isotopic depletion of mixolimnion waters from both basin also increases withincreasing depth even if they are less depleted than those of monimolimnion waters. Thedifference between monimolimnion and mixolimnion waters in Sultaniye Basin is much moreapparent than that of in Koycegiz Basin. These observations imply that i) relatively good mixingoccurs in Koycegiz Basin, ii) most depleted waters are found in the deeper part of Sultaniye basinimplying that the source of depleted water should be more closely located to this part of the lake.These arguments are also correlated well with the hydrochemical data as will be discussed in thefollowing chapters.
5.3. Isotopic Profiles and Lake Water
Stable isotope profiles of lake waters from Sultaniye and Koycegiz Basins are shown inFigure 7. These profiles indicate that the mom'molimnion waters in both basins have more distinctisotopic compositions than those of respective mixolimnion waters which are less isotopicallydepleted. Relative isotopic enrichment observed in mixolimnion waters is attributed to thecontribution from group-4 waters (i.e. precipitation, stream flow and rainfall). It appears that atleast part of the monimolimnion waters mix with group-4 waters to form isotopic composition ofthe mixolimnion. The deuterium content in the mixolimnion in both basins is between -17 and -20per mil SMOW, and does not show an appreciable variation along the depth. The isotopichomogeneity of mixolimnion water suggest that, after the formation of this water by mixing ofgroup-4 and monimolimnion waters, the mixolimnion is well mixed.
The oxygen-18 composition of mixolimnion in both basins is between -3 and -3.5 per milSMOW and like deuterium, the oxygen-18 content is also homogenous. The transition zonebetween monimolimnion and mixolimnion is rather sharp and extends along ca. 13m depth in thissampling period (December 1994). In succeeding field campaigns, it is well established that thetransition zone is nearly constant at this depth in the Sultaniye Basin, whereas it fluctuates between13m and 16m in the Koycegiz Basin. The reason for this-fluctuation is believed to be theincreasing inflow of Namnamsay and Yuvarlak9ay streams discharging into the Koycegiz Basin,and recent rainfall input. Both the deuterium and the oxygen-18 contents in the monimolimnion ofSultaniye Basin is nearly constant except the deepest sample (-32m from mean lake level).Deuterium and oxygen-18 contents range between -10.5 and -11.5 per mill SMOW and -2 and -2.5per mill SMOW, respectively. However, in the Koycegiz Basin, the monimolimnion is notisotopically homogenous as it is in Sultaniye Basin, and the stable isotope content is enrichedlinearly from the bottom water to transition zone. The stable isotope composition of bottom water(24m) in the Koycegiz Basin is less depleted than that of bottom (32m) water of Sultaniye Basinbut more or less the same as the sample collected from the same depth (24m) at the SultaniyeBasin.
The presence of most isotopically depleted samples at the deepest points of both basins maybe accepted as an indication of the inflow of water that is isotopically most depleted. Except thesea water, the most isotopically depleted waters in the area are of thermal origin. Sea waterintrusion via the Dalyan Channel toward the Lake Koycegiz has not been observed during theobservation period between 1993 and 1997; neither was such evidence presented in the studiescarried out previously. Therefore, the most plausible source of isotopically depleted water in themonimolimnion of the Sultaniye Basin should be the thermal water contribution. Sultaniye spring,located just along the shoreline to the south of Sultaniye Basin, has an average temperatureof 40°C and any such thermal water inflow that may discharge through the lake bottom isexpected to have been influenced by this high temperature. However, no such evidence has
82

been obtained from extensive spatial temperature measurements carried out in various fieldcampaigns, probably because of diffuse inflow of thermal water. It is inferred that some of thethermal water ascending to the Sultaniye Spring (which is more depleted than monimolimnion
water) discharge into the lake through fractures/joints located on the southern bank of thelake. As will be demonstrated later in this paper, this water has higher density than that of anywater in the Sultaniye Basin and sinks to the lake bottom to form monimolimnion water.
Oxygen-18 (%> SMOW)-4 -3.5 -3 -2.5 -2 -1.5 -1I I I I i I I
Deuterium (%> SMOW)-20 -18 -16 -14 -12 -10 -8 -6
Oxygen-18 (%> SMOW)•4 -3.5 -3 -2.5 -2 -1.5 -1i———i———i———i———i———i———i
Deuterium (%o SMOW)-20 -18 -16 -14 -12 -10 -8 -6
K ——
t
-A-J
-A-
A
L *
-*——
. *
—— *-
A*
,- A-
co'cEoEco^
AA
A
*M
——Ai
*\L*-L*A—*
r+-t *-Jr-L
OcESIE
\^
*M.
SN
-11 1,, II. r\- « \0 \•g4 C *"*• .* n- 16 sr 12
\ ^-\ 16
24 \
20
OO 14
* O-18
^~
A
A
— A
v^
(IN\
-A-
_J .
*
A*^A-
X,
H-2
\
tsz. c-1!.11"M• /ttcj)
1. -
?
\V
1
'
))
I
cA-*
*
o
o>~5-.= E
.S 'cE g> ucrt .>*
t. w
1 1
O'c
"oX
co'cEoEc0
Figure 7: Deuterium vs. oxygen-18 profiles from two major station on the Lake Koycegiz (Left:Koycegiz Basin, Right: Sultaniye Basin).
The rate of isotopic depletion in the Sultaniye monimolimnion decreases upward with asudden shift at -12m from the average lake surface where the transition zone betweenmixolimnion and monimolimnion in this basin is located. Bathymetric profiles of SultaniyeBasin indicates that the isotopically depleted monimolimnion water can outflow only toward theKoycegiz Basin via Yogun Strait where the lake bottom rises to -12m below mean lake level(m.1.1.) because the bottom elevation of the lake outlet to the Dalyan Channel is at 6 to 7m belowm.1.1. It appears that the high density thermal water sinking into the bottom of Sultaniye Basinis subject to diffusive mixing as the infilling dense water rises to transition zone. At the top ofmonimolimnion of Sultaniye basin, the stable isotopic composition is enriched with respect todeeper parts. The outflowing Sultaniye monimolimnion water is still denser than themixolimnion waters of both basins. Therefore, the outflowing water tend to sink into the bottomof monimolimnion of Koycegiz Basin. The similarity between the isotopic compositions ofoutflowing water (that is, Sultaniye monimolimnion water with O-18= -2.23 %o and deuterium= -12.5 %o at 12m/13m depth) and the bottom water of Koycegiz Basin (with O-18= -2.43 %oand deuterium = -12.2 %o at 24m depth) is quite striking. This similarity implies that the densewater outflowing from Sultaniye monimolimnion keeps its isotopic composition during its travelto the bottom of Koycegiz basin. This is somewhat surprising, because the mixolimnion water
83

from Koycegiz basin flows in opposite direction and is expected to cause turbulent mixing alongthe transition surface. Absence of such a turbulent mixing can be accepted as a sound evidenceof very low flow velocities along the mixolimnion and monimolimnion surface at the YogunStrait or the presence of a connection between two basins that is located below the transitionsurface.
The depth of transition zone at 12m in the Sultaniye Basin is a dominant characteristic asrevealed by the hydrochemical data obtained in all field campaigns. The endurance of transitionzone at 12m in the Sultaniye Basin is believed to be due to the physical (bathymetric) barriercreated by the depth of Yogun Strait connecting both basins (see Figure 2). It seems, even thoughthe surface water inflow into the Koycegiz Basin causes a mixing of monimolimnion andmixolimnion to some extend, the resultant water is still less dense than the monimolimnion ofSultaniye Basin and most of the this water leaves the lake via Dalyan Channel by flowing overthe monimolimnion of Sultaniye Basin.
Three distinct regions are observed in the stable isotopic composition of the KoycegizBasin. The bottom water which expose isotopic similarity to the upper most monimolimnionwater of Sultaniye Basin, becomes increasingly enriched as the transition zone located at 16mdepth is approached. Between the bottom of monimolimnion and the transition zone the isotopicenrichment is linear and correlated well with the depth. Between 12m and 16 m depths, theisotopic composition is almost homogenous implying that turbulent mixing is effective. Above12m depth up to the surface, the isotopic composition becomes increasingly enriched probablybecause of the recent surface and rainwater input in to the lake. The isotopic composition ofmixolimnion in both basins are very similar especially in the surface (-1m) samples.
5.4. Tritium profiles
Tritium composition of lake water has been determined in dry (August 1994) and wet(February 1994) seasons (Figure 8). Although, the variation of tritium content with depth in bothbasins suggests a small decrease, systematic variation observed in stable isotope profiles is notclearly demonstrated here. Even though, this irregular variation can be attributed tomeasurement error which is roughly around +/- 0.5 TU, it is apparent that there is no largedifference between the tritium composition of monimo and mixolimnion waters. In both periodsthe relatively low tritium contents are observed in the bottom waters confirming the deductionsmade on the basis of stable isotope content. The Sultaniye thermal spring's water which isbelieved to sink to the lake bottom in this sector has also low tritium content (0.4 +/-0.3 TU inAugust 1994 and 0.5 +/-0.3 TU in February 1994).
Because the degree of measurement error does not allow to make deductions on theevolution of Sultaniye monimolimnion water, a rough mixing calculation was made based on theaverage stable isotope, electrical conductivity values of assumed end-members. Table x showsthat when Sultaniye thermal spring and Sultaniye mixolimnion are mixed at 40% and 60%,respectively, the electrical conductivity and stable isotope composition of hypothetical mixingwater resembles well enough to monimolimnion water in this basin. To maintain the obtainedmixing ratio, the tritium content of the mixolimnion is calculated to be 10.4 TU. It may beassumed that the error associated with this figure is, like real measurements, +/- 0.5 TU.Although, the calculated tritium content is above the measured values in the lake, it can still beaccepted as a plausible value. Previously measured mixolimnion tritium contents (Koycegizbasin = 13.2 +/-0.6 TU, Sultaniye basin = 12.5 +/-0.5 TU; [8]) and those measured in local
springs which are fed from annual rainfall (Marmarh spring, 9.1+/-0.5 TU in August 1994and 15.0+/-0.3) suggest that the calculated tritium content for mixolimnion is within acceptablelimits.
84

Table 1: Major components contributing to monimolimnion of Sultaniye Basin.End-member
Thermal water (A)Sultaniye mixolimnion (B)Sultaniye monimolimnionMixing (%40 A + %60 B)
ConductivitymicroS/cm
3000049001475014940
Oxygen- 18%o SMOW
-0.8-3.33-1.78-2.318
Deuterium%o SMOW
-3.9-18
-12.1-12.36
TritiumTU0.5
10.4*6.46.4
Note: * Calculated mixolimnion tritium content.
•t •<!• **a> o> »o> ^ 2>5 <» 3< —r u. <
7 7.5Tritium (TU)
Figure 8: Tritium profiles from Koycegiz and Sultaniye Basins.
6. HYDROCHEMICAL EVALUATIONS
6.1. DataIn order to have a complete picture of the dynamics of Lake Koycegiz, and to provide
supporting evidence for evaluations made on isotopic data, 6 hydrochemical field campaignshave been carried out. Evaluation of field data is given in the following paragraphs. At this point,method of data collection should be mentioned to explain the reliability of field data. In the first5 sampling campaign the field parameters have been measured on the boat just after the depthspecific sample has brought to the boat via "Ruttner" sampler. Although, the time between theclosure of Ruttner sampler at the desired depth and the measurement on the boat has been tried tobe minimum, it has been between 5 and 10 minutes depending on the sampling depth. Duringthis time interval, it is possible that properties of sample could have been changed because of thetemperature equilibration with the upper levels of the lake. Furthermore, those properties,evidently, changes during measurements made on the boat, because the water sample tends toequilibrate with atmosphere. Inspite of the fact that utmost care has been spent in thesemeasurements, the measured parameters should have had slightly different values from those atthe sampling depth. However, these problems have been minimized to instrument's accuracy
85

level in the last field campaign by the use of "Hydrolab Datasonde 3" multiparameter waterquality probe with which measurements have been made at the desired depth. As will be shownin the following paragraphs, the field data provide good evidences on the dynamics of interactionbetween the monimolimnion and mixolimnion waters.
6.2. End-Members and Lake Water
Like the isotopic data, hydrochemical data suggest also the same end-members as shown intrilinear diagram which is based on data from second field campaign (August 1995) (Figure 9).Figure 9 implies that the typical regional groundwater is represented by Yuvarlak9ay karsticspring. Other groundwater samples (such as, Marmarh, Asar and Ada springs) which are moreclosely located to the Lake Koycegiz exhibit local chemical variations such as sulfate reductionand cation exchange, but stay within the region of fresh (group-4) waters. Thermal waters arelocated closely the Sea Water region which is located to the right-hand end of central diamond,and the lake waters are located in between sea water and thermal waters. A general view of thehydrochemical composition of water samples from Lake Koycegiz and surrounding samplingpoints is given in Figure 10.
-FRESH WATERS
SO4
1A /
20
60 V y \60
yY )\ x \"> THERMAL WATERS
LAKE WATERS
SEA WATER
ICO BO 60 Ca 40 330 20 40 Q 60————BO 100
Figure 9: Trilinear diagram of water samples collected in and around Lake Koycegiz (data fromAugust 1994 field campaign).
6.3. Temporal Hydrochemistry of Lake Water
Temporal variations in the physical and chemical characteristics of lake water have beeninvestigated with a number of field measurements carried out in typical wet and dry months.Apart from the parameters that have been measured in the field, water samples have also beencollected for the determination of major ion, trace element and nutrient composition. Thevariation of both the field and laboratory parameters are in good agreement with those inferredfrom isotopic evaluations. The following evaluations are based on field measured parameters
86

carried out two lake stations that represent the hydrochemistry of Koycegiz and Sultaniye Basins.The locations of temporal measurement stations were chosen to reflect deepest profiles in bothbasins.
Ntralfe*(+ uptiunwn. •
Figure 10: Circular diagrams showing hydrochemical character of sampling points (data fromAugust 1994 field campaign).
6.3.1.Temperature:Mixolimnion temperature in the Lake Koycegiz varies depending on the equilibration with
atmospheric temperature (Figure 11). As indicated earlier the depth to transition zone betweenmonimolimnion and mixolimnion in both basins is controlled by the depth of Yogun Strait thatconnects both basins. Temperature measurements from all campaigns indicate that themonimolimnion temperature in the Sultaniye Basin is rather stable and show only slightvariations which may partially be attributed to measurement and calibration errors. However, themixolimnion temperature of Sultaniye basin fluctuates all year round apparently because oftemperature equilibration with air. High and low mixolimnion temperatures are observed insummer and winter months. According to temperature profiles, the mixolimnion extends to -12mwhereas, the transition zone is located between -12m and -14m. Stability of monimolimnionprofile indicates clearly that the permanent stratification is dominant in the Sultaniye Basin.
87

However, temperature profiles observed in Koycegiz Basin is less stable in the monimolimnionregion. Mixolimnion temperatures fluctuates annually as observed in Sultaniye Sector.Interestingly, temperature values observed in the bottom water of Koycegiz Basin'smonimolimnion and the monimolimnion of Sultaniye Basin. This supports the idea that themonimolimnion water from Sultaniye Basin flow toward the bottom of Koycegiz Basin due to itshigher density which is maintained by continuous thermal water sink and overflow
20 22 24 26 2fl 30 32
-May K —K-Aug-95 -»— Apr 96 \
— May 95 —«—Aug-9S —*— *pf
Figure 11: Temperature profiles in Lake Koycegiz (Values are in °C Top. Sultaniye Basin,Bottom: Kftycegiz Basin; August 1994 data is based on measurements made in samplesbrought to the boat).
6.3.2. Specific Conductivity:Specific conductivity as a measure of total ion content is one of the best indicators of the
interaction between monimolimnion and mixolimnion. In the Sultaniye Basin, alike temperatureprofiles, the specific conductivity profiles of monimolimnion and mixolimnion are separatedsharply. Here the mixolimnion extends between surface and 8/12m. Depth to transition zonechanges as a result of fresh water input from surface flow and rainfall, and the thickness ofmixolimnion increases as expected when this input occurs (e.g. in December 1994 and April1996). Contrary to the variations in Koycegiz Basin, the top of monimolimnion in SultaniyeBasin is fixed at 14m depth regardless of the time of the year. The specific conductivity profilesin the mixolimnion of Koycegiz Basin are nearly the same except that of December 1994 (Figure12). This suggest that the mixolimnion water is chemically stabilized (or gets homogenized)within a very short period. In contrast to mixolimnion, specific conductivity profiles in themonimolimnion vary in a wider range suggesting that, although mixolimnion gets homogenizedrapidly, mixing of mixolimnion with monimolimnion occurs gradually. As a result of thisgradual mixing, the depth of monimolimnion reduces to 20m and the transition zone is thicker(i.e. between 8m/12m and 20m).
88

10 12 14 IB ta 20 22 24
[-+— Aug-»4 -•—Dtc-»4 —6— fib-to -M—Miy-flS -«—Aug-»5 -»-*pt-«]
B 10 12 14 16 18 20 22 £4 26 28 30 32
Figure 12: Specific conductivity profiles in Lake Koycegiz (Values are in microSiemens/cm.Top: Koycegiz Basin, Bottom: Sultaniye Basin).
Comparison of specific conductivity profiles of Koycegiz and Sultaniye Basins revealsthat, even if the specific conductivity of mixolimnion in both basins are nearly the same, there isan apparent difference between the specific conductivity's of monimolimnions. The highermonimolimnion specific conductivity in the Sultaniye Basin should be due to continuous thermalwater sink into this basin. Alike the stable isotope and temperature data, the specificconductivities of the waters of monimolimnion of Sultaniye Basin and that of Koycegiz Basin'sbottom water have similar values suggesting that monimolimnion water at 13m depth in theSultaniye basin flows toward the bottom of Koycegiz Basin.
6.3.3. Dissolved Oxygen:Dissolved oxygen is among the primary field parameters that helps to identify the
stratification variations in Lake Koycegiz. Dissolved oxygen in the mixolimnion of both Basinsvaries between 5 mg/1 and 10 mg/1 (Figure 13). Dissolved oxygen content of monimolimnion isless than 2 mg/1. Lowest dissolved oxygen values in the of monimolimnion have been recordedin April 1996 campaign during which the measurements were made "in-site" by usingmultiparameter water quality probe. In these measurements it is believed that the maximumaccuracy has been obtained since a magnetic stirrer fitted to the end of dissolved oxygen probehas also been used. It appears that dissolved oxygen content of mixolimnion is controlled both bywater temperature and the intensity of biologic activity. Higher values are observed in colderperiods when the oxygen solubility is increased but the biologic and chemical activitiesconsuming oxygen is depressed. Dissolved oxygen profiles reveal that monimolimnion inSultaniye and Koycegiz Basins start at depths 12m/14m and 14m/16m, respectively.Accordingly, mixolimnion extends down to 6m/8m in Koycegiz Basin, and to 10m in Sultaniye
89

Basin. Previous observations suggesting inflow from Sultaniye Basin's monimolimnion towardsthe bottom of Koycegiz Basin are also supported by the dissolved oxygen data.
6.3.4. pH:The pH provides also a robust portrait of the interaction between monimolimnion and
mixolimnion in both basins. In the mixolimnion of both basins, the pH range between 8.4 and8.8 as expected from an open water body which is abound with nutrients and photosyntheticorganisms (Figure 14). Although seasonally changes, the pH does not show any drastic variationalong the depth of mixolimnion, indicating that mixolimnion water is homogenized well. This isalso the case for monimolimnion in both basins even if lower pH values observed there. Themajor factor controlling the value of pH in the mixolimnion is the biologic activity of floralspecies such as, alga. During higher biogenic activity periods, because of the photosynthetic useof dissolved carbon-dioxide, higher pH values are observed. According to pH values, themixolimnion extends down to 8m in the Koycegiz Basin, whereas it continues to 8m/10m in theSultaniye Basin. The monimolimnion starts in the Koycegiz and Sultaniye Basins at 20m and16m, respectively. The decrease of pH in the monimolimnion of both basins may be attributed toseveral reasons: i) thermal water input (which virtually has no oxygen) into the monimolimnionand, ii) chemical reduction processes occurring due to depletion of oxygen by inorganic/organicreactions. Normally, the depletion of oxygen in aquatic systems leads to reducing conditionswhich result in proton (FT) release into the water. Here, again the similarity between the pHvalues of the monimolimnion water of Sultaniye Basin and that of bottom water in Koycegiz
Basin is noteworthy. This may be accepted another evidence for the outflow of SultaniyeBasin's monimolimnion toward the bottom of Koycegiz Basin.
Figure 13: Dissolved oxygen profiles in Lake Koycegiz (Values are in mg/1. Top: KoycegizBasin, Bottom: Sultaniye Basin).
90

Figure 14: pH profiles in Lake Koycegiz (Values are in standard units. Top: Koycegiz Basin,Bottom: Sultaniye Basin).
6.3.5. Major Ion CompositionMajor ion, trace element and nutrient data produced in all field campaigns expose a
portrait that is in accordance with the deductions made on field measured data (i.e., electricalconductivity, dissolved oxygen and pH). Detailed evaluation of laboratory data will be givenelsewhere and only the temporal variation of chloride ion, as a conservative species, is discussedhere.
Variation of chloride composition in the Lake Koycegiz suggest that the chemicalcomposition of lake water do not show any substantial variation in the long run (Figure 15). Thehighest chloride content is observed in the monimolimnion of Sultaniye Basin where there isthermal water sink chemically resembling to Sultaniye thermal spring of which average chloridecontent varies around 400 mg/1. The chloride content of the Sultaniye Basin's monimolimnionis rather stable around 200 mg/1 and reduces to 150 mg/1 at the top of this zone at 14m depth. Asexpected, the chloride content of the bottom water in Koycegiz Basin is similar to this value.
6.4. Spatial Variation of Chemical and Physical Parameters in Lake KoycegizSpatial variation of some physical and chemical parameters have been measured "in-situ"
by using a "Hydrolab Data Sonde 3 ™" multiparameter probe. Use of this instrument not onlyhelped to increase the number of profiling stations (from 2 to 31, see Figure 3 for stationlocations and their depths), but also enhanced the quality of data because the measurements havebeen made at the desired depth without bringing water samples to the surface. Although, 7
parameters including temperature, pH, dissolved oxygen, specific electrical conductivity,redox potential and turbidity have been measured, because of the scarcity of space, only thevariation of temperature and specific electrical conductivity are evaluated briefly here. Moredetailed evaluations including other parameters will be given elsewhere (see also [3]).
91

» K 24
—*•»*« -•—Ont-t* -*—*«»••< -*«—May •» -m-Jmi-K -*-*** M
Figure 15: Cl profiles in Lake Koycegiz (Values are in meq/1 Top: Koycegiz Basin, Bottom:Sultaniye Basin,).
6.4.1 .Temperature:Three main features in the temperature profiles are noteworthy (Figure 16). First, the
monimolimnion temperatures in the Sultaniye Basin is apparently higher than those of KoycegizBasin, second temperature profiles in both monimolimnion have different shapes, third themixolimnion temperature profiles vary in a wider range compared to those of monimolimnion.The difference between the shapes of temperature profiles in the monimolimnion of both basinssuggests that, the monimolimnion in Sultaniye Basin is more stable in terms of heat balance. Inboth basins, the monimolimnion temperature becomes stable below 20m depth. Moreover, themonimolimnion temperature profiles of Sultaniye Basin also reveals that only the top 6m(between 14m and 20m) is influenced by the mixolimnion temperature variations.
24 26 28 30 32
-*-l$ ———16—26 — •—26-Y
Figure 16: Variation of temperature at 31 stations in the Lake Koycegiz (Values are in °C, Datafrom April 1996 campaign).
92

6.4.2. Specific electrical conductivity:Alike temperature profiles, specific conductivity profiles as well suggest the same
depiction. That is, the specific conductivity of mixolimnion is nearly the same all over the lakeand the specific conductivities in the monimolimnion of either basins are apparently different,with higher values belonging to the Sultaniye Basin (Figure 17). According to specificconductivity profiles, the transition zone extends between 10m and 20m in both basins. Below20m, the specific conductivity apparently does not change to a great extend. On the other hand,specific conductivities observed in the monimolimnion of Sultaniye Basin is more homogenousthan those of Koycegiz Basin, implying that mixing of mixolimnion and monimolimnion is moreimportant in the Koycegiz Basin.
-»-l-A-12-»-M
-m-2— •*— 13— •— 26-Y
-A— 3-»— 15— f— 27
-K-4
— •— 16———28
-tt-5— 1 — 18——— 30
-+-—— -
-*-
619-2031
— *— 7——— 20-•—32
——— B
-*-21-*-A
———-•—-»«—
»
22B
— *— 10 — O— 11— *— 23 M-2«-•— C
Figure 17: Variation of specific electrical conductivity at 31 stations in the Lake Koycegiz(Values are in microSiemens/cm, Data from April 1996 campaign).
7. DENSITY VARIATIONSIn order to have a better under standing of the mixing dynamics, density variation in the
Lake Koycegiz has been investigated by means of "sigmatee" data for selected profiling stations.The "sigmatee (t,)" is the difference between the density of a water sample and that of purewater. Since, the density variations are small numerically, by convention, the sigmatee values aremultiplied by 1000 to have a better expression. The pure water has a sigmatee value of zero andthe higher the density of water the higher the sigmatee values. The "international equation ofstate for sea water" that accounts for the effects of salinity, temperature and hydrostatic pressureupon density has been used for the calculation of sigmatee values. Variation of lake waters'density in vertical direction for all stations is shown in Figure 18 which is based on the datacollected in April 1996 field campaign. Data from other field studies reveals similar portraits interms of density variations. Variation of sigmatee values in April 1996 indicates that the waterswith highest density are found in the monimolimnion of Sultaniye Basin where dense thermalwater sink is suggested by chemical and isotopic data. Slightly lower sigmatee values areobserved in the monimolimnion of Koycegiz Basin. Densities observed in the bottom ofKoycegiz Basin are similar to those of 12m depth of Sultaniye Basin. This observation isaccepted as another supporting evidence for the fact that the monimolimnion water in SultaniyeBasin flows through 12m deep Yogun Strait toward the bottom of Koycegiz Basin.
A simplified view of sigmatee variation in Lake Koycegiz is given in Figure 19 forstations located between station no.2 (offshore of Koycegiz town at the north) and station "a"(lake outlet at the south). Figure 19 reveals that the lowest density in the Lake Koycegiz isobserved in station 2 whereas, the highest density is observed at the bottom of station 31 thatpenetrates into the monimolimnion of Sultaniye Basin. Lake water density in the mixolimnionincreases progressively from station 2 toward station 'a' which is most closely located to the sea.
93

However, it appears that the density of Sultaniye monimolimnion originates from thermal watersink rather than sea water intrusion because the density observed in this station is substantiallylower than those observed in Sultaniye monimolimnion.
The argument that suggests monimolimnion owerflow toward the bottom of KoycegizBasin from the Sultaniye monimolimnion is also supported by Figure 19. Densities observed in
the transition zone between monimolimnion and mixolimnion of Sultaniye Basin at thedepth of 13 m (i.e. in between 12m and 14m depths) correspond to density of bottommost waterof profile 12 in the Koycegiz Basin. From this profile toward those located to the north, denistyof lake water in the top and bottom waters reduces progressively indicating that the main sourceof dense water in the Koycegiz Basin is the monimolimnion of Sultaniye Basin.
10 12 14 16 18 20 22 24 26
-»-1-•-12— K — 26
-•-2-H-13-•-26-y
-*-3-»-15—1-27
-tt-4—— 16—— 28
-m-S-»-1B—— 30
-*-——-«—
6192031
— *— 7—— 20-•-32
—— 8-•-21
* a
—— 9-0-22-M-b
-»-10-•-23-»~c
-0-11
-»-24
Figure 18: Variation of sigmatee values among profiling stations in the Lake Koycegiz (databased on April 1996 field campaign).
24710121519-202023242626-y273031a
Sigma tee
Figure 19: Variation of sigmatee values along profiling stations located between station no.2(Koycegiz town offshore at the north) and station "a" (lake outlet at the south).
94

8. EPILOGUE: LAKE DYNAMICS MODELOverall evaluation of isotopic, chemical and density data collected in this study reveals
that the Lake Koycegiz has a complicated mixing dynamics which is controlled mainly bydensity-driven flow of waters from different origins (Figure 20). The lake is fed mainly byrainfall and streamflow as low density waters and by high density thermal groundwater. Apartfrom the streamflow brought by two major streams Namnam9ay and Yuvarlak9ay whichdischarge into the northern part, the main source of low density water input is the rainfall.However, because of the density difference between mixolimnion and recharge, it appears thatcomplete annual mixing in the lake can not be achieved.
Sea 14km..
InfofrsdThoimal Waterdiachtugazom 10""-
12500m
Figure 20: Conceptual lake dynamic model.
It appears that there is continuous high-density thermal water input into the southern(Sultaniye) basin of the lake where along thermal springs are located along the coast. Some ofthe thermal groundwater discharge into the lake from a depth of 8m to 10m along this coast line.Because of the high density, the thermal groundwater discharging into the lake sinks into thebottom of Sultaniye basin where the highest density among all lake waters is observed. Theinfilling of southern basin is controlled by the bottom topography. Since, this basin has twooutlets, one located at 12m depth toward the northern basin, and another located at 6m depthtoward the sea, the bottom (monimolimnion) water tends to overflow toward the northern basin.It appears that this overflowing water follows the bottom surface in the northern basin and isaccumulated at the deepest point. During the travel of dense bottom water current, it is mixedwith top (mixolimnion) water and as the distance from the high density water increases, thedensity tends to decrease. Consequently, highest and lowest density waters in the top water arefound in the most southern and northern ends of the basin, respectively. These conclusions are ingood agreement with those drawn from isotopic and chemical data. Isotopically most depletedwaters in the area are represented by thermal groundwater discharges located on the southernshore of the lake. The variation of the stable isotopic composition of the lake water is also ingood agreement with density-driven flow scenario. Most isotopically depleted lake water arefound in the bottom water of southern basin and the bottom water becomes progressively lessdepleted toward the north of the lake. Due to mixing with recent recharge, the top water isisotopically more enriched. The same conclusions are also valid for the variation of otherphysical and chemical parameters of the lake water. It is difficult to arrive at firm conclusions onthe turn-over rates of bottom and top waters in both basins. However, rough calculations based
95

on long-term average electrical conductivity data reveal that about 60% of mixolimnion inboth basins is replenished by annual recharge where as the annual mixing of monimolimnionwith mixolirnnions in Sultaniye and Koycegiz Basins are 20% and 30%, respectively. Therefore,the turn-over times for mixolimnion and monimolimnions of Sultaniye and Koycegiz Basins areestimated to be 2 years, 5 years and 3.5 years, respectively.
ACKNOWLEDGEMENTS
Authors wish to thank following organizations and persons for their support to this work.TUBITAK (Turkish Scientific and Technical Research Council) supplied financial support forthe in-situ water quality measurement device. Mr. Bugra Cakir and Miifit Dogdu contributed tofield campaigns. Hydrometric measurements throughout the project period have been carried outby EIE (Electrical Power resources Research Administration). We are indebted to Mr. KazimierzRozanski, Yucel Yurtsever (IAEA), Hiiseym Guripek and ismail Giindogdu (EIE) for theirsupport and encouragement. Cooperation of Ms. Elisabeth Gibert-Massault (IAEA) during thepreparation of this manuscript is also gratefully acknowledged.
REFERENCES
[1] Kazanci,N., Plasa, N.H., Neubert,E. and tzbirak,A., 1992, On the limnology of the LakeKoycegiz (SW Anatolia): Zoology in the Middle East, v.l6,pp.!09-126.
[2] Bayan, C.S., Kazanci, N., Koyuncu,H., Caglar,S.S. and G6k9e,D., 1995, Determination ofthe origin of the waters of Koycegiz Lake, Turkey: J. Hydrol., 166, 171-191.
[3] Bayan, C.S., Kurtta§,T., Cakir,B. and Tezcan, L., 1996, Environmental Isotope Study ofLake Koycegiz, SW Turkey: IAEA Research Contract RB/7997, Progress Report 2, 64p.
[4] APHA, AWWA, WPCF, 1990, Standard Methods for the examination of water andwastewater: APHA Publication, 1015th Street, N.W., Washington D.C., 2005.
[5] Stumm, W. and Morgan, J.J.,1981, Aquatic Chemistry, John Wiley and Sons, New York,780p.
[6] Graciansky,P.C., 1968, Stratigraphy of the overlapped units of the Lycien Nappes in the TekePeninsula and their position within the Dinaro-Taurids: Bull. Mineral Research andExploration Institute, Ankara, v.71, pp.73-92., (In Turkish).
[7] Tansug,Z. and Oztunah,A., 1976, Hydrogeological investigation report of the Mugla-Koycegiz Area and vicinity: State Hydraulic Works (DSl), Ankara, 53p.
[8] Yesertener,C., 1986, Karst Hydrogeological investigation of the Lower Dalaman Basin (NE-Fethiye): M.Sc. Thesis, Inst. of Pure and Applied Sci., Hacettepe University, Ankara, 277p.,(abstract in English).
[9] Guner,N., 1997, Hydrogeological Investigation of the Lake Koycegiz Basin, M.Sc. thesis,Hacettepe University Inst. of Science, Ankara, 125p., (abstract in English).
[10] Yurtsever,Y., 1980, Environmental isotopes as a tool in hydrogeological investigation ofsouthwestern karst regions of Turkey, Proc. of Int. Seminar on Karst Hydrogeology (ed.G.Gunay), DSI-UNDP Publ. DSI Ankara, pp. 269-293.
96

XA0100615STABLE ISOTOPE STUDY OF LAKE TURKANA, EAST AFRICA
R.D. RICKETTSLarge Lakes Observatory,University of Minnesota,Duluth, Minnesota
R.F. ANDERSONLamont-Doherty Earth Observatory,Columbia University,Palisades, New York
United States of America
Abstract
The water level of Lake Turkana, East Africa, has fluctuated widely sincemeasurements began in the late 1880s. Lake level has ranged from 15 meters above to 5meters below the 1968 datum over the last 105 years. This study was initiated to compare thehistoric record of lake level for Lake Turkana to several records of the isotopic composition ofcarbonates found in the lake sediments. The ubiquitous presence of inorganic carbonates inLake Turkana sediments, both spatially and temporally, allows for an evaluation of the use ofthe isotopic composition of carbonates as a proxy for paleo-lake level.
1. INTRODUCTION
The isotopic composition of carbonates has been used in numerous lacustrine studiesto determine paleoclimatic information. Fluctuations in the isotopic record preserved incarbonates are created mainly by variations in the temperature and composition of the water inwhich the carbonate formed. In turn, these variations can be caused by climatic changes in thelake basin. Therefore carbonates are potentially an archive of the paleoenvironment of a lakebasin.
In tropical or closed-basin settings, shifts in the oxygen stable isotopic composition ofcarbonates are often attributed to shifts in the evaporation to input (E:I) ratio of a lake.Previous workers have used the relationship between changes in the 518O value of carbonatesand the E:I ratio of a lake basin to discuss qualitative changes in paleo-lake levels. Althoughthe relationship between the 8!8O composition of lake water and the various inputs andoutputs to a basin has been described quantitatively (e.g. see Refs [1-2]), only one quantitativecomparison between a historical lake level record and lake level determined from the 5I8Ocomposition of carbonates has been attempted [3].
Here a comparison is made between the historical record of the level of Lake Turkanaand the isotopic composition of authigenic calcite preserved in its bottom sediment. LakeTurkana presents advantages and disadvantages in this type of study. Recent lake levelvariations at Lake Turkana are climatically induced variations, therefore avoidingcomplications due to human impact. Lake Turkana is a large and old lake. It has goodpotential for a long and continuous climate record. However, the size of the lake alsointroduces the possibility of significant spatial variability in lake conditions, therebycomplicating the interpretation of 818O records.
97

Lake Turkana (Figure 1) is a large closed-basin lake in northern Kenya. It is in an aridsetting and has one major inflow, the Omo River, which drains the Ethiopian Highlands to thenorth. The other major rivers in the basin, the ephemeral Turkwell and Kerio Rivers, supplyonly 10% of the total input to the lake [4]. The lake has been closed for the last 4000 years[5] and has been described extensively [6-7].
36° 36°30'
4°30'
3°30'
2°30'
Omo River
20km
10 meter contourinterval
N
LT90 6FC
LT94 8 and 11FC
Kerio River
LT94 13-14FC
Figure 1: Chart of Lake Turkana showing the bathymetry of thelake and major rivers. The Omo River is the main source offresh water to the lake while the Turkwell and Kerio Rivers areephemeral. Open circles are the locations of the freeze coresdiscussed in the text (figure from Ref. [8])
2. MATERIALS AND METHODS
The nine freeze cores analyzed in this study were collected from Lake Turkana in 1990and 1994 (Figure 1). Core LT90-6FC was divided into 5-cm sections in the field [9]. All ofthe cores collected in 1994 were transported back to Nairobi, Kenya, as frozen slabs. CoresLT94-7FC, 11FC, 14FC and 20FC were divided into 2 to 4-cm sections at the NationalMuseum of Kenya, Nairobi, while cores LT94-6FC, 8FC, 13FC and 19FC were air freightedback to the United States as frozen slabs, where they were photographed, x-rayed, andsubsampled for 210Pb analyses at the Lamont-Doherty Earth Observatory.
Stable isotopic analyses were done on micrite from the cores subsampled in Kenya.Samples were sieved at 44um to remove ostracodes, the only other carbonate of anysignificant abundance [10]. The residue finer than 44um was vacuum roasted at 350°C toremove organic carbon. Carbonate samples were analyzed on a Finnigan MAT 251 with aKiel device at North Carolina State University. Water samples were also collected from the
98

lake in 1994 (Figure 2), and analyzed for oxygen and deuterium isotopic composition at theInternational Atomic Energy Agency Laboratories in Vienna, Austria.
Figure 2: Isotopic composition of water (518O, SMOW)collected from Lake Turkana in 1994. (figure from Ref.[11])
3. DISCUSSION
There are strong differences in the stable isotopic composition of carbonates betweenfreeze cores (Figure 3). Carbonates from cores taken from the central part of the lake haveconsistently lower S18O and 513C values. Spatial variability in the isotopic composition of thecarbonates (in the case of 5I8O values) is due either to gradients in lake water temperature orisotopic composition. The range of water temperatures implied by the 518O values of thecarbonates from several of the cores, assuming equilibrium precipitation from modern LakeTurkana water (Figure 2), is 5 to 25°C warmer than modern conditions. Spatial temperaturegradients of this magnitude are not observed in Lake Turkana, so the spatial variabilityobserved in the carbonates must reflect heterogeneity in lake water composition. Althoughwe measured some heterogeneity in water composition (Figure 2), the limited temporal extentof our sampling probably failed to capture the complete range of 818O values found in thelake.
There is a strong covariance between 8'3C and 5I8O values when the data from all thefreeze cores are combined (r = 0.85; Figure 4). The cores closest to the Turkwell and KerioRiver deltas (7FC and 20FC) have the lowest 813C and 818O values while cores farther fromthe deltas (11FC, 14FC, and LT90 6FC) have progressively higher values. The likelyexplanation for this observation is that relatively fresh waters, with lower 8'3C and S18Ovalues, is flowing out of the Turkwell and Kerio Rivers and strongly impacting the core siteswhich are closest to the river deltas. Unfortunately, the isotopic composition of water fromthese two rivers has not been measured during the peak of the flood season, therefore the fullimpact of water from these rivers is not known.
99

S ' "O ( K g , P D B )
-3 -I 1 3 5 -3 -I I 3 5 -3 I 3 5
D e p t h(cm )
50 _
L T 9 4 - I 4 F C
L T 9 4 - 2 0 F C L T 9 4 - 7 F C
1 3 5
Dep th (cm )
1 50 _
L T 9 4 - ! \ FC
L T 9 0 - 6 F C
Figure 3: 818O vs. depth profiles for 5 of the freeze cores. The solid line is a 3-pointrunning mean of the data. Cores are displayed from south to north, (figure from Ref.[8])
Changes in the isotopic composition of lake water will affect the composition ofcarbonate, whether it forms in equilibrium with the water or is offset from equilibrium by afixed amount. A mass balance equation for oxygen isotopes in Lake Turkana was used tocalculate lake level from calcite oxygen isotope compositions:
d(V51ake)/dt = QinputSinput - Qevaporation8evaporation
P D B ) X
-uWal&f 5* X
Q£jj@Kjf^" <g> -t- +-, Tjp^~
/ + + ^/ OO
1 1 1 1 1 1 1 1- 2 0 2 4
5"O (%« , PD B )
LT 90 -
LT 94 -
LT 94 -
LT 94 -
LT 94 -
6F C
7 F C
1 1 FC
M F C
2 0 F C
16
Figure 4: 5'^c vs. S'^O for the freeze core data. Individually the freeze cores have coefficients ofcorrelation (r values) below 0.7. Considered together the freeze core data have the relatively high rvalue of 0.85. R values above 0.7 have been hypothesized to be indicative of closed basin lakes [12](figure from Ref. [8]).
100

V is the volume of the lake, t is time, Q is the amount of the flux, and 8 is the isotopiccomposition of the respective flux. Using a derivation of Sevaporation [2] and climaticparameters for the Lake Turkana basin [13-14], a lake level curve for Lake Turkana wasgenerated. Since the 518O values from the freeze cores has a large amount of spatialvariability, the 818O values from the cores with viable chronologies (7FC, 11FC, and 14FC)were normalized and stacked. This stacked and normalized data set was transformed intopaleo-8'8O values for the lake water and substituted into a form of the mass balance equation.The lake level curve generated using this method is similar to the historical lake level curve(figure 5). Both data sets have a trend towards falling lake level and the records are, at most, 7meters apart.
20 -,
15 -
10 -
Depth (m) 5 4
0 -
-5 -
Historical Lake LevelLake Level Calculated
from theNormalized Data
1875 1900 1925 1950Year
1975 2000
Figure 5: Depth vs. Year for the modeling results, using the normalized and stackedfreeze core data compared to the historical record of lake level [15-16]. The fit betweenthe modeled data and the historical record is remarkably high considering the spatial andtemporal variability of the freeze core data, (figure from Ref. [8])
The match between the historic lake level curve and the curve generated using thenormalized and stacked data is not exact, but it is much better than any lake level curvegenerated using non-normalized data. The poorest portrayal of the historic record, althoughstill relatively accurate, is generated by the calculations during the earliest part of the record.This is at least partially due to the spotty data available from core LT94-14FC, the only corewith carbonate of this age, and the spotty historic data during this period. The normalizeddata gives a surprisingly accurate portrayal of lake level from 1965 on, when all three coresare included in the stacked data set.
Part of the reason for the poor portrayal of the historical lake level record using theoldest 8'8O values is caused by the assumption that changes in lake level (proxied by theQevaporation to Qinput ratio) are the only cause of variations in the 8'8O record. It appearsthat a large amount of the variation in the S'8O records from the freeze cores is due tovariations in Qe/Qi, but variations in other climatic parameters will also affect the 8'8O valuesof the calcite.
The cores that have been strongly affected by their proximity to sources of fresh watercontribute significantly to the calculations. In addition, isotope profiles that do not explicitlytrack lake level still contain quantitative information about lake level. As expected largeclosed-basin lakes are more complex, and therefore the sediment records from them are moredifficult to interpret, than those from small, closed-basin lakes. The data illustrate that areasonably accurate record of high frequency lake level fluctuations (on the order of 100years) can be obtained from data with a large amount of spatial and temporal variability.
101

REFERENCES
[I] GAT, J.R., The stable isotope composition of Dead Sea Waters, Earth Planet. Sci. Lett.71 (1984)361-376.
[2] BENSON, L.V., WHITE, J.W.C., Stable isotopes of oxygen and hydrogen in theTruckee River-Pyramid Lake surface-water system. 3. Source of water vapor overlyingPyramid Lake, Limnol. and Oceanogr. 39 (1984) 1945-1958.
[3] LI, H., Isotope geochemistry of Mono basin, California: applications to paleoclimate andpaleohydrology, Ph.D. Thesis, Univ. of Southern California, Los Angeles, (1995).
[4] CERLING, T. E., A mass-balance approach to basin sedimentation: constraints on therecent history of the Turkana Basin, Palaeogeogr., Palaeoclimatol., Palaeoecol. 54(1986)36-86.
[5] HALFMAN, J.D., et al., Fossil diatoms and the mid to late Holocene paleolimnology ofLake Turkana, Kenya: a reconnaissance study, J. of Paleolimnol. 7 (1992) 23-35.
[6] YURETICH, R.F., CERLING, T.E., Hydrogeochemistry of Lake Turkana, Kenya: Massbalance and mineral reactions in an alkaline lake, Geochim. et Cosmochim. Acta. 47(1983) 1099-1109.
[7] JOHNSON, T.C., et al., Climatic and tectonic effects on sedimentation in a rift-valleylake: Evidence from high-resolution seismic profiles, Lake Turkana, Kenya, Geol. Soc.of Amer. Bull. 98 (1987) 439-447.
[8] RICKETTS, R.D., ANDERSON, R. F., A direct comparison between the historicalrecord of lake level and the d!8O signal in carbonate sediments from Lake Turkana,Kenya, Limnol. and Oceanogr. (in press).
[9] MUCHANE, M.W., "Comparison of the isotope record in micrite, Lake Turkana, withthe historical weather record over the last century", The Limnology, Climatology andPaleoclimatology of the East African Lakes (JOHNSON, T.C., ODADA, E.G., Eds.),Gordon and Breach Publishers, Newark, (1996) 431-442.
[10] HALFMAN, J.D., High-resolution sedimentology and paleoclimatology of LakeTurkana, Kenya, Ph.D. Thesis, Duke Univ., Durham, (1987).
[ I I ] RICKETTS, R.D., Paleoclimate Interpretation of Stable Isotope Records from InorganicCarbonates, Lakes Malawi and Turkana, East Africa, Ph.D. Thesis, Duke Univ.,Durham, (1996).
[12] TALBOT, M.R., A review of the palaeohydrological interpretation of carbon andoxygen isotopic ratios in primary lacustrine carbonates, Chem. Geol. 80 (1990) 261-279.
[13] FERGUSON, A.J.D., HARBOTT, B.J., "Geographical, physical and chemical aspectsof Lake Turkana", Lake Turkana: a report on the findings of the Lake Turkana Project,1972-1975, Vol. 1 (HOPSON, A.J., Ed.), Overseas Development Administration,London (1982) 1-110.
102

[14] RICKETTS, R.D., JOHNSON, T.C., Climate change in the Turkana basin as deducedfrom a 4000 year long 518O record, Earth Planet. Sci. Lett. 142 (1996) 7-17.
[15] BUTZER, K.W., Recent history of an Ethiopian delta, Univ. Chicago Dept. Geog. Res.Paper no. 136, Univ. of Chicago Press, Chicago, (1971).
[16] MUCHANE, M.W., Stable isotope analyses of authigenic calcite from Lake Turkana,Kenya: high-resolution paleoclimatic implications for the past 5000 years, Ph.D. Thesis,Duke Univ., Durham, (1994).
103

THE LAKES OF THE JORDAN RIFT VALLEY XA01 °0616
J.R. GATDepartment of Environmental Sciences and Energy Research,Weizman Institute of Science,Rehovot, Israel
Abstract
This paper presents a summary of the proceedings of a workshop on the Lakes of the JordanRift Valley that was held in conjunction with the CRP on The Use of Isotope Techniques inLake Dynamics Investigations. The paper presents a review of the geological,hydrogeological and physical limnological setting of the lakes in the Jordan Rift Valley, LakeHula, Lake Kinneret and the Dead Sea. This is complemented by a description of the isotopehydrology of the system that includes the use of a wide range of isotopes: oxygen-18,deuterium, tritium, carbon-14, carbon-13, chlorine isotopes, boron-11 and helium-3/4.Environemental isotope aspects of the salt balances of the lakes, their palaeolimnology andbiogeochemical tracers are also presented. The scope of application of isotopic tracers is verybroad and provides a clear insight into many aspects of the physical, chemical and biologicallimnology of the Rift Valley Lakes.
1. GEOLOGY AND HYDROLOGY OF THE VALLEY
The Jordan Rift Valley which hosts three lakes of very different character is situated inthe northern part of the East African-Syrian rift system. It developed on an active transferfault which opened up during the late Miocene and Pliocene and has continually widenedsince. It was evidently connected to the ocean system for a long period, during which massivesedimentary sequences were deposited. These sediments are composed mostly of evaporiteswhich form large diapirs, one in the southern part of the Dead Sea basin, the other in thedivide between the two parts of the basin and another just south of Lake Kinneret. Theevaporites are mainly rock salt. Pleistocene sediments reflect the acceleration of basinsubsidence; they comprise several kilometers of lacustrine sediments. The structure of theDead Sea basin is that of a fault bounded depression, divided internally into a number ofsegments by transverse faults. In the southern basin accumulation of Neogene andPleistocene sediments probably exceeds 10 km; in the northern basin a relatively thinner coveroverlies the Cretaceous sequence. The depth to basement was estimated from magnetic andgravity calculations at 8-10 km in the north and at probably 14 km in the south.
Deformation takes place mainly along the transverse and longitudinal faults leaving theintervening sediments relatively undeformed. Significant changes occur with time in thenature of deformation along the main faults. The geometry of the Dead Sea basin is probablycontrolled by stretching of the entire crust along its long axis. The deformation occurredwholly within the crust without the participation of the upper mantle.
The present valley constitutes an internal drainage basin of about 40,000 km2; of whichthe Dead Sea is the ultimate terminus. The main water carrier is the Jordan River which runsfrom Mt. Hermon through Lake Hula and Lake Kinneret to the Dead Sea and drains an area of
105

about 18,000 km2. Elevation difference between the headwater and the drainage basis isabout 2000 m, the distance is about 200 km, and the mean precipitation depth decreases fromnorth to south, from 1300 mm/y at Mt. Hermon to 80 mm/y at the Dead Sea. Three lakes liealong the course of the Jordan River: the Hula at an elevation of +70 m, the Kinneret at amean elevation of-210 m, and the Dead Sea surface is situated at about 400 m below msl.
Additional waters drain periodically directly into the Dead Sea from an additionalsouthern drainage basin, albeit an arid one.
In addition to the large changes in water balance over geologic times, most probablyprimarily controlled by climate changes during the Pleistocene and early Holocene, there havebeen major anthropogenic influences during this century. First the drainage and channeling ofthe Hula region, followed by the diversion of water both from Lake Kinneret and theYarmoukh River for consumption and irrigation both in Israel and Jordan. This resulted in amarked decrease of the volume of flow in the lower Jordan River, as well as an increase in itssalinity. The latter effect is due, in no small measure, to the diversion of a number of near-shore saline springs from Lake Kinneret to the lower Jordan.
Owing to the consumptive use of water and to fluctuations in precipitation depth, thedischarge of the Jordan River into Lake Kinneret declined from 560 MCM/y (106 m3/y) in the1930s and 1940s to 460 MCM/y in the 1980s and early 1990s. The outflow from LakeKinneret dropped during that time from 530 to 50 MCM/y, while the mean volume south ofthe confluence of the Yarmoukh and Jordan Rivers, dropped from 980 to 180 MCM/y. Thelatter is the amount of water delivered into the Dead Sea.
2. THE LAKES OF THE JORDAN RIVER VALLEY
2.1. Lake Hula
The most upstream lake of the system, Lake Hula, is a good example of a stronglymanipulated system. Almost completely drained around the mid-century in order to reclaimagricultural lands, it is being reflooded in recent years to re-establish a natural wetland reserveand in order to mitigate the ill effects of the dried swamp lands on the downstream riversystem, namely mainly massive release of nitrates and other nutrients. Geochemical studieson the re-claimed Hula wetlands is illustrating the beneficial effects of the (controlled)wetlands on the nutrient and sedimentary balance in the downstream river.
2.2. Lake Kinneret
Lake Kinneret (also known as Lake Tiberias, Sea of Galilee or Lake Genezareth), theonly sweet-water lake of the region is of major economic importance (fisheries, recreation andtourism) and a source of about 1/4 of the freshwater supply for agricultural and urban use inIsrael, mainly by means of the NWC (National Water Carrier). It lies approximately 210 mbelow msl. It measures 22 kms from north to south and 14 kms from east to west, has asurface area of about 170 square kms, a mean depth of 24 meters and a maximum depth of 43meters. When full, the lake has a total water volume of four billion cubic meters. The climatein this region is semi-tropical with long, hot summers and relatively cold, rainy winters.
From about mid-May to Late December or early January, the lake is strongly stratifiedinto two distinct water masses, a warm (22-30°C), well-mixed upper layer (epilimniori),progressively deepening from about 16 to 26 meters, and a deeper, colder (13-16°C) stratum
106

(hypolimniori). During the winter, this two-layer structure breaks down and the water massesare completely mixed.
The NWC was inaugurated in 1964. The NWC links Lake Kinneret to Israel's otherwater sources and thus the lake became an integral and vital element in the national watereconomy. Presently 400-430 million cubic meters of water are pumped annually from LakeKinneret and flow through the NWC. An additional 100 million cubic meters are supplied tolocal consumers round the lake, in the Jordan Valley and on the Golan Heights. Although amajor portion of this water is still used for agriculture, increasing amounts are now suppliedfor drinking and domestic purposes, as well as for industrial and municipal requirements.Another extremely important function of the NWC is to supply good-quality water forrecharging the major underground aquifer which runs along the coast of Israel. All thisexplains why maintaining and, if possible, improving water quality in the lake is a matter ofprime national concern.
As water began to be pumped through the NWC, two major difficulties becameapparent. First, it turned out that the salinity of the lake water was sufficiently high to damagesensitive crops such as citrus and avocado. Furthermore, using this relatively high-salinitywater could drastically accelerate salinization of the irrigated soils and of the coastal aquiferlying beneath them. Secondly, there were incipient problems of taste and smell and generalwater quality which threatened to affect the utility of the NWC. The latter consideration wasparticularly serious because the NWC is a single-channel system and therefore all the supplymust meet drinking water standards or, at most, require only slight treatment in order to do so.
The first of these problems, salinity, was minimized by diverting several major salineinputs at the northwest of the lake into a "salt water diversion canal" which discharges into thesouthern Jordan. The diversion removes about 60,000 tons of salt from the lake each year.An exceptionally rainy winter in 1968-1969 also served to lower salinity and thus the chlorideconcentrations in the lake have fallen to about one-half their level in the late 1950s. The salt-water canal is also used to remove secondary-treated sewage from Tiberias and othersettlements along the western shoreline, and a pipe network has been built to collect andtransport effluents from the villages on the eastern side so that none of this pollution enters thelake.
The overwhelming majority of the salinity in the lake is due to saline springs (both onthe shore and underwater) and possibly also to seepage or diffusion of salt through the bottomsediments. A major geophysical and geochemical research effort was conducted in recentyears to determine the source of the salinity as well as the driving mechanism of itsintroduction into the lake. As part of this effort a large array of isotopic parameters wereengaged, including the 18O, 3H and 2H content of the water, 14C and 13C in carbonates, Sisotopes in sulfates and 37C1/35C1 as well as 36C/35C1 ratios. Rare gases, especially the3He/4He ratio, 87Sr/86Sr as well as the HB/10B ratio were also measured. These and thegeneral chemical composition of brines and brackish waters were discussed in a report byBergelson, Nativ and Bein. Their conclusion, still somewhat debatable, is that the salinegroundwater appears to be a mixture between a very saline end-member and meteoric freshgroundwater. The saline end member is an intensively evaporated marine brine whichevolved in an inland basin within the Rift Valley. The intensive evaporation of this brine,beyond the onset of halite precipitation, is indicated by low values of the Na:Cl and Cl:Brratios (0.5 and 150, respectively) and the high 6}1B (+44%o) documented in the most salinegroundwater. Gypsum precipitation decreased the sulfate concentrations in the residual
107

solution. The dense evaporated brine intruded the Rift Valley formations where it furtherevolved into Ca-chlorine brine. Its high Mg concentrations enhanced dolomitization,resulting in high Ca:Cl and low Mg:Cl ion ratios (90.33 and 0.09, respectively). Sulfateconcentrations were furthered decreased as a result of both additional gypsum precipitationfollowing the increased Ca concentrations and by sulfate reduction.
The original brine was later diluted by fresher water to form the Tiberias Brine.Considering the relatively low (-seawater) salinity of the Tiberias Brine with respect to that ofthe original brine, the latter accounts for most of salts in the Tiberias Brine and controls its ionratios and chloride isotopes, whereas the diluting freshwater component contributed most ofthe water. Because of its large water contribution and relatively large bicarbonateconcentrations (with respect to the original brine), the diluting freshwater componentcontrolled the oxygen, hydrogen and carbon isotopic compositions of the Tiberias Brine. The818O and 8D compositions is relatively light (-2.45 to -1.5%o and -18.51 to -4.2%o) withrespect to seawater, respectively, and the amount of radiocarbon (5.8 to 0.4 PMC) is also low.
A second dilution stage is believed to take place during the upwelling of the "TiberiasBrine" into shallow, freshwater aquifers to form the saline springs. Fresh groundwater,circulating in these aquifers mix with the Tiberias Brine, as evidenced by the measurabletritium (0-5.3 TU) and variable radiocarbon data of the saline springs. Although most of theupward migration must be rapid, as indicated by the high temperatures (up to 60°C) and radonfluxes, much slower transport, partly by diffusion, is proposed on the basis of the depleted37C1 values (-0.7 to -0.4%o) and the presence of radiogenic helium (4He = 3.97x10'5 cm3/liter,3He/4He = 2.053 x 10'6) and of radium.
The spatially variable chemical and isotopic features of the saline water found in thevarious spring clusters around Lake Kinneret suggest not only differential dilution by freshmeteoric water, but also different evaporation levels and dolomitization intensities in theoriginal brine end-member. The preservation of these distinct features suggest thatpercolation of the ancient brine at different times along the evaporation event occurred intotectonically isolated blocks.
2.3. The Dead Sea
The Dead Sea represents the ultimate, highly mineralized, terminal lake whose waterbalance is under extreme anthropogenic stress. The resultant drop in water level, increase insalinity and exposure of new coastal land areas, have provided the major motivation forresearch.
The negative water balance of the Dead Sea since the beginning of the century hasresulted in a decrease in its water level by about 20 meters. This has been accompanied byvarious changes in the chemical and physical characteristics of the lake and its brine.
In the beginning of the century the Dead Sea was a meromictic (stratified) lake with arelatively diluted epilimnion, down to a depth of 40 meters, and an anoxic, halite-saturatedhypolimnion which formed the main water body of the lake. However, the negative waterbalance of the lake resulted in a continuous increase in the salinity of the epilimnion, and tothe deepening of the transition layer between the two water bodies. Eventually, in 1979 theDead Sea overturned and the water column homogenized. The present hydrographic behaviorof the Dead Sea is that of a quasi-holomictic lake - annual stratification develops in spring,
108

and is maintained throughout the summer by a stabilizing thermocline which overcomes thedestabilizing halocline. Overturn takes place in autumn due to the cooling of the surfacewaters. This annual holomictic cycle was interrupted twice since 1979, when a dilutedsurface layer developed following the massive freshwater inflow into the Dead Sea during theexceptionally rainy winters of 1979/80 and 1991/92. The stratifications that developedfollowing these winters lasted three and four years, respectively, before overturn took placeagain.
In 1976, following the decline in the water level, the shallow southern basin wasdisconnected and dried out from the main water body. Massive halite precipitation began in1983 which, apart from a short period, has continued to the present. The halite precipitation,and the industrial activities of the potash industries south of the Dead Sea which pump outDead Sea brine and evaporate it in evaporation ponds, have resulted in a change in thecomposition of the brine. This is exhibited by decreasing Na/Cl and increasing Mg/K ratioover the last four decades. The annual weight of halite that precipitated in the lake since 1983was estimated by various calculation methods to be >100-x 106 tons. This does not includethe salts that precipitate in the industrial evaporation ponds, estimated at about 35-x 106
tons/year.
A model based on results obtained from evaporation experiments indicates that underthe present conditions the rate of evaporation will gradually decrease as the salinity of thebrine increases. On the basis of a simplified relationship between salinity and evaporation, itis estimated by Gavrieli, Weinstein and Yechieli that a new equilibrium between evaporationand input will be reached within 400 years at a water level of about 500 meters below MSL.At the new equilibrium level, the Dead Sea volume would have decreased to 2/3 of its presentvolume while its salinity and density would be about 380 g/1 and 1.27, respectively. Thisprocess will be accompanied by a more halite precipitation and a decrease in Na/Cl ratio from0.25 to about 0.1. However, the lake will not attain saturation with respect to carnallite(KMgCl3-6H2) which is the mineral precipitating in the industrial evaporation ponds.
The inhibiting effect of the increasing salinity on the microbial population can be seenand the lake is approaching almost total sterility. However short-lived algal blooms followthe dilution of the surface brine by winter floods. Recently Luz and Barkan of the HebrewUniversity found evidence also of microbial oxidation in the abyssal waters, based on theisotopic composition of dissolved oxygen and carbon-dioxide as described below.
The dramatic lowering of the water level of the Dead Sea is exposing former saline lakefloor on the coastline. Studies were concerned with the hydrological and ecologicalconsequences of this process. Studies by Yehieli et al. on the restructuring of thesaltwater/freshwater interface zone are worth mention. An interesting study on the renascentplants in the newly exposed coastal zone, by Yakir and Yehieli, utilize stable isotopes toindicate that growth occurred by virtue of the discriminatory utilization of freshwater lenses inthe soil column. These resulted from either floods or in zones where upwelling of freshgroundwaters occur.
Some of the up-to-date research achievements were summarized in the book "The DeadSea: - the Lake and its Setting" (T. Niemi, Z. Ben-Avraham and J.R. Gat, editors) recentlypublished by Oxford Press.
109

3 THE SALT BALANCE OF THE LAKES OF THE JORDAN RIFT VALLEYBy virtue of its topographic situation at the deepest spot in the Jordan Rift Valley, the
Dead Sea can be expected to conform to the model of a terminal lake. In such a lake, all ofthe water influx by means of precipitation and surface or groundwater runoff is lost byevaporation. The incoming salts, whether by aeolian input into the region or those originatingfrom weathering of soils and rocks, then supposedly accumulate in the lake. Ideally the saltinventory of the lake (Qs) would then be expressed as Qs = Z Fs Cs dt, where Fs and Cs are thewater influx and the salt concentration in this stream, respectively. Under the assumption ofsteady state fluxes, the age of a lake can then be determined by comparing the salt inventoryto the influx rates. This idea was already proposed in the 18th century, and applied to the caseof the Dead Sea by Bentor [1].
In practice one often finds less than the expected salt load in a terminal lake. Thisdiscrepancy results from the burial of evaporites in the sediments (primarily gypsum,carbonates and halite) and because of the leakage of brines into and through the banks of thelake. Another possible factor is the aeolian export of seaspray. On the other hand, an excessof salt in the system may point to unaccounted submarine springs or salt seepages as well asthe dissolution of minerals from the bottom layers, such as from salt diapirs.
Evidently then, one should add two terms (each either positive or negative) to thebalance equation: one which accounts for the interaction of the lake with the sediments or itsbanks and another relating to the aeolian transport of salt. As discussed by Imboden andLerman [2] these terms can reverse their sign on a variety of time scales, as a lake's conditionchanges.
In the case of the Dead Sea, three salient features dominate and determine the uniquecharacteristics of the system:
i) its position at the absolutely lowest elevation of the entire region;
ii) the steep flanks bordering the Rift Valley, which limits the chance of aeolianexport of salt from the region;
iii) the varying water supply, which results in wide fluctuation of the water level ofthe lake and concurrently in changes of salinity and in the degree of saturation ofhalite in the Dead Sea brine. These were extreme when going back in time; theextent of the Pleistocene precursor to the lake, namely Lake Lisan, reached as farnorth as present-day Lake Kinneret (and its elevation about 200 m above thepresent level of the Dead Sea) and in the geological past there is evidence for aconnection to the ocean, the area functioning as a lagoonary system.
The obvious conclusion to be drawn from the first of these features is that anirreversible escape of brine from the lake and its coastal environment is not possible.However, due to the large fluctuations in lake level, a reversible salt flux associated with thebank storage, acting on a wide range of time scales, complicates the simple book-keeping forthe system. For example, most of the salt springs near the Dead Sea shore are the result offlushing of the brines from the coastal area and saltwater - freshwater interface zone. Thesalinization of waters of Lake Kinneret (which is a major concern in the freshwater supply ofIsrael), is apparently due to such a reverse salt flux, bringing back brines from a pre Dead-Sealake systems in the Rift Valley. The to-and-fro salt movement, which of course also modifies
110

the chemical character of the brine through rock-water interaction, appears to be the mostdominant term of the salt balance.
As shown in the work of Shatkay et al. [3] the salinity on the Dead Sea shores (whichderives both from coastal sea spray and newly exposed saline sediments) is, by and large,washed back into the sea unlike the situation for more open lakes, (such as Mono Lake [4]).
The conclusion to be drawn is that, in a way, the Dead Sea and its sedimentary sequenceindeed functions as the ultimate terminal lake; this property is however realized on a very long(geological) time scale, with shorter term fluctuations of its salt content due to their temporarystorage in adjoining formations.
In the final analysis, the major long term and irreversible losses of salinity for the DeadSea system is of anthropogenic nature, resulting from the mineral exploitation of the Dead Seaworks (in the form of potash, magnesium and bromine compounds), and the salinity pumpedwith the freshwaters diverted from the Jordan River watershed by the National Water Carrierand other irrigation schemes.
4 THE ISOTOPIC PALEOLIMNOLOGY OF THE THREE LAKES OF THE JORDANRIFT VALLEY
The flow of the Jordan River connects three lakes: Lake Hula, Lake Kinneret and theterminal Dead Sea. These lakes differ in elevation, water residence time, salinity level andcharacteristic geochemical and biological features. The prevailing environmental climaticconditions are also different to some degree.
The stable carbon and oxygen isotopic compositions of the carbonate formed within thelake waters and stored in the sediments, bear the record of paleolimnological evolution andclimatic variations, respectively. The isotopic variations of carbon-13 and oxygen-18 havebeen measured in the sediments of the three Jordan Rift lakes. The imprint of regionalclimatic variations has been found in coeval segments of the sedimentary column (dated by14C) of the three lakes. The 14C dating also revealed that the ratio of the 14C activities incoexisting carbonate and organic phases might be an indicator for the degree of aridity in thelake's environment. The ratio 14C carbonate/14C organic is much larger in the more humidconditions of Lake Hula and Lake Kinneret than in the arid environment of the Dead Sea. [5]
The carbonate-13C data indicate that productivity has increased gradually in Lake Hulafrom about 17000 years BP to present and in Lake Kinneret from 5100 years BP (the deepestavailable sediment section) to present [6]. In the Dead Sea, the 13C data suggest a higherstand from about 6700 years BP to 4500 years BP; the highest lake level was about 5500years BP.
There is a remarkable agreement between the evidence provided by the 18O data oflakes Hula and Kinneret: warmer conditions prevailed from 5100 years to 2700 years BP,warmer than during the period 1200 years BP to 150 years BP [7,8]. In Lake Hula the track ofthe warmer period could be followed until about 8000 years ago (peaking at about 5300 yearsBP). The coolest period revealed by the 18O data in Lake Hula was from 17000 to 11000years BP.
Ill

Summarizing the isotopic evidence of the three lakes: warmer climatic conditions thannowadays prevailed from about 8000 years BP to about 3000 years BP. Between 6700 and4500 years BP and peaking at about 5500 years BP, the climate was also more humid.
5 BIO-GEOCHEMICAL TRACING OF LIFE IN THE DEAD SEA
Bio-geochemical tracers suggest that bacterial life may exist in the deep water mass ofthe Dead Sea. These tracers are the concentration of total dissolved carbon dioxide (TCC>2),carbon isotopic composition of TCO2 (813C), the ratio of dissolved oxygen to dissolved argon(O2/Ar) and the isotopic composition of the dissolved oxygen (818O).
Unusual flooding during the winter of 1991/92 and freshening of the upper waters of the DeadSea, resulted in a major algal bloom and in a very stable pycnocline that prevented ventilationof the hypolimnion. Following this flooding we have monitored TCO2, 613C, O2/Ar and818O in a station located at the center of the lake. For several months after the formation ofthe stable pycnocline these parameters recorded changes in the deep water. In March 1992,TCO2 was 852 ^mol/kg, and in December 1992 it rose to 867 jamol/kg. During the sameperiod 513C decreased from 1.6%o to 1.2%o, and measurements of O2/Ar ratio indicatelowering of the dissolved oxygen concentration. Thus the addition of TCO2 seems to be dueto oxidation of organic matter. From mass balance of carbon and its isotopes this change canbe calculated to result from the addition of 15 ^mol/kg of TCO2 with 813C of -21%o. Basedon this isotopic composition the source of this added carbon is not likely to be oxidation ofsinking plankton from the algal bloom, because the 813C of the latter is -13%o. The source ofcarbon may be detrital organic matter derived from the flood water or dissolved organicmatter. The amount of labile organic matter was limited because after December 1992 thedeep water did not show any significant change. This suggests that a limited amount of labileorganic matter with 813C of -21%o was introduced to the Dead Sea during the floods, andrapid oxidation consumed all the labile material over a period of several months.
The mechanism of this oxidation is uncertain, but our new measurements of 818O in the deepwater is about 7%o higher than at the surface. This enrichment in the heavy isotope is due toisotopic fractionation that took place during oxidation. The magnitude of this fractionation iscalculated from the shift in 818O and from the change in the O2/Ar ratio as -18%o. Thisisotopic discrimination is typical of bacterial oxygen consumption. Our preliminary resultsthus suggest that bacteria were present in the deep water of the Dead Sea following the floodsof 1991/92. Whether such bacterial activity is more common in the Dead Sea and occurs inholomictic years after normal winter floods, is an open question. More research on oxygenconcentration and its isotopic composition is necessary before we can solve this interestingproblem.
ACKNOWLEDGEMENTSAcknowledgement is given to the following presenters at the workshop on The Lakes of theJordan Rift Valley from which this summary has been drawn; Geologic Evolution of the RiftValley, by Z. Ben-Avraham (Dept. Geophysics and Planetary Science, Tel Aviv University);Evolution and Chemical Character of Surface Waters and Brines, by I. Zak (Institute of EarthSciences, The Hebrew University, Jerusalem); Hydrology of the Jordan River system, by A.Ben-Zvi (Hydrological Survey, Jerusalem); Lake Hula, from Lake to Bog to controlledWetlands, by Y. Avnimelech (Dept. Agricultural Engineering, The Technion, Haifa); LakeKinneret - an overall introduction, by A. Nishry (Kinneret Limnological Laboratory, Tabgha);
112

Dead Sea Water Masses, by R. Weinstein, I. Gavrieli and Y. Yehieli (Institute of EarthSciences, The Hebrew University, Jerusalem and Geological Survey, Jerusalem); Oxygencycling in the Jordan Rift Valley system, by B. Luz and E. Barkan (Institute of EarthSciences, The Hebrew University, Jerusalem and Geological Survey, Jerusalem); Salt balanceof the lakes of the Jordan Rift Valley, by J.R. Gat (Dept. of Environmental Sciences andEnergy Research, Weizmann Institute of Science, Rehovot); Paleo-information derived fromsediment cores of Lake Hula, Kinneret and the Dead Sea, by M. Stiller ((Dept. ofEnvironmental Sciences and Energy Research, Weizmann Institute of Science, Rehovot).
REFERENCES
[1] BENTOR, Y., Some geochemical aspects of the Dead Sea and the question of its age,Geochem. Cosmochem. Acta 25 (1961) 239-260.
[2] IMBODEN, D.M., LERMAN, A., "Chemical Models of Lakes" In: Lakes, Chemistry,Geology, Physics (LERMAN, A. Ed), Springer Verlag. (1978).
[3] SHATKAY, M., MAGARITZ, M., GAT J.R. Salt leaching in the newly exposed shoresof the Dead Sea, J. Coastal Res. 4 (1988) 257-272.
[4] GILL, T.E., Paniculate episodes at Mono and Owen lakes, EOS 68 (1987) p. 1273.[5] STILLER, M, HUTCHINSON, G.E., The waters of Merom: A study of Lake Hula. VI.
Stable isotope composition of carbonates of a 54 m core; paleoclimatic and paleotrophicimplications, Arch. Hydrobiol. 89 (1980) 275-302.
[6] STILLER, M., KAUFMAN, A., Paleoclimatic trends revealed by the isotopiccomposition of carbonates in Lake Kinneret, Z. Gletscherkunde und Glaziologie 21(1985) 79-87.
[7] THOMPSON, R., TURNER, G.M., STILLER, M., KAUFMAN, A., Near Eastpaleomagnetic secular variations recorded in sediments from the Sea of Galilee (LakeKinneret), Quatern. Res. 23 (1985) 175-188.
[8] LUZ, B., STILLER, M., TALMA, S., "Carbon dynamics in the Dead Sea", In: TheDead Sea: The Lake and its Setting (NIEMI, T., BEN-AVRAHAM, Z., GAT, J.R.,Eds.), Oxford University Press, (1997) 184-192.
113

LIST OF PARTICIPANTS
Bayari, C.S.
Dapefia, C.
Gat, J.
Kipfer, R.
Michalko, J.
Odada, E.
Rao, S.M.
Ricketts, D.
International Research and Application Centrefor Karst Water Resources,
Hacettepe University, Beytepe Laboratory,06532 Ankara, Turkey
Comisión Nacionál de Energía Atómica,INGEIS,Pabellon Ingeis, Ciudad Universitaria,1428 Buenos Aires, Argentina
Weizmann Institute of Science,Department of Environmental Sciences
and Energy research,76100Rehovot, Israel
Swiss Federal Institute for Environmental Scienceand Technology (EAWAG),
Ueberlandstrasse 133,8600 Duebendorf, Switzerland
Dionyz Stur Institute of Geology,Department of Isotope Geology,Mlýnská Dolina l,81704 Bratislava, Slovak Republic
Department of Geology,University of Nairobi,P.O. Box 30197,Nairobi, Kenya
Isotope Division,Bhabha Atomic Research Centre,Trombay, Mumbai 400 085, India
Duke University Marine Laboratory,Fivers Island,Beaufort, NC 28516, United States of America
115