use of climate projections for water supply planning alison adams, ph.d., p.e. ncpp workshop august...
TRANSCRIPT

Use of Climate Projections for Water Supply Planning
Alison Adams, Ph.D., P.E.NCPP WorkshopAugust 12-16, 2013

It takes a team
FSU/COAPSVasu MisraLydia Stefanovawww.coaps.fsu.edu
UF/WATER INSTITUTEWendy GrahamSyewoon Hwangwww.waterinstitute.uf.edu
TAMPA BAY WATERAlison AdamsTirusew AsefaJeff Geurinkwww.tampabaywater.org
www.floridawca.orgwww.floridaclimateinstitute.org
3
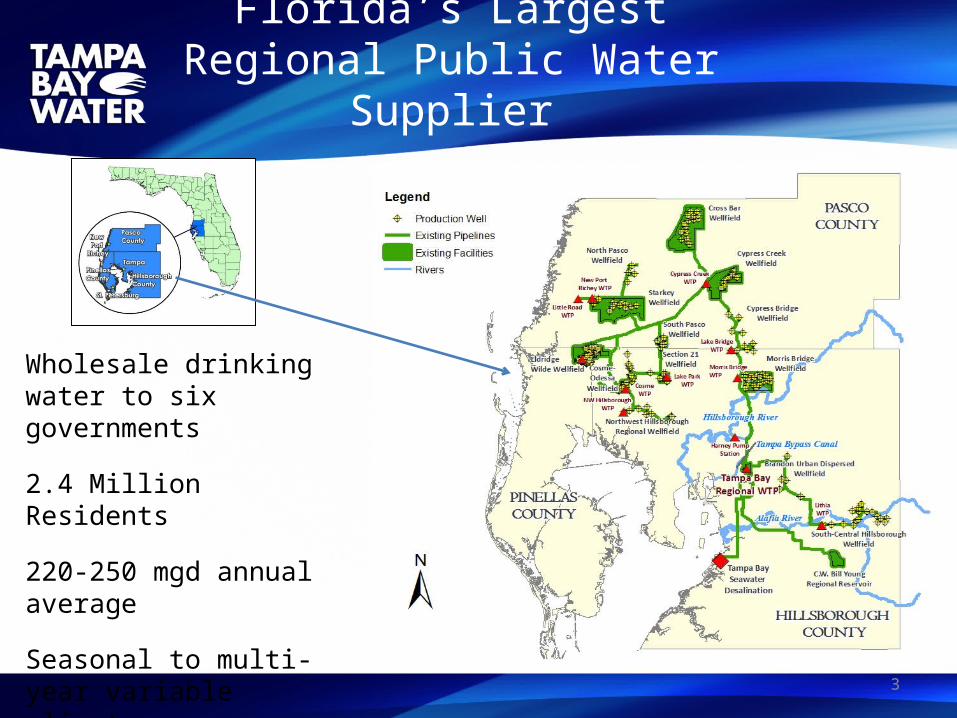
Florida’s Largest Regional Public Water Supplier
Wholesale drinking water to six governments
2.4 Million Residents
220-250 mgd annual average
Seasonal to multi-year variable climate

Tampa Bay Water’s Climate Change Assessment Project
…. In this project we are using dynamically and statistically downscaled climate model output to drive hydrologic models and explore potential impacts of climate variability and climate change on water availability and water allocation decisions
4

Water Institute ResearchReanaly
sis GCMs_fu
tureGCMs_re
tro.
Bias-correction
Application for Tampa Bay region
Hydrologic model (IHM)
Downscaling
Raw GCMs or Reanalysis
Bias-corrected GCMs
Observation
Downscaled GCM
Observation
Statistical method;BCSD, SDBC, BCCA, BCSA,
etc.
Dynamical downscalingMM5, RSM, etc.
R1, R2, ERA40, 20CR CMIP3: CCSM, GFDL, HadCM3, etc.
MeanPrec. (Raw-CCSM+RCM: 1969-1999)
-83 -82.5 -82 -81.5 -81
27
27.2
27.4
27.6
27.8
28
28.2
28.4
28.6
28.8
29
0.8
0.9
1
1.1
1.2
1.3
1.4
1.5
1.6
1.7
1.8
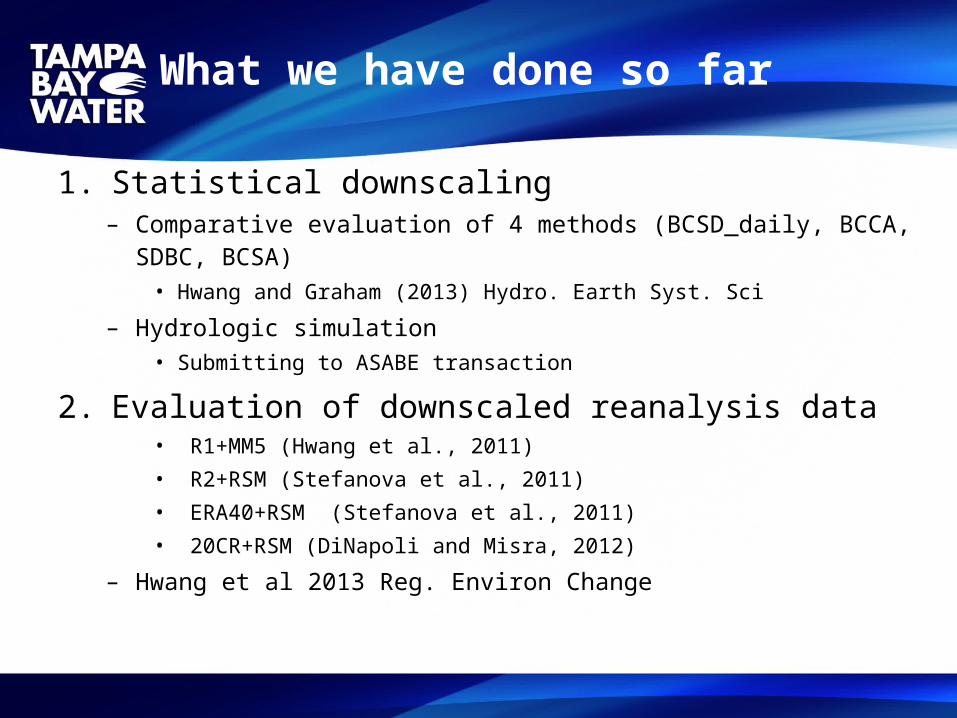
1. Statistical downscaling – Comparative evaluation of 4 methods (BCSD_daily, BCCA, SDBC,
BCSA)• Hwang and Graham (2013) Hydro. Earth Syst. Sci
– Hydrologic simulation • Submitting to ASABE transaction
2. Evaluation of downscaled reanalysis data• R1+MM5 (Hwang et al., 2011)
• R2+RSM (Stefanova et al., 2011)
• ERA40+RSM (Stefanova et al., 2011)
• 20CR+RSM (DiNapoli and Misra, 2012)
– Hwang et al 2013 Reg. Environ Change
What we have done so far
1. Uncertainty of Bias-correction in climate change impact assessment
2. Evaluated Future Projections through hydrologic model
What we have done so far

Spatial variability (Variograms)

• 3 GCMs + Regional Spectral Model (RSM), CCSM, HadCM3, and GFDL
• Spatial resolution (10kmx10km) over southeastern US• Variables: hourly Prec., humidity, wind speed, etc., daily
Tmax/min data – Daily bias-corrected Prec. data are available
• Retrospective simulation period: 1969-1999• Future simulation (AR4 A2 scenario): 2039-2069
http://coaps.fsu.edu/CLARReS10/index.shtml
Data

Hydrologic implication

Integrated Hydrologic Model• TBW and SWFWMD commissioned the development and application of an integrated surface
water/groundwater model for the Tampa Bay Region. • The Integrated Hydrologic Model (IHM) was developed which integrates the EPA Hydrologic
Simulation Program-Fortran for surface-water modeling with the US Geological Survey MODFLOW96 for groundwater modeling.
Ross et al., 2004 (IHM theory manual)

• Assessment of the utility of dynamically-downscaled regional reanalysis data to predict streamflow in west central Florida – Reanalysis data – robust proxy of historic
atmospheric observations– Verifying accurate prediction of historic climatic
and hydrologic behavior using reanalysis data is an essential first step before using retrospective and future GCM projections to predict potential hydrologic impacts of future climate change
• Assessment of dynamically downscaled GCM future projections
Dynamical Downscaling

• Study period from 1989 to 2001
1. R1+MM5 (Hwang et al., 2011)1986-2008
2. R2+RSM (Stefanova et al., 2011)1979-2001
3. ERA40+RSM (Stefanova et al., 2011)1979-2001
4. 20CR+RSM (DiNapoli and Misra, 2012)1903-2008
IHM calibration/verification period 1989-2006
Bias-corrected reanalysis data for hydrologic model
Wet season Dry season

Comparison of the mean annual cycles of (a) monthly mean and (b) standard deviation of daily precipitation.
Jan FebMar Apr May Jun Jul AugSep Oct NovDec0
2
4
6
8
10
(a)Basin_obs
DR_ERA40
DR_R2
DR_R1
dia
ly m
ean p
reci
pitation (
mm
)
Jan Feb Mar Apr May Jun Jul AugSep Oct NovDec0
5
10
15
20
25
30
(b)Basin_obs
DR_ERA40
DR_R2
DR_R1
Std
ev.
of
daily
pre
cipitation (
mm
)
Raw results
monthly mean precipitation standard deviation of daily precipitation

Comparison of time series of (a) annual total precipitation and (b) standard deviation of daily precipitation over the year
500
1000
1500
2000
2500
3000
(a1)Basin_obsDR_ERA40
an
ual to
tal p
reci
pit
ati
on
(X
10
0m
m)
500
1000
1500
2000
2500
3000
(a2)Basin_obsBCDR_ERA40BCDR_R2
an
ual to
tal p
reci
pit
ati
on
(X
10
0m
m)
0
5
10
15
20
25
(b1)Basin_obs
DR_ERA40
DR_R2
std
ev.
of
daily
pre
cip
itati
on
(m
m)
0
5
10
15
20
25
(b1)Basin_obsBCDR_ERA40BCDR_R2
std
ev.
of
daily
pre
cip
itati
on
(m
m)
Raw results Bias-corrected results

Comparison of error statistics of monthly areal precipitation predictions
-25
0
25
50
(a)
PB
IAS (
%)
> 200%
0
0.3
0.6
0.9
1.2
1.5(b) Alafia R at Lithia
Hillsborough R at Morris BridgeHillsborough R near TampaCypress Creek at WorthingtonCypress Creek near Sulfur springAnclote R near Elfers
RSR
> 4
0
0.2
0.4
0.6
0.8
1
(c)
R2
0
0.2
0.4
0.6
0.8
1
(d)
NSE
Raw Bias-corrected
RawBias-
corrected

Comparison of observed vs. simulated mean monthly streamflow
Raw results Bias-corrected results

Raw resultsBias-corrected
results
Comparison of observed vs. simulated annual
time series

Comparison of error statistics of monthly streamflow simulations for each target station; (a) PBIAS, (b) RSR, (c) R2, and (d) NSE
cal
DR
_ER
A4
0
DR
_R2
BC
DR
_ER
A4
0
BC
DR
_R2
BC
DR
_R1
DR
_20
CR
BC
DR
_20
CR
Obs CLARReS10 (Re-analysis+RSM)
MM5 FLAReS1.0
-100
-50
0
50
100(a)
PB
IAS
cal
DR
_ER
A4
0
DR
_R2
BC
DR
_ER
A4
0
BC
DR
_R2
BC
DR
_R1
DR
_20
CR
BC
DR
_20
CR
Obs CLARReS10 (Re-analysis+RSM)
MM5 FLAReS1.0
0
0.3
0.6
0.9
1.2
1.5(b)
Alafia R at LithiaHillsborough R at Morris BridgeAnclote R near ElfersCypress Creek at Wor-thington
RS
R
cal
DR
_ER
A4
0
DR
_R2
BC
DR
_ER
A4
0
BC
DR
_R2
BC
DR
_R1
DR
_20
CR
BC
DR
_20
CR
Obs CLARReS10 (Re-analysis+RSM)
MM5 FLAReS1.0
0
0.2
0.4
0.6
0.8
1
(c)
R2
cal
DR
_ER
A4
0
DR
_R2
BC
DR
_ER
A4
0
BC
DR
_R2
BC
DR
_R1
DR
_20
CR
BC
DR
_20
CR
Obs CLARReS10 (Re-analysis+RSM)
MM5 FLAReS1.0
-1.5
-1
-0.5
0
0.5
1(d)
NS
E

• Bias correction removed all errors in mean daily, monthly and annual ppt
• Errors in daily std dev were removed but not for monthly and annual totals
• Raw reanalysis data has errors in time series of daily rainfall were not corrected and these errors were aggregrated into monthly and annual timeseries
• Daily ppt timing errors propagated and were enhanced by the non-linear streamflow processes in IHM
• All reanalysis data underestimated streamflow • In the unconfined aquifer region, rainfall errors
lead to underpredicting groundwater levels.
Bias corrected reanalysis data for hydrologic model results
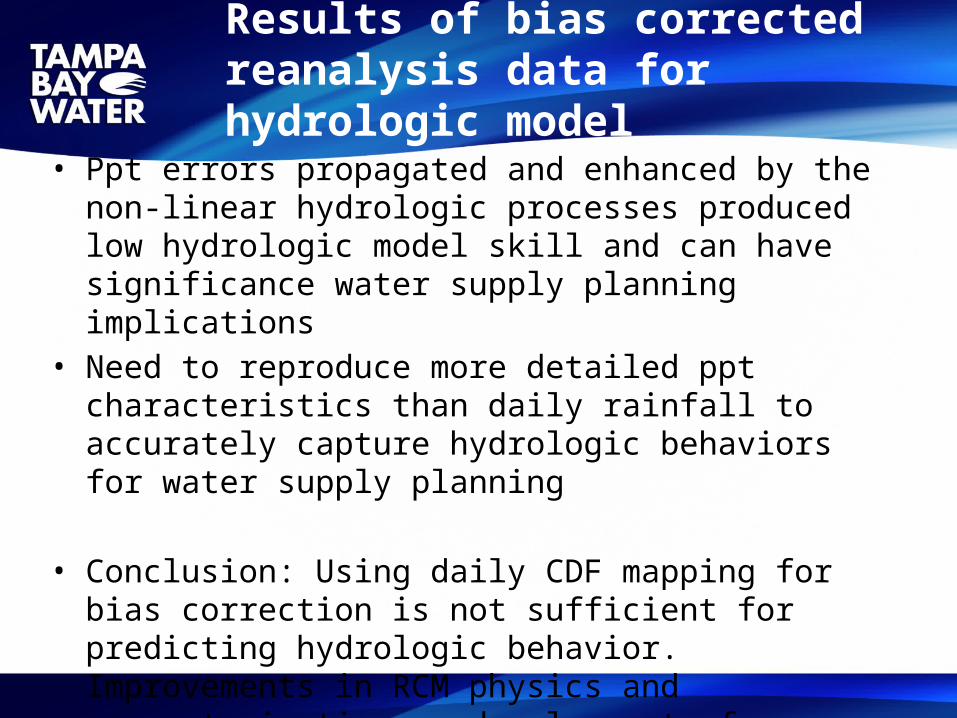
• Ppt errors propagated and enhanced by the non-linear hydrologic processes produced low hydrologic model skill and can have significance water supply planning implications
• Need to reproduce more detailed ppt characteristics than daily rainfall to accurately capture hydrologic behaviors for water supply planning
• Conclusion: Using daily CDF mapping for bias correction is not sufficient for predicting hydrologic behavior. Improvements in RCM physics and parameterization or development of more enhanced bias correction techniques
Results of bias corrected reanalysis data for hydrologic model

• 3 GCMs + Regional Spectral Model (RSM)
– CCSM, HadCM3, and GFDL (not available yet)
• Spatial resolution (10kmx10km)
over southeastern US
• Variables
– hourly Prec., humidity, wind speed, roughness, etc.
– daily Tmax/min data
– Daily bias-corrected Prec. data are available
• Retrospective simulation period
– 1968-2000
• Future simulation (AR4 A2 scenario)
– 2038-2070
CLAREnCE10 datahttp://coaps.fsu.edu/CLARReS10/index.shtml

4 Future Bias Correction methods1. Correct using historic bias amount corresponding the ‘magnitude’ of future prediction
(CDFm, Wood et al)
2. Correct using historic bias amount corresponding the ‘Percentile’ of future prediction (EDCDFm, Li et al., 2010)
3. Correct using historic bias percentage corresponding the ‘magnitude’ of future prediction (CDFm_%bias)
4. Correct using historic bias percentage corresponding the ‘Percentile’ of future prediction (EDCDFm_%bias)
3 methods for CDF development1. Monthly CDF (30data)
2. CDF for moving window ( 30 days, 61data)
3. CDF for moving window ( 15 days, 31data)
Total 12 combination of methodologies!
Bias-correction (BC) Methodology

Bias-correction (BC) Methodology
Future Bias Correction methods: CDF mapping
CDF: 1
Precipitation
Sim_retro.BC_retro
+
Sim_future
raw 2
raw1
obs
Example 1
3 different CDFs1. Monthly CDF (30 data/yr)
2. CDF for moving window ( 15 days, 31 data/yr)
3. CDF for moving window ( 30 days, 61 data/yr)
Bias-corrected Sim_future
BC-Sim_future

HadCM3+RSM
Raw results
Bias-corrected resultsJan Feb Mar Apr May Jun Jul Aug Sep Oct Nov Dec
0
2
4
6
8obsRetro. _RawFuture_Raw
mea
n pr
ecip
iata
tion
(mm
)
1. Mean daily precipitation
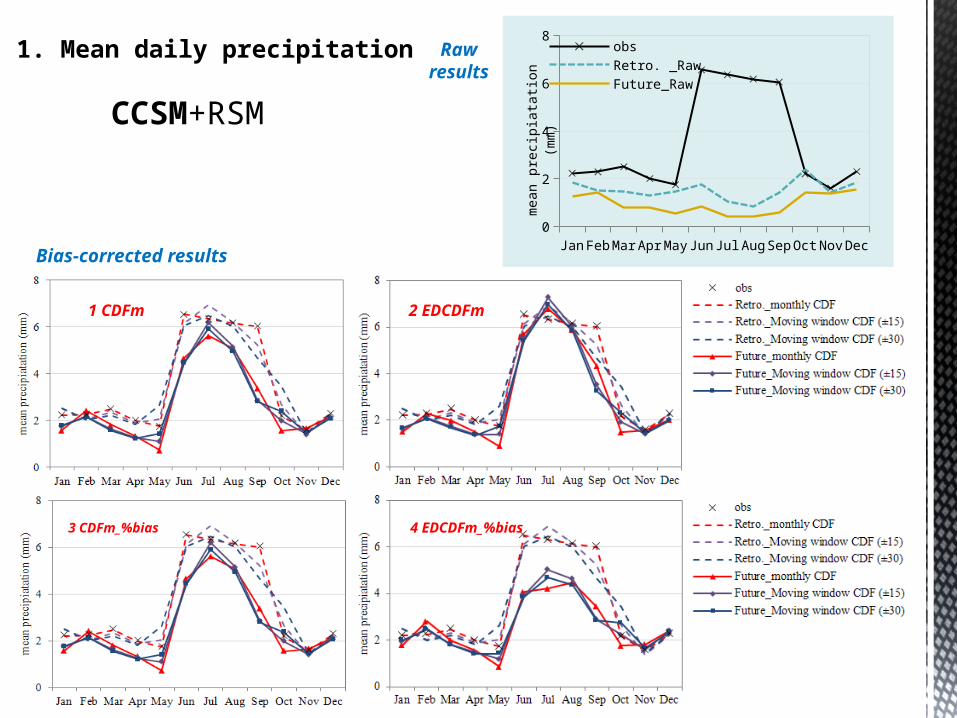
CCSM+RSM
1 CDFm
3 CDFm_%bias 4 EDCDFm_%bias
2 EDCDFm
Jan Feb Mar Apr May Jun Jul Aug Sep Oct Nov Dec0
2
4
6
8obsRetro. _RawFuture_Raw
mea
n pr
ecip
iata
tion
(mm
)
Raw results
Bias-corrected results
1. Mean daily precipitation

1 CDFm
3 CDFm_%bias
Raw results
Bias-corrected results
2. Std. of daily precipitation
HadCM3+RSM
Jan Feb Mar Apr May Jun Jul Aug Sep Oct Nov Dec0
4
8
12
16obsRetro. _RawFuture_Raw
std.
of d
aily
pre
cipi
atat
ion
(mm
)4 EDCDFm_%bias
2 EDCDFm

CCSM+RSM
1 CDFm
3 CDFm_%bias
Raw results
Bias-corrected results
2. Std. of daily precipitation
Jan Feb Mar Apr May Jun Jul Aug Sep Oct Nov Dec0
4
8
12
16obsRetro. _RawFuture_Raw
std.
of d
aily
pre
cipi
atat
ion
(mm
)4 EDCDFm_%bias
2 EDCDFm

I. Temperature
Spatial distribution of mean temperature (map comparison)
Annual cycle of Monthly mean Tmax and Tmin
Differences between the simulations for 1969~1999 & 2039~2069

MeanTmin. (Raw-HadCM3+RCM: 1969-1999)
-83 -82.5 -82 -81.5 -81
27
27.2
27.4
27.6
27.8
28
28.2
28.4
28.6
28.8
29
14.5
15
15.5
16
16.5
17
17.5
18
18.5
MeanTmax. (Raw-GFDL+RCM: 1969-1999)
-83 -82.5 -82 -81.5 -81
27
27.2
27.4
27.6
27.8
28
28.2
28.4
28.6
28.8
29
14.5
15
15.5
16
16.5
17
17.5
18
18.5
MeanTmin. (Gobs: 1969-1999)
-83 -82.5 -82 -81.5 -81
27
27.2
27.4
27.6
27.8
28
28.2
28.4
28.6
28.8
29
14.5
15
15.5
16
16.5
17
17.5
18
18.5
MeanTmin. (Raw-CCSM+RCM: 1969-1999)
-83 -82.5 -82 -81.5 -81
27
27.2
27.4
27.6
27.8
28
28.2
28.4
28.6
28.8
29
14.5
15
15.5
16
16.5
17
17.5
18
18.5
Tmin spatial distribution
Observation
1969~1999
MeanTmin. (Raw-HadCM3+RCM: 2039-2069)
-83 -82.5 -82 -81.5 -81
27
27.2
27.4
27.6
27.8
28
28.2
28.4
28.6
28.8
29
16.5
17
17.5
18
18.5
19
19.5
20
20.5
MeanTmax. (Raw-GFDL+RCM: 1969-1999)
-83 -82.5 -82 -81.5 -81
27
27.2
27.4
27.6
27.8
28
28.2
28.4
28.6
28.8
29
16.5
17
17.5
18
18.5
19
19.5
20
20.5
MeanTmin. (Raw-CCSM+RCM: 2039-2069)
-83 -82.5 -82 -81.5 -81
27
27.2
27.4
27.6
27.8
28
28.2
28.4
28.6
28.8
29
16.5
17
17.5
18
18.5
19
19.5
20
20.5
Approx. +2`C =
Approx. +2`C =
Approx. +2`C =
2039~2069
CCSM
HadCM3
GFDL
14.5˚C
18.5˚C
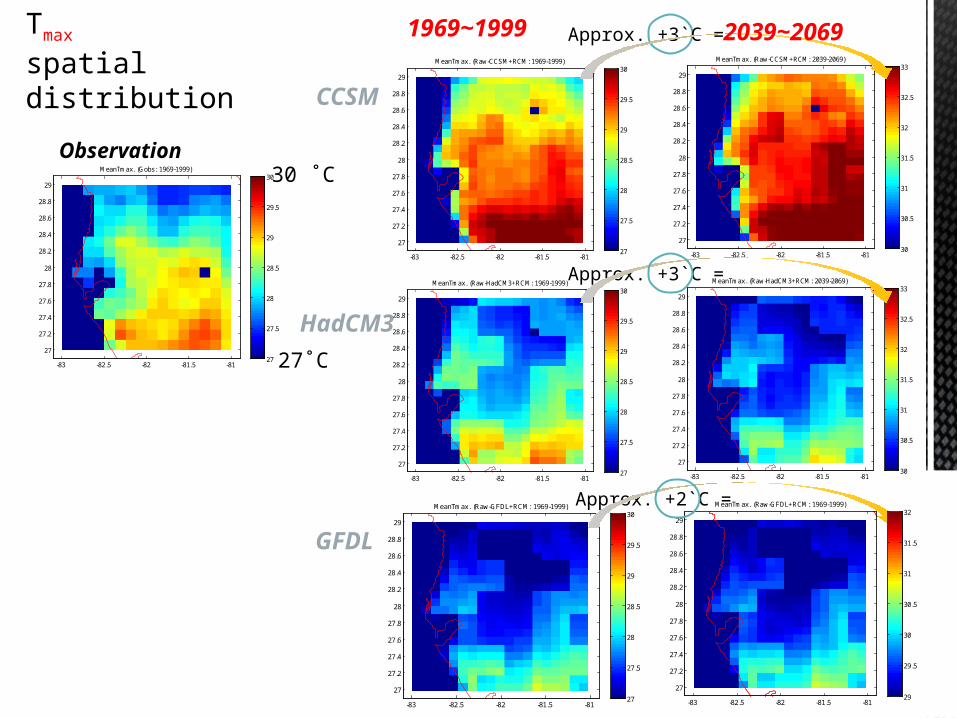
Tmax spatial distribution
MeanTmax. (Gobs: 1969-1999)
-83 -82.5 -82 -81.5 -81
27
27.2
27.4
27.6
27.8
28
28.2
28.4
28.6
28.8
29
27
27.5
28
28.5
29
29.5
30
MeanTmax. (Raw-CCSM+RCM: 1969-1999)
-83 -82.5 -82 -81.5 -81
27
27.2
27.4
27.6
27.8
28
28.2
28.4
28.6
28.8
29
27
27.5
28
28.5
29
29.5
30
Observation
1969~1999
MeanTmax. (Raw-HadCM3+RCM: 1969-1999)
-83 -82.5 -82 -81.5 -81
27
27.2
27.4
27.6
27.8
28
28.2
28.4
28.6
28.8
29
27
27.5
28
28.5
29
29.5
30
MeanTmax. (Raw-GFDL+RCM: 1969-1999)
-83 -82.5 -82 -81.5 -81
27
27.2
27.4
27.6
27.8
28
28.2
28.4
28.6
28.8
29
27
27.5
28
28.5
29
29.5
30
MeanTmax. (Raw-CCSM+RCM: 2039-2069)
-83 -82.5 -82 -81.5 -81
27
27.2
27.4
27.6
27.8
28
28.2
28.4
28.6
28.8
29
30
30.5
31
31.5
32
32.5
33
Approx. +3`C =
MeanTmax. (Raw-HadCM3+RCM: 2039-2069)
-83 -82.5 -82 -81.5 -81
27
27.2
27.4
27.6
27.8
28
28.2
28.4
28.6
28.8
29
30
30.5
31
31.5
32
32.5
33
Approx. +3`C =
Approx. +2`C = MeanTmax. (Raw-GFDL+RCM: 1969-1999)
-83 -82.5 -82 -81.5 -81
27
27.2
27.4
27.6
27.8
28
28.2
28.4
28.6
28.8
29
29
29.5
30
30.5
31
31.5
32
2039~2069
CCSM
HadCM3
GFDL
27˚C
30 ˚C

Raw results
1.1 Mean daily Tmax & Tmin
5
15
25
35
45
CCSM
mea
n te
mpe
ratu
re ('
C)
5
15
25
35
45
HadCM3
mea
n te
mpe
ratu
re ('
C)
5
15
25
35
45
GFDL
obs_Tmax Retro. _TmaxFuture_Tmax obs_TminRetro. _Tmin Future_Tmin
mea
n te
mpe
ratu
re ('
C)Tmax
Tmin
Tmax
Tmin
Tmax
Tmin
Jan
Mar
May Ju
lSe
pNov
5
15
25
35
45
CCSM
mea
n te
mpe
ratu
re ('
C)
5
15
25
35
45
HadCM3
mea
n te
mpe
ratu
re ('
C)
Jan
Mar
May Ju
lSe
pNov
5
15
25
35
45
GFDL
mea
n T
max
('C
)
Bias-corrected results
Tmax
Tmin
Tmax
Tmin
Tmax
Tmin
0
1
2
3
4
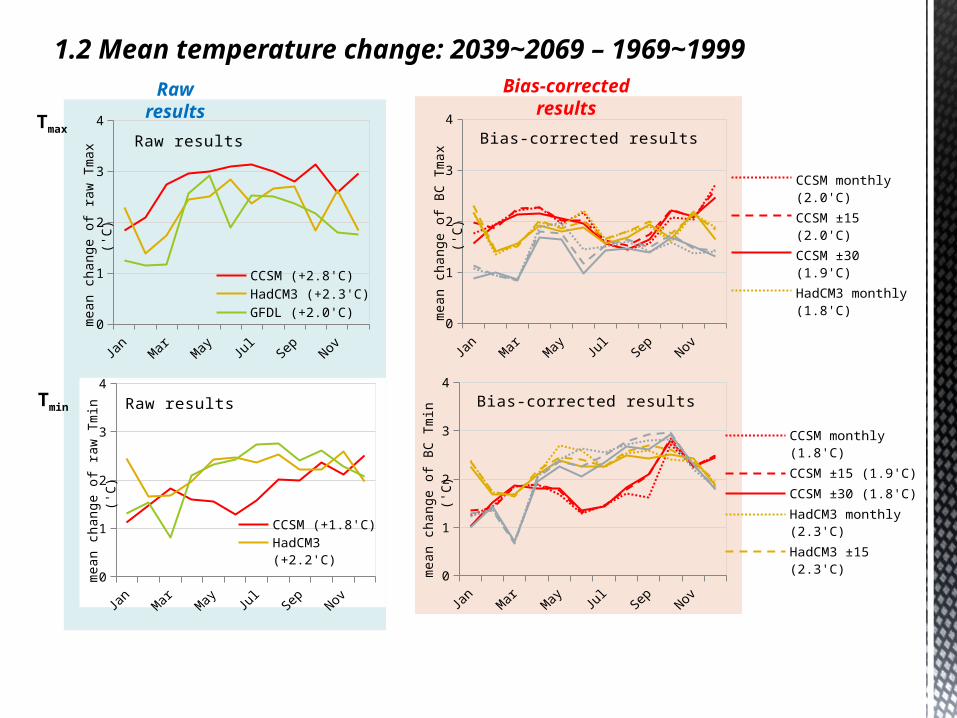
Raw results
CCSM (+2.8'C)HadCM3 (+2.3'C)GFDL (+2.0'C)m
ean
chan
ge o
f raw
Tm
ax ('
C)
Raw results
0
1
2
3
4Bias-corrected results
CCSM monthly (2.0'C)CCSM ±15 (2.0'C)CCSM ±30 (1.9'C)HadCM3 monthly (1.8'C)HadCM3 ±15 (1.9'C)HadCM3 ±30 (1.8'C)GFDL monthly (1.4'C)GFDL ±15 (1.4'C)m
ean
chan
ge o
f BC
Tm
ax ('
C)
Bias-corrected results
1.2 Mean temperature change: 2039~2069 – 1969~1999
Tmax
Tmin
0
1
2
3
4Bias-corrected results
CCSM monthly (1.8'C)CCSM ±15 (1.9'C)CCSM ±30 (1.8'C)HadCM3 monthly (2.3'C)HadCM3 ±15 (2.3'C)HadCM3 ±30 (2.2'C)GFDL monthly (2.1'C)GFDL ±15 (2.1'C)GFDL ±30 (2.0'C)m
ean
chan
ge o
f BC
Tm
in ('
C)
0
1
2
3
4
Raw results
CCSM (+1.8'C)HadCM3 (+2.2'C)GFDL (+2.1'C)
mea
n ch
ange
of r
aw T
min
('C
)

II. Precipitation
Spatial distribution of mean precipitation(map comparison)
Annual cycle of Monthly mean precipitiation
Differences between the simulations for 1969~1999 & 2039~2069

2.1 Raw Precipitation results
MeanPrec. (Gobs: 1969-1999)
-83 -82.5 -82 -81.5 -81
27
27.2
27.4
27.6
27.8
28
28.2
28.4
28.6
28.8
29
3.3
3.4
3.5
3.6
3.7
3.8
3.9
MeanPrec. (Raw-CCSM+RCM: 1969-1999)
-83 -82.5 -82 -81.5 -81
27
27.2
27.4
27.6
27.8
28
28.2
28.4
28.6
28.8
29
0.8
0.9
1
1.1
1.2
1.3
1.4
1.5
1.6
1.7
1.8
MeanPrec. (Raw-HadCM3+RCM: 1969-1999)
-83 -82.5 -82 -81.5 -81
27
27.2
27.4
27.6
27.8
28
28.2
28.4
28.6
28.8
29
3
3.2
3.4
3.6
3.8
4
4.2
4.4
4.6
4.8
5
• Raw CCSM results significantly underestimate the mean precp. by 2.5mm over the region
• Raw HadCM3 and GFDL results overestimate by 1~2mm
• Based on the future scenario, precipitation may decrease or increase
MeanPrec. (Raw-GFDL+RCM: 1969-1999)
-83 -82.5 -82 -81.5 -81
27
27.2
27.4
27.6
27.8
28
28.2
28.4
28.6
28.8
29
3
3.2
3.4
3.6
3.8
4
4.2
4.4
4.6
4.8
5
Observation
1969~1999
CCSM
HadCM3
GFDL
3.9mm
3.3mm ¿
¿
1.8mm
0.8mm
≠Way off!!underestimated
MeanPrec. (Raw-CCSM+RCM: 2039-2069)
-83 -82.5 -82 -81.5 -81
27
27.2
27.4
27.6
27.8
28
28.2
28.4
28.6
28.8
29
0.8
0.9
1
1.1
1.2
1.3
1.4
1.5
1.6
1.7
1.8
MeanPrec. (Raw-HadCM3+RCM: 2039-2069)
-83 -82.5 -82 -81.5 -81
27
27.2
27.4
27.6
27.8
28
28.2
28.4
28.6
28.8
29
3
3.2
3.4
3.6
3.8
4
4.2
4.4
4.6
4.8
5
MeanPrec. (Raw-GFDL+RCM: 2039-2069)
-83 -82.5 -82 -81.5 -81
27
27.2
27.4
27.6
27.8
28
28.2
28.4
28.6
28.8
29
3
3.2
3.4
3.6
3.8
4
4.2
4.4
4.6
4.8
5
2039~2069
¿
≅
¿
Even lower
Jan
Feb
Mar Apr
May Ju
n Jul
Aug Sep
OctNov Dec
0
2
4
6
8 HadCM3
Raw results
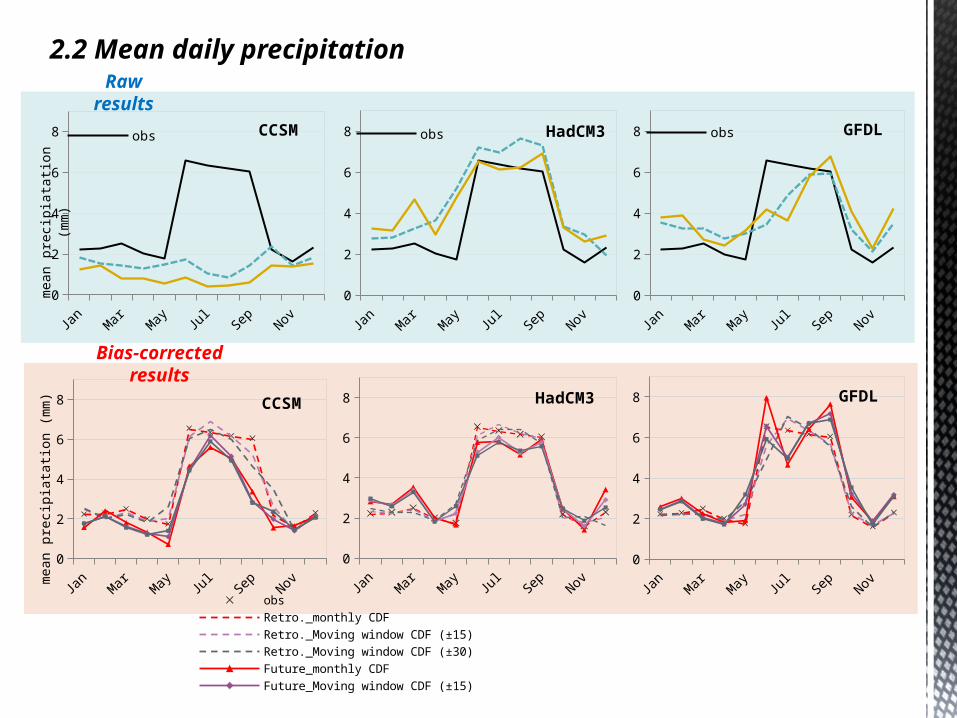
2.2 Mean daily precipitation
Bias-corrected results
Jan
Feb
Mar Apr
May Ju
n Jul
Aug Sep
OctNov Dec
0
2
4
6
8 CCSMobsRetro. _RawFuture_Raw
mea
n pr
ecip
iata
tion
(mm
)
Jan
Feb
Mar Apr
May Ju
n Jul
Aug Sep
OctNov Dec
0
2
4
6
8 HadCM3obs
Jan
Mar
May Ju
lSe
pNov
0
2
4
6
8 GFDLobs
Retro. _Raw
Jan
Mar
May Ju
lSe
pNov
0
2
4
6
8 CCSM
obsRetro._monthly CDF Retro._Moving window CDF (±15) Retro._Moving window CDF (±30) Future_monthly CDFFuture_Moving window CDF (±15) Future_Moving window CDF (±30)
mea
n pr
ecip
iata
tion
(mm
)
Jan
Feb
Mar Apr
May Ju
n Jul
Aug Sep
OctNov Dec
0
2
4
6
8 GFDL

2.3 Mean precipitation change: 2039~2069 – 1969~1999
Jan Feb Mar Apr May Jun Jul Aug Sep Oct Nov Dec-3
-2
-1
0
1
2
3Raw results CCSM (-0.57mm, -16.2%)
HadCM3 (-0.13mm, -3.8%)GFDL (+0.18mm, 5.2%)
mea
n ch
ange
of r
aw p
reci
p. (m
m)
wet projection
dry projection
Rainy wet season
Jan Feb Mar Apr May Jun Jul Aug Sep Oct Nov Dec-3
-2
-1
0
1
2
3Bias-corrected results
CCSM monthly (-0.8mm, -23.2%)CCSM ±15 (-0.8mm, -22.4%)CCSM ±30 (-0.8mm, -22.3%)HadCM3 monthly (0.1mm, 2.3%)HadCM3 ±15 (0.05mm, 1.4%)HadCM3 ±30 (0.02mm, 0.5%)GFDL monthly (0.4mm, 11%)GFDL ±15 (0.34mm, 9.8%)GFDL ±30 (0.26mm, 7.4%)m
ean
chan
ge o
f BC
pre
cip.
(mm
)
Raw results
Bias-corrected results

III. Hydrologic implications
Annual ET, ET fraction (ET/Precip.)
Mean streamflow
Design flow estimations

3.1 ET estimations
Annual average ET (mm/year) ET fraction (ET/Precp.)
20th
_BC
mon
thly
CD
F
±15
CDF
±30
CDF
delta
20th
_BC
mon
thly
CD
F
±15
CDF
±30
CDF
delta
20th
_BC
mon
thly
CD
F
±15
CDF
±30
CDF
delta
21st 21st 21stcal. CCSM GFDL HadCM3
60
65
70
75
80
85
90
ET/P
(%)
CCSM HadCM3 GFDL
20th
_BC
mon
thly
CD
F
±15
CDF
±30
CDF
delta
20th
_BC
mon
thly
CD
F
±15
CDF
±30
CDF
delta
20th
_BC
mon
thly
CD
F
±15
CDF
±30
CDF
delta
21st 21st 21stcal. CCSM GFDL HadCM3
700
750
800
850
900
950
1000
Evap
otra
nspi
ratio
n (m
m/y
ear)
CCSM HadCM3 GFDL

Retrospective simulation results
3.2 mean streamflow (Alafia River station)
Future simulations
Jan Feb Mar Apr May Jun Jul Aug Sep Oct Nov Dec0
10
20
30
Alafia River Obs (1989-2005)Cal (1989-2005)CCSM_20th_BC1
Mea
n st
ream
flow
(m3s
-1)
Jan Feb Mar Apr May Jun Jul Aug Sep Oct Nov Dec0
10
20
30
Alafia River Obs (1989-2005)Cal (1989-2005)CCSM_21st_BC1
Mea
n st
ream
flow
(m3s
-1)
Jan Feb Mar Apr May Jun Jul Aug Sep Oct Nov Dec0
10
20
30
Alafia River Obs (1989-2005)Cal (1989-2005)HadCM3_21st_BC1
Mea
n st
ream
flow
(m3s
-1)
Jan Feb Mar Apr May Jun Jul Aug Sep Oct Nov Dec0
10
20
30
Alafia River Obs (1989-2005)Cal (1989-2005)GFDL_21st_BC1
Mea
n st
ream
flow
(m3s
-1)
BC1: bias-correction using monthly CDFBC5: bias-correction using 15 CDFBC9: bias-correction using 30 CDF
Streamflow Change(Future-retro.)
Jan Feb Mar Apr May Jun Jul Aug Sep Oct Nov Dec
-20
-10
0
10
20
Alafia River CCSM_21st-20th_BC1CCSM_21st-20th_BC5CCSM_21st-20th_BC9CCSM_21st-20th_delta
Mea
n st
ream
flow
(m3s
-1)
Jan Feb Mar Apr May Jun Jul Aug Sep Oct Nov Dec
-20
-10
0
10
20
Alafia River HadCM3_21st-20th_BC1HadCM3_21st-20th_BC5HadCM3_21st-20th_BC9HadCM3_21st-20th_delta
Mea
n st
ream
flow
(m3s
-1)
Jan Feb Mar Apr May Jun Jul Aug Sep Oct Nov Dec
-20
-10
0
10
20
Alafia River GFDL_21st-20th_BC1GFDL_21st-20th_BC5GFDL_21st-20th_BC9
Mea
n st
ream
flow
(m3s
-1)
CCSM
HadCM3
GFDL

3.2 mean streamflow (Alafia River station)
Streamflow Change(Future-retro.)
Jan Feb Mar Apr May Jun Jul Aug Sep Oct Nov Dec
-20
-10
0
10
20
Alafia River CCSM_21st-20th_BC1CCSM_21st-20th_BC5CCSM_21st-20th_BC9CCSM_21st-20th_delta
Mea
n st
ream
flow
(m3s
-1)
Jan Feb Mar Apr May Jun Jul Aug Sep Oct Nov Dec
-20
-10
0
10
20
Alafia River HadCM3_21st-20th_BC1HadCM3_21st-20th_BC5HadCM3_21st-20th_BC9HadCM3_21st-20th_delta
Mea
n st
ream
flow
(m3s
-1)
Jan Feb Mar Apr May Jun Jul Aug Sep Oct Nov Dec
-20
-10
0
10
20
Alafia River GFDL_21st-20th_BC1GFDL_21st-20th_BC5GFDL_21st-20th_BC9
Mea
n st
ream
flow
(m3s
-1)
Jan Feb Mar Apr May Jun Jul Aug Sep Oct Nov Dec-3
-2
-1
0
1
2
3
mea
n ch
ange
of B
C p
reci
p. (m
m)
Precipitation Change(Future-retro.)

Retrospective simulation results
3.3 Std. of streamflow (Alafia River station)
Future simulations Streamflow Change(Future-retro.)
BC1: bias-correction using monthly CDFBC5: bias-correction using 15 CDFBC9: bias-correction using 30 CDF
Jan Feb Mar Apr May Jun Jul Aug Sep Oct Nov Dec0
10
20
30
40
50
Alafia River Obs_20thCal (1989-2005)CCSM_20th_BC1
Std.
of d
aily
stre
amflo
w (m
3s-1
)
Jan Feb Mar Apr May Jun Jul Aug Sep Oct Nov Dec0
10
20
30
40
50
Alafia River Obs_20thCal (1989-2005)CCSM_21st_BC1
Std.
of d
aily
stre
amflo
w (m
3s-1
)
Jan Feb Mar Apr May Jun Jul Aug Sep Oct Nov Dec0
10
20
30
40
50
Alafia River Obs_20thCal (1989-2005)HadCM3_21st_BC1HadCM3_21st_BC5
Std.
of d
aily
stre
amflo
w (m
3s-1
)
Jan Feb Mar Apr May Jun Jul Aug Sep Oct Nov Dec0
10
20
30
40
50
Alafia River Obs_20thCal (1989-2005)GFDL_21st_BC1
Std.
of d
aily
stre
amflo
w (m
3s-1
)
Jan Feb Mar Apr May Jun Jul Aug Sep Oct Nov Dec
-30
-15
0
15
30
Alafia River CCSM_21st_BC1CCSM_21st_BC5CCSM_21st_BC9CCSM_21st_delta
Mea
n st
ream
flow
(m3s
-1)
Jan Feb Mar Apr May Jun Jul Aug Sep Oct Nov Dec
-30
-15
0
15
30
Alafia River HadCM3_21st_BC1HadCM3_21st_BC5HadCM3_21st_BC9HadCM3_21st_delta
Mea
n st
ream
flow
(m3s
-1)
Jan Feb Mar Apr May Jun Jul Aug Sep Oct Nov Dec
-30
-15
0
15
30
Alafia River GFDL_21st_BC1GFDL_21st_BC5GFDL_21st_BC9GFDL_21st_delta
Mea
n st
ream
flow
(m3s
-1)

Obs
.Ca
l.20
th_B
Cm
onth
ly C
DF
±15
CDF
±30
CDF
delta
20th
_BC
mon
thly
CD
F±1
5 CD
F±3
0 CD
Fde
lta20
th_B
Cm
onth
ly C
DF
±15
CDF
±30
CDF
delta
21st 21st 21stCCSM GFDL HadCM3
0
0.6
1.2Alafia River
7Q2_
Low
Flow
(m3/
s)
Obs
.Ca
l.20
th_B
Cm
onth
ly C
DF
±15
CDF
±30
CDF
delta
20th
_BC
mon
thly
CD
F±1
5 CD
F±3
0 CD
Fde
lta20
th_B
Cm
onth
ly C
DF
±15
CDF
±30
CDF
delta
21st 21st 21stCCSM GFDL HadCM3
0
152
304Alafia River
7Q10
_Hig
hFlo
w (m
3/s)
7Q10 high flow
CCSM
HadCM3GFDL
CCSM
HadCM3GFDL
3.3 Design flow estimation
7Qxx high (low) flow means the average maximum (minimum) flow for seven consecutive days that has probable recurrence interval of once in xx years, respectively.
7Q2 low flow
Conclusions
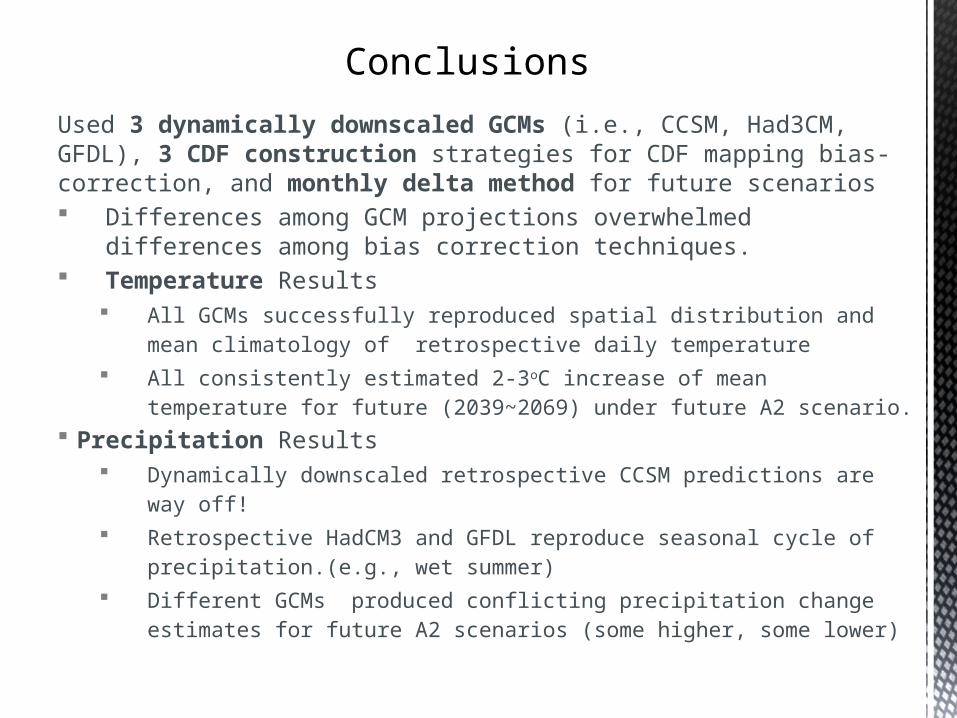
Used 3 dynamically downscaled GCMs (i.e., CCSM, Had3CM, GFDL), 3 CDF construction strategies for CDF mapping bias-correction, and monthly delta method for future scenarios Differences among GCM projections overwhelmed differences among bias
correction techniques. Temperature Results
All GCMs successfully reproduced spatial distribution and mean climatology of retrospective daily temperature
All consistently estimated 2-3oC increase of mean temperature for future (2039~2069) under future A2 scenario.
Precipitation Results Dynamically downscaled retrospective CCSM predictions are way off!
Retrospective HadCM3 and GFDL reproduce seasonal cycle of precipitation.(e.g., wet summer)
Different GCMs produced conflicting precipitation change estimates for future A2 scenarios (some higher, some lower)
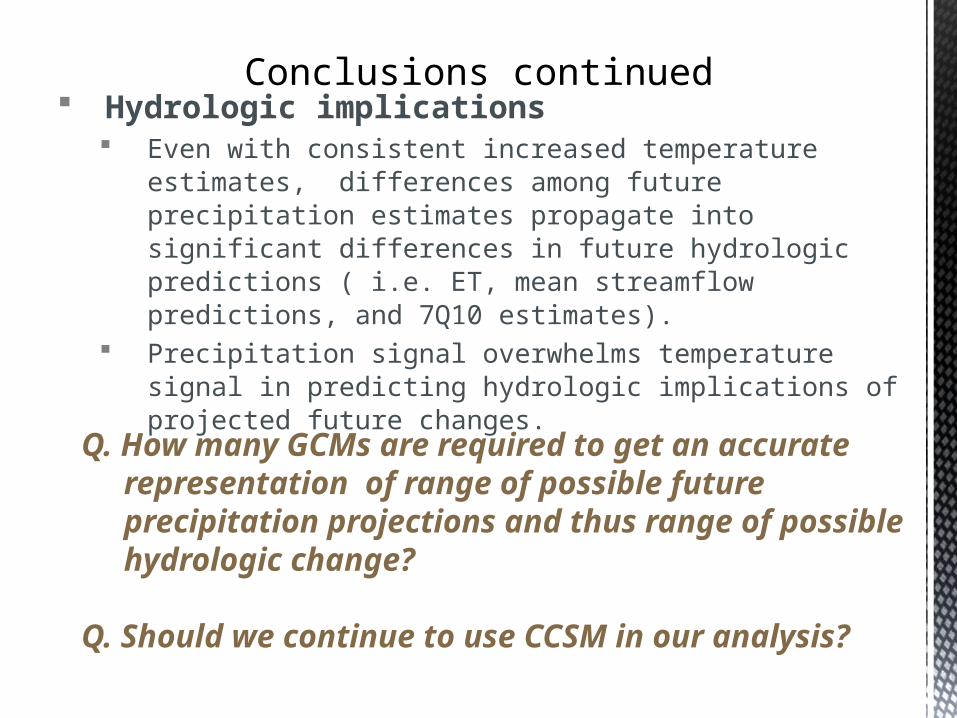
Conclusions continued
Hydrologic implications Even with consistent increased temperature estimates, differences
among future precipitation estimates propagate into significant differences in future hydrologic predictions ( i.e. ET, mean streamflow predictions, and 7Q10 estimates).
Precipitation signal overwhelms temperature signal in predicting hydrologic implications of projected future changes.
Q. How many GCMs are required to get an accurate representation of range of possible future precipitation projections and thus range of possible hydrologic change?
Q. Should we continue to use CCSM in our analysis?

Possible Future Work
Consider other climate model products & GHG scenarios… NARCCAP, CMIP5, COAPS products, etc.?
Other methodologies to downscale/bias-correct climate
model results? Statistical downscaling methods in order to increase number of GCMs
considered?