use of chlorine dioxide for legionella … of clo2 in... · use of chlorine dioxide for legionella...
TRANSCRIPT

M.S., Environmental Science, Wuhan University, 2002
Submitted to the Graduate Faculty of
School of Engineering in partial fulfillment
of the requirements for the degree of
Doctor of Philosophy
University of Pittsburgh
2007
B.E. Civil Engineering, Wuhan University of Technology, 1999
Zhe Zhang
by
USE OF CHLORINE DIOXIDE FOR LEGIONELLA CONTROL IN
HOSPITAL WATER SYSTEMS

UNIVERSITY OF PITTSBURGH
SCHOOL OF ENGINEERING
This dissertation was presented
by
Zhe Zhang
It was defended on
April 3, 2007
and approved by
Leonard W. Casson, Associate Professor, Department of Civil & Environmental Engineering
Robert Ries, Assistant Professor, Department of Civil & Environmental Engineering
Janet E. Stout, Research Professor, Department of Infectious Disease
Stanley States, Pittsburgh Water and Sewer Authority
Dissertation Director: Radisav D.Vidic, Professor, Department of Civil & Environmental
Engineering
ii

USE OF CHLORINE DIOXIDE FOR LEGIONELLA CONTROL IN
HOSPITAL WATER SYSTEMS
Zhe Zhang, PhD
University of Pittsburgh, 2007
The safety and efficacy of chlorine dioxide (ClO2) for Legionella control were evaluated in a
controlled prospective study conducted in two hospitals. The results showed that a significant
reduction of Legionella positivity in the hot water was achieved by ClO2 treatment in these two
hospitals. ClO2 application was safe based on the EPA MRDL for ClO2 and MCL for chlorite
(ClO2-).
The impacts of pH, temperature and total organic carbon on ClO2 decay were
investigated in a batch reactor to investigate the causes of the low ClO2 residual in hot water
observed in the field. Temperature and TOC are both important factors governing ClO2 demand
in hot water systems. The effect of pipe corrosion scale on ClO2 efficiency was investigated to
predict the ClO2 loss in water distribution systems. Goethite (α-FeOOH) and magnetite (Fe3O4)
were identified as the main component phases of iron corrosion scale. Cuprite (Cu2O) was the
major component of copper corrosion scale. The first order reaction rate constants for ClO2
reaction with iron corrosion scales and magnetite ranged from 0.0251-0.0829 min-1. The first
order reaction rate constants for ClO2 reaction with cuprite ranged from 0.0052-0.0062 min-1.
Cuprite and magnetite were the main compounds in the scales that caused ClO2 loss in this study.
The loss of ClO2 in the corroded iron pipe was dominated by reactions between ClO2 and these
ferrous compounds in the iron pipe corrosion scales.
iii
Possible synergy between ClO2 and free chlorine to provide more effective control of
Legionella in a hospital water system was investigated in a model plumbing system.
Combination of ClO2 and chlorine did not show significant synergistic effect on inactivation of
Legionella in the model plumbing system. However, maintaining of 0.2 mg/L of ClO2 residual
led to a significant reduction of Legionella at 40 degree Celsius in the model plumbing system.
Based on the results of this study, it can be concluded that ClO2 represents a viable
alternative approach for controlling Legionella in institutional distribution systems provided that
the initial demand due to the presence of corrosion scales is satisfied and that sufficient residual
at distal outlets is achieved.
Keywords: Legionella, chlorine dioxide, hospital water system, disinfection byproducts
iv

TABLE OF CONTENTS
LIST OF TABLES ....................................................................................................................... ix
LIST OF FIGURES ..................................................................................................................... xi
ACKNOWLEDEGEMENTS.................................................................................................... xiv
1.0 INTRODUCTION................................................................................................................ 1
1.1 APPLICATION OF CHLORINE DIOXIDE FOR LEGIONELLA CONTROL IN HOSPITAL WATER SYSTEMS AND MONITORING THE FATE OF DISINFECTION BYPRODUCTS ............................................................................ 1
1.2 THE EFFECT OF WATER QUALITY PARAMETERS (PH, TEMPERATURE AND TOC) ON CHLORINE DIOXIDE DECAY IN DRINKING WATER........ 2
1.3 THE EFFECT OF PIPE CORROSION SCALE ON CHLORINE DIOXIDE CONSUMPTION IN DRINKING WATER ............................................................ 3
1.4 SYNERGISTIC EFFECT OF CHLORINE DIOXIDE AND FREE CHLORINE FOR CONTROLLING LEGIONELLA IN A MODEL PLUMBING SYSTEM.. 4
1.5 OBJECTIVES AND SCOPE ..................................................................................... 5
2.0 LITERATURE REVIEW ................................................................................................... 6
2.1 CHLORINE DIOXIDE .............................................................................................. 6
2.1.1 Physical chemical characteristic of chlorine dioxide ...................................... 6
2.1.2 Chlorine dioxide as a disinfectant .................................................................... 7
2.2 LEGIONELLA ............................................................................................................. 9
2.2.1 Legionella and Legionnaires’ diseases ............................................................. 9
2.2.2 Legionella in hospital water systems ................................................................ 9
v

2.3 DISINFECTION METHODS FOR LEGIONELLA CONTROL ........................ 10
2.3.1 Superheat and flush ......................................................................................... 10
2.3.2 Hyperchlorination............................................................................................ 11
2.3.3 Ultraviolet light irradiation............................................................................. 11
2.3.4 Copper silver ionization .................................................................................. 12
2.4 CHLORINE DIOXIDE FOR LEGIONELLA CONTROL................................... 12
2.4.1 Disinfection byproducts of chlorine dioxide .................................................. 13
2.4.2 Effect of temperature on chlorine dioxide efficacy....................................... 14
2.4.3 The effect of pH on chlorine dioxide efficacy ................................................ 14
2.4.4 The effect of dissolved organic carbon on chlorine dioxide efficacy........... 15
2.4.5 The effect of corrosion scale on chlorine dioxide decay ............................... 15
2.4.6 The effect of chlorine residual on the efficacy of chlorine dioxide for Legionella control............................................................................................. 16
3.0 MATERIALS AND METHODS ...................................................................................... 18
3.1 FIELD STUDY.......................................................................................................... 18
3.1.1 Hospital A ......................................................................................................... 18
3.1.1.1 ClO2 generation system ........................................................................ 19
3.1.1.2 Sample collection.................................................................................. 20
3.1.2 Hospital B ......................................................................................................... 21
3.1.3 Statistical analysis ............................................................................................ 23
3.2 BATCH REACTOR EXPERIMENTS................................................................... 24
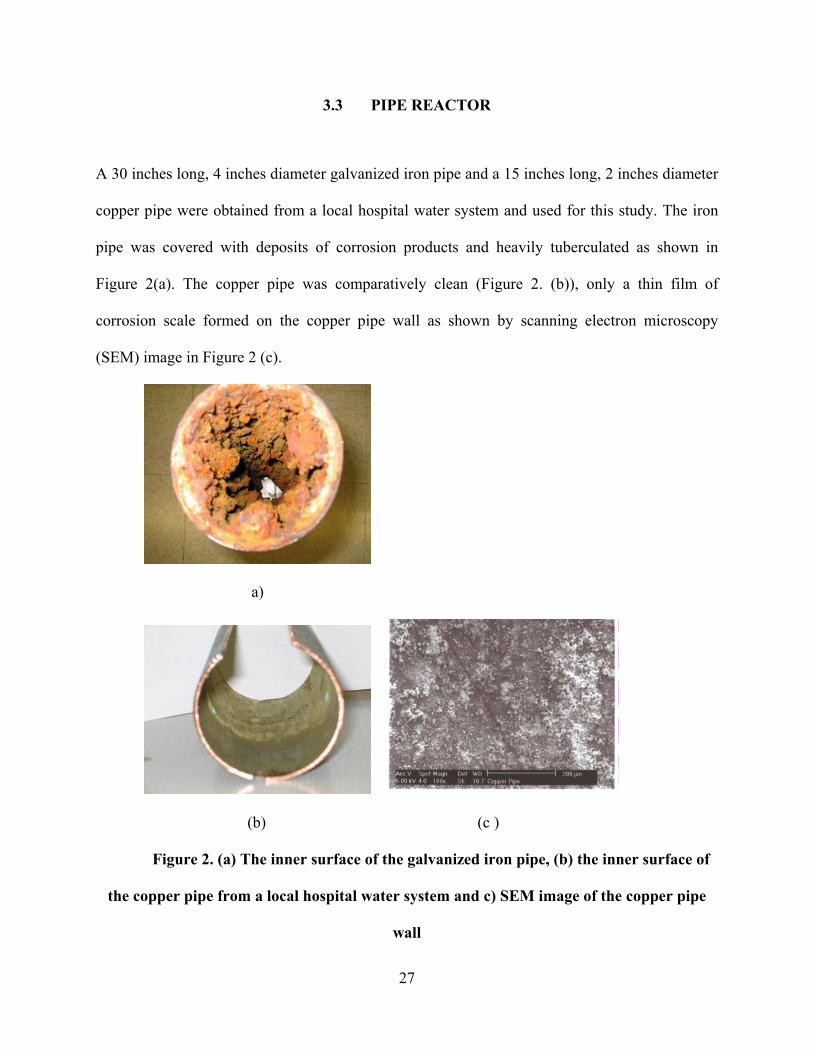
3.3 PIPE REACTOR ...................................................................................................... 27
3.3.1 Characterization of corrosion scale on the iron and copper pipe ............... 28
3.3.2 Pipe reactors setup........................................................................................... 28
vi

3.4 THE MODEL PLUMBING SYSTEM ................................................................... 30
3.4.1 Model plumbing system................................................................................... 30
3.4.1.1 Stock solution ....................................................................................... 31
3.4.1.2 System inoculation and biofilm formation ........................................... 31
3.4.1.3 Disinfection........................................................................................... 31
3.4.1.4 Planktonic and biofilm sampling .......................................................... 32
3.4.1.5 pH and temperature determination ....................................................... 33
4.0 RESULTS AND DISCUSSION ........................................................................................ 34
4.1 APPLICATION OF CHLORINE DIOXIDE FOR LEGIONELLA CONTROL IN HOSPITAL WATER SYSTEMS AND MONITORING THE FATE OF THE DISINFECTION BYPRODUCTS .......................................................................... 34
4.1.1 Hospital A ......................................................................................................... 34
4.1.1.1 Water quality parameters...................................................................... 34
4.1.1.2 Legionella positivity ............................................................................. 34
4.1.1.3 Mechanical modification of the ClO2 feed system............................... 40
4.1.1.4 ClO2 and its disinfection by-products................................................... 41
4.1.2 Hospital B ......................................................................................................... 44
4.1.2.1 Water quality parameters...................................................................... 44
4.1.2.2 Legonella positivity .............................................................................. 44
4.1.2.3 HPC bacteria and Pseudomonas ........................................................... 48
4.1.2.4 ClO2 and its disinfection by-products................................................... 49
4.1.2.5 Cost of Legionella control .................................................................... 52
4.2 THE EFFECT OF WATER QUALITY PARAMETERS (PH, TEMPERATURE AND TOC ON CHLORINE DIOXIDE DECAY IN DRINKING WATER....... 53
4.2.1 Chlorine dioxide decay in DI water................................................................ 53
vii

4.2.2 Chlorine dioxide decay in drinking water ..................................................... 55
4.2.3 Reactions of chlorine dioxide with natural organic matter ......................... 59
4.3 THE EFFECT OF PIPE CORROSION SCALE ON CHLORINE DIOXIDE CONSUMPTION IN THE DRINKING WATER................................................. 63
4.3.1 Characterization of corrosion scales .............................................................. 63
4.3.2 Reactions of ClO2 with iron and copper corrosion scales ............................ 66
4.3.3 ClO2 consumption in the pipe reactors .......................................................... 72
4.4 THE SYNEGISTIC EFFECT OF CHLROINE DIOXIDE AND FREE CHLORINE FOR LEGIONELLA CONTROL IN A MODEL PLUMBING SYSTEM.................................................................................................................... 74
4.4.1 Comparison of free chlorine and chlorine dioxide for Legionella and HPC inactivation ....................................................................................................... 74
4.4.2 Impact of temperature on chlorine dioxide inactivation of Leigonella and HPC bacteria .................................................................................................... 77
5.0 SUMMARY AND CONCLUSIONS ................................................................................ 79
6.0 ENGINEERING SIGNIFICANCE OF THE STUDY.................................................... 81
7.0 RECOMMENDATIONS FOR FUTURE WORK.......................................................... 83
APPENDIX.................................................................................................................................. 85
BIBLIOGRAPHY....................................................................................................................... 95
viii

LIST OF TABLES
Table 1. Comparison of study parameters of three hospitals using chlorine dioxide for Legionella control ............................................................................................................................... 19
Table 2. Study parameters of two hospitals using chlorine dioxide for Legionella control ......... 47
Table 3. Mass balance on ClO2, chlorite, chlorate and chloride during ClO2 decay in DI water after 6 hours (mg/L) (All concentrations are expressed as chlorine)................................ 54
Table 4. Impact of temperature on first-order reaction rate constants for chlorine dioxide consumption in different potable water sources ............................................................... 57
Table 5. Change in chlorine dioxide and chlorite, chlorate concentrations in potable water after 6 hours (mg/L) ..................................................................................................................... 58
Table 6. Change in chlorine dioxide, chlorite, chlorate and chloride generated during the chlorine dioxide reaction with SRHS substance (mg/L)................................................................. 61
Table 7. The mean first order rate constant for the reaction of ClO2 with the iron corrosion scale, magnetite and cuprite........................................................................................................ 67
Table 8. The mean mass change of ClO2 and chlorite during the ClO2 reaction with the iron corrosion scale, magnetite and cuprite.............................................................................. 70
Table 9 .Chlorine dioxide and its byproducts in cold and hot water samples from hospital A .... 85
Table 10. Chlorine dioxide and its byproducts in cold and hot water samples from hospital B .. 86
Table 11. Chlorine dioxide residual at each sampling port of the iron pipe reactor (mg/L) ........ 87
Table 12. Chlorine dioxide residual at each sampling port of the copper pipe reactor (mg/L) .... 88
Table 13. Results of 48-hr disinfection on chlorine dioxide and chlorine against Legionella and HPC bacteria at pH 7.0 in a model plumbing system....................................................... 89
Table 14. Results of 48-hr disinfection on chlorine dioxide and chlorine against Legionella and HPC bacteria at pH 7.0 and 40 °C in a model plumbing system...................................... 90
ix

Table 15. Temperature improved the disinfection efficacy of 0.2 mg/L chlorine dioxide residual against Legionella and HPC bacteria at pH7.0 in a model plumbing system................... 91
x
LIST OF FIGURES
Figure 1. The batch reactor with the floating glass cover............................................................ 24
Figure 2. (a) The inner surface of the galvanized iron pipe, (b) the inner surface of the copper pipe from a local hospital water system and c) SEM image of the copper pipe wall....... 27
Figure 3. The pipe reactors setup.................................................................................................. 29
Figure 4. Model plumbing system ............................................................................................... 30
Figure 5. A significant reduction in Legionella postivity was observed after the ClO2 treatment (p<0.05). Figure depicts Legionella positivity and ClO2 in hot water samples................ 36
Figure 6. Legionella positivity was below 20% in the cold water with a 0.3-0.5 mg/L ClO2 residual. Figure depicts Legionella positivity and ClO2 in cold water samples. .............. 36
Figure 7. Mean chlorite level in the hot and cold water of hospital A ......................................... 38
Figure 8. Effect of ClO2 concentration on Legionella positivity in the hot water. The percentage of samples positive for Legionella decreased significantly after ClO2 residual in the hot water increased to ≥ 0.1 mg/L (t-test, p<0.05).................................................................. 38
Figure 9. Mean monthly ClO2 residual in cold water samples. The changes and variability in mean monthly residual are attributed to operational adjustments and maintenance. ....... 40
Figure 10. Distance from the ClO2 point-of-injection did not significantly affect mean concentrations of ClO2 and ClO2
- in the hot and cold water (ANOVA, p>0.05). ............ 42
Figure 11. Mean percentage of distal outlets positive for Legionella was reduced from 60 % to 8 % after the ClO2 treatment (t-test, p<0.05). ...................................................................... 45
Figure 12. Legionella percent positivity in the hot water decreased as ClO2 residual increased to ≥ 0.1 mg/L (Chi-square, p>0.05) ...................................................................................... 46
Figure 13. HPC bacteria concentration in hot water samples decreased significantly after ClO2 treatment (t-test, p<0.05). ................................................................................................. 48
Figure 14. Distance from the ClO2 point-of-injection did not significantly affect mean concentrations of ClO2 and ClO2
- in the cold water (ANOVA, p>0.05). ......................... 51
xi

Figure 15. Distance from the ClO2 point-of-injection did not significantly affect mean concentrations of ClO2 and ClO2
- in the hot water (ANOVA, p>0.05). ........................... 51
Figure 16. Mean chlorite level in the hot and cold water of the hospital B.................................. 52
Figure 17. Chlorine dioxide decay kinetics in the deionized water at pH7.5 and pH8.5, at 25±2ºC and 45ºC............................................................................................................................ 55
Figure 18. The two-phase decay pattern of chlorine dioxide in drinking water at 25 °C............. 56
Figure 19. Impact of TOC on the first order reaction rate constant at 25 and 45 ºC .................... 57
Figure 20. The effect of temperature on chlorine dioxide reaction with humic substance........... 60
Figure 21. UV-Vis spectra of Aldrich humic acid after the reaction with chlorine dioxide at 25 and 45 °C .......................................................................................................................... 62
Figure 22. XRD patterns of the corrosion scale on different layers of the corroded iron pipe.... 63
Figure 23. XRD patterns of the corrosion scale on the copper piper........................................... 65
Figure 24. ClO2 decay in DI water due to reaction with 1.0 g/L of corrosion materials from iron pipe at pH 7.5, 25 °C and 45 °C........................................................................................ 66
Figure 25. Determination of the reaction order with respect to scale concentration at 25 and 45 ºC........................................................................................................................................... 68
Figure 26. ClO2 residual at each sampling port after the steady state was achieved.................... 72
Figure 27. Inactivation of planktonic and biofilm associated Legionella in a model plumbing system by residual maintenance of 0.2 mg/L of chlorine dioxide, 0.5 mg/L free chlorine and 0.2 mg/L of chlorine dioxide with 0.5 mg/L free chlorine at 26 °C and pH 7.0...... 74
Figure 28. Inactivation of planktonic and biofilm associated HPC bacteriain a model plumbing system by residual maintenance of 0.2 mg/L of chlorine dioxide, 0.5 mg/L free chlorine and 0.2 mg/L of chlorine dioxide with 0.5 mg/L free chlorine at 26 °C and pH 7.0...... 75
Figure 29. Temperature improved the efficacy of 0.2 mg/L chlorine dioxide residual inactivation of Legionella and HPC bacteria at pH 7.0 in both biofilm and planktonic phases........... 77
Figure 30. Temperature did not impact the efficacy of combined disinfectant residuals of 0.2 mg/L chlorine dioxide and 0.5 mg/L chlorine inactivation of Legionella and HPC bacteria at pH 7.0 in both biofilm and planktonic phases .............................................................. 78
Figure 31. The results of the second test of inactivation of planktonic and biofilm associated Legionella in a model plumbing system by residual maintenance of 0.2 mg/L of chlorine
xii

dioxide, 0.5 mg/L free chlorine and 0.2 mg/L of chlorine dioxide with 0.5 mg/L free chlorine at 27 °C and pH 7.0............................................................................................ 92
Figure 32. The results of the second test of inactivation of planktonic and biofilm associated HPC bacteriain a model plumbing system by residual maintenance of 0.2 mg/L of chlorine dioxide, 0.5 mg/L free chlorine and 0.2 mg/L of chlorine dioxide with 0.5 mg/L free chlorine at 27 °C and pH 7.0........................................................................... 93
Figure 33. The results of the second test of effect of temperature on the efficacy of 0.2 mg/L chlorine dioxide residual inactivation of Legionella and HPC bacteria at pH 7.0 in both biofilm and planktonic phases .......................................................................................... 93
Figure 34. The results of the second test of effect of temperature on the efficacy of combined disinfectant residuals of 0.2 mg/L chlorine dioxide and 0.5 mg/L chlorine inactivation of Legionella and HPC bacteria at pH 7.0 in both biofilm and planktonic phases ............... 94
xiii

ACKNOWLEDEGEMENTS
I would like to express my sincere gratitude to my advisor, Dr. Radisav D. Vidic for offering me
the great opportunity to work on this project. My thanks are extended for his guidance, patience
and great advice throughout my study.
No words can exactly express my cordial gratitude to Drs. Victor L. Yu and Janet E.
Stout for their strong support and great advice both academically and financially. Without their
extensive knowledge and experience in Legionnaires’ diseases and Legionella control, this work
would not have been accomplished. I also like to thank Drs. Leonard W. Casson, Robert Ries
and Stanley States for their serving on my doctoral committee and their insightful suggestions
and great efforts.
I deeply thank all the staff at the Special Pathogen Laboratory, VA Pittsburgh Healthcare
Systems, especially Sara Vaccarello, Sue Mietzner, Laura Morris, Asia Obman, Pat Sheffer and
Jaclynn L. Shannon and John Rihs. It is a great experience to work with this big family.
Finally I would like to express my deepest appreciation to my wife Liu Qi, my father and
my brother for their continuous support. This dissertation is dedicated to my late mother.
xiv
1.0 INTRODUCTION
1.1 APPLICATION OF CHLORINE DIOXIDE FOR LEGIONELLA CONTROL IN
HOSPITAL WATER SYSTEMS AND MONITORING THE FATE OF DISINFECTION
BYPRODUCTS
Chlorine dioxide (ClO2) has recently been used in the U.S. for disinfection of hospital water
systems and to prevent hospital-acquired Legionnaires’ disease 1, 2. The Environmental
Protection Agency determined the Maximum Residual Disinfectant Level (MRDL) for chlorine
dioxide at 0.8 mg/L 3. The disinfection byproducts of chlorine dioxide are chlorite (ClO2-) and
chlorate (ClO3-) ions. These disinfection byproducts may also pose high health risks for
consumers and the Maximum Contaminant Level (MCL) for chlorite is set at 1.0 mg/L 3.
Although chlorine dioxide and its disinfection byproducts persistence in water treatment
plant and large distribution systems has been studied since it became increasingly popular for
drinking water treatment 4, 5, its efficacy and safety as a disinfection approach in secondary
distribution systems, such as hospital water systems, has not been studied extensively. The fate
and levels of chlorite and chlorate generated during continuous chlorine dioxide disinfection of
hospital water system are not known. The objective of this study was to evaluate the efficacy of
chlorine dioxide to control Legionella in hospital water systems and to verify that the levels of
ClO2, ClO2-and ClO3
- did not exceed EPA limits.
1

1.2 THE EFFECT OF WATER QUALITY PARAMETERS (PH, TEMPERATURE
AND TOC) ON CHLORINE DIOXIDE DECAY IN DRINKING WATER
Previous studies with chlorine dioxide for controlling Legionella in a hospital system showed
that an extended time (>20 months) was needed to achieve significant reduction in Legionella
positivity in hot water system 1, 2. Such behavior was attributed to the fact that the chlorine
dioxide residual in the hot water was significantly lower than that in the cold water. Accordingly,
Legionella positivity of the hot water samples was much higher than in the cold water samples.
The low chlorine dioxide residual in the hot water may be due to chlorine dioxide volatilization
at high temperature, faster reactions rate of chlorine dioxide reaction with organic matters at
higher temperatures, or the effect of high organic load in the hot water. The increased reaction
rate in hot water is an important consideration that may be overlooked by typical batch studies
that are typically conducted at room temperature. And Legionella are thermophilic bacteria and
proliferate in hot water of 45-55 °C. If a sufficient disinfectant residual is not maintained in a hot
water distribution system, complete eradication or suppression of Legionella may not be
possible.
In this study, chlorine dioxide decay kinetics in drinking water with different total
organic carbon concentration was investigated in room temperature (25 ± 2 °C) and at 45 °C and
compared to the reaction kinetics with humic substance at those temperatures. The formation of
disinfection by-products (chlorite and chlorate) was also analyzed to establish a mass balance
equation to evaluate the chlorine dioxide reaction mechanism:
2

Chlorine dioxide dose = chlorine dioxide residual +
chlorite concentration +
chlorate concentration +
chloride produced
1.3 THE EFFECT OF PIPE CORROSION SCALE ON CHLORINE DIOXIDE
CONSUMPTION IN DRINKING WATER
New electrochemical generation system uses electrochemical cassettes and membrane
technology to generate a stock solution of approximately 500 mg/L ClO2 from 25% sodium
chlorite solution. The equipment is easy to install and safe to operate in the institutional
plumbing system. Several studies have been conducted to evaluate the efficacy and safety of
ClO2 generated by this electrochemical process for controlling water borne pathogens in hospital
water systems 1, 2.
However, the loss of ClO2 due to corrosion scales has not been studied in detail. And
chlorine dioxide is a strong oxidant and will oxidize ferrous ions released from the iron corrosion
scale. The reactions of ClO2 with corrosion scales will lead to undesirable losses in the
disinfectant residual. In this study, the corrosion scales from a galvanized iron pipe and a copper
pipe that have been in service for more than 10 years were characterized by energy dispersive
spectroscopy (EDS) and X-ray diffraction (XRD). The impact of corrosion scale materials on
ClO2 decay was investigated in DI water at 25°C and 45°C in a batch reactor to simulate the
application of chlorine dioxide in hospital hot and cold water systems. In addition, ClO2 decay
3

was also investigated in a specially designed reactor made from the iron and copper pipes to
obtain more realistic reaction rate data.
1.4 SYNERGISTIC EFFECT OF CHLORINE DIOXIDE AND FREE CHLORINE
FOR CONTROLLING LEGIONELLA IN A MODEL PLUMBING SYSTEM
A field study showed that Legionella positivity in one hospital water system was reduced in a
much shorter period of time (6 -10 months) compared to the other two hospitals included in the
study. It was also found that the incoming drinking water received from the city’s supply system
contained high levels of free chlorine because the hospital was very close to the water treatment
plant and was the first big consumer in the distribution system. It can be hypothesized that the
coincident reaction of two disinfectants (chlorine and chlorine dioxide) might provide additional
synergistic effects for controlling Legionella in the water distribution system. Another possibility
is that disinfection with chlorine followed by chlorine dioxide may be an effective approach to
treat Legionella. Advantages of combining these disinfectants are that chlorine is still used as the
primary disinfectant in most water treatment plants. When chlorine is used as the primary
disinfectant, it can meet some oxidant demand in the distribution system so that the chlorine
dioxide injected in the health care facility can be maintained at a stable residual concentration. In
addition, the reaction of chlorine and chlorite may reduce the formation of chlorine dioxide
disinfection byproducts.
The synergistic effects of combined disinfectant residuals (free chlorine and chlorine
dioxide) for controlling Legionella were investigated in a model plumbing system. And the effect
4
of temperature on the efficacy of chlorine and chlorine dioxide for controlling Legionella was
also investigated.
1.5 OBJECTIVES AND SCOPE
The objectives of this study were to evaluate the safety and efficacy of chlorine dioxide for
Legionella control in controlled prospective study in individual hospitals as the step 3 of a 4-step
evaluation process. The factors that would impact the efficiency of chlorine dioxide in hospital
water systems were investigated in laboratory experiments. More specifically:
To evaluate the efficacy of chlorine dioxide for Legionella control in individual hospitals;
To monitor the fate of chlorine dioxide disinfection byproducts in hospital water systems;
To investigate the impacts of pH, temperature and total organic carbon on chlorine
dioxide decay in drinking water in a batch reactor with floating glass cover to optimize the
application of chlorine dioxide in the field;
To investigate the effect of pipe corrosion scale on chlorine dioxide efficiency to predict
the chlorine dioxide loss in water distribution systems;
To investigate the synergistic effect combined disinfectant residuals (free chlorine and
chlorine dioxide) for controlling Legionella in a model plumbing system.
5
2.0 LITERATURE REVIEW
2.1 CHLORINE DIOXIDE
2.1.1 Physical chemical characteristic of chlorine dioxide
Pure chlorine dioxide is a green-yellow gas 6, 7. Chlorine dioxide gas is readily soluble in water,
in which it forms a green yellow solution. In contrast to the hydrolysis of chlorine gas in water,
chlorine dioxide in water does not hydrolyze to any appreciable extent but remains in solution as
a dissolved gas 8. Chlorine dioxide exists almost entirely as monomeric free radicals with an
unpaired electron in nature and is five times more soluble than chlorine 6, 7. General methods of
preparing chlorine dioxide include the reactions between acid and sodium chlorite, or chlorine
gas and sodium chlorite. Chlorine dioxide is light sensitive and will decompose readily when
exposed to sunlight or fluorescent lights. Zika 9 showed that chlorine dioxide has a lifetime of
less than 0.5 minute in water exposed to bright sunlight.
Chlorine dioxide is effective in removing iron and manganese 6, 7 and controlling taste
and odor 10, especially if caused by phenolics, chlorophenolics, and algal by-products. Chlorine
dioxide and its byproducts, chlorite and chlorate, do not react with humic or fulvic acids to form
THMs, as does chlorine 11, 12. Reactions of chlorine dioxide with organic compounds, such as
phenol 13-16 and humic substances 17, have been widely studied. In general, chlorine dioxide
6
reacts primarily by one electron oxidation mechanism 14, 15, 18. In contrast, chlorine reacts not
only via oxidation but also by electrophilic substitution, resulting in a variety of chlorinated
organic products, among them the THMs 18. Chlorine dioxide also appears to be more selective
as evidenced by somewhat lower demand for chlorine dioxide as compared to chlorine. The use
of chlorine dioxide has been proven to reduce THMs formation in many drinking water supplies
11, 12, 19-21. Chlorine dioxide does not react with amines to form chloramines and does not react
with bromide to form brominated byproducts 7.
2.1.2 Chlorine dioxide as a disinfectant
The efficacy of chlorine dioxide as a bactericide was demonstrated in the 1940s22, 23. 1-5 mg/L of
chlorine dioxide was shown to be effective against Escherichia coli and Bacillus anthracoides 22,
23. Chlorine dioxide was found to be more effective than chlorine in sewage effluent 24, and the
rate of chlorine dioxide inactivation was extremely rapid compared with chlorine 25. Other
studies showed that biocidal efficiency of chlorine dioxide is equal or superior to chlorine 26-32.
Chlorine dioxide effectively inactivates Legionella 1, 2, Cryptosporidium parvum oocysts33-36,
viruses 37, 38 and other water borne pathogens 32, 39. Laboratory studies showed chlorine dioxide
to be effective in controlling biofilms that form on the surfaces of distribution pipes 40. Chlorine
dioxide has also been applied extensively in the paper pulp process as alternative bleaching
chemical to chlorine.
The mode of inactivation of viruses or bacteria by chlorine dioxide is still under debate.
Alvarez concluded that chlorine dioxide inactivated poliovirus by reacting with the viral
ribonucleic acid (RNA) and impairing its synthesis 36. Other studies showed chlorine dioxide to
react readily with the amino acids (e.g., cysteine, tryptophan and tyrosine), but not with RNA. It
7

was concluded that virus inactivation was due to altering viral capsid proteins by chlorine
dioxide 37, 41. Chlorine dioxide disruption of the outer membrane permeability was reported as a
third possible inactivation mechanism 25.
Since chlorine dioxide has so many advantages, it has been used as an alternative
disinfectant to chlorine not only in food industry42-48, but also in drinking water and wastewater
treatment 26, 49-51.
Chlorine dioxide (ClO2) has recently been used in the U.S. for disinfection of hospital
water systems and to prevent hospital-acquired Legionnaires’ disease 1, 2. Environmental
Protection Agency set the Maximum Residual Disinfectant Level (MRDL) for chlorine dioxide
at 0.8 mg/L 3. The disinfection byproducts of chlorine dioxide are chlorite (ClO2-) and chlorate
(ClO3-) ions. These disinfection byproducts may also pose high health risks for consumers and
the Maximum Contaminant Level (MCL) for chlorite is set at 1.0 mg/L 3.
Chlorine dioxide and its disinfection byproducts persistence in water treatment plant and
large distribution systems has been studied since it became increasingly popular for drinking
water treatment 4, 5, however its efficacy and safety as a disinfection approach in secondary
distribution systems, such as hospital water systems, has not been studied extensively. The fate
and levels of chlorite and chlorate generated during continuous chlorine dioxide disinfection of
hospital water system are not known. The objective of this study was to evaluate the efficacy of
chlorine dioxide to control Legionella in hospital water systems and to verify the levels of ClO2,
ClO2- and ClO3
- that will occur throughout the distribution system.
8

2.2 LEGIONELLA
2.2.1 Legionella and Legionnaires’ diseases
Legionnaires’ disease is a pneumonia caused by Legionella pneumophila. Legionellae bacteria
are ubiquitous in natural and manmade aquatic environments, such as rivers, ground waters 52,
streams and thermally polluted waters 53. Legionella proliferate within manmade water systems,
especially water distribution systems that provide favorable water temperatures (about 45-50°C),
physical protection, nutrients (sediments and biofilms), and commensal microorganisms 53-56.
Experiments also showed that Legionella can colonize on the surface of various plumbing
materials, such as polyvinyl chloride and stainless steel 53-55, 57. Even rubber fittings in showers
and taps were experimentally shown to support the growth of Legionella 58, 59.
The first known epidemic of nosocomial Legionella-induced pneumonia occurred in July
1965 in St. Elizabeth’s hospital in Washington, D.C 54. Since then, Legionella was isolated from
potable water distribution systems of numerous hospitals experiencing outbreaks of
Legionnaire’s disease 60-62.
2.2.2 Legionella in hospital water systems
Legionella is an opportunistic pathogen and its presence in water systems poses a high risk for
individuals with compromised immune systems, especially in hospitals where a large number of
patients with compromised immunity are likely to be exposed to water contaminated with
Legionella. The mortality of health care-acquired Legionnaires’ disease is estimated to be
9

approximately 40% 63. And hospital hot water systems have been demonstrated to be colonized
by Legionella 56.
Aerosolization was considered as the primary mode of transmission since outbreaks of
Legionnaires’ disease were widely linked to aerosol-generating systems, such as cooling towers
64. But evidence also implicated aspiration as a mode of transmission 64 and water distribution
systems contaminated with Legionella were documented as sources of nosocomial and
community-acquired Legionnaires’ disease 53-55. Disinfecting water distribution systems is the
key for suppressing the growth of Legionella in a hospital water system and preventing hospital-
acquired Legionnaires’ disease 57.
2.3 DISINFECTION METHODS FOR LEGIONELLA CONTROL
Superheat and flush, hyperchlorination, ozonation, ultraviolet (UV) light irradiation and copper-
silver ionization have been used to control Legionella in hospital water systems 65. Each of these
methods has its advantages and drawbacks. Hence, chlorine dioxide has been considered as an
alternative for disinfection of potable water systems and control of Legionella proliferation.
2.3.1 Superheat and flush
Legionella can be eradicated by elevating hot water tank temperature to 70°C followed by
flushing all water outlets, faucets and showers for 30 minutes 65-68. The main advantage of
superheat and flush is that no special equipment is required. However, the method is time-
10

consuming and recolonization of the system with Legionella will occur shortly after the
superheat and flush event 65-68.
2.3.2 Hyperchlorination
Hyperchlorination refers to the addition of free chlorine concentrations as high as 2 to 6 mg/liter
through the addition of calcium hypochlorite or sodium hypochlorite solution 65-68.
Hyperchlorination is often combined with superheat and flush to control Legionella in water
distribution systems. The notable drawback of hyperchlorination is its inability to completely
eradicate Legionella from the water system and its corrosive impact on distribution pipes over
time 65-68. In addition, high concentration of free chlorine enhances the production of
trihalomethanes and other disinfection byproducts, which are carcinogenic or mutagenic 65-68.
2.3.3 Ultraviolet light irradiation
U.V. irradiation kills bacterial cells by producing thymine dimers in DNA, which subsequently
hampers DNA replication 69. Continuous UV light treatment with filtration can control
Legionella from colonizing water fixtures that were near the point of use 69-72. UV light systems
are easy to install and will not form any disinfection byproducts in the treated water. However,
UV light systems provide no residual protection at distal sites and are not suitable as the sole
disinfection measure 71.
11
2.3.4 Copper silver ionization
Copper and silver ionization systems have been applied in more than 30 hospitals in the United
States to control Legionella in their water systems 73. Copper and silver systems can be easily
installed and maintained and provide lasting residual protection 74. However, scale accumulation
on the electrodes and high pH will reduce its efficacy 53. Long-term treatment might result in the
development of Legionella resistance to these ions 75.
2.4 CHLORINE DIOXIDE FOR LEGIONELLA CONTROL
Laboratory and field studies have shown that chlorine dioxide is an effective disinfectant for
Legionella removal in hot and cold drinking water distribution systems 37, 76-81. Chlorine dioxide
has been demonstrated to be effective against Legionella in potable water distribution systems of
several hospitals in Europe 37, 76-81. Walker et al. 53 used a shock dose of 50-80 ppm chlorine
dioxide to treat a hospital water system for 1 hour. Although the biofilm was not completely
removed by this procedure, no Legionella was recovered from both cold and hot water system
after the treatment. Continuous injection of low levels (0.3-0.5mg/L) of chlorine dioxide was
found to be effective in controlling Legionella in both cold and hot water systems 77. Hood et al77
showed that continuous dosing of chlorine dioxide (up to 0.5 mg/L) in a hospital cold water
system over a 6-year period was extremely effective in controlling planktonic Legionella
pneumophila. Chlorine dioxide was injected into the cold water system at 0.25-0.5 mg/L in a
newly opened ward block in a regional cardiothoracic unit and the level of chlorine dioxide in
12

the hot water system was raised to 3-5mg/L in controlled phases until no Legionella were
detected in the systems 77.
The application of chlorine dioxide in U.S. hospital water systems was not popular until
recently and there are very few studies that investigated the efficacy of chlorine dioxide to
control Legionella in U.S. hospitals 77.
2.4.1 Disinfection byproducts of chlorine dioxide
Despite its numerous advantages, chlorine dioxide still represents a potential source of health
risk for consumers due to its inorganic disinfection byproducts. Chlorite and chlorate are the
main disinfection byproducts of chlorine dioxide. At low levels, chlorite may cause congenital
cardiac defects and hemolytic anemia through oxidative damage to the red blood cell membrane
11, while higher levels can result in an increase in methemoglobin 82. Chlorite also affects the
nervous system in infants and young children 82. Persistence of chlorine dioxide and its
disinfection byproducts in water treatment plants and large distribution systems has already been
studied 4, 5. However, the level of chlorite and chlorate generated during the continuous chlorine
dioxide disinfection of hospital water systems has not been well documented. Since chlorite may
cause congenital cardiac defects and hemolytic anemia for patients undergoing hemodialysis
therapy, measures must be taken to remove not only chlorite but also chlorine dioxide that could
affect the patients. A case study showed that granular activated carbon and reverse osmosis were
effective in removing chlorite and other oxidants at a hemodialysis chronic care clinic 83. Ferrous
salts have also been shown effective in removing chlorite and chlorate in a laboratory study84.
13
2.4.2 Effect of temperature on chlorine dioxide efficacy
Ruffell et al. revealed that the decrease in chlorine dioxide obeyed a first order rate law,
C(t)=Coexp(-kt) at 20°C 33. They also assumed that the first-order decay in chlorine dioxide
concentration was valid at temperatures other than 20°C. Olivieri found that the loss of residual
chlorine dioxide follows first-order rate law at 22°C and that the half-life for chlorine dioxide in
the static distribution system test was 93 min at 22°C 37.
The inactivation rates of C.parvum oocyst or Bacillus subtilis36 with chlorine dioxide
were investigated in a temperature range of 4-30 °C 33, 39. The results showed that the
inactivation rate was lower at the lower water temperature, thereby increasing Ct requirements
with decreasing temperature. Water temperature was a critical factor for chlorine dioxide
inactivation of C.parvum oocyst 34. For every 10 °C temperature increase, the reaction constant
increased by a factor of 2.3.
The decomposition of chlorine dioxide in hot water (>30°C) was not investigated
extensively in the past. The inactivation rate of Legionella with chlorine dioxide in hot water
(>30°C) had not been studied. Therefore, a model distribution system was used to investigate the
fate of chlorine dioxide in both the cold and hot water.
2.4.3 The effect of pH on chlorine dioxide efficacy
It has been shown that chlorine dioxide is stable in the pH range of 4-10 6, 7 and significant
dispropotionation of chlorine dioxide only occurs at pH above 10 6, 7. The impact of pH on the
efficacy of chlorine dioxide in controlling Legionella needs to be investigated due to its potential
impact on the rate of inactivation as well.
14

2.4.4 The effect of dissolved organic carbon on chlorine dioxide efficacy
Humic substances are present in most natural water bodies at the range of 0.1-200mg/L 53.
Chlorine dioxide will not react with these humic substances to form THM compounds12, 17, 19-21.
However, the bactericidal effect of chlorine dioxide will be affected by higher organic carbon in
water due to the reaction of chlorine dioxide with organic compounds. Chlorine dioxide will
react with available natural organic matters in drinking water, which will reduce the chlorine
dioxide residual in the distribution system and its bactericidal efficiency.
In a previous study 1, 2, and in a current field study, the chlorine dioxide residual in the
hot water was significantly lower than that in the cold water. Accordingly, Legionella positivity
of the hot water samples was much higher than in the cold water samples. The observed low
chlorine dioxide residual in the hot water may be due to several factors, including chlorine
dioxide gassing off at high temperature, faster reactions of chlorine dioxide at higher
temperatures, or the presence of high organic load in the hot water.
2.4.5 The effect of corrosion scale on chlorine dioxide decay
The compounds usually found in iron corrosion scales include goethite (α-FeOOH),
lepiodcrocite (γ-FeOOH), magnetite (Fe3O4), siderite (FeCO3), ferrous hydroxide (Fe(OH)2),
ferric hydroxide (Fe(OH)3), ferrihydrite (5Fe2O3·9H2O), green rusts (FeII4Fe2
III(OH)12(CO3)) and
calcium carbonate 85, 86. Literature showed that high concentration of readily soluble Fe (II)
content was present inside the scale and that iron was released to bulk water primarily in the
ferrous form 85-89. Free chlorine consumption induced by iron corrosion in a drinking water
15
system has been investigated 85-89, but the chlorine dioxide consumption by pipe corrosion scale
has not yet been reported.
2.4.6 The effect of chlorine residual on the efficacy of chlorine dioxide for Legionella
control
Reactions (1) and (2) represent possible reactions between chlorine (as molecular chlorine or
hypochlorous acid) and chlorite that have been widely studied with respect to chlorine dioxide
generation 90-96. Reaction 1 predominates at pH 5 and high concentration of reactants. Reaction 2
predominates in high pH region, but negligible chlorine dioxide was formed at pH above 7.
HOCl + 2ClO2- + H+ → 2 ClO2 + Cl- + H2O (1)
OCl- + 2ClO2- → ClO3
- + Cl- (2)
For drinking water conditions at neutral pH and milligram-per-liter concentrations of
reactants, very little information on the reaction rates is available 17, 96. The reaction between
chlorite and hypochlorite ion was very slow, requiring several hours at high concentrations of
reactants to produce measurable concentrations of chlorate as the only product 90-96. Werdehoff
investigated the reaction of 2.1 mg/L of Cl2 and 1.1 mg/L of chlorite at pH 7 [84]. No detectable
chlorine dioxide was measured during the period of 7 days and the chlorate was thought to be the
main products.
Katz et.al applied the equal dose of chlorine dioxide and chlorine to disinfect the effluent
from a municipal sewage treatment plant 84. The results showed that the combination of two
disinfectants produced relatively stable high residual of both disinfectants, reduced the
16

concentration of the undesirable disinfection byproduct (i.e. chlorite ion), while increasing the
concentration of chlorine dioxide. They explained such behavior due to Reaction 2. Several
studies showed that mechanically mixed oxidants achieved considerable disinfection efficiency
for selected microorganisms 97. However, the level of the enhanced disinfection efficiency
remains unclear and the synergistic effect of the mixed oxidants also needs to be confirmed. One
study showed that sequential disinfection with chlorine dioxide followed by free chlorine is an
effective approach to treating Cryptosporidium parvum 98. The synergistic effect of sequential
treatment may be caused by the unique activity of each disinfection agent reacting with specific
chemical groups of the cell wall. The combination of chlorine dioxide and chlorine for
Legionella control has not yet been investigated.
17

3.0 MATERIALS AND METHODS
3.1 FIELD STUDY
3.1.1 Hospital A
Healthcare-acquired legionellosis due to Legionella pneumophila was diagnosed in an
immunocompromised patient in hospital A with 364 patient beds and 74 skilled nursing beds.
Following the initial case, steps were taken to control Legionella in the water distribution system
and ClO2 was chosen to treat the hospital water system. Hospital A is comprised of two
buildings: Building 1 (referred to as B1) and Building 2 (referred to as B2). Both buildings have
8 floors (Table 1). 83% of pipe in the hospital water system is copper; the other 17% is brass.
The hospital water is supplied by the city water department. Legionella has been detected in the
hot water systems of both buildings of this hospital since October 2002. The extent of Legionella
colonization is expressed as percent Legionella positivity, which is the percentage of all sample
sites that tested positive for Legionella. The risk of legionnaires' disease in hospital patients has
been shown to be better predicted by the percentage of water-system sites testing positive for
Legionella than by the concentration of Legionella bacteria in individual samples 99. The
percentage of Legionella positive hot water outlets was 67% (6/9) before the installation of the
ClO2 system. ClO2 generating system was online and operational in January 2003.
18

Table 1. Comparison of study parameters of three hospitals using chlorine dioxide for
Legionella control
Parameter Study No.1
(Geisinger)
Study No. 2
(Hospital A)
Study No. 3
(Hospital B)
Size 437 beds
23 buildings
401 beds
2 buildings
687 beds
1 building
ClO2 injection point 520,000 gal. reservoir Cold water main Cold water main
Sample frequency
& duration
Monthly for 22
months
Bi-monthly for 20
months
Bi-monthly for 14
months & ongoing
Chlorite Monitoring No Yes Yes
3.1.1.1 ClO2 generation system
One ClO2 generating unit (Halox Inc. Bridgeport, CT) was installed in each building by
Environmental Hygiene Services (Nalco Co., Naperville, IL). The modular electrochemical
cassettes generate a solution with approximately 500 mg/L ClO2 using a 25% sodium chlorite
solution. The ClO2 was injected into the incoming cold water main pipe at the target ClO2
concentration of 0.5-0.7 mg/L based on the flow rate of the incoming cold water.
19
3.1.1.2 Sample collection
Sampling locations for Legionella were selected throughout the distribution system in hospitals
A. 13 sampling locations in B1 and 7 sampling locations in B2 were located on the second,
fourth, fifth, sixth and eighth floors of hospital A. Hot and cold water samples were collected
from distal outlets (sink and shower) at each sampling location. The hot water storage tank was
also sampled. Sampling in hospital A was performed every two months from June 2004 to
August 2005 and extended to June 2006.
120 ml water samples were collected for Legionella culture immediately after the outlet
tap was turned on. Legionella testing was performed in the VA Special Pathogens Laboratory, as
previously described1. The distal outlets were then flushed for 1 minute to collect representative
water samples for ClO2 analysis. Temperature measurements were taken directly from the flow
stream after the flush. A 10-ml sample was taken for ClO2 analysis at the time of collection and
100g/L of glycine was used to eliminate free chlorine interference. Levels of ClO2 were analyzed
in both hot and cold water samples using the Hach Method 10101 –DPD Method for ClO2 (0.00
to 5.00 mg/L) utilizing a glycine reagent and Hach DPD Free Chlorine Reagent (Hach Company,
Loveland, CO). The colorimetric measurements were performed using the Hach DR/2010
Spectrophotometer (Hach Company, Loveland, CO).
Hospital personnel also monitored ClO2 residual in cold water throughout the distribution
system every month in hospital A. ClO2 residual measurements by the hospital personnel were
performed using a pocket colorimeter following the DPD method with the same reagents as for
the study samples.
Samples for ClO2- and ClO3
- analysis were chosen to represent various distances from the
ClO2 injection point (closest, midpoint and farthest sites). A total of 7 hot water samples and 5
20
cold water samples were collected for ClO2- and ClO3
- analysis every two months from 5
locations in B1 and 2 locations in B2. Samples for ClO2- and ClO3
- analysis were sparged with
nitrogen gas for 10 minutes immediately following the collection to remove ClO2 residual. 30 ml
of the sample was filtered through a 0.2 micron filter followed by the addition of 50 mg/L of
ethylenediamine to each sample. ClO2- and ClO3
- were measured by ion chromatography (DX-
500, Dionex Inc, Sunnyvale, CA) with suppressor and conductivity detector according to
USEPA method 300.1 100. Two samples were also sent to a reference laboratory each time as a
quality control measure to ensure accuracy of ClO2- and ClO3
- analysis (Novachem Laboratories
Inc., Oxford, OH).
Water quality of the municipal water supply collected in the hospital was evaluated in
October 2003 and June 2004 by the Pittsburgh Water and Sewer Authority, Pittsburgh, PA.
Water samples from the city water supply were collected and stored at 4°C before transfer to the
Pittsburgh Water and Sewer Authority for analysis using standard laboratory procedures.
3.1.2 Hospital B
From March 2001 to January 2002, three cases of hospital-acquired Legionella pneumophila
pneumonia occurred in hospital B. Cultures from the water distribution system reflected the
presence of Legionella pneumophila serogroup 5 and were identical to Legionella cultured from
one of the identified patients. Following the initial cases, steps were taken to eliminate
Legionella in the water distribution system. This included superheating and flushing the hot
water system and replacement of a water tank found to be colonized with Legionella. Despite
these measures, another case of hospital-acquired Legionella pneumophila pneumonia was
identified in January 2002. The optimal method for long-term disinfection has not yet been
21

identified and no recommendations exist at this time for long-term treatment of water
distribution systems 101. Chlorine dioxide was the disinfection method chosen to treat the hospital
water system and was installed in April 2004.
In hospital B, the 12-floor building that is treated with ClO2 has 672 operating patient
beds. Pre-disinfection baseline cultures were collected from 2002-2004. There were 17 sampling
locations in the hospital B building that were located from the third to the twelfth floor. Hot and
cold water samples were collected from distal outlets (sink and shower) at each sampling
location. The hot water storage tank was also sampled. Sampling was performed every two
months from June 2004 through 2005 and extended to 2006.
120 ml water samples were collected for Legionella culture immediately after the outlet
tap was turned on. Legionella testing was performed in the VA Special Pathogens Laboratory, as
previously described1. The distal outlets were then flushed for 1 minute to collect representative
water samples for ClO2 analysis. Temperature measurements were taken directly from the flow
stream after the flush. A 10-ml sample was taken for ClO2 analysis at the time of collection and
0.1 ml of 100g/L of glycine was used to eliminate free chlorine interference. Levels of ClO2 were
analyzed in both hot and cold water samples using the Hach Method 10101 –DPD Method for
ClO2 (0.00 to 5.00 mg/L) utilizing a glycine reagent and Hach DPD Free Chlorine Reagent
(Hach Company, Loveland, CO). The colorimetric measurements were performed using the
Hach DR/2010 Spectrophotometer (Hach Company, Loveland, CO).
Hospital personnel also monitored ClO2 residual in cold water throughout the distribution
system every month in hospital A. ClO2 residual measurements by the hospital personnel were
performed using a pocket colorimeter following the DPD method with the same reagents as for
the study samples.
22
Samples for ClO2- and ClO3
- analysis were chosen to represent various distances from the
ClO2 injection point (closest, midpoint and farthest sites). A total of 7 hot water samples and 5
cold water samples were collected for ClO2- and ClO3
- analysis every two months from 5
locations in B1 and 2 locations in B2. Samples for ClO2- and ClO3
- analysis were sparged with
nitrogen gas for 10 minutes immediately following the collection to remove ClO2 residual. 30 ml
of the sample was filtered through a 0.2 micron filter followed by the addition of 50 mg/L of
ethylenediamine to each sample. ClO2- and ClO3
- were measured by ion chromatography (DX-
500, Dionex Inc, Sunnyvale, CA) with suppressor and conductivity detector according to
USEPA method 300.1 100. Two samples were also sent to a reference laboratory each time as a
quality control measure to ensure accuracy of ClO2- and ClO3
- analysis (Novachem Laboratories
Inc., Oxford, OH).
Water quality of the municipal water supply collected from the hospital was evaluated in
June 2004 by the Pittsburgh Water and Sewer Authority, Pittsburgh, PA. Water samples from
the city water supply were collected and stored at 4°C before transfer to the Pittsburgh Water and
Sewer Authority for analysis using standard laboratory procedures.
3.1.3 Statistical analysis
Statistic software Stata 9.0 (StataCorp, College Station, Texas) was used for statistical analysis.
The significant differences were evaluated by t-tests; analysis of variance (ANOVA), Chi-square
test and regression analysis under 95% confidence intervals. Significant differences among
samples were defined when the p value obtained from the statistical analysis was less than 0.05.
The null hypothesis of t-test, h0: µa = µb (µa and µb were the mean values of two sets of samples),
would be rejected if the p value is less than 0.05.
23

3.2 BATCH REACTOR EXPERIMENTS
Figure 1. The batch reactor with the floating glass cover
A cell culture flask (Wheaton Science Products, Millville, NJ) capable of holding 2,500-ml of
liquid was used as the batch reactor. A floating glass cover was used to prevent exchange of
gases between the headspace and room air and minimize the volatility of ClO2. Single port 45-
mm red rubber stoppers with a 0.25” hole (Wheaton Science Products, Millville, NJ) were used
on the side arms as a temperature monitoring port and a sample withdrawal port. The stoppers
were sealed gas tight using a 45-mm inlet cap (Wheaton Science Products, Millville, NJ). The
reactor and all parts were autoclaved prior to each experiment. The reactor was soaked overnight
in 50 mg/L ClO2 solution to satisfy disinfectant demand of the reactor material and rinsed with
DI water before use.
24

The experiments were carried out at room temperature which varied in a very narrow
range of 25±2°C. Hot water temperatures were maintained by heating the flask in a water bath on
the hot plate with a temperature probe feedback. Temperature monitoring was performed using
the temperature probe of the hot plate (PMC Industries Inc. San Diego, CA).
A ClO2 generator (Diox, Klenzoid Inc.) provided a concentrated ClO2 stock solution. The
effluent solution was wasted until the generator achieved ClO2 concentration of approximately
500 mg/L. The ClO2 concentration of the concentrated stock solution (fresh stock solution was
prepared for each experiment) was monitored using the Hach Method 8138 (0-700mg/L). The
appropriate amount of the ClO2 stock solution was pipetted into the batch reactor to achieve a
target ClO2 concentration of 1.0 mg/L. The decay of ClO2 was monitored after the addition of the
corrosion scales at various times. ClO2 concentration during batch experiments was monitored
using the Hach Method 10101 –DPD Method for ClO2 (0.00 to 5.00 mg/L) utilizing a glycine
reagent and Hach DPD Free Chlorine Reagent (Hach Company, Loveland, CO). The
colorimetric measurements were made using the Hach DR/2010 Spectrophotometer (Hach
Company, Loveland, CO).
Chlorite, chlorate and chloride samples were collected for the analysis at the beginning
and the end of the experiment. Chlorite, chlorate and chloride were measured by ion
chromatography (DX-500, Dionex Inc, Sunnyvale, CA) with suppressor and conductivity
detector according to USEPA method 300.1. Chlorite, chlorate and chloride concentrations
produced through ClO2 reaction with scales were determined by the difference between the final
and initial concentration to eliminate the interference of chlorite, chlorate and chloride present in
the stock solution. pH of the solution was buffered with 0.1M phosphate buffer and it was
adjusted by the addition of 0.1M NaOH.
25

Cold potable water samples were collected from the incoming drinking water main of the
studied hospitals. Hot water samples were collected in 10-L polyethylene carboys from the
building that was not treated with chlorine dioxide and stored at 4°C. The pH of the potable
water samples was not adjusted. All water samples were sterilized prior to use by autoclaving the
waters at 120 °C for 30 minutes. TOC concentration of the potable water samples was measured
using the high temperature combustion method on a Model 1555B TOC Analyzer (Ionics,
Incorporated Instrument Division, Watertown, MA).
The TOC stock solution was prepared by dissolving the humic substance extracted from
the Suwannee River (International Humic Substances Society, St. Paul, MN) and Aldrich humic
acid as sodium salt (Aldrich, Milwaukee, WI) in a 0.001 M KOH solution and diluting to 1 liter
with deionized water. The stock solution was stored at 4 °C.
UV-VIS spectra of humic acid before and after the reaction with chlorine dioxide were
analyzed in the range of 200-600 nm on a Cary 5000 UV-VIS spectrophotometer (Varian
Instruments, Walnut Creek, CA) in 1 cm path length quartz cells to detect the change of the
absorbance spectrum of humic acid.
The corrosion scale material for the batch experiment was sampled from the corroded
iron pipe and ground to powder without sieving before adding to the batch reactor. Commercial
cuprite and magnetite powder (Aldrich, PA) were also used in the batch reactor experiment. The
appropriate amount of the ClO2 stock solution was pipetted into the batch reactor to achieve a
target ClO2 concentration of 1.0 mg/L. The decay of ClO2 was monitored after the addition of the
corrosion scales at various times.
26
3.3 PIPE REACTOR
A 30 inches long, 4 inches diameter galvanized iron pipe and a 15 inches long, 2 inches diameter
copper pipe were obtained from a local hospital water system and used for this study. The iron
pipe was covered with deposits of corrosion products and heavily tuberculated as shown in
Figure 2(a). The copper pipe was comparatively clean (Figure 2. (b)), only a thin film of
corrosion scale formed on the copper pipe wall as shown by scanning electron microscopy
(SEM) image in Figure 2 (c).
a)
(b) (c )
Figure 2. (a) The inner surface of the galvanized iron pipe, (b) the inner surface of
the copper pipe from a local hospital water system and c) SEM image of the copper pipe
wall
27

3.3.1 Characterization of corrosion scale on the iron and copper pipe
The scales were scraped from the top, middle and bottom layer of the tubercles close to the end
of the iron pipe and grounded into powder. The scales from the copper pipe were scraped from
the copper pipe wall from both ends of the pipe. The elemental composition of the scales was
analyzed by energy dispersive spectroscopy (EDS). Philips XL Series 30 scanning electron
microscope and X-ray energy dispersive spectrometer (Philip Analytical Inc, Natick, MA) was
used for EDS studies. The X-ray diffraction patterns of the samples were obtained with a Philips
X’PERT diffractometer (Philip Analytical Inc, Natick, MA) using a standard Ni-filtered Cu Kα
radiation source operating at 40 kV and 30 mA. X-ray patterns were analyzed using pattern
processing software based on the latest Joint Committee on Powder Diffraction Standards
(JCPDS) files. Samples were also sent to Materials Characterization Laboratory (Pennsylvania
State University, University Park, PA) for X-ray photoelectron spectroscopy.
3.3.2 Pipe reactors setup
Copper and galvanized iron pipes were used to set up the experimental system shown in Figure
3. The flow rate of ClO2 stock solution (1.0 mg/L) was adjusted to achieve the retention time for
sampling port 1, 2 and 3 of 10, 20 and 30 minutes, respectively. The pipe reactor was flushed by
the tap water for 24 hours before the experiment to re-wet the pipe surface and flush out any
easily dislodged tubercles. 1.0 mg/L of ClO2 was pumped through the pipe reactor and the ClO2
residual at each sampling port was measured during the experiment until the ClO2 residual at
each sampling port stabilized. The experiments were conducted in duplicate. The first order
kinetic expression was used to evaluate the data.
28

Sampling ClO2
Figure 3. The pipe reactors setup
29

3.4 THE MODEL PLUMBING SYSTEM
3.4.1 Model plumbing system
The model plumbing system consists of three parallel transparent PVC pipes (1"×8') which can
be operated in a single pipe network or as separate loops (Figure 4). One pipe is used as a control
pipe and the other two receive different disinfectant doses. The flow throughout the plumbing
system was turbulent, with Reynold's number (Re) between 10,000 and 11,000 at flow rate at 3.2
gpm. The pipes were wrapped with aluminum foil and the room was kept dark as much as
possible to eliminate the effects of the UV light emitted by florescent lamps. Interference due to
chlorine was eliminated by using dechlorinated water.
Figure 4. Model plumbing system
30
3.4.1.1 Stock solution The source of naturally-grown Legionella and HPC bacteria was sediment
and associated water collected from filter cartridges in the recirculating hot water system of a
VA Hospital in Pittsburgh. The presence of Legionella pneumophila in the harvested and
collected filter/water suspension was confirmed using direct fluorescent antibody staining
(DFA). The solution was maintained at room temperature in a 10-liter carboy and continuously
aerated to maintain the dissolved oxygen (DO) level at 6.5 – 8.0 mg/L.
3.4.1.2 System inoculation and biofilm formation The inoculum solution consisted of 1.5 liter
of the Legionella stock solution, 8 liters of dechlorinated tap water, and 0.5 L of nutrient
supplement solution containing 0.25 gram of ferric pyrophosphate, 1.0 g of alpha-ketogluterate
and 0.4 g cysteine. The inoculum solution was incubated for 14 days at 37°C prior to use.
After 14-day incubation at 37°C, the inoculum solution was added to the model system
with an additional 20 liters of dechlorinated tap water and recirculated intermittently for 14 days
at 3.2 gpm to establish a consistent biofilm population.
3.4.1.3 Disinfection The first loop was used to investigate the synergistic efficacy of continuous
addition of 0.2 mg/L chlorine dioxide and 0.5 mg/L free chlorine for controlling Legionella at
room temperature by using syringe pumps (Cole-Parmer, Vernon Hills, Illinois) , compared with
the result of the second loop with continuous addition of 0.2 mg/L of chlorine dioxide alone for
controlling Legionella. The third loop was used as control loop.
In the second run of the test, the first loop was used to evaluate the continuous addition of
0.2 mg/L chlorine dioxide for controlling Legionella at room temperature. The second loop was
used to investigate the effect of temperature on the efficacy of mixed disinfectant (0.2 mg/L of
chlorine dioxide and 0.5 mg/L free chlorine) for controlling Legionella. The temperature of the
31
second loop was maintained at ~40°C with the heating tape. The third loop was used as the
control loop. The impact of temperature on 0.2 mg/L of chlorine dioxide for Legionella control
was also investigated in the model plumbing system. And the experiments were conducted in
duplicate.
Chlorine dioxide residual in all experiments was monitored at every hour for the first 24
hours by the method described in previous section. The Legionella and HPC bacteria
concentrations in planktonic phase and in the biofilm were monitored at 0, 1, 3, 6, 24 and 48
hours.
3.4.1.4 Planktonic and biofilm sampling The details of the procedure was similar to that used
by Gao 54. A 5-ml planktonic water sample was collected from each sampling loop at the mixing
tank with addition of 0.05ml of 15% sodium thiosulfate to neutralize the disinfectant residual.
0.1 ml of the solution was plated in duplicate directly and after dilution onto Buffered Charcoal
Yeast Extract (BCYE), buffered charcoal yeast extract with Dyes, Glycine, Vancomycin and
Polymyxin (DGVP) and R2A media plates. 1 ml of the solution was mixed with 1 ml of filter
sterilized HCl-KCl solution for 3 minutes and 0.1 ml of this acid treated solution was plated in
duplicate onto BCYE and DGVP media plates to culture Legionella. The samples were also
diluted and plated if necessary. The mean value of the results from all these dilutions was used as
data points for data analysis.
Biofilm samples were taken by swabbing the inner surface of a predetermined section of
the pipe starting from both ends of each sampling pipe. The swab was first vortexed for 1 minute
in 5 ml of sterilized water. 0.1 ml of the solution was plated in duplicate directly and after
dilution onto BCYE, DGVP and R2A media plates. 1 ml of the solution was mixed with 1 ml of
filter sterilized HCl-KCl solution for 3 minutes and 0.1 ml of this acid treated solution was plated
32

in duplicate onto BCYE and DGVP media plates to culture Legionella. The mean value of the
results from all these dilution was used as data points for data analysis.
3.4.1.5 pH and temperature determination pH was measured using a Fisher Scientific,
Accumet, pH meter, model No.25. pH of the water was 7.0 throughout the experiment. Room
temperature was 25±2 °C. The hot water temperature was maintained at 40 °C by wrapping a
heating cable around the loop. Water temperature was measured using a portable thermometer.
33

4.0 RESULTS AND DISCUSSION
4.1 APPLICATION OF CHLORINE DIOXIDE FOR LEGIONELLA CONTROL IN
HOSPITAL WATER SYSTEMS AND MONITORING THE FATE OF THE
DISINFECTION BYPRODUCTS
4.1.1 Hospital A
4.1.1.1 Water quality parameters The water quality of the municipal water supply was
monitored in October 2003 and June 2004. The mean values of water quality parameters were as
follows: hardness was 127 mg/L as calcium carbonate, alkalinity was 83 mg/L as calcium
carbonate, pH was 7.70, total iron was 0.03 mg/L, total manganese was 0.01 mg/L, total organic
carbon (TOC) was 1.96 mg/L, and turbidity was 0.40 NTU. The ClO2 demand of the drinking
water was determined to be 0.20 mg/L after 6-hour contact time at 24 °C and pH 7.9 using
Method 2350C of the Standard Methods for the Examination of Water and Wastewater.
4.1.1.2 Legionella positivity In these studies the extent of Legionella colonization was expressed
as Legionella percent positivity, which is the number of sample sites positive for Legionella
divided by the total number of sites tested. The risk of legionnaires' disease in hospital patients
has been shown to be better predicted by the percentage of water-system sites testing positive for
Legionella than by the measured concentration of Legionella bacteria 73, 99
34
Healthcare facilities are increasingly faced with the decision of choosing a Legionella
disinfection method. It has been recommended that such systems undergo a 4-step evaluation
process to ensure safety and efficacy 73. This study represents step 3 of the process for chlorine
dioxide; controlled prospective study in an individual hospital.
Legionella positivity in hot water was reduced from 60% (12/20) in August 2003 to 10%
(2/20) in February 2006 (Figure 5). Regression analysis showed that a significant decline in
Legionella positivity in the hot water was observed after 18 months due to low ClO2 residual
(p<0.05, Figure 5). We believe that this decline can be attributed to a significant increase in ClO2
residual in the hot water. ClO2 residual in the hot water increased significantly from 0.04 mg/L in
August 2003 to 0.11 mg/L in February 2006 (p<0.05, Figure 5). The decline in Legionella
positivity in the hot water can not be attributed to the variation of the hot water temperatures
because hot water temperatures below 60 °C did not affect Legionella colonization 67, 68. The
mean distal site hot water temperature was 44 °C during the study (range from 27 to 52°C). The
mean distal site cold water temperature was 18 °C (range from 4 to 31°C). Legionella positivity
in cold water samples was below 20% with 0.3 -0.5 mg/L of ClO2 residual (Figure 6). The
increase in ClO2 with time in the cold water was not significant (p>0.05).
Although the overall distal site positivity declined during the study, we did not observe a
significant decrease in the concentration of Legionella (mean CFU/ml) in positive samples
(decreased from 265 CFU/ml to 30 CFU/ml, p>0.05). No cases of hospital-acquired
Legionnaires’ disease have been detected at the hospital since the ClO2 system was installed in
January 2003.
35

5/205/20
9/20
2/203/203/19
10/20
13/20
7/204/20
6/9
2/26 2/20
12/20
10/20
0%
10%
20%
30%
40%
50%
60%
70%
80%
10/02
01/03
08/03
10/03
12/03
02/04
04/04
06/04
08/04
10/04
12/04
02/05
04/05
06/05
11/05
02/06
Time (2003-2006)
Legi
onel
la p
erce
nt p
ositi
vity
,%
0
0.1
0.2
0.3
0.4
0.5
0.6
0.7
0.8
Chl
orin
e di
oxid
e m
ean,
mg/
L
Legionella positivityClO2
ClO2 Treatment
Started
Figure 5. A significant reduction in Legionella postivity was observed after the ClO2
treatment (p<0.05). Figure depicts Legionella positivity and ClO2 in hot water samples.
1/15
0/21
2/153/15
1/152/15
1/151/15
0/150/15
2/151/15
2/15
0/150%
10%
20%
30%
40%
50%
60%
70%
80%
01/03
08/03
10/03
12/03
02/04
04/04
06/04
08/04
10/04
12/04
02/05
04/05
06/05
11/05
02/06
Time (2003-2006)
Legi
onel
la p
erce
nt p
ositi
vity
,%
0
0.1
0.2
0.3
0.4
0.5
0.6
0.7
0.8
Chl
orin
e di
oxid
e m
ean,
mg/
L
Legionella positivity
ClO2
ClO2 Treatment
Started
Figure 6. Legionella positivity was below 20% in the cold water with a 0.3-0.5 mg/L
ClO2 residual. Figure depicts Legionella positivity and ClO2 in cold water samples.
In February 2005, Legionella positivity of hot water samples unexpectedly increased
from 10% (December 2004) to 45%. No malfunction of the ClO2 generator was reported prior to
36

this increase and mean ClO2 residual remained at 0.36 mg/L in the cold water on the sampling
day. The reason for the increase in Legionella positivity remains unclear. The feed concentration
of ClO2 was increased to 0.58 mg/L in B1 in April 2005. Samples collected in April and June
2005 showed that Legionella positivity returned to 25% (Figure 5).
The feed pump of the ClO2 generation system was changed on June 8th, 2004 to allow
for additional feed capacity. As shown in Figure 9, the mean monthly ClO2 residual in the cold
water increased from 0.41 mg/L to 0.54 mg/L after the pump replacement. The changes and
variability in mean monthly ClO2 residual are attributed to operational adjustments and
maintenance
After the ClO2 system was installed, a significant decrease in Legionella percent
positivity was observed in the hot water system. However, an extended period of time (18
months) was needed to achieve a significant reduction of Legionella positivity in the hot water
system of this hospital. This observation is consistent with the study by Sidari et al. in which the
time to complete elimination of Legionella positivity was 1.75 years 1. Sidari speculated that
the injection of ClO2 into the 520,000 gal reservoir and distribution over a large campus may
have contributed to the prolonged lag period. In the present study, ClO2 was injected into the
incoming cold water main of a comparatively smaller secondary distribution system. The delay
in Legionella reduction is more likely due to the low concentration of ClO2 in the hot water. This
is significant because Legionella species proliferate in hot water 57. It is clear that maintaining
sufficient ClO2 residual in the hot water system is quite challenging. Elevated water temperature
hastens the conversion of ClO2 to ClO2- the reactions with organic compounds in the water
distribution system 102. This is consistent with the observation that ClO2 was consumed and
37
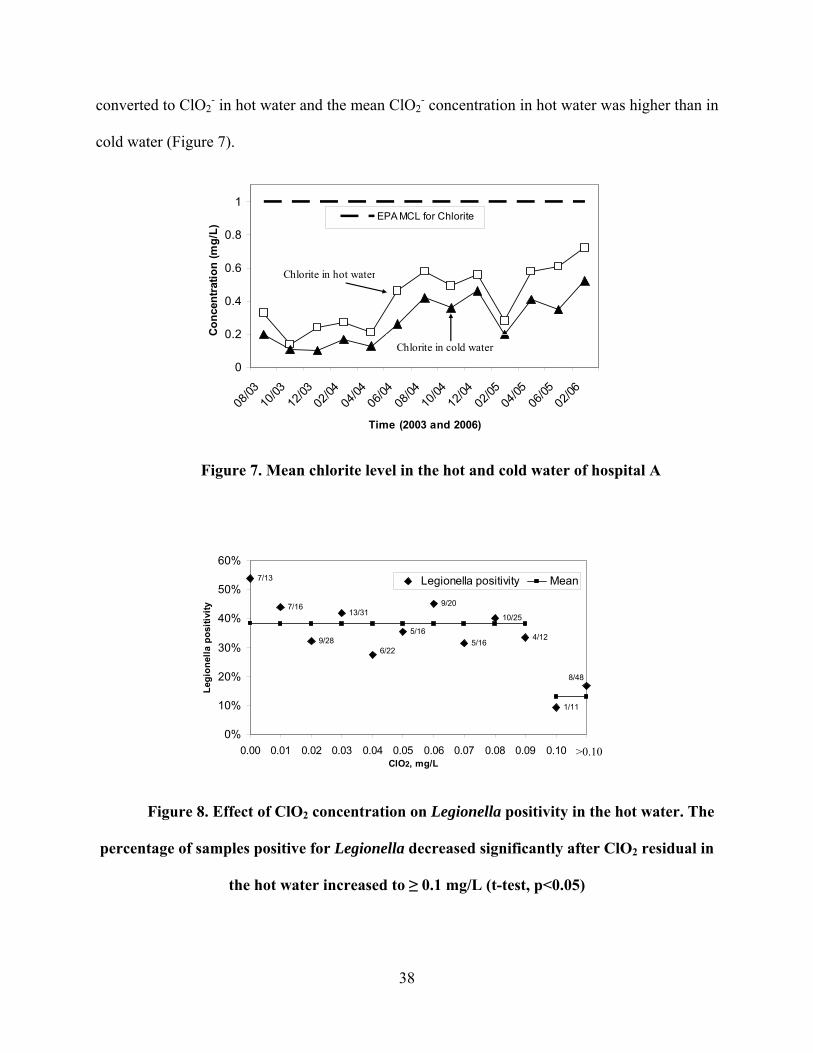
converted to ClO2- in hot water and the mean ClO2
- concentration in hot water was higher than in
cold water (Figure 7).
0
0.2
0.4
0.6
0.8
1
08/03
10/03
12/03
02/04
04/04
06/04
08/04
10/04
12/04
02/05
04/05
06/05
02/06
Time (2003 and 2006)
Con
cent
ratio
n (m
g/L)
EPA MCL for Chlorite
Chlorite in hot water
Chlorite in cold water
Figure 7. Mean chlorite level in the hot and cold water of hospital A
9/20
5/16
6/22
13/31
9/28
7/16
7/13
5/16
10/25
4/12
1/11
8/48
0%
10%
20%
30%
40%
50%
60%
0.00 0.01 0.02 0.03 0.04 0.05 0.06 0.07 0.08 0.09 0.10 0.11ClO2, mg/L
Legi
onel
la p
ositi
vity
Legionella positivity Mean
>0.10
Figure 8. Effect of ClO2 concentration on Legionella positivity in the hot water. The
percentage of samples positive for Legionella decreased significantly after ClO2 residual in
the hot water increased to ≥ 0.1 mg/L (t-test, p<0.05)
38

Percent Legionella positivity in the hot water samples decreased as ClO2 residual in the
hot water increased to ≥ 0.1 mg/L (Figure 8). Since p value from t-test was less than 0.05, the
null hypothesis that the mean Legionella positivity was the same between samples with chlorine
dioxide residual below or above 0.1 mg/L was rejected. The decline in Legionella positivity in
the hot water with increasing ClO2 residual ≥ 0.1 mg/L was significant (p<0.05) (Figure 8). In
this hospital distribution system, mean ClO2 residual in the hot water seldom reached 0.10 mg/L,
which may explain the extended time needed to accomplish significant reduction of Legionella
positivity. Increasing ClO2 residual up to 0.1 mg/L at distal outlets in hot water system might be
helpful to the application of ClO2 for controlling Legionella.
Previous field studies on the efficacy of ClO2 for controlling Legionella in European
hospitals showed that at least six months of continuous injection of ClO2 was required for
complete eradication of Legionella or to achieve a significant reduction of Legionella positivity
76, 103. A field study on the efficacy of ClO2 in European hospitals also reported that Legionella
persisted in significant numbers (up to 20,000 CFU/L) and with little reduction in the number of
positive sites with ClO2 treatment for 2 years with the injection of 0.5 mg/L ClO2 in both hot and
cold water 104. Our results show that Legionella can be suppressed in the cold water with the
ClO2 residual of 0.30-0.50 mg/L. This is consistent with results of other studies 73. However, an
extended period of time (18 months) was still needed to achieve a significant reduction of
Legionella positivity in the hot water system since ClO2 residual in the hot water seldom
exceeded 0.10 mg/L.
It may be possible to reduce this lag period by performing shock ClO2 treatment 105.
Makin reported that the successful application of ClO2 in hot water system for controlling
Legionella required increasing the ClO2 level to 3-5 mg/L in hot water system 81. Alternatively,
39

daily flushing of sinks and showers in patient rooms may also be effective 105. However, both of
these measures need to be evaluated in a controlled study.
Another possible approach to achieving higher ClO2 residual in hot water includes adding
a ClO2 injection point to the line after the hot water tanks. This may shorten the time needed to
achieve measurable ClO2 residual at distal outlets. The impact of injecting ClO2 directly into the
hot water for controlling Legionella has yet to be evaluated.
0.00
0.10
0.20
0.30
0.40
0.50
0.60
0.70
0.80
0.90
01/03
03/03
05/03
07/03
09/03
11/03
01/04
03/04
05/04
07/04
09/04
11/04
01/05
03/05
05/05
07/05
09/05
11/05
01/06
Time
Mea
n M
onth
ly C
lO2
Res
idua
l, m
g/L
Figure 9. Mean monthly ClO2 residual in cold water samples. The changes and
variability in mean monthly residual are attributed to operational adjustments and
maintenance.
4.1.1.3 Mechanical modification of the ClO2 feed system The feed pump of the ClO2
generation system was changed on June 8th, 2004 to allow for additional feed capacity. As
shown in Figure 3, the mean monthly ClO2 residual in the cold water increased from 0.41 mg/L
40

to 0.54 mg/L after the pump replacement. The changes and variability in mean monthly residual
are attributed to operational adjustments and maintenance (Figure 9).
4.1.1.4 ClO2 and its disinfection by-products ClO2, ClO2- and ClO3
- levels were monitored
throughout the buildings during the study. The mean ClO2 residual in the hot water was 0.07
mg/L. The mean ClO2 residual in the cold water was 0.42 mg/L. The difference in mean ClO2
concentrations between the cold water distal outlets and hot water distal outlets was significant
(p<0.05). The mean ClO2 residual in the hot water seldom exceeded 0.10 mg/L.
A total of 91 hot water samples and 65 cold water samples were analyzed for ClO2- and
ClO3-. The average ClO2
- concentrations in the hot and cold water were 0.42 and 0.28 mg/L,
respectively. The ClO2- concentrations measured in this study were in agreement with those
obtained by the reference lab (NovaChem Laboratories Inc., Oxford, OH). The mean difference
was only 8 % (p>0.05).The mean ClO2- concentrations in cold and hot water were below the
EPA MCL of 1.0 mg/L. The mean ClO3- concentrations in hot and cold water were below 0.10
mg/L.
The mean ClO2 and ClO2- concentrations between the different sampling locations in
hospital A over 2 years are presented in Figure 10 a and b. Chlorite concentration ranged from 0
to 0.82 mg/L. Chlorine dioxide concentration ranged from 0 to 0.70 mg/L. There were no
significant differences (p>0.05) in mean ClO2 and ClO2- concentrations between the sampling
locations that represent various distances from the injection point in the hot water (Figure. 10a)
and in the cold water (Figure 10b). F statistics obtained by ANOVA ranged from 0.49 to 1.16,
whose p-values were greater than 0.05. The null hypothesis that mean chlorite and chlorine
dioxide levels between different sampling locations were same was not rejected.
41

The operation of the ClO2 system for controlling Legionella in the hospital water system
was found to be safe based on the MRDL for ClO2 and MCL for ClO2-. The ClO2 residual at
distal outlets was below the MRDL. The mean concentrations of ClO2- in the hot and cold water
throughout the buildings were below the MCL levels. ClO3- is currently not regulated but its
levels in the hot and cold water never exceeded 0.20 mg/L. Users of chlorine dioxide systems
must comply with current regulations for municipal water systems. This involves daily
monitoring of ClO2 and monthly monitoring of ClO2-. ClO2
- monitoring can be reduced to
quarterly monitoring after monthly monitoring results show that the ClO2- level in the
distribution system has not exceeded the MCL of 1.0 mg/L for one year 3. Our data suggest that
less frequent monitoring of ClO2- levels in a hospital with a small secondary water system would
be sufficient to satisfy safety concerns.
0
0.1
0.2
0.3
0.4
0.5
0.6
0.7
0.8
0.9
B1-HWT1
B1-HWT2
B1-2nd B1-5th B1-8th B2-4th B2-8th
Sampling Location
Conc
entr
atio
n, m
g/L
ClO2Chlorite
0
0.1
0.2
0.3
0.4
0.5
0.6
0.7
0.8
0.9
B1-2nd B1-5th B1-8th B2-4th B2-8th
Sampling Location
Conc
entra
tion,
mg/
L
ClO2Chlorite
a) Hot water b) Cold water
Figure 10. Distance from the ClO2 point-of-injection did not significantly affect
mean concentrations of ClO2 and ClO2- in the hot and cold water (ANOVA, p>0.05).
Srinivasan compared the ClO2 and ClO2- levels at different sampling locations between
two time points in a hospital water system 2. The ClO2 and ClO2- levels in the lower floor were
higher than the ClO2 and ClO2- levels in the higher floor one month after the start of the
42

treatment. The differences disappeared after 17 months. One explanation for this phenomenon
was that the ClO2 demand of the system had been met after 17 months. In our study, the mean
ClO2 and ClO2- levels at different sampling locations were compared during the study. There
was no significant difference in mean ClO2 and ClO2- concentration in the hot water between
sampling locations that represented various distances from the ClO2 injection point in B1 and B2
(Figure 10a). There was also no significant difference in ClO2 and ClO2- levels with increasing
distance from the point of injection in the cold water in B1 and B2 (Figure 10b). The change of
ClO2 and ClO2- levels with time could be due to the mechanical modifications to the ClO2 feed
system and operational adjustments. Given that this study began six months after the installation
and operation of the ClO2 unit, the initial demand may have been met and system equilibrium
reached within the first six months of continuous treatment of ClO2.
A significant reduction of Legionella positivity in the hot water was achieved by ClO2
treatment. An extended time (18 months) was needed to achieve the significant reduction of
Legionella positivity due to low ClO2 residual in the hot water. ClO2 did not completely
eliminate Legionella in the hospital hot and cold water system when the target feed concentration
was 0.5-0.7 mg/L in the cold water. However, this and other studies have demonstrated that zero
positivity is not necessary to prevent hospital acquired Legionnaires’ disease 73.
Until the optimal operating parameters for ClO2 are delineated, we recommend 1) regular
environmental monitoring for Legionella must be performed, 2) all patients with hospital
acquired pneumonia must be screened for Legionnaires’ disease and treated empirically for
Legionnaires’ disease if the etiology is unknown, 3) other methods for Legionella control
(periodic heat flush procedures or point-of-use filters for high risk areas) should be instituted in
43

the first months of operation (possible 6 -12 months) or until a sustained low level of positivity
(<30%) can be consistently achieved.
4.1.2 Hospital B
4.1.2.1 Water quality parameters The water quality of the municipal water supply was
monitored in June 2004. The values of water quality parameters were as follow: hardness was
124 mg/L as calcium carbonate, alkalinity was 69 mg/L as calcium carbonate, pH was 8.57, total
iron was 0.04 mg/L, total manganese was 0.01 mg/L, TOC (total organic carbon) was 2.25 mg/L,
and turbidity was 0.38 NTU. The ClO2 demand of the drinking water was determined to be 0.20
mg/L at 23 °C and pH 7.8 using Method 2350C of the Standard Methods for the Examination of
Water and Wastewater.
4.1.2.2 Legonella positivity Mean percent positivity of distal outlets for Legionella was 60 %
before the ClO2 treatment (range from 35 to 88 %, n = 72). After the ClO2 treatment, mean
percent positivity of distal outlets for Legionella decreased from 60 % to 8 % (range from 0 to
24%, n = 165, p<0.05) (Figure 11). Legionella positivity in the hot and cold water was reduced
to 0% in 6 months and remained at 0% for three consecutive sampling events since August 2005
(Figure 11). Legionella positivity increased to 19% in June 2006 when the ClO2 generator
malfunctioned on the sampling date; the ClO2 residual in hot and cold was 0.09 and 0.29,
respectively, which were lower than the average values. No cases of healthcare-acquired
legionellosis have been identified in the post-disinfection period.
The mean concentration of Legionella in positive hot water samples decreased from 166
CFU/ml (range from 10 to 520 CFU/ml) to 43 CFU/ml (range from 10 to 100 CFU/ml). The
44

mean concentration of Legionella in positive cold water samples decreased from 20 CFU/ml
(range from 10 to 20 CFU/ml) to 0 CFU/ml. The decrease in mean concentration of Legionella in
positive samples was not significant, but the overall distal site positivity decreased significantly.
19%
0%0%
55%
0%
24%
50%
0%6%
63%
88%
67%
0%
12%19%
35%
82%
0%10%20%30%40%50%60%70%80%90%
100%
May-0
2
Aug-0
2
Feb-
03
July-
03
Aug-0
3
Jan-
04
Apr-04
Jun-
04
Aug-0
4
Oct-04
Dec-0
4
Feb-
05
Jun-
05
Aug-0
5
Nov-0
5
Feb-
06
Jun-
06
Time, (2002-2006)
Legi
onel
la p
ositi
vity
PERCENTAGEMEAN
Pre-ClO2 Post-ClO2
Figure 11. Mean percentage of distal outlets positive for Legionella was reduced
from 60 % to 8 % after the ClO2 treatment (t-test, p<0.05).
Legionella positivity in this hospital water system was reduced to 0% in a much shorter
period of time (6 -10 months). This observation was not the same as our previous study in
hospital A 1, 106. In hospital B, the mean ClO2 residual in hot water reached above 0.10 m/L in a
much shorter time. And mean ClO2 residual in hot water of this hospital was significantly higher
than hospital A (Table 2). Statistical analysis showed that the percentage of samples positive for
Legionella in the hot water samples decreased as ClO2 residual increased to ≥ 0.1 mg/L (Figure
12). The null hypothesis of Chi-square test was that possibility of success for treatment with
ClO2 residual less than 0.1 mg/L or greater than 0.1 mg/L was same. Since p value obtained by
Chi-square test was greater than 0.05, the null hypothesis was not rejected. The decease was not
significant (p>0.05) since the sample size of positive samples was small. It is hypothesized that
45

the less time it takes to reach to ≥0.10 mg/L ClO2 residual in hot water, the faster reduction of
Legionella positivity can be achieved.
p=0.08
4%
10%
0.00
0.02
0.04
0.06
0.08
0.10
0.12
ClO2<0.10 mg/L, N = 64 ClO2 >0.10 mg/L, N =100
Legi
onel
la P
erce
nt P
ositi
vity
ClO2 ≥ 0.10 mg/L, N=100 ClO2 ≤ 0.10 mg/L, N=64
Figure 12. Legionella percent positivity in the hot water decreased as ClO2 residual
increased to ≥ 0.1 mg/L (Chi-square, p>0.05)
It was also found that the incoming drinking water received from the city’s supply system
contained high levels of free chlorine (range from 0.75 to 1.02 mg/L) because the hospital was
very close to the water treatment plant (driving distance less than 5 miles). The mean chlorine in
the incoming water of hospital B was higher than hospital A (Table 2). It can be hypothesized
that the coincident reaction of two disinfectants (chlorine and ClO2) provided synergistic effects
for controlling Legionella in the water distribution system. It is also possible that the high levels
of free chlorine in the drinking water can meet some oxidant demand so that ClO2 injected in this
health care facility can be maintained at a stable residual concentration in both hot and cold
water systems. Katz et.al applied the equal dose of chlorine dioxide and chlorine to disinfect the
effluent from a municipal sewage treatment plant 97, 107. The results showed that the combination
46

of two disinfectants produced relatively stable high residual of both disinfectants, reduced the
concentration of the undesirable disinfection byproduct (i.e. chlorite ion), while increasing the
concentration of chlorine dioxide. Other studies showed that mechanically mixed oxidants
achieved considerable disinfection efficiency for selected microorganisms 97. And sequential
disinfection with chlorine dioxide followed by free chlorine is an effective approach used to treat
Cryptosporidium parvum 98. The synergistic effect of sequential treatment may be caused by the
unique activity of each disinfection agent reacting with specific chemical groups of the cell wall.
However, the level of the enhanced disinfection efficiency remains unclear. The synergistic
effects of ClO2 and chlorine for Legionella control will be investigated in a future study to
confirm these hypotheses.
Table 2. Study parameters of two hospitals using chlorine dioxide for Legionella
control
Parameter Hospital A Hospital B
Size 438 beds
2 buildings
672 beds
1 building
ClO2 injection point Cold water main Cold water main
Mean ClO2 in hot water (mg/L)
Mean ClO2 in cold water (mg/L)
Mean Cl2 in cold water (mg/L)
0.07
0.42
0.55
0.12 p<0.05
0.36 p>0.05
0.91 p<0.05
Months to achieve 0% Legionella
positivity
>24 months 6-10 months
47

4.1.2.3 HPC bacteria and Pseudomonas The efficacy of ClO2 for controlling HPC bacteria in
this hospital hot water system was also evaluated. The result in Figure 13 shows that the HPC
bacteria average concentration in the hot water was reduced from 15,427 CFU/ml to 2,927
CFU/ml (p<0.05) after ClO2 treatment.
0
2000
4000
6000
8000
10000
12000
14000
16000
18000
20000
22000
24000
26000
28000
05/20
02
08/20
02
02/20
03
07/20
03
09/20
03
01/20
04
04/20
04
06/20
04
08/20
04
09/20
04
12/20
04
02/20
05
06/20
05
02/20
06
06/20
06
Time
HPC
Ave
rage
, CFU
/ml
HPC Average, CFU/ml
ClO2 TreatmentStarted
Figure 13. HPC bacteria concentration in hot water samples decreased significantly
after ClO2 treatment (t-test, p<0.05).
Although most of the heterotrophic bacteria in drinking water are not human pathogens,
HPC bacteria in drinking water may include isolates from the genera that may be pathogenic for
immunocompromised patients in hospitals, such as Pseudomonas spp., and different fungi 108.
The efficacy of ClO2 for controlling HPC bacteria in this hospital was also evaluated to assess
the risk of infection from opportunistic pathogens. The HPC bacteria average concentration was
reduced from 15,427 CFU/ml to 2,927 CFU/ml after ClO2 treatment.
48

In September 2006, a new chlorine dioxide unit was installed in another building housing
Burn Units of hospital B. The Burn Units were heavily colonized by Pseudomonas aeruginosa.
After 5 months of chlorine dioxide treatment, Pseudomonas positive percentage decreased from
100% (5/5) to 20% (1/5). The concentration decreased from 84,000 to 973 CFU/ml. The HPC
bacteria average concentration was also reduced from 104, 031 to 1,600 CFU/ml in hot water,
from 5273 to 950 CFU/ml in cold water. These results show that ClO2 is an effective disinfectant
not only for controlling Legionella but also for other pathogenic bacteria in drinking water.
4.1.2.4 ClO2 and its disinfection by-products The mean ClO2 residuals in the hot and cold
water samples were 0.11 and 0.36 mg/L, respectively (Table 2.). The difference in mean ClO2
concentrations between the cold water distal outlets and hot water distal outlets was significant
(p<0.05). A total of 54 hot water samples and 36 cold water samples were analyzed for ClO2- and
ClO3-. The mean ClO2
- concentrations in cold and hot water were 0.42 and 0.38 mg/L,
respectively. The mean ClO3- concentrations in hot and cold water were less than 0.10 mg/L. The
ClO2- concentrations measured in this study were in agreement with those obtained by the
reference lab (NovaChem Laboratories Inc., Oxford, OH). The mean difference was 8 %
(p>0.05).
Figure 14 and Figure 15 present the mean ClO2 and ClO2- concentration at different
locations in the hot and cold water system. ANOVA analysis showed that there was no
significant difference of ClO2 and ClO2- levels between the different sampling locations that
represent various distance from the injection point in the hot water and cold water (p>0.05). F
statistics obtained by ANOVA ranged from 0.11 to 0.94, whose p-values were greater than 0.05.
The null hypothesis that mean chlorite and chlorine dioxide levels between different sampling
locations were same was not rejected.
49
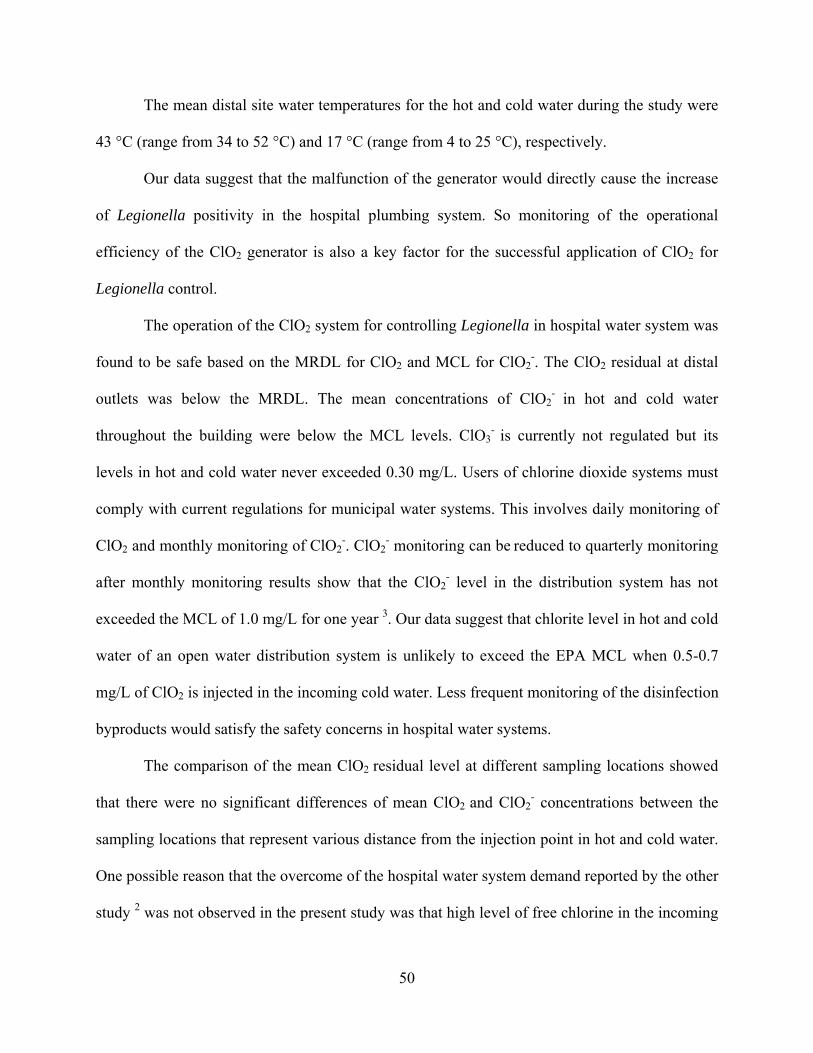
The mean distal site water temperatures for the hot and cold water during the study were
43 °C (range from 34 to 52 °C) and 17 °C (range from 4 to 25 °C), respectively.
Our data suggest that the malfunction of the generator would directly cause the increase
of Legionella positivity in the hospital plumbing system. So monitoring of the operational
efficiency of the ClO2 generator is also a key factor for the successful application of ClO2 for
Legionella control.
The operation of the ClO2 system for controlling Legionella in hospital water system was
found to be safe based on the MRDL for ClO2 and MCL for ClO2-. The ClO2 residual at distal
outlets was below the MRDL. The mean concentrations of ClO2- in hot and cold water
throughout the building were below the MCL levels. ClO3- is currently not regulated but its
levels in hot and cold water never exceeded 0.30 mg/L. Users of chlorine dioxide systems must
comply with current regulations for municipal water systems. This involves daily monitoring of
ClO2 and monthly monitoring of ClO2-. ClO2
- monitoring can be reduced to quarterly monitoring
after monthly monitoring results show that the ClO2- level in the distribution system has not
exceeded the MCL of 1.0 mg/L for one year 3. Our data suggest that chlorite level in hot and cold
water of an open water distribution system is unlikely to exceed the EPA MCL when 0.5-0.7
mg/L of ClO2 is injected in the incoming cold water. Less frequent monitoring of the disinfection
byproducts would satisfy the safety concerns in hospital water systems.
The comparison of the mean ClO2 residual level at different sampling locations showed
that there were no significant differences of mean ClO2 and ClO2- concentrations between the
sampling locations that represent various distance from the injection point in hot and cold water.
One possible reason that the overcome of the hospital water system demand reported by the other
study 2 was not observed in the present study was that high level of free chlorine in the incoming
50
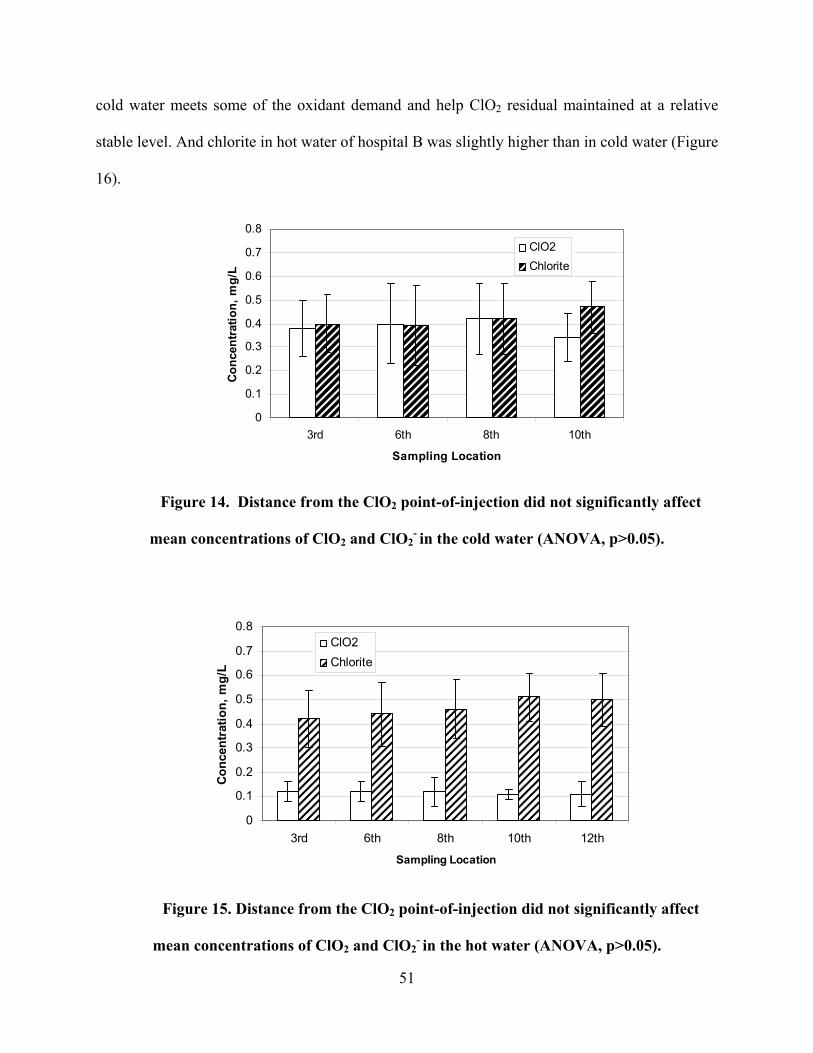
cold water meets some of the oxidant demand and help ClO2 residual maintained at a relative
stable level. And chlorite in hot water of hospital B was slightly higher than in cold water (Figure
16).
0
0.1
0.2
0.3
0.4
0.5
0.6
0.7
0.8
3rd 6th 8th 10th
Sampling Location
Conc
entra
tion,
mg/
LClO2Chlorite
Figure 14. Distance from the ClO2 point-of-injection did not significantly affect
mean concentrations of ClO2 and ClO2- in the cold water (ANOVA, p>0.05).
0
0.1
0.2
0.3
0.4
0.5
0.6
0.7
0.8
3rd 6th 8th 10th 12th
Sampling Location
Con
cent
ratio
n, m
g/L
ClO2Chlorite
Figure 15. Distance from the ClO2 point-of-injection did not significantly affect
mean concentrations of ClO2 and ClO2- in the hot water (ANOVA, p>0.05).
51

0
0.2
0.4
0.6
0.8
1
06/04 08/04 10/04 12/04 02/05 06/05 08/05 11/05 02/06
Time (2004 and 2006)
Conc
entr
atio
n (m
g/L)
EPA MCL for Chlorite
Chlorite in hot water
Chlorite in cold water
Figure 16. Mean chlorite level in the hot and cold water of the hospital B
4.1.2.5 Cost of Legionella control Legionella remediation efforts are not inexpensive. Cost
estimates have been reported to be in the range of $70,000 - $80,000 for continuous
hyperchlorination, and $60,000 - $100,000 for copper-silver ionization systems 57. One hospital
in Wales estimated the cost for engineering measures with chlorine dioxide at approximately
$50,000 per annum 104. The annual cost for operation and maintenance of two chlorine dioxide
units at this 438-bed New York hospital was approximately $16,800 per unit per year. This
amount did not include installation costs because the hospital leased the chlorine dioxide units.
Hospital personnel installed the required flowmeters, filters, injection points, and piping. The
annual cost for monitoring the chlorine dioxide residual and chlorite level in the hospital water
system ranged from $3,000 to $5,000, depending on the frequency of monitoring. The total
annual cost was approximately $39,000.
Legionella was successfully controlled by chlorine dioxide in these two hospitals. And
chlorine dioxide disinfection byproducts were below EPA limits. Specifically in this study, when
52
ClO2 was injected into the cold water main at 0.5-0.7 mg/L, mean concentrations of ClO2 and
chlorite (ClO2-) in cold and hot water samples did not exceed the EPA MRDL of 0.8 mg/L for
ClO2 and MCL of 1.0 mg/L for ClO2-, respectively. Distance from the point of ClO2 injection did
not significantly affect mean concentrations of ClO2 and ClO2- in both hot and cold water
systems. In addition to Legionella, ClO2 is also a promising disinfectant for controlling other
bacteria in drinking water.
4.2 THE EFFECT OF WATER QUALITY PARAMETERS (PH, TEMPERATURE
AND TOC ON CHLORINE DIOXIDE DECAY IN DRINKING WATER
4.2.1 Chlorine dioxide decay in DI water
Chlorine dioxide decay in deionized water was investigated at pH 7.5 and 8.5 and at temperature
of 25±2 °C and 45°C. The first order kinetics expression was fitted to experimental data and the
results are shown in Figure 7. The reaction rate constant (k) can be determined by fitting an
exponential curve to the data set according to equation:
C/C0 = e-kt
where,
C = concentration of chlorine dioxide at any time t
Co= initial concentration of chlorine dioxide at time t=0
k = reaction rate constant (/minute),
t = time (minutes)
53

The reaction rate did not change with pH, but temperature increased the reaction rate
constant from 0.0002 to 0.0004 min-1 (Figure 17). R2 ranged from 0.92 to 0.98. Chlorite and
chlorate analysis showed that chlorine dioxide was mainly converted to chlorite at 25°±2C
(Table 3). Chlorate concentration observed at 45°C was higher than at 25°±2C because higher
temperature increased the disproportionation rate of chlorine dioxide. The mass balance verified
that the floating cover (Figure 1) virtually eliminated the chlorine dioxide loss due to volatility
(Table 3). Therefore, the chlorine dioxide loss due to volatility was not considered in future
batch experiments.
Table 3. Mass balance on ClO2, chlorite, chlorate and chloride during ClO2 decay in
DI water after 6 hours (mg/L) (All concentrations are expressed as chlorine)
Test parameters ∆ClO2 ∆ ClO2- ∆ ClO3
- ∆ Cl- ClO2 loss due to
volatilizationb
26 ºC , pH7.5 0.07 0.04a 0.02 0.02 -0.01
45 ºC , pH7.5 0.13 0.06 0.04 0.01 0.02
27 ºC , pH8.5 0.06 0.04 0.01 0.01 0
45 ºC , pH8.5 0.12 0.06 0.05 0.01 0
a Cl mass = (atomic Cl mass /MWClO2)* ∆ClO2, MW-Molecular weight
b ClO2 loss due to volatilization = ∆ClO2 - ∆ ClO2- -∆ ClO3
- -∆ Cl-
54
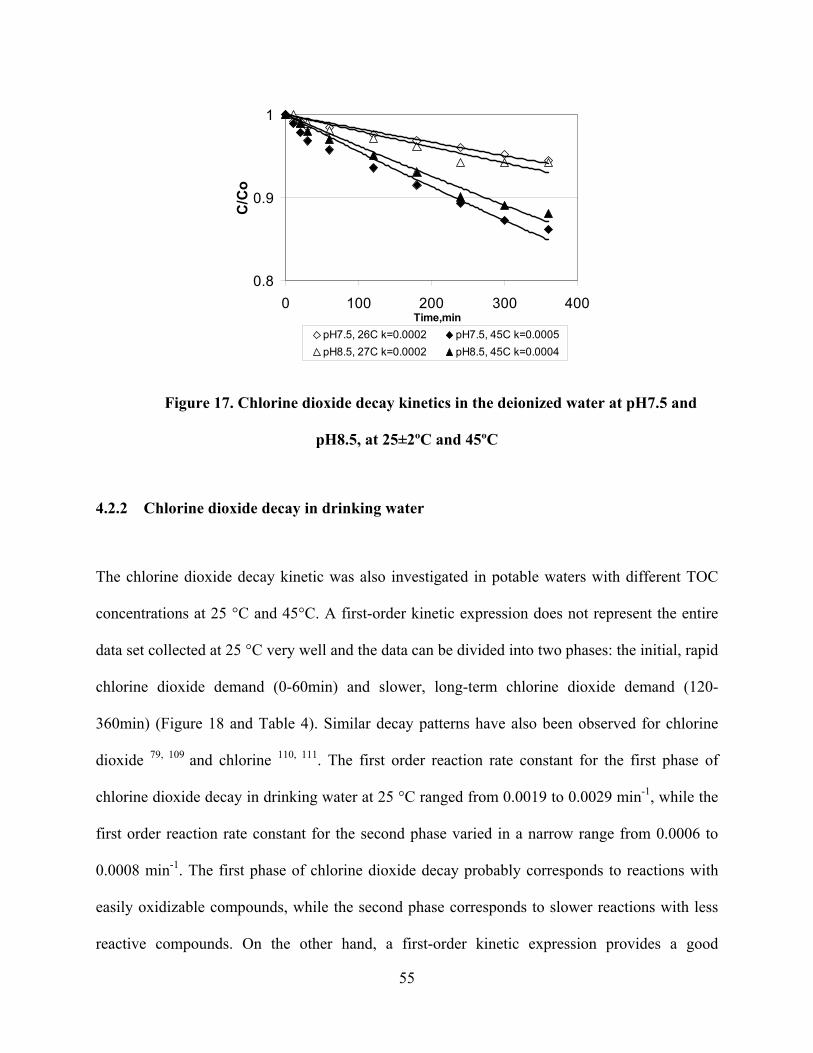
0.8
0.9
1
0 100 200 300 400Time,min
C/C
o
pH7.5, 26C k=0.0002 pH7.5, 45C k=0.0005pH8.5, 27C k=0.0002 pH8.5, 45C k=0.0004
Figure 17. Chlorine dioxide decay kinetics in the deionized water at pH7.5 and
pH8.5, at 25±2ºC and 45ºC
4.2.2 Chlorine dioxide decay in drinking water
The chlorine dioxide decay kinetic was also investigated in potable waters with different TOC
concentrations at 25 °C and 45°C. A first-order kinetic expression does not represent the entire
data set collected at 25 °C very well and the data can be divided into two phases: the initial, rapid
chlorine dioxide demand (0-60min) and slower, long-term chlorine dioxide demand (120-
360min) (Figure 18 and Table 4). Similar decay patterns have also been observed for chlorine
dioxide 79, 109 and chlorine 110, 111. The first order reaction rate constant for the first phase of
chlorine dioxide decay in drinking water at 25 °C ranged from 0.0019 to 0.0029 min-1, while the
first order reaction rate constant for the second phase varied in a narrow range from 0.0006 to
0.0008 min-1. The first phase of chlorine dioxide decay probably corresponds to reactions with
easily oxidizable compounds, while the second phase corresponds to slower reactions with less
reactive compounds. On the other hand, a first-order kinetic expression provides a good
55

prediction of the chlorine dioxide concentration over the entire reaction period at 45 °C (Figure
18). The estimated first order reaction rate constant for chlorine dioxide at 45 °C ranged from
0.0016 to 0.0044 min-1 (Table 4). Figure 19 reveals that the chlorine dioxide reaction rate
constant for the first phase at 25 °C increased with the increase in TOC, while the reaction rate
constant for second phase experienced no significant change. It could mean that the proportion of
easily oxidizable organic carbon increased with the increasing total organic carbon
concentration. With increasing the temperature, the first order reaction rate of chlorine dioxide in
drinking water was increased (Figure 19). And with increasing the total organic carbon
concentration, the chlorine dioxide decay rate increased at 45°C. Overall, Increase in TOC did
not have as pronounced impact on the chlorine dioxide decay rate at 25 °C. The higher organic
carbon concentration in hot water could be due to biomass carbon of higher thermophilic bacteria
concentration at higher temperature.
y = e-0.0016x
R2 = 0.9641
y = 0.9628e-0.0007x
R2 = 0.9885
y = e-0.002x
R2 = 0.8264
0.4
0.5
0.6
0.7
0.8
0.9
1
1.1
0 100 200 300 400
Time, min
C/C
o
1st phase at 25C 2nd phase at 25C 45C
Figure 18. The two-phase decay pattern of chlorine dioxide in drinking water at 25 °C
56

0
0.001
0.002
0.003
0.004
0.005
0 1 2 3 4 5TOC, mg/L
K, 1
/min
1st phase at 25C 2nd phase at 25C 45C
Figure 19. Impact of TOC on the first order reaction rate constant at 25 and 45 ºC
Table 4. Impact of temperature on first-order reaction rate constants for chlorine
dioxide consumption in different potable water sources
Temperature Cold Water A
TOC=1.8mg/L
Hot Water A
TOC=2.4 mg/L
Cold Water B
TOC=3.3 mg/L
Hot Water B
TOC=4.5 mg/L
1st
phase
K= 0.0019
R2=0.85
K= 0.0024
R2=0.9772
K= 0.0023
R2=0.9651
K= 0.0029
R2=0.9780
25 °C
2nd
phase
K= 0.0006
R2=0.9886
K= 0.0007
R2=0.9974
K= 0.0007
R2=0.9876
K= 0.0008
R2=0.9935
45 °C Whole
data
K= 0.0016
R2=0.97
K= 0.0035
R2=0.9647
K= 0.0039
R2=0.9644
K= 0.0044
R2=0.9751
34% -76% of chlorine dioxide consumed in potable water was converted to chlorite at
room temperature and 45°C (Table 5). Chlorate accounts for only 9-19% of chlorine dioxide
consumed. The mass balance for chlorine dioxide, chlorite and chlorate can not be set up
57

because chlorine dioxide is not always converted to chlorite at 1:1 ratio. For example, 25% of
chlorine dioxide was converted to chlorite for the reaction of chlorine dioxide with indene, 50%
for the reaction with phenol and 100% for the reaction with hydroquinone 14-16, 18. Other authors
reported that 70% percent of chlorine dioxide consumed in drinking water is typically converted
to chlorite 17, 90. Slight difference between the results of this study and literature values could be
due to the difference in organic and inorganic composition of portable water sources used for
experimental investigation.
The chloride concentrations were not shown in the Table 5 because they were outside the
calibration curve and the background chloride concentrations in the potable water sources were
too high to show any significant changes associated with chlorine dioxide decay.
Table 5. Change in chlorine dioxide and chlorite, chlorate concentrations in potable
water after 6 hours (mg/L)
Water Source Temperature (oC) ∆ClO2 ∆ ClO2- ∆ ClO3
- ∆ ClO2-/∆ ClO2
25 0.26 0.09 0.05 34% Cold Water A
TOC 1.8 mg/L 45 0.40 0.21 0.06 51%
25 0.33 0.22 0.05 66% Hot Water A
TOC 2.4 mg/L 45 0.70 0.54 0.05 76%
25 0.28 0.16 0.03 57% Cold Water B
TOC 3.3 mg/L 45 0.77 0.56 0.06 73%
25 0.34 0.24 0.03 72% Hot Water B
TOC 4.5 mg/L 45 0.81 0.47 0.07 58%
58

4.2.3 Reactions of chlorine dioxide with natural organic matter
Controlled experiments with Suwannee River Humic Acid (SRHA) showed that 1.0 mg/L of
chlorine dioxide was rapidly consumed in the presence of 1.0 or 2.0 mg/L of this humic
substance within 60 minutes. A first-order kinetic expression does not represent the entire data
set at 25 or 45 °C very well. Temperature accelerated the consumption of chlorine dioxide in the
presence of 1.0 and 0.5 mg/L of SRHA (Figure 20). The reaction of chlorine dioxide with SRHA
showed that 63-73% of chlorine dioxide consumed was converted to chlorite (Table 6). Other
authors have also reported that natural organic matter reacts with chlorine dioxide very fast in the
first few hours followed by a slow reaction 14, 92.
Aldrich humic acid (AHA) was used to investigate the impact of temperature on the
reaction mechanism of chlorine dioxide with representative organic matters. 1 g/L of AHA was
reacted with approximately 0.5 g/L of chlorine dioxide at room temperature and 45 °C and
samples were diluted 100 times for UV-VIS spectra measurement. UV-Vis spectra of Aldrich
humic acid is broad, featureless and monotonously decreases with increasing wavelength (Figure
21) 112. After 3 hours of reaction with chlorine dioxide at 45 °C, substantial decreases in specific
absorbance was observed (55% decrease in absorbance at 254 nm and 78% decrease in
absorbance at 465nm). It took much longer reaction time (more than 6 hrs) to achieve similar
decrease in absorbance at 25 °C (46% decrease in absorbance at 254 nm and 71% decrease in
absorbance at 465nm). The decrease of absorbance at 254nm and 465nm suggested that chlorine
dioxide radical attack proceeded mainly on the aromatic moieties and color forming moieties of
the molecule. And humic acid molecule was degraded by chlorine dioxide to less UV-Vis
absorbing compounds. The removal efficiencies of UV absorbing centers could be ascribed
relatively slower compared to color forming moieties. It is postulated that the reaction
59

mechanism between chlorine dioxide and humic acid was the same at different temperatures;
higher temperature only increased the reaction rate of chlorine dioxide and humic acid. UV-
Raman spectroscopy, C13NMR and GC-MS have also been used to identify the change of
functional groups or the organic products of Aldrich humic acid after the reaction with chlorine
dioxide at 25 and 45 °C. No meaningful results were obtained by these analytic methods, which
is most probably due to the low concentration of reaction products generated and the complexity
of humic acid molecules.
0
0.2
0.4
0.6
0.8
1
1.2
0 50 100 150 200
Time, minute
ClO
2, m
g/L
0.5 mg/L HS,25C 0.5 mg/L HS,45C 1.0 mg/L HS, 25C1.0mg/L HS,45C 2.0mg/L HS, 25C
Figure 20. The effect of temperature on chlorine dioxide reaction with humic
substance
Hoigné reported that chlorine dioxide is a highly selective oxidant with respect to specific
functional groups of organic compounds like phenolic group and tertiary amino groups 13.
Naturally occurring humic substance is a complex organic material containing a variety of
60

structures and functional groups, such as polyphenolic and carboxylic groups. These functional
groups exhibit different reactivity and reaction mechanisms with chlorine dioxide 17, 92.
Temperature increase may have caused sufficient increase in the total energy in the system to
overcome the activation energy for the reaction with additional functionalities, which lead to
greater consumption of chlorine dioxide at higher temperature. Since natural humic material is a
complex substance containing a variety of functional groups, there is no clear theoretical
explanation about such high chlorite yield 17, 90.
Another reason that chlorite residual only accounts for 70% of chlorine dioxide is that
chlorite is also an effective oxidizing agent that is converted to chloride at a much slower rate
than chlorine dioxide conversion to chlorite 113.
Table 6. Change in chlorine dioxide, chlorite, chlorate and chloride generated
during the chlorine dioxide reaction with SRHS substance (mg/L)
SRHS
Concentration (mg/L)
Temperature
(oC)
∆ClO2 ∆ ClO2- ∆ ClO3
- ∆ ClO2-/∆ ClO2
2.0 25 0.97 0.71 0.04 73%
25 0.90 0.63 0.05 70% 1.0
45 0.93 0.68 0.04 73%
25 0.48 0.30 0.03 63% 0.5
45 0.63 0.41 0.02 65%
61
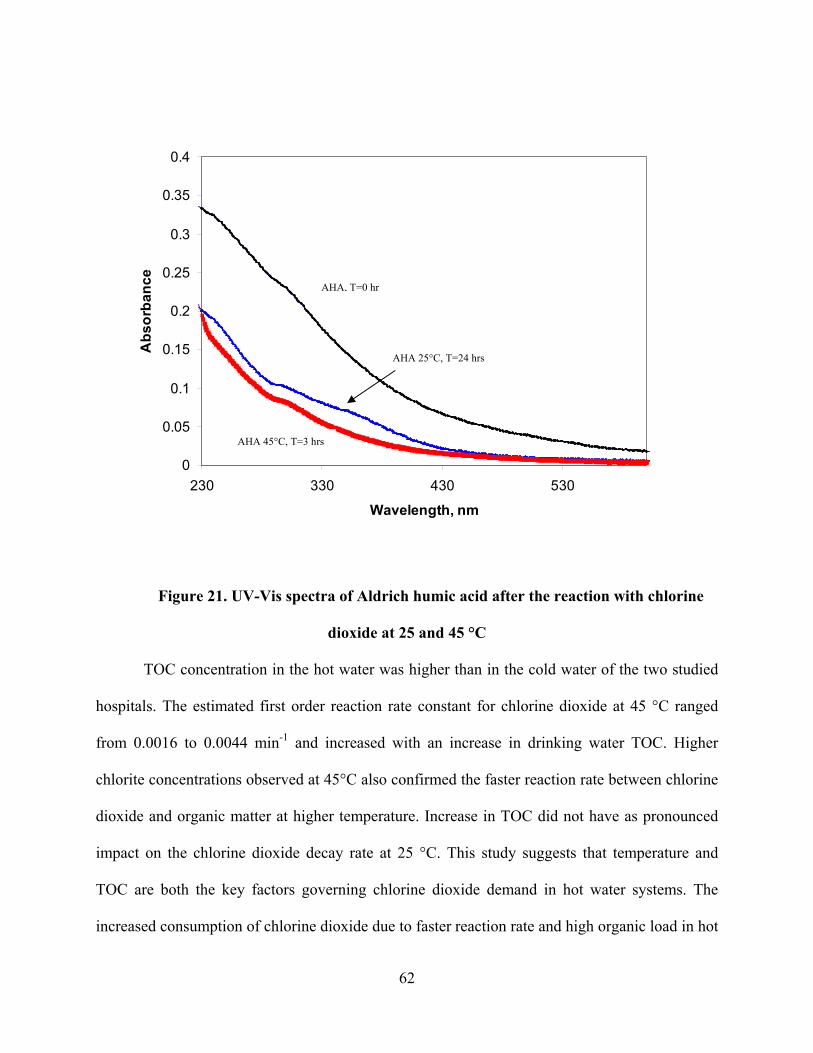
0
0.05
0.1
0.15
0.2
0.25
0.3
0.35
0.4
230 330 430 530
Wavelength, nm
Abs
orba
nce
AHA 25°C, T=24 hrs
AHA 45°C, T=3 hrs
AHA, T=0 hr
Figure 21. UV-Vis spectra of Aldrich humic acid after the reaction with chlorine
dioxide at 25 and 45 °C
TOC concentration in the hot water was higher than in the cold water of the two studied
hospitals. The estimated first order reaction rate constant for chlorine dioxide at 45 °C ranged
from 0.0016 to 0.0044 min-1 and increased with an increase in drinking water TOC. Higher
chlorite concentrations observed at 45°C also confirmed the faster reaction rate between chlorine
dioxide and organic matter at higher temperature. Increase in TOC did not have as pronounced
impact on the chlorine dioxide decay rate at 25 °C. This study suggests that temperature and
TOC are both the key factors governing chlorine dioxide demand in hot water systems. The
increased consumption of chlorine dioxide due to faster reaction rate and high organic load in hot
62
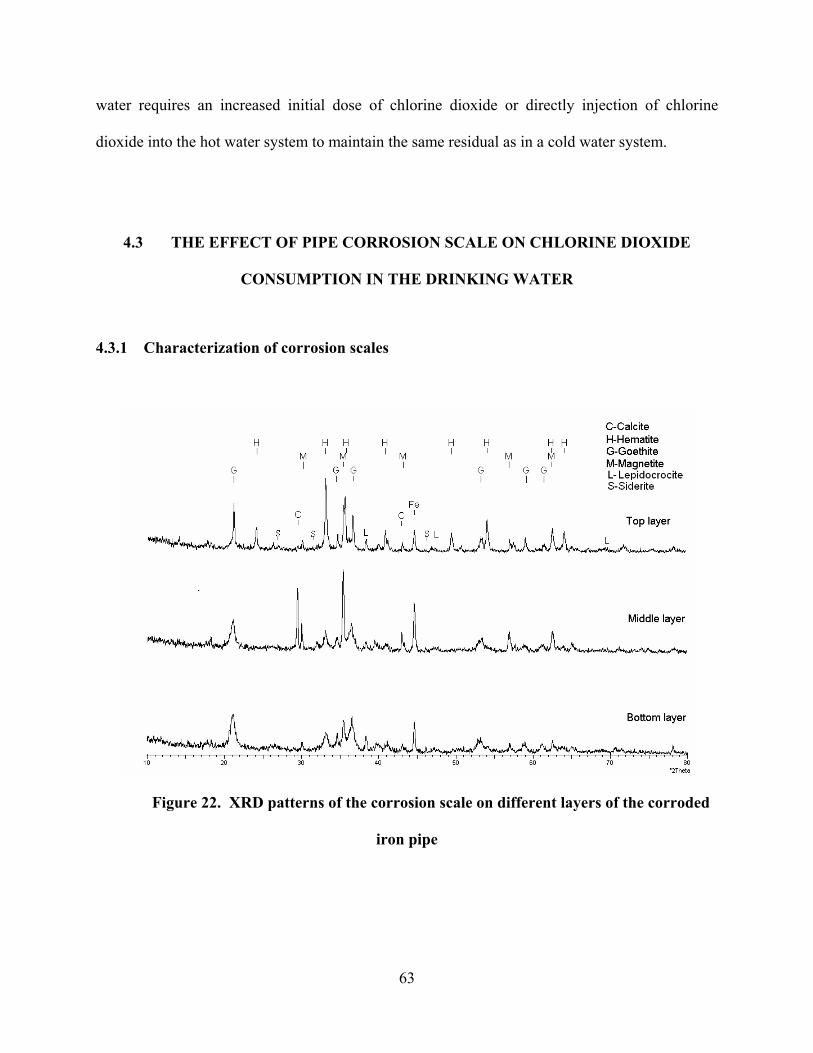
water requires an increased initial dose of chlorine dioxide or directly injection of chlorine
dioxide into the hot water system to maintain the same residual as in a cold water system.
4.3 THE EFFECT OF PIPE CORROSION SCALE ON CHLORINE DIOXIDE
CONSUMPTION IN THE DRINKING WATER
4.3.1 Characterization of corrosion scales
Figure 22. XRD patterns of the corrosion scale on different layers of the corroded
iron pipe
63

The EDS measurements on powder samples identified that iron was the major component
element of the scale. XPS analysis showed that iron was present at 28% (atomic percent), carbon
at 18% and oxygen at 48%. The top layer, middle layer and bottom layer scale samples of the
iron pipe corrosion scale were analyzed by XRD for the changes in compositions in Figure 22.
Goethite (α-FeOOH), magnetite (Fe3O4), hematite (α-Fe2O3), calcium carbonate and elemental
Fe were identified as the main components. All layers of the scales had a very similar set of
peaks, but a few differences were discernible. Comparison of the peak heights of hematite
suggests that hematite is mainly present in the top layer of the scale. Comparing the heights of
magnetite peaks and elemental Fe peaks, it can be inferred that the content of magnetite and
elemental Fe increased from the top layer to the middle layer. The scale structure proposed by
Sarin 85 also indicated that magnetite was the dominate component in the shell-like layer of iron
pipe corrosion scale. Based on the XRD results, it can be concluded that ferrous compounds are
mainly associated with magnetite. The lower peak intensity of the bottom samples indicated that
relative quantities of magnetite was small and goethite was the dominate component of the
bottom lay of the scale. Siderite was likely present in minor amount since siderite is not stable
when exposed to air. These results were similar to the results by other researchers 85, 86, 114, 115.
Since the composition of the iron scales depends on water quality, water flow patterns, seasonal
temperature fluctuation and other factors, the composition of the scales obtained from different
sources would be different. Green rust was not detected in the iron scale since green rust is not
stable and can further be oxidized in contact with air to a more stable phase like goethite or
magnetite.
64

Cu2O
Cu2O
Cu2O
Cu2O
Cu2O
CuO
CuO Cu
Figure 23. XRD patterns of the corrosion scale on the copper piper
The EDS measurements on powder samples of the copper pipe scale identified copper as
the major component element of the scales. XPS analysis confirmed that copper was present at
10% (atomic percent), carbon at 19% and oxygen at 55%. XRD results showed that the copper
corrosion scale primarily consisted of cuprite (Cu2O), copper oxide (CuO) and metallic copper
(Figure 23). And cuprite has been identified as a major corrosion product in drinking water
corrosion 116. The change of light brown cuprite film to light green malachite fibers by slow
oxidation process has been reported 116. But malachite was not found in the XRD examination of
green film samples this study. It is possible that the malachite concentration in the corrosion
scale was too low to be detected by XRD in this study (Figure 23).
65

4.3.2 Reactions of ClO2 with iron and copper corrosion scales
The results of ClO2 interaction with 1.0 g/L of corrosion scale from iron pipe at 25°C and 45°C
are shown in Figure 24.
y = e-0.025x
R2 = 0.9838
y = e-0.0273x
R2 = 0.9567
0
0.2
0.4
0.6
0.8
1
1.2
0 10 20 30 40 50
Time, minutes
C/C
o
25 C45 C
Figure 24. ClO2 decay in DI water due to reaction with 1.0 g/L of corrosion
materials from iron pipe at pH 7.5, 25 °C and 45 °C
Similar tests were conducted with 2.0 and 5.0 g/L of corrosion scales and the results are
summarized in Table 7. A first-order kinetic expression provides a good fit of ClO2 decay in DI
water containing 1.0 g/L, 2.0 g/L and 5.0 g/L of pipe corrosion scale over the entire time period
(Figure 22. and Table 7) at 25 °C and 45 °C. The first order reaction rate constant for ClO2
consumption ranged from 0.025-0.083 min-1. Temperature did not significantly affect the ClO2
reaction rate with iron scales since the reaction of ClO2 with reduced iron species is very fast.
66

Table 7. The mean first order rate constant for the reaction of ClO2 with the iron
corrosion scale, magnetite and cuprite
Scale concentration
(g/L)
Temperature
(°C)
Reaction Rate Constant
(min-1)
R2
25 0.0251 0.9783 1.0
45 0.0273 0.956
25 0.0368 0.9913 2.0
45 0.0408 0.977
25 0.0803 0.9746 5.0
45 0.0829 0.9712
25 0.070 0.9557 1.0 g/L of Fe3O4
45 0.076 0.9635
25 0.0052 0.9781 2.0 g/L of Cu2O
45 0.0062 0.9745
However, there was a clear relationship between the amount of corrosion scale present in
the reactor and the first order reaction rate constant. Fig. 7 shows that the rate constant increased
with increasing scale concentration in the reactor. Such behavior indicates that the availability of
corrosion scale in the batch reactor represents the rate limiting step. The reaction order with
respect to scale concentration was investigated using data collected at initial ClO2 concentration
of 1.0 mg/L and scale concentration of 1.0, 2.0, 5.0 and 10.0 g/L. The rate of ClO2 decay is
described by the pseudo first order expression:
67

[ ] [ ]22 ClOk
dtClOd =−
Where, k = k’[Scale]α. It is possible to identify the effect of scale concentration on the
reaction rate by linearizing the expression for k:
ln k = lnk’ + αln[Scale]
The reaction order with respect to scale concentration was determined by plotting lnk vs
ln[Scale] (Figure 25). The slope of 0.83-0.85 indicates that the reaction is not exactly the first
order in scale concentration. Based on these results with powder scale from iron pipe, it can be
concluded that the rate expression for ClO2 consumption due to the reaction with the scale has
the form:
[ ] [ ] [ ] 84.02
2 ' ScaleClOkdt
ClOd ∗=−
Where, k’ varies from 0.021 to 0.027 min-1 (g/L)-0.84
y = 0.8274x - 3.6941R2 = 0.9796
y = 0.8476x - 3.7906R2 = 0.9811
-4
-3.5
-3
-2.5
-2
-1.5
-1
-0.5
00 0.5 1 1.5 2 2.5
ln[Scale]
lnk
25 C45 C
Figure 25. Determination of the reaction order with respect to scale concentration at
25 and 45 ºC
68
The reaction of chlorine dioxide with iron scale follows the first order reaction kinetics
with respect to chlorine dioxide, but not exactly the first order reaction with respect to scale
concentration (Figure 25). Such findings imply a complex reaction mechanism, which is likely
due to heterogeneous reaction and the fact that the corrosion scale is a mixture of iron
compounds and heterogeneous reaction between chlorine dioxide and the corrosion scale.
Compared with the ClO2 decay rate constant (0.0011-0.0044 min-1) in drinking water due to
reaction with organic matter 102, the rate constants of the reaction of ClO2 with the iron pipe
corrosion scales ranged from 0.0251-0.0829 min-1, which was almost 20 times greater.
Therefore, the major loss of ClO2 would be caused by the corrosion scales in iron pipes in water
distribution systems where heavy corrosion occurred. The decay rate of free chlorine with iron
corrosion deposits was reported to range from 0.0027-0.034 h-1 in the batch reactor 117, which is
much smaller than the decay rate of chlorine dioxide observed in this study.
The chlorite analysis showed that nearly 100% of ClO2 was converted to chlorite (Table
8). It can be concluded that ClO2 reacts with corrosion scale by one-electron mechanism
whereby ClO2 oxidizes the ferrous compounds in the corrosion scale to ferric compounds.
69

Table 8. The mean mass change of ClO2 and chlorite during the ClO2 reaction with
the iron corrosion scale, magnetite and cuprite
Scale
concentration (g/L)
Temperature
(°C)
∆ClO2 ∆ClO2- ∆ClO2
-/∆
ClO2
25 0.66 0.63 95% 1.0
45 0.66 0.62 94%
25 0.76 0.72 95% 2.0
45 0.78 0.74 95%
25 0.93 0.75 81% 5.0
45 0.97 0.82 84%
25 0.86 0.74 86% 1.0 g/L of Fe3O4
45 0.91 0.81 90%
25 0.68 0.53 78% 2 .0g/L of Cu2O
45 0.76 0.65 86%
Magnetite and cuprite were identified as the major components of the corrosion scales on
the iron pipe and copper pipe, respectively. These compounds are the possible compounds that
will cause ClO2 loss because magnetite has one Fe(II) in each molecule and ClO2 can oxidize
Fe(II) to Fe(III). ClO2 can also oxidize cuprous compound to cupric compound. The reactions of
ClO2 with cuprite and magnetite were confirmed using commercial powder cuprite and
magnetite. The reaction rate between 1.0 g/L of commercial magnetite and chlorine dioxide was
very close to the chlorine dioxide decay rate in the iron pipe (Figure 26) and the reaction rate of
70

chlorine dioxide with 5 g/L of corrosion scale in a batch reactor (Table 7). The reaction rate
constant of ClO2 reaction with 1.0 g/L magnetite was 0.070 min-1 at 25ºC. The reaction rate
constant slightly increased to 0.076 min-1 as the temperature increased from 25 ºC to 45 ºC.
Therefore, the reactions between ClO2 and magnetite in the corrosion scales account for most of
the ClO2 loss in the iron pipes. Although Sarin et al 86 reported that soluble iron was released to
bulk water primarily in the ferrous form, the amount of soluble ferrous ion is typically very small
and can not account for the significant ClO2 loss observed in this study. Other studies showed
that free chlorine loss in the distribution system is also dominated by the reactions with corrosion
scale or materials deposited on the surface of the pipe 117. Since corrosion scale on the copper
pipe was limited and cuprite was identified as the main component of copper corrosion scale, 2.0
g/L of commercial cuprite was used to study reactions between chlorine dioxide and copper
corrosion scale. The results in Table 3 show that the reactions of ClO2 with cuprite followed the
pseudo first order kinetic expression. The reaction rate of chlorine dioxide with cuprite ranged
from 0.005-0.006 min-1, which is very close to the chlorine dioxide decay rate in the copper pipe
(Figure 24). The reaction rate constant slightly increased to 0.0062 min-1 as the temperature
increased from 25 ºC to 45 ºC. This confirmed the chlorine dioxide loss in copper pipe was
primarily caused by the reaction of chlorine dioxide with cuprite. Although ClO2 loss caused by
copper pipe scale was much slower in the copper pipe than in iron pipe, it may be still necessary
to prevent the corrosion and unnecessary loss of disinfectant due to the corrosion scale in the
copper pipe distribution system to maintain an effective disinfectant residual.
78%-96% of ClO2 consumed by the iron corrosion scales, cuprite and magnetite was
converted to chlorite (Table 8.), which suggests that ClO2 reacts with these solids by one-
electron mechanism and oxidizes the ferrous and cuprous ions to ferric and cupric ions,
71

respectively. Since chlorite is also a weak oxidant, chlorite can be further reduced to other
chlorine species with excess ferrous ions 84, 118, 119, which may explain why the recovery of
chlorite decreased as the concentration of corrosion scales increased.
4.3.3 ClO2 consumption in the pipe reactors
y = e-0.005x
R2 = 0.9689
y = e-0.077x
R2 = 0.96610
0.2
0.4
0.6
0.8
1
1.2
0 10 20 30 40
Retention time, min
C/C
o
Copper pipe Iron Pipe
Figure 26. ClO2 residual at each sampling port after the steady state was achieved
The results of the tests with an iron pipe reactor and a copper pipe reactor (Figure 2) are
presented in Figure 26. During the first two hours of the test in the iron pipe, there was no
measurable ClO2 at any of the three sampling ports, which means that ClO2 was completely
consumed in the first 10 inches of the pipe. After approximately 6 hours, the mean ClO2 residual
at sampling ports 1, 2 and 3 was stable. Using the first order kinetic expression to fit all the data
points, the mean reaction rate constant of 0.077 min-1 (R2 = 0.9661) was obtained. It is clear that
the reaction between ClO2 and scale was not limited by the concentration of the scale in the pipe
72

reactor. Similar reaction rate constant was obtained in the batch reactor with iron scale
concentration of 5.0 g/L. The decay rate of free chlorine due to reactions with the pipe wall
reaction ranged from 0.07-0.26 h-1 88, 89, which is much smaller than that of chlorine dioxide in
this study. Such behavior is to be expected since chlorine dioxide is a free radical and very
reactive to ferrous compounds 120. The corrosion condition of the pipe and pipe material are also
related to the decay rate of free chlorine and chlorine dioxide due to the wall reaction.
ClO2 consumption was much slower in the copper pipe than in the iron pipe. After
approximately 6 hours, the mean ClO2 residual at sampling ports 1, 2, 3 was stable. Using first
order kinetic expression to fit all the data points, the reaction rate constant of 0.005 min-1 (R2 =
0.9689 ) was obtained. Similar reaction rate constant was obtained in the batch reactor with 2.0
g/L of cuprite.
Based on these results, it can be concluded that corrosion scales will cause much more
significant ClO2 loss in corroded iron pipes of the distribution system than the total organic
carbon that may be present in finished water.
73

4.4 THE SYNEGISTIC EFFECT OF CHLROINE DIOXIDE AND FREE CHLORINE
FOR LEGIONELLA CONTROL IN A MODEL PLUMBING SYSTEM
4.4.1 Comparison of free chlorine and chlorine dioxide for Legionella and HPC
inactivation
Figure 27 and 28 depict the efficacy of chlorine, chlorine dioxide and the combination of
chlorine and chlorine dioxide against Legionella and heterotrophic bacteria in both biofilm and
planktonic phases. The duplicate experiments had similar results (Appendix, Figures 31-34).
1.0E-04
1.0E-03
1.0E-02
1.0E-01
1.0E+00
1.0E+01
0 1 3 6 24 48
Time, hour
Surv
ival
Rat
io
0.2 mg/L ClO2 0.2mg/L ClO2 and 0.5 mg/L Cl2 0.5 mg/L Cl2 Control
1.0E-04
1.0E-03
1.0E-02
1.0E-01
1.0E+00
1.0E+01
0 1 3 6 24 48
Time, hour
Surv
ival
Rat
io
0.2 mg/L ClO2 0.2mg/L ClO2 and 0.5 mg/L Cl2 0.5 mg/L Cl2 Control
a). Planktonic phase b). Biofilm phase
Figure 27. Inactivation of planktonic and biofilm associated Legionella in a model
plumbing system by residual maintenance of 0.2 mg/L of chlorine dioxide, 0.5 mg/L free
chlorine and 0.2 mg/L of chlorine dioxide with 0.5 mg/L free chlorine at 26 °C and pH 7.0
74

1.E-07
1.E-06
1.E-05
1.E-04
1.E-03
1.E-02
1.E-01
1.E+00
1.E+01
0 1 3 6 24 48Time, hour
Surv
ival
Rat
io
0.2 mg/L ClO2 0.2mg/L ClO2 and 0.5 mg/L Cl2 0.5 mg/L Cl2 Control
1.0E-06
1.0E-05
1.0E-04
1.0E-03
1.0E-02
1.0E-01
1.0E+00
1.0E+01
0 1 3 6 24 48
Time, hour
Surv
ival
Rat
io
0.2 mg/L ClO2 0.2mg/L ClO2 and 0.5 mg/L Cl2 0.5 mg/L Cl2 Control
a). Planktonic phase b). Biofilm phase
Figure 28. Inactivation of planktonic and biofilm associated HPC bacteriain a model
plumbing system by residual maintenance of 0.2 mg/L of chlorine dioxide, 0.5 mg/L free
chlorine and 0.2 mg/L of chlorine dioxide with 0.5 mg/L free chlorine at 26 °C and pH 7.0
More than 99.9 % of biofilm associated and planktonic Legionella were inactivated in 3
hours by maintaining 0.5 mg/L of free chlorine residual and combined residuals of 0.2 mg/L of
chlorine dioxide and 0.5 mg/L of free chlorine (Figure 27). Only 98% of biofilm associated and
planktonic Legionella were inactivated in 48 hours by 0.2 mg/L of chlorine dioxide residual
maintenance. Free chlorine was shown to be more effective in eradicating Legionella in both
planktonic and biofilm phases at the conditions used in this study. Although this result is
consistent with the previous study 54, the result still demonstrated the discrepancy between the
laboratory study and the field study since the efficacy of free chlorine is significantly impacted
by pH, TOC and other water quality parameters of drinking water in the distribution systems 54.
75

Figure 28 shows the efficacy of chlorine and/or chlorine dioxide against heterotrophic
bacteria. More than 99.9% of biofilm associated and planktonic HPC bacteria were inactivated
in 6 hours by maintaining 0.5 mg/L of free chlorine residual and combined residuals of 0.2 mg/L
of chlorine dioxide and 0.5 mg/L of free chlorine. It took 48 hours for 0.2 mg/L of chlorine
dioxide residual to inactivate 99.9% of biofilm associated and planktonic HPC bacteria in the
model plumbing system.
Since free chlorine itself demonstrated high efficacy for inactivation of biofilm associated
and planktonic Legionella and HPC bacteria in the model plumbing system, the synergistic effect
of combined disinfectant residuals of chlorine and chlorine dioxide could not be determined in
this study. However, the results clearly support the hypothesis that high level of free chlorine in
the drinking water improves the efficacy of chlorine dioxide for Legionella control in hospital
water systems.
76

4.4.2 Impact of temperature on chlorine dioxide inactivation of Leigonella and HPC
bacteria
1.0E-06
1.0E-05
1.0E-04
1.0E-03
1.0E-02
1.0E-01
1.0E+00
1.0E+01
0 1 3 6 24 48Time, hour
Surv
ival
Rat
io
Planktonic Leigonella at 27CPlanktonic Legionella at 40CPlanktonic HPC at 27 CPlanktonic HPC at 40 C
1.E-04
1.E-03
1.E-02
1.E-01
1.E+00
1.E+01
0 1 3 6 24 48Time, hour
Surv
ival
Rat
io
Biofilm Leigonella at 27 C
Biofilm Legionella at 40 C
Biofilm HPC at 27C
Biofilm HPC at 40C
Figure 29. Temperature improved the efficacy of 0.2 mg/L chlorine dioxide residual
inactivation of Legionella and HPC bacteria at pH 7.0 in both biofilm and planktonic
phases
Figure 29 shows the impact of temperature on 0.2 mg/L chlorine dioxide residual inactivation of
Legionella and HPC bacteria in both biofilm and planktonic phases. As the temperature
increased from 27 to 40 °C, more than 99.9% of Legionella and HPC bacteria were inactivated in
6 hours by maintaining 0.2 mg/L of chlorine dioxide residual in both biofim and planktonic
phases. The efficacy of chlorine dioxide inactivation of C.parvum oocyst has been demonstrated
to be affected by water temperature 34. For every 10 °C temperature increase, the reaction
constant increased by a factor of 2.3.
77

1.E-07
1.E-06
1.E-05
1.E-04
1.E-03
1.E-02
1.E-01
1.E+00
1.E+01
0 1 3 6 24 48Time, hour
Surv
ival
Rat
io
Planktonic Leigonella at 27CPlanktonic Legionella at 40CPlanktonic HPC at 27 CPlanktonic HPC at 40 C
1.E-05
1.E-04
1.E-03
1.E-02
1.E-01
1.E+00
1.E+01
0 1 3 6 24 48Time, hour
Surv
ival
Rat
io
Biofilm Leigonella at 27 CBiofilm Legionella at 40CBiofilm HPC at 27CBiofilm HPC at 40C
Figure 30. Temperature did not impact the efficacy of combined disinfectant
residuals of 0.2 mg/L chlorine dioxide and 0.5 mg/L chlorine inactivation of Legionella and
HPC bacteria at pH 7.0 in both biofilm and planktonic phases
Since more than 99.9% of Legionella and HPC bacteria were inactivated in 3 hours by
combined disinfectant residuals of 0.2 mg/L chlorine dioxide and 0.5 mg/L chlorine at 27 °C, the
efficacy of combined disinfectant residuals was not significantly improved as the temperature
increased to 40 °C (Figure 30).
To maintain the same level of chlorine dioxide residual in the hot water in the model
plumbing system, more chlorine dioxide stock solution (approximately 1.5×) needed to be
injected. The reasons could be chlorine dioxide gassing off at higher temperature since the model
plumbing system is not a completely closed system. High temperature also increased the reaction
rate of chlorine dioxide with organic load in the system. It is important to monitor the level of the
disinfection byproduct of chlorine dioxide if chlorine dioxide will be injected directly into the
hot water system in future to improve its efficacy.
78

5.0 SUMMARY AND CONCLUSIONS
A significant reduction in Legionella colonization in two hospital water systems was achieved
using ClO2. Further cases of health-care-associated Legionellosis have not been identified in the
studied hospitals after the ClO2 treatment.
When ClO2 was injected into the cold water main at 0.5-0.7 mg/L, the mean
concentrations of ClO2 and chlorite (ClO2-) in cold and hot water samples did not exceed the
Environmental Protection Agency maximum residual disinfectant level (EPA MRDL) of 0.8
mg/L and maximum contaminant level (MCL) of 1.0 mg/L, respectively. Distance from the ClO2
point-of-injection did not significantly affect mean concentrations of ClO2 and ClO2- in the
hospital hot and cold water systems. ClO2 application was safe based on the EPA MRDL for
ClO2 and MCL for ClO2-.
ClO2 is a promising disinfectant for controlling not only Legionella but also other
bacteria in drinking water. Successful application of this new technology requires prospective
environmental monitoring and cooperation between infection control, facilities engineers and the
water treatment specialist.
TOC concentration in the hot water was higher than in the cold water of the distribution
system in two studied hospitals. The chlorine dioxide decay rate at 45 °C increased with an
increase of the total organic carbon concentration. Increase in TOC did not have as pronounced
79

impact on the chlorine dioxide decay rate at 25 °C. This study suggests that the temperature and
TOC are both the key factors governing chlorine dioxide demand in hot water systems.
Goethite (α-FeOOH) and magnetite (Fe3O4) were identified as the main component
phases of iron corrosion scale. Cuprite (Cu2O) was identified as the major component of copper
corrosion scale. The estimated first order reaction rate constants for ClO2 reaction with iron
corrosion scales and magnetite ranged from 0.0251-0.0829 min-1. The estimated first order
reaction rate constants for ClO2 reaction with cuprite were much smaller, ranging from 0.0052-
0.0062 min-1. Cuprite and magnetite were the main compounds in the scales that caused ClO2
loss in this study. The loss of ClO2 in the corroded iron pipe was dominated by reactions between
ClO2 and these ferrous compounds in the iron pipe corrosion scales. Additionally, chlorine
dioxide oxidizes iron corrosion scale, magnetite and cuprite by one electron transfer. The
application of ClO2 in water distribution systems using cast iron pipe will not be recommended
unless measures to prevent corrosion are taken.
Temperature improved the efficacy of chlorine dioxide inactivation of Legionella and
HPC bacteria in both planktonic and biofilm phases in the model plumbing system. So it is
feasible to evaluate the direct injection of chlorine dioxide into the hot water system to improve
the efficacy of chlorine dioxide for Leigonella control in hospital water systems.
80

6.0 ENGINEERING SIGNIFICANCE OF THE STUDY
This study included a field evaluation of chlorine dioxide efficacy for Legionella control in
hospital water systems and investigation of the effects of water quality parameters and pipe
conditions on chlorine dioxide efficacy in the batch study. Although chlorine dioxide has been
very effective for controlling Legionella in laboratory studies, there are many other factors in the
hospital water system that could deteriorate its efficiency in filed applications. Field studies have
already shown that the efficiency of chlorine dioxide in the hot water system of hospitals was not
as good as expected. The study of the impact of temperature, TOC and pipe corrosion on the
decay of chlorine dioxide help to understand the behavior of chlorine dioxide under realistic
process conditions. The study reveals that the most important factors that govern chlorine
dioxide efficiency is corrosion scale at the conditions used in this study. Based on the results of
this study, engineers can decide that removal of TOC, addition of corrosion inhibitors or
temperature adjustment may be needed to ensure successful use of chlorine dioxide in a given
hospital.
Currently, chlorine dioxide is usually injected into the incoming cold water main. The
mean chlorine dioxide residual at the hot water tank outlet is typically bellowing 0.2 mg/L even
if 0.5- 0.7 mg/L of chlorine dioxide is injected into the incoming cold water. Changing the
chlorine dioxide injection point to outlet pipe of the hot water tank might shorten the time needed
to reach a measurable chlorine dioxide residual at the distal outlets of the hot water system and
81
facilitate faster eradication of Legionella from the hot water system. Using the maximum
chlorine dioxide decay rate constant due to reaction with TOC measured in this study (i.e., k =
0.0044 min-1) and assuming a 6 hour detention time from the injection point to the farthest distal
outlet, the chlorine dioxide residual at the distal outlet can reach 0.16 mg/L when 0.8 mg/L of
chlorine dioxide is injected after the hot water tank. Therefore, separating chlorine dioxide
injection point between the cold water and hot water systems might shorten the time that is
needed to reach a measurable chlorine dioxide residual at distal outlets of the hot water system
and improve the efficacy of chlorine dioxide for Legionella control in hot water systems.
Advantage of combining free chlorine and chlorine dioxide is that chlorine is still used as
primary disinfectant in most water treatment plants. Therefore, chlorine can satisfy some
oxidant demand in the institutional distribution system and facilitate maintenance of a stable
chlorine dioxide residual concentration in both the hot and cold water systems. In addition, the
reaction between chlorine and chlorite may reduce chlorine dioxide disinfection byproducts in
the water system. The presence of two different disinfectants in the distribution system may help
prevent the development of bacterial resistance to disinfection that has been observed when
chlorine was used as the only disinfectant.
Our data demonstrated that a malfunction of the generator would directly cause the
increase of Legionella positivity in the hospital plumbing system. Therefore, monitoring of the
operational efficiency of the ClO2 generator is also a key factor in the successful application of
ClO2 for Legionella control.
82
7.0 RECOMMENDATIONS FOR FUTURE WORK
This study demonstrated that temperature improves the efficacy of chlorine dioxide inactivation
of Legionella and HPC bacteria in both planktonic and biofilm phases in a model plumbing
system. Maintaining a sufficient chlorine dioxide residual in the hot water system would be a key
factor to control Legionella in hospital water systems. Evaluating the direct injection of chlorine
dioxide into the hot water system to improve the efficacy of chlorine dioxide for Leigonella
control in hospital water system should be our next step.
Proper model system control is critical to the quality of the experimental data. To be able
to perform experiments with more water quality parameters, a new model plumbing system with
better design and control needs to be developed. A new model plumbing system should have a
recirculation line to simulate the recirculation situation in hospital hot water systems. Automatic
control valves should be installed in the inlet and outlet of the model system to simulate the
usage of the water so that continuous water flow can be maintained in the model plumbing
system. Automated devices for controlling and monitoring pH and temperature, automated
injection system also should be considered. The new model should be designed to allow testing
of different pipe materials, such as copper, iron and PVC pipes. A sampling device or loop for
biofilm sampling should be considered in the new model because manually disconnecting the
loop and taking biofilm samples from the pipe surface often causes plumbing leakage and errors.
83

The impact of pipe corrosion scale on chlorine dioxide decay in drinking water was
investigated in this study. Based on the results, a corrosion inhibitor is recommended for the
water distribution system where heavy corrosion occurred. But only one study showed that
phosphate had little impact on disinfectant reaction with iron corrosion scale 117. Further
research of the impact on phosphate on chlorine dioxide reaction with copper corrosion scale is
required since most pipes in the hospital water system are copper.
Our preliminary data showed that chlorine dioxide is also effective for controlling
Pseudomonas in hospital water systems. Further study is required to confirm this result in the
field.
84

APPENDIX
ADDITION TABLES AND FIGURES
Table 9 .Chlorine dioxide and its byproducts in cold and hot water samples from
hospital A
Chlorine dioxide, mg/L
Chlorite, mg/L
Chlorate, mg/L
Sample Month
Hot water, n=27
Cold water, n=20
Hot water
Cold water
Hot water
Cold Water
08/03 0.04 0.41 0.33 0.2 <0.10* <0.10 10/03 0.05 0.23 0.14 0.11 <0.10 <0.10 12/03 0.04 0.35 0.24 0.10 <0.10 <0.10 02/04 0.04 0.45 0.27 0.17 <0.10 <0.10 04/04 0.06 0.37 0.21 0.13 <0.10 <0.10 06/04 0.06 0.33 0.46 0.26 <0.10 <0.10 08/04 0.06 0.60 0.58 0.42 0.13 0.13 10/04 0.08 0.38 0.49 0.36 <0.10 <0.10 12/04 0.1 0.51 0.56 0.46 <0.10 <0.10 02/05 0.07 0.36 0.28 0.2 <0.10 <0.10 04/05 0.08 0.44 0.58 0.41 0.10 <0.10 06/05 0.07 0.48 0.61 0.35 <0.10 <0.10 02/06 0.11 0.51 0.72 0.52 <0.10 <0.10 Mean 0.07 0.42 0.42 0.28 <0.10 <0.10 *0.10 mg/L was the lowest calibration point for chlorite and chlorate analysis
85
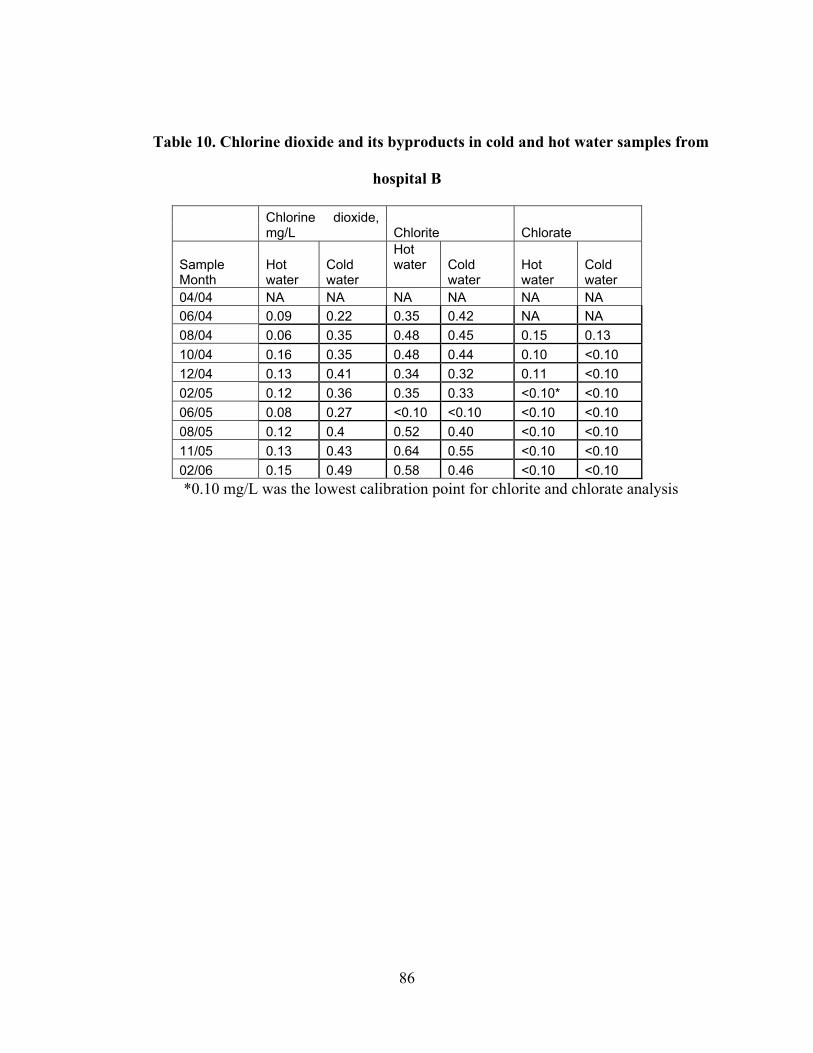
86
Table 10. Chlorine dioxide and its byproducts in cold and hot water samples from
hospital B
Chlorine dioxide, mg/L Chlorite Chlorate
Sample Month
Hot water
Cold water
Hot water Cold
water Hot water
Cold water
04/04 NA NA NA NA NA NA 06/04 0.09 0.22 0.35 0.42 NA NA 08/04 0.06 0.35 0.48 0.45 0.15 0.13 10/04 0.16 0.35 0.48 0.44 0.10 <0.10 12/04 0.13 0.41 0.34 0.32 0.11 <0.10 02/05 0.12 0.36 0.35 0.33 <0.10* <0.10 06/05 0.08 0.27 <0.10 <0.10 <0.10 <0.10 08/05 0.12 0.4 0.52 0.40 <0.10 <0.10 11/05 0.13 0.43 0.64 0.55 <0.10 <0.10 02/06 0.15 0.49 0.58 0.46 <0.10 <0.10
*0.10 mg/L was the lowest calibration point for chlorite and chlorate analysis
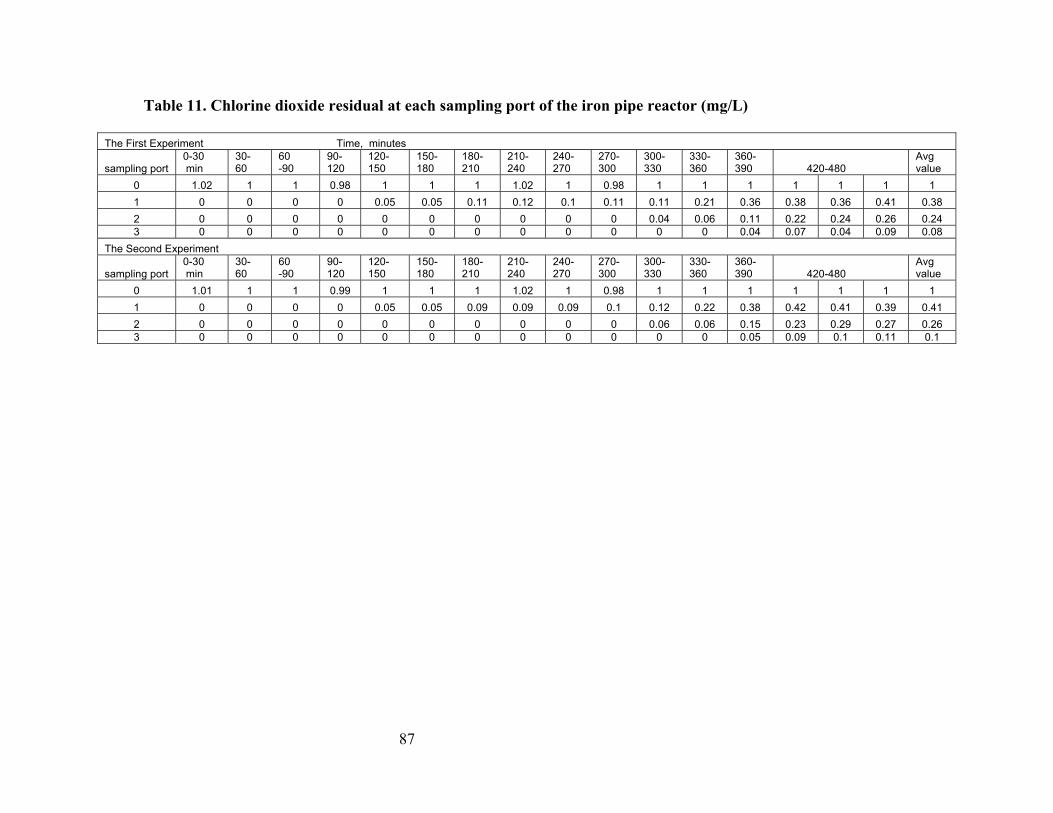
Table 11. Chlorine dioxide residual at each sampling port of the iron pipe reactor (mg/L)
The First Experiment Time, minutes
sampling port 0-30 min
30- 60
60 -90
90- 120
120- 150
150- 180
180- 210
210- 240
240- 270
270- 300
300- 330
330- 360
360- 390 420-480
Avg value
0 1.02 1 1 0.98 1 1 1 1.02 1 0.98 1 1 1 1 1 1 1 1 0 0 0 0 0.05 0.05 0.11 0.12 0.1 0.11 0.11 0.21 0.36 0.38 0.36 0.41 0.38 2 0 0 0 0 0 0 0 0 0 0 0.04 0.06 0.11 0.22 0.24 0.26 0.24 3 0 0 0 0 0 0 0 0 0 0 0 0 0.04 0.07 0.04 0.09 0.08
The Second Experiment
sampling port 0-30 min
30- 60
60 -90
90- 120
120- 150
150- 180
180- 210
210- 240
240- 270
270- 300
300- 330
330- 360
360- 390 420-480
Avg value
0 1.01 1 1 0.99 1 1 1 1.02 1 0.98 1 1 1 1 1 1 1 1 0 0 0 0 0.05 0.05 0.09 0.09 0.09 0.1 0.12 0.22 0.38 0.42 0.41 0.39 0.41 2 0 0 0 0 0 0 0 0 0 0 0.06 0.06 0.15 0.23 0.29 0.27 0.26 3 0 0 0 0 0 0 0 0 0 0 0 0 0.05 0.09 0.1 0.11 0.1
87

Table 12. Chlorine dioxide residual at each sampling port of the copper pipe reactor (mg/L)
The First Experiment Time, minutes
sampling port 0-30 min
30- 60
60 -90
90- 120
120- 150
150- 180
180- 210
210- 240
240- 270
270- 300
300- 330
330- 360
360- 390 420-480
Avg value
0 1.02 1.02 1 1 1 1 1 1 1 1.01 1.01 1 1.01 1.05 1.05 1.05 1.05
1 0.96 0.98 0.85 0.9 0.96 0.96 0.96 0.85 0.94 0.95 0.95 0.96 0.96 0.99 0.99 0.99 0.99
2 0.9 0.94 0.83 0.81 0.9 0.9 0.91 0.91 0.9 0.91 0.91 0.92 0.91 0.97 0.97 0.97 0.97 3 0.88 0.92 0.72 0.75 0.85 0.84 0.87 0.86 0.83 0.84 0.85 0.85 0.83 0.9 0.9 0.9 0.9
The Second Experiment
sampling port 0-30 min
30- 60
60 -90
90- 120
120- 150
150- 180
180- 210
210- 240
240- 270
270- 300
300- 330
330- 360
360- 390 420-480
Avg value
0 1.02 1.02 1 1 1 1 1 1 1 1.01 1.01 1 1.01 1 1 1 1.02
1 0.96 0.98 0.85 0.9 0.96 0.96 0.96 0.85 0.94 0.95 0.95 0.96 0.96 0.96 0.96 0.96 0.96
2 0.9 0.94 0.83 0.81 0.9 0.9 0.91 0.91 0.9 0.91 0.91 0.92 0.91 0.92 0.92 0.92 0.92 3 0.88 0.92 0.72 0.75 0.85 0.84 0.87 0.86 0.83 0.84 0.85 0.85 0.83 0.85 0.84 0.84 0.84
88

Table 13. Results of 48-hr disinfection on chlorine dioxide and chlorine against Legionella and HPC bacteria at pH 7.0
in a model plumbing system
Control 0.2 mg/LClO2 at 27 °C 0.2mg/L ClO2 and 0.5 mg/L Cl2 at 27 °C
Sample Type Time (hour) CFU1/ml log CFU/ml Kill Ratio CFU/ml log CFU/ml Kill Ratio CFU/ml log CFU/ml Kill Ratio 0 4250 3.6284 0 3900 3.5911 0 3500 3.5441 0 1 1450 3.1614 0.658824 1870 3.2718 0.520513 736 2.8669 0.789714 3 10600 4.0253 -1.49412 976 2.9894 0.749744 90 1.9542 0.974286 6 7050 3.8482 -0.65882 86 1.9345 0.977949 10 1.0000 0.997143 24 2200 3.3424 0.482353 100 2.0000 0.974359 12 0.0000 0.999714
Pla
nkto
nic
Legi
onel
la
48 4600 3.6628 -0.08235 220 2.3424 0.94359 1 0.0000 0.999714 0 1680000 6.2253 0 1595000 6.2028 0 1600000 6.2041 0 1 1840000 6.2648 -0.09524 7750 3.8893 0.995141 6800 3.8325 0.99575 3 1110000 6.0453 0.339286 3610 3.5575 0.997737 3120 3.4942 0.99805 6 1450000 6.1614 0.136905 5640 3.7513 0.996464 1250 3.0969 0.999219 24 720000 5.8573 0.571429 2980 3.4742 0.998132 1 0.0000 0.999999
Pla
nkto
nic
HP
C
48 1280000 6.1072 0.238095 2580 3.4116 0.998382 1 0.0000 0.999999 Sample Type CFU/cm2 log CFU/cm2 Kill Ratio CFU/cm2 log CFU/cm2 Kill Ratio CFU/cm2 log CFU/cm2 Kill Ratio
0 75500 4.8779 0 7500 3.8751 0 12750 4.1055 0 1 51250 4.7097 0.321192 2105 3.3233 0.719333 333 2.5224 0.973882 3 46250 4.6651 0.387417 1645 3.2162 0.780667 230 2.3617 0.981961 6 39250 4.5938 0.480132 238 2.3766 0.968267 163 2.2122 0.987216 24 115000 5.0607 -0.52318 330 2.5185 0.956 1 0.0000 0.999922
Bio
film
Legi
onel
la
48 87000 4.9395 -0.15232 150 2.1761 0.98 1 0.0000 0.999922 0 1030000 6.0128 0 65000 4.8129 0 40000 4.6021 0 1 450000 5.6532 0.563107 3375 3.5283 0.948077 1280 3.1072 0.968 3 1405000 6.1477 -0.36408 3600 3.5563 0.944615 2600 3.4150 0.935 6 1270000 6.1038 -0.23301 3600 3.5563 0.944615 2625 3.4191 0.934375 24 625000 5.7959 0.393204 1740 3.2405 0.973231 1400 3.1461 0.965
Bio
film
HP
C
48 1140000 6.0569 -0.1068 1655 3.2188 0.974538 50 1.6990 0.99875 1. CFU: Colony Forming Unit
2. 1: Under detection limit
89

Table 14. Results of 48-hr disinfection on chlorine dioxide and chlorine against Legionella and HPC bacteria at pH 7.0
and 40 °C in a model plumbing system
Control 0.5 mg/LCl2 at 26 °C 0.2mg/L ClO2 and 0.5 mg/L Cl2 at 40 °CSample Type Time (hour) CFU1/ml log CFU/ml Kill Ratio CFU/ml log CFU/ml Kill Ratio CFU/ml log CFU/ml Kill Ratio
0 3700 3.5682 0 3800 3.5798 0 3550 3.5502 01 4650 3.6675 -0.25676 170 2.2304 0.955263 10 1.0000 0.9971833 4700 3.6721 -0.27027 5 0.6990 0.998684 1 0.0000 0.9997186 4200 3.6232 -0.13514 12 0.0000 0.999737 1 0.0000 0.99971824 3300 3.5185 0.108108 1 0.0000 0.999737 1 0.0000 0.999718
Pla
nkto
nic
Legi
onel
la
48 4500 3.6532 -0.21622 1 0.0000 0.999737 1 0.0000 0.9997180 1195000 6.0774 0 715000 5.8543 0 1000000 6.0000 01 1325000 6.1222 -0.10879 1250 3.0969 0.998252 100 2.0000 0.99993 1680000 6.2253 -0.40586 100 2.0000 0.99986 1 0.0000 0.9999996 1410000 6.1492 -0.17992 1 0.0000 0.999999 1 0.0000 0.99999924 1175000 6.0700 0.016736 1 0.0000 0.999999 1 0.0000 0.999999P
lank
toni
c H
PC
48 955000 5.9800 0.200837 1 0.0000 0.999999 1 0.0000 0.999999Sample Type CFU/cm2 log CFU/cm2 Kill Ratio CFU/cm2 log CFU/cm2 Kill Ratio CFU/cm2 log CFU/cm2 Kill Ratio
0 1725 3.2368 0 1763 3.2463 0 1550 3.1903 01 1700 3.2304 0.014493 25 1.3979 0.98582 20 1.3010 0.9870973 1875 3.2730 -0.08696 1 0.0000 0.999433 1 0.0000 0.9993556 1875 3.2730 -0.08696 1 0.0000 0.999433 1 0.0000 0.99935524 1415 3.1508 0.17971 1 0.0000 0.999433 1 0.0000 0.999355
Bio
film
Leg
ione
lla
48 2100 3.3222 -0.21739 1 0.0000 0.999433 1 0.0000 0.9993550 150000 5.1761 0 110000 5.0414 0 60000 4.7782 01 72500 4.8603 0.516667 100 2.0000 0.999091 100 2.0000 0.9983333 75000 4.8751 0.5 5000 3.6990 0.954545 50 1.6990 0.9991676 70000 4.8451 0.533333 1 0.0000 0.999991 1 0.0000 0.99998324 65000 4.8129 0.566667 30 1.4771 0.999727 1 0.0000 0.999983
Bio
film
HP
C
48 57500 4.7597 0.616667 1 0.0000 0.999991 1 0.0000 0.9999831. CFU: Colony Forming Unit
2. 1: Under detection limit
90

Table 15. Temperature improved the disinfection efficacy of 0.2 mg/L chlorine dioxide residual against Legionella and
HPC bacteria at pH7.0 in a model plumbing system
Control 0.2 mg/LClO2 at 27 °C 0.2mg/L ClO2 at 40 °C
Sample Type
Time (hour) CFU1/ml log CFU/ml Kill Ratio CFU/ml log CFU/ml Kill Ratio CFU/ml log CFU/ml Kill Ratio
0 4250 3.6284 0 3900 3.5911 0 3075 3.4878 01 1450 3.1614 0.658824 1870 3.2718 0.520513 12 0.0000 0.9996753 10600 4.0253 -1.49412 976 2.9894 0.749744 10 1.0000 0.9967486 7050 3.8482 -0.65882 86 1.9345 0.977949 1 0.0000 0.999675
24 2200 3.3424 0.482353 100 2.0000 0.974359 1 0.0000 0.999675
Pla
nkto
nic
Legi
onel
la
48 4600 3.6628 -0.08235 220 2.3424 0.94359 1 0.0000 0.9996750 1680000 6.2253 0 1595000 6.2028 0 250000 5.3979 01 1840000 6.2648 -0.09524 7750 3.8893 0.995141 15000 4.1761 0.943 1110000 6.0453 0.339286 3610 3.5575 0.997737 1 0.0000 0.9999966 1450000 6.1614 0.136905 5640 3.7513 0.996464 1 0.0000 0.999996
24 720000 5.8573 0.571429 2980 3.4742 0.998132 1 0.0000 0.999996Pla
nkto
nic
HP
C
48 1280000 6.1072 0.238095 2580 3.4116 0.998382 1 0.0000 0.999996Sample
Type CFU/cm2 log CFU/cm2 Kill Ratio CFU/cm2 log CFU/cm2 Kill Ratio CFU/cm2 log CFU/cm2 Kill Ratio
0 75500 4.8779 0 7500 3.8751 0 2500 3.3979 01 51250 4.7097 0.321192 2105 3.3233 0.719333 1805 3.2565 0.2783 46250 4.6651 0.387417 1645 3.2162 0.780667 407 2.6096 0.83726 39250 4.5938 0.480132 238 2.3766 0.968267 73 1.8633 0.9708
24 115000 5.0607 -0.52318 330 2.5185 0.956 1 0.0000 0.9996
Bio
film
Leg
ione
lla
48 87000 4.9395 -0.15232 150 2.1761 0.98 1 0.0000 0.99960 1030000 6.0128 0 65000 4.8129 0 50000 4.6990 01 450000 5.6532 0.563107 3375 3.5283 0.948077 14900 4.1732 0.7023 1405000 6.1477 -0.36408 3600 3.5563 0.944615 9150 3.9614 0.8176 1270000 6.1038 -0.23301 3600 3.5563 0.944615 715 2.8543 0.9857
24 625000 5.7959 0.393204 1740 3.2405 0.973231 160 2.2041 0.9968
Bio
film
HP
C
48 1140000 6.0569 -0.1068 1655 3.2188 0.974538 325 2.5119 0.9935
91
1. CFU: Colony Forming Unit 2. 1: Under detection limit

1.E-04
1.E-03
1.E-02
1.E-01
1.E+00
1.E+01
0 1 3 6 24 48
Time, hour
Surv
ival
Rat
io
0.2 mg/L ClO2 0.2mg/L ClO2 and 0.5 mg/L Cl2 0.5 mg/L Cl2 Control
1.E-05
1.E-04
1.E-03
1.E-02
1.E-01
1.E+00
1.E+01
0 1 3 6 24 48
Time, hour
Surv
ival
Rat
io
0.2 mg/L ClO2 0.2mg/L ClO2 and 0.5 mg/L Cl2 0.5 mg/L Cl2 Control
a). Planktonic phase b). Biofilm phase
Figure 31. The results of the second test of inactivation of planktonic and biofilm
associated Legionella in a model plumbing system by residual maintenance of 0.2 mg/L of
chlorine dioxide, 0.5 mg/L free chlorine and 0.2 mg/L of chlorine dioxide with 0.5 mg/L
free chlorine at 27 °C and pH 7.0
92

1.E-07
1.E-06
1.E-05
1.E-04
1.E-03
1.E-02
1.E-01
1.E+00
1.E+01
0 1 3 6 24 48Time, hour
Surv
ival
Rat
io
0.2 mg/L ClO2 0.2mg/L ClO2 and 0.5 mg/L Cl2 0.5 mg/L Cl2 Control
1.E-05
1.E-04
1.E-03
1.E-02
1.E-01
1.E+00
1.E+01
0 1 3 6 24 48
Time, hour
Surv
ival
Rat
io
0.2 mg/L ClO2 0.2mg/L ClO2 and 0.5 mg/L Cl2 0.5 mg/L Cl2 Control
a). Planktonic phase b). Biofilm phase
Figure 32. The results of the second test of inactivation of planktonic and biofilm
associated HPC bacteriain a model plumbing system by residual maintenance of 0.2 mg/L
of chlorine dioxide, 0.5 mg/L free chlorine and 0.2 mg/L of chlorine dioxide with 0.5 mg/L
free chlorine at 27 °C and pH 7.0
1.E-07
1.E-06
1.E-05
1.E-04
1.E-03
1.E-02
1.E-01
1.E+00
1.E+01
0 1 3 6 24 48Time, hour
Surv
ival
Rat
io
Planktonic Leigonella at 27CPlanktonic Legionella at 40CPlanktonic HPC at 27 CPlanktonic HPC at 40 C
1.E-04
1.E-03
1.E-02
1.E-01
1.E+00
1.E+01
0 1 3 6 24 48Time, hour
Surv
ival
Rat
io
Biofilm Leigonella at 27 C
Biofilm Legionella at 40 C
Biofilm HPC at 27C
Biofilm HPC at 40C
Figure 33. The results of the second test of effect of temperature on the efficacy of
0.2 mg/L chlorine dioxide residual inactivation of Legionella and HPC bacteria at pH 7.0 in
both biofilm and planktonic phases
93

1.E-07
1.E-06
1.E-05
1.E-04
1.E-03
1.E-02
1.E-01
1.E+00
1.E+01
0 1 3 6 24 48Time, hour
Surv
ival
Rat
io
Planktonic Leigonella at 27CPlanktonic Legionella at 40CPlanktonic HPC at 27 CPlanktonic HPC at 40 C
1.E-06
1.E-05
1.E-04
1.E-03
1.E-02
1.E-01
1.E+00
1.E+01
0 1 3 6 24 48Time, hour
Surv
ival
Rat
io
Biofilm Leigonella at 27 CBiofilm Legionella at 40CBiofilm HPC at 27CBiofilm HPC at 40C
Figure 34. The results of the second test of effect of temperature on the efficacy of
combined disinfectant residuals of 0.2 mg/L chlorine dioxide and 0.5 mg/L chlorine
inactivation of Legionella and HPC bacteria at pH 7.0 in both biofilm and planktonic
phases
94

BIBLIOGRAPHY
1. Sidari, F.P., J.E. Stout, J.M. VanBriesen, A.M. Bowman, D. Grubb, A. Neuner, M.M. Wagener, and V.L. Yu, Keeping Legionella out of water systems. Journal of American Water Works Association, 2004. 96(1): p. 111-119.
2. Srinivasan, A., G. Bova, T. Ross, K. Mackie, N. Paquette, W. Merz, and T.M. Perl, A 17-
month evaluation of a chlorine dioxide water treatment system to control Legionella species in a hospital water supply. Infection Control and Hospital Epidemiology, 2003 24(8): p. 575-579.
3. USEPA, National Primary Drinking Water Rules: Disinfectants-Disinfection By-
Products. Final Rule. 1998, Federal Register. p. 241. 4. Hoehn, R.C., C.S. Ellenberger, D.L. Gallagher, E.V. Wiseman, R.W. Benniger, and A.
Rosenblatt, ClO2 and by-product persistence in a drinking water system. Journal of American Water Works Association, 2003. 95(4): p. 141-150.
5. Baribeau, H., M. Prevost, R. Desjardins, P. Lafrance, and D.J. Gates, Chlorite and
chlorate ion variability in distribution systems. Journal of American Water Works Association, 2002. 94(7): p. 96-105.
6. Gyurek, L.L., H.B. Li, M. Belosevic, and G.R. Finch, Ozone inactivation kinetics of
Cryptosporidium in phosphate buffer. Journal of Environmental Engineering, 1999. 125(10): p. 913-924.
7. Gates, D., The Chlorine Dioxide Handbook. 1998, American Waterworks Association:
Denver, Colorado. 8. Gordon, G., Is all chlorine dioxide created equal? Journal of American Water Works
Association, 2001. 93(4): p. 163-174. 9. Zika, R.G., C.Y. Moore, L.T. Gidel, and W.J. Cooper, Sunlight-induced
photodecomposition of chlorine dioxide. Water Chlorination Chemistry, Environmental Impact and Health Effects, 1985. 5: p. 1041-1053.
10. Walker, S., F.P. Lee, and E.M. Aieta, Chlorine dioxide control taste and odor. Journal of
American Water Works Association, 1986. 78(3): p. 84-93.
95

11. Condie, L.W., Toxicological problems associated with chlorine dioxide. Journal of
American Water Works Association, 1986. 78(6): p. 73-8. 12. Lykins, B.W. and M.H. Griese, Using chlorine dioxide for trihalomethane control.
Journal of American Water Works Association, 1986. 78(6): p. 88-93. 13. Hoigne, J. and H. Bader, Kinetics of Reactions of Chlorine Dioxide (Oclo) in Water .1.
Rate Constants for Inorganic and Organic-Compounds. Water Research, 1994. 28(1): p. 45-55.
14. Rav-Acha, C., The reactions of chlorine dioxide with aquatic organic materials and their
health effects. Water Research, 1984. 18(11): p. 1329-1341. 15. Rav-Acha, C., The different reaction mechanisms by which chlorine and chlorine dioxide
react with polycyclic armatic hydrocarbons (PAH) in water. Water Research, 1985. 19(10): p. 1273-1281.
16. Wajon, J. and A. Rosenblatt, Oxidation of phenol and hydroquinone by chlorine dioxide.
Environmental Science & Technology, 1982. 16(7): p. 396-402. 17. Werdehoff, K.S. and P.C. Singer, Chlorine dioxide effects on THMFP, TOXFP, and the
formation of inorganic by-products. Journal of American Water Works Association, 1987. 79(9): p. 107-13.
18. Rav-Acha, C., Aqueous reactions of chlorine dioxide with hydrocarbons. Environmental
Science & Technology, 1982. 21(11): p. 1069-1074. 19. Monscvitz, J. and D. Rexing, A polit study of chlorine dioxide use to reduce total
trihalmethanes. Journal of American Water Works Association, 1981. 73(2): p. 94-96. 20. Hubbs, S.A., D. Amundsen, and P. Olthius, Use of chlorine dioxide, chloramines, and
short-term free chlorination as alternative disinfectants. Journal of American Water Works Association, 1981. 73(2): p. 97-101.
21. Hoff, J., E. Geldreich, and e. al., Comparison of the biocidal efficiency of alternative
disinfectants. Journal of American Water Works Association, 1981. 73(1): p. 40-44. 22. Trakhtman, N., Chlorine dioxide in water disinfection, Gigiena y Sanit 11:10 1946.
Chemistry Abstract, 1949. 43: p. 1508. 23. Bedulivich, T., M.N. Svetlakova, and N. Trakhtman, Use of chlorine dioxide in
purification of water, Gigiena y Saint.,10:15 1953. Chemistry Abstract, 1954. 48: p. 2953.
96
24. Bernard, M.A., B.M. Israel, V.P. Olivieri, and M.L. Granstrom, Efficiency of chlorine dioxide as a bactericide. Applied Microbiology, 1965. 13(5): p. 776-780.
25. Bernard, M.A., W.B. Snow, V.P. Olivieri, and B. davidson, Kinetics and mechanism of
bacterial disinfection by chlorine dioxide. Applied Microbiology, 1967. 15(2): p. 257-265.
26. Lauer, W.C., S.R. Lohman, and S. Rogers, Experience with chlorine dioxide at Denver's
Reuse plant. Journal of American Water Works Association, 1986. 78(6): p. 79-87. 27. Berg, D.J., A. Matin, and P.V. Roberts, Effect of antecedent growth conditions on
sensitivity of Escherichia coli to chlorine dioxide. Applied and Environmental Microbiology, 1982. 44(4): p. 814-819.
28. Varma, M., R. Torrence, R.C. Chawla, and H. Okrend, eds. Relative disinfection
potentials of chlorine and chlorine dioxide in drinking water. Water Chlorination Chemistry, Environmental Impact and Health Effects. Vol. 5. 1984. 635-648.
29. Harakeh, M., J. Hoff, D.J. Berg, and A. Matin, Response of chemostat-grown enteric
bacteria to chlorine dioxide. Water Chlorination Chemistry, Environmental Impact and Health Effects, 1984. 5: p. 615-617.
30. Berg, J.D., J.C. Hoff, P.V. Roberts, and A. Matin, Disinfection resistance of Legionella
pneumophila and Escherichia coli grown in continuous and batch culture. Water Chlorination Chemistry, Environmental Impact and Health Effects, 1985 5: p. 603-13.
31. Mayack, L.A., R.J. Soracco, E.W. WILDE, and D.H. POPE, Comparative effectiveness of
chlorine and chlorine dioxide biocide regimes for biofouling control. Water Research, 1984. 18(5): p. 593-599.
32. Chen, Y., O.J. Sproul, and A. Rubin, Inactivation of Naegleria gruberi cysts by chlorine
dioxide. Water Research, 1985. 19(6): p. 783-789. 33. Ruffell, K.M., J.L. Rennecker, and B.J. Marinas, Inactivation of Cryptosporidium parvum
oocysts with chlorine dioxide. Water Research, 2000. 34(3): p. 868-876. 34. Li, H.B., G.R. Finch, D.W. Smith, and M. Belosevic, Chlorine dioxide inactivation of
Cryptosporidium parvum in oxidant demand-free phosphate buffer. Journal of Environmental Engineering, 2001. 127(7): p. 594-603.
35. Korich, D.G., J. Mead, M.S. Madore, N.A. Sinclair, and C.R. Sterling, Effects of ozone,
chlorine dioxide, chlorine and monochloramine on Cryptospordium parvum oocysts viability. Applied and Environmental Microbiology, 1990. 56(5): p. 1423-1428.
36. Peeters, J., E.A. Mazás, W.J. Masschelein, I.V. Martiez de Maturana, and E. Debackeret,
Effect of disinfection of drinking water with ozone or chlorine dioxide on survival of
97

Cryptospordium parvum oocysts. Applied and Environmental Microbiology, 1989. 55(6): p. 1519-1522.
37. Olivieri, V.P., F. Hauchman, F.S. Hauchman, C.I. Noss, and R. Vasl, Mode of action of
chlorine dioxide on selected viruses. Water Chlorination Chemistry, Environmental Impact and Health Effects, 1984. 5: p. 619-633.
38. Alvarez, M. and M. O'Brien, Mechanisms of inactivation of poliovirus by chlorine
dioxide and iodine. Applied and Environmental Microbiology, 1982. 50(11): p. 1064-1071.
39. Radziminski, C., L. Ballantyne, J. Hodson, R. Creason, R.C. Andrews, and C. Chauret,
Disinfection of Bacillus subtilis spores with chlorine dioxide: a bench-scale and pilot-scale study. Water Research, 2002. 36(6): p. 1629-1639.
40. Walker, J.T. and M. Morales, Evaluation of chlorine dioxide (ClO2) for the control of
biofilms. Water Science and Technology, 1997. 35(11-12): p. 319-323. 41. Roller, S. and V.P. Olivieri, Mode of bacterial inactivation by chlorine dioxide. Water
Research, 1980. 14(6): p. 635-641. 42. Singh, N., R.K. Singh, A.K. Bhunia, and R.L. Stroshine, Effect of inoculation and
washing methods on the efficacy of different sanitizers against Escherichia coli O157 : H7 on lettuce. Food Microbiology, 2002. 19(2-3): p. 183-193.
43. Singh, N., R.K. Singh, A.K. Bhunia, and R.L. Stroshine, Efficacy of chlorine dioxide,
ozone, and thyme essential oil or a sequential washing in killing Escherichia coli O157 : H7 on lettuce and baby carrots. Lebensmittel-Wissenschaft Und-Technologie-Food Science and Technology, 2002. 35(8): p. 720-729.
44. Andrews, L.S., A.M. Keys, R.L. Martin, R. Grodner, and D.L. Park, Chlorine dioxide
wash of shrimp and crawfish an alternative to aqueous chlorine. Food Microbiology, 2002. 19(4): p. 261-267.
45. Singh, N., R.K. Singh, and A.K. Bhunia, Sequential disinfection of Escherichia coli O157
: H7 inoculated alfalfa seeds before and during sprouting using aqueous chlorine dioxide, ozonated water, and thyme essential oil. Lebensmittel-Wissenschaft Und-Technologie-Food Science and Technology, 2003. 36(2): p. 235-243.
46. Du, J.H., Y. Han, and R.H. Linton, Inactivation by chlorine dioxide gas (ClO2) of
Listeria monocytogenes spotted onto different apple surfaces. Food Microbiology, 2002. 19(5): p. 481-490.
47. Han, Y., R.H. Linton, S.S. Nielsen, and P.E. Nelson, Inactivation of Escherichia coli
O157 : H7 on surface-uninjured and -injured green pepper (Capsicum annuum L.) by
98
chlorine dioxide gases demonstrated by confocal laser scanning microscopy. Food Microbiology, 2000. 17(6): p. 643-655.
48. DU, J., Y. Han, and R.H. Linton, Efficacy of chlorine dioxide gas in reducing
Escherichia coli O157: H7 on apple surface. Food Microbiology, 2003. 20(55): p. 563-591.
49. USEPA, EPA guidance manual alternative disinfectants and oxidants. 1999. 50. Masschelein, W.J., Experience with chlorine dioxide in Brussels, Part 3. Journal of
American Water Works Association, 1985. 77(1): p. 73-87. 51. Masschelein, W.J., Experience with chlorine dioxide in Brussel, Part 1. Journal of
American Water Works Association, 1984. 76(1): p. 70-76. 52. Brooks, T., R. Osicki, V.S. Springthorpe, S.A. Sattar, L. Filion , D. Abrial , and S.
Riffard, Detection and identification of Legionella species from groundwaters. Journal of Toxicology and Environmental Health-Part A, 2004. 67(20-22): p. 1845-1859.
53. Lin Yu-Sen, E., Use of copper/silver ions for disinfection of Legionella and
Mycobacterium in water distribution system, in Department of Civil & Environmental Engineering. 1999, University of Pittsburgh: Pittsburgh.
54. Gao, Y., Inactivation of Legionella by monochloramine, chlorine dioxide and DBNPA in
a pilot-scale water plumbing system, in Department of Civil & Environmental Engineering. 2000, University of Pittsburgh: Pittsburgh.
55. Rogers, J., A.B. Doowsett, P.J. Dennis, J.V. Lee, and C.W. Keevil, Influence of plumbing
materials on biofilm formation and growth of Legionella pneumophila in potable water systems. Applied and Environmental Microbiology, 1994. 60(6): p. 1842-1851.
56. Lin, Y.E., R.D. Vidic, J.E. Stout, and V.L. Yu, Legionella in water distribution systems.
Journal of American Water Works Association, 1998. 90(1): p. 112-121. 57. Lin, Y.S., J.E. Stout, V.L. Yu, and R.D. Vidic, Disinfection of water distribution systems
for Legionella. Seminars in Respiratory Infections, 1998 13(2): p. 147-59. 58. Colbourne, J.S., D.J. Pratt, M.G. Smith, S.P. Fisher-Hoch, and D. Harper, Water fittings
as sources of Legionella pneumophila in a hospital plumbing system. Lancet, 1984. 1: p. 210-213.
59. Niedeveld, C.J., F.M. Pet, and P.L. Meenhorst, Effect of rubbers and their constituents on
proloferation of Legionella pneumophila in naturally contaminated hot water. Lancet, 1986. 2: p. 180-184.
99

60. Farrell, I.D., J.E. Barker, E.P. Miles, and J.G. Hutchison, A field study of the survival of Legionella pneumophila in a hospital hot-water system. Epidemiology and Infection, 1990 104(3): p. 381-7.
61. Fisher-Hoch, S.P., J.O. Tobin, and A.M. Belson, Investigation and control of an outbreak
of Legionnaires' disease in a district hospital. Lancet, 1981. 1: p. 932-936. 62. Matulonis, U., C.S. Rosenfeld, and R.K. Shadduck, Prevention of Legionella infections in
a bone marrow transplant unit: multifaceted approach to decontamination of a water system. Infection Control and Hospital Epidemiology, 1993. 14(10): p. 571-575.
63. Benin, A.L., R.F. Benson, and R.E. Besser, Trends in Legionnaires' disease, 1980-1998:
declining mortality and new patterns of diagnosis. Clinical Infectious Diseases, 2002. 35(10): p. 1039-1046.
64. Korvick, J.A., V.L. Yu, and G.D. Fang, Legionella species as hospital-acquired
respiratory pathogens. Seminars in Respiratory Infections, 1987 2(1): p. 34-47. 65. Muraca, P., J.E. Stout, and V.L. Yu, Comparative assessment of chlorine, heat, ozone,
and UV light for killing Legionella pneumophila within a model plumbing system. Applied and Environmental Microbiology, 1987 53(2): p. 447-53.
66. Borau, J., R. Czap, K.A. Strellrecht, and R.A. Venezia, Long term control of Legionella
species in potable water after a nosomial Legionellosis outbreak in an intensive care unit. Infection Control and Hospital Epidemiology, 2000. 21(9): p. 602-603.
67. Zacheus, O.M. and P.J. Martikainen, Effect of heat flushing on the concentrations of
Legionella pneumophila and other heterotrophic microbes in hot water systems of apartment buildings. Canadian Journal of Microbiology, 1996. 42(8): p. 811-818.
68. Darelid, J., L. Bengtsson, B. Gastrin, H. Hallander, S. Lofgren, B.E. Malmvall, A.M.
Olinder-Nielsen, and A.C. Thelin, An outbreak of Legionnaires' disease in a Swedish hospital. Scandinavian Journal of Infectious Diseases, 1994. 26(4): p. 417-425.
69. Liu, Z., J.E. Stout, L. Tedesco, M. Boldin, C. Hwang, and V.L. Yu, Efficacy of ultraviolet
light in preventing Legionella colonization of a hospital water distribution system. Water Research, 1995 29(10): p. 2275-80.
70. Franzin, L., D. Cabodi, and C. Fantino, Evaluation of the efficacy of ultraviolet
irradiation for disinfection of hospital water contaminated by Legionella. Journal of Hospital Infection, 2002 51(4): p. 269.
71. Farr, B.M., J. Gratz, J. Tartaglino, S.I. GETCHELL-WHITE , and H.M. GRÖSCHELL,
Evaluation of ultraviolet light for disinfection of hospital water contaminated with Legionella. Lancet, 1988. 2: p. 669-672.
100

72. Hall, K.K., E.T. Giannetta, S.I. Gretchell-White, and L.J. Durbin, Ultraviolet light disinfection of hospital water for preventing nosocomial Legionella infection: a 13-year follow-up. Infection Control and Hospital Epidemiology, 2003. 24(8): p. 580-583.
73. Stout, J.E. and V.L. Yu, Experiences of the first 16 hospitals using copper-silver
ionization for Legionella control: implications for the evaluation of other disinfection modalities. Infection Control and Hospital Epidemiology, 2003. 24: p. 563-568.
74. Miuetzner, S., R.C. Schwille, A. Farley, E.R. Wald, J.H. Ge, S.J. States, T. Libert, and
R.M. Wadowsky, Efficacy of thermal treatment and copper-silver ionization for controlling Legionella pneumophila in high volum hot water plumbing system in hospitals. American Journal of Infection Control, 1997. 25(6): p. 452-457.
75. Mietzner, S.M., A. Hangard, J.E. Stout, U. Rohr, M.L. Pedro-Botet, M.H. Samore, and
V.L. Yu, Reduced susceptibility of Legionella pneumophila to the antimicrobial effects of copper and silver ions. Interscience Conference on Antimicrobial Agents and Chemotherapy, Washington, D.C., 2005.
76. Hamilton, E., D.V. Seal, and J. Hay, Comparison of chlorine and chlorine dioxide
disinfection for control of Legionella in a hospital potable water supply. Journal of Hospital Infection, 1996 32(2): p. 156-160.
77. Harris, A. and M. Rendell, The elimination of Legionella in local hot and cold water
systems using a novel chlorine dioxide technique. International Water Conference Official Proceedings, Engineering Society of Western Pennsylvania, Pittsburgh, PA, March 5-9, 1999.
78. Hood, J., G. Cheape, A. Mead, and E. Curran, Six years' experience with chlorine dioxide
in control of Legionella pneumophila in potable water supply of Glasgow Royal Infirmary. American Journal of Infection Control, 2000. 28(1): p. 86.
79. Sidari, F.P. and J. VanBriesen, Evaluation of a chlorine dioxide secondary disinfection
system. Wem-Water Engineering & Management, 2002. 149(11): p. 29-33. 80. Walker, J.T., C.W. Mackerness, D. Mallon, T. Makin, T. Williets, and C.W. Keevil,
Control of Legionella pneumophila in a hospital water system by chlorine dioxide. Journal of Industrial Microbiology, 1998. 15(4): p. 384-390.
81. Makin, T., Control of Legionella in domestic water systems and potential energy
savings resulting from the control of Legionellae with chlorine dioxide. 15th IFHE Congress, Edinburgh, Scotland, 1998.
82. Veschetti, E., B. Cittadini, D. Maresca, G. Citti, and M. Ottaviani, Inorganic by-products
in waters disinfected with chlorine dioxide. Microchemical Journal, 2005. 79(1-2): p. 165-170.
101

83. Steinbergs, C., Removal of byproducts of chlorine and chlorine dioxide at a hemodialysis center. Journal of American Water Works Association, 1986. 76(6): p. 86-90.
84. Katz, A. and N. Narkis, Removal of chlorine dioxide disinfection by-products by ferrous
salts. Water Research, 2001. 35(1): p. 101-108. 85. Sarin, P., V.L. Snoeyink, and D.A. Lytle, Iron Corrosion Scales: Model for Scale
Growth, Iron Release and Colored Water Formation. Journal of Environmental Engineering, 2004. 130(4): p. 365-373.
86. Sarin, P., V.L. Snoeyink, J. Bebee, W.M. Kriven, and J.A. Clement, Physico-chemical
characteristics of corrosion scales in old iron pipes. Water Research, 2001. 35(12): p. 2961-2969.
87. Frateur, I., C. Deslouis, L. Kiene, Y. Levi, and B. Tribollet, Free chlorine consumption
induced by cast iron corrosion in drinking water distribution systems. Water Research, 1999. 33(8): p. 1781-1790.
88. Hallam, N.B., J.R. West, C.F. Forster, J.C. Powell, and I. Spencer, The decay of chlorine
associated with the pipe wall in water distribution systems. Water Research, 2002 36(14): p. 3479-3488.
89. DiGiano, F.A. and W. Zhang, Pipe section reactor to evaluate chlorine-wall reaction.
Journal of American Water Works Association, 2005 97(1): p. 74-85. 90. Aieta, E.M., Determination of chlorine dioxide, chlorine, chlorite and chlorate in water.
Journal of American Water Works Association, 1984. 76(1): p. 64-69. 91. Aieta, E.M. and P.V. Roberts, Kinetics of the reaction between molecular chlorine and
chlorite in aqueous solution. Environmental Science & Technology, 1986. 20(1): p. 50-55.
92. Aieta, E.M. and D.J. Berg, A review of chlorine dioxide in drinking water treatment.
Journal of American Water Works Association, 1986. 78(6): p. 62-72. 93. Gordon, G. and S. Tachiyashiki, Kinetics and mechanism of formation of chlorate ion
from the hypochlorous acid/chlorite ion reaction at pH 6-10. Environmental Science and Technology, 1991. 25(3): p. 468-74.
94. Gordon, G. and G. Kifeffer, The chemistry of chlorine dioxide. Progress in Chemistry,
1972. 15: p. 201. 95. Tang, T.-f. and G. Gordon, Stoichiometry of the reaction between chlorite ion and
hypochlorous acid at pH 5. Environmental Science & Technology, 1984. 18(3): p. 212-216.
102

96. Emmenegger, F. and G. Gordon, The rapid interaction between sodium chlorite and dissolved chlorine. Inorganic Chemistry, 1967. 6(3): p. 633-635.
97. Son, H., M. Cho, J. Kim, B. Oh, H.M. Chung, and J. Yoon, Enhanced disinfection
efficiency of mechanically mixed oxidants with free chlorine. Water Research, 2005. 39(4): p. 721-727.
98. Corona-Vasquez, B., J.L. Rennecker, A.M. Driedger, and B.J. Marinas, Sequential
inactivation of Cryptosporidium parvum oocysts with chlorine dioxide followed by free chlorine or monochloramine. Water Research, 2002. 36(1): p. 178-188.
99. Kool, J.L., D. Bergmire-Sweat, J.C. Butler, E.W. Brown, D.J. Peabody, D.S. Massi, J.C.
Carpenter, J.M. Pruckler, R.F. Benson, and B.S. Fields, Hospital characteristics associated with colonization of water systems by Legionella and risk of nosocomial Legionnaires' disease: a cohort study of 15 hospitals. Infection Control and Hospital Epidemiology, 1999. 20(12): p. 798-805.
100. USEPA, Determination of inorganic anions in drinking water by ion chromatography. .
Method 300 1 1997. 101. Centers for Disease Control and, P., Guidelines for Preventing Health-Care-Associated
Pneumonia, 2003. Morbidity Mortality Weekly Report, 2004. 53(3): p. 1-36. 102. Zhang, Z., J.E. Stout, and R.D. Vidic, The impact of temperature and TOC on chlorine
dioxide decay in drinking water. American Water Works Association Annual Meeting, San Antonio, Texas, 2006.
103. Hill, W., Continuous chlorine dioxide dosing of hospital hot water system following a
case of nosocomial aspiration Legionella pneumonia. 5th International Conference on Legionella, Ulm, Germany, September 26-29, 2000.
104. Hosein, I.K., D.W. Hill, T.Y. Tan, E.G. Butchart, K. Wilson, G. Finlay, S. Burge, and
C.D. Ribeiro, Point-of-care controls for nosocomial legionellosis combined with chlorine dioxide potable water decontamination: a two-year survey at a Welsh teaching hospital. Journal of Hospital Infection, 2005 61(2): p. 100-106.
105. Bova, G., P. Sharpe, and T. Keane, Evaluation of chlorine dioxide in potable water
systems for Legionella control in an acute care hospital environment. International Water Conference Official Proceedings. 2004, Pittsburgh, PA: Engineering Society of Western Pennsylvania.
106. Zhang, Z., C. McCann, R. Hawks, J. McElroy, S. Piescznski, R. Bisson, R. Vidic, and
J.E. Stout, Chlorine dioxide for Legionella control in a hospital water system. Monitoring for disinfection by-products. Official Proceedings - International Water Conference, 2004 65th: p. 129-136.
103

107. Katz, A., N. Narkis, F. Orshansky, E. Friedland, and Y. Kott, Disinfection of Effluent by Combinations of Equal Doses of Chlorine Dioxide and Chlorine Added Simultaneously over Varying Contact Times. Water Research, 1994. 28(10): p. 2133-2138.
108. Glasmacher, A., S. Engelhart, M. Exner, and J.C.M.E.C.F.A.G. J.Bartram, Infections
from HPC organisms in drinking-water amongst the immunocompromised, in World Health Organization (WHO). Heterotrophic Plate Counts and Drinking-water Safety. 2003, IWA Publishing: London, UK. p. 137-146.
109. Raczyk-Stanislawiak, U., J. Swietlik, A. Dabrowska, and J. Nawrocki, Biodegradability
of organic by-products after natural organic matter oxidation with ClO2 - case study. Water Research, 2004. 38(4): p. 1044-1054.
110. Boccelli, D.L. and M.E. Tryby, A reactive species model for chlorine decay and THM
formation under rechlorination condition. Water Research, 2003. 37(11): p. 2654-2666. 111. Kiene, L., W. Lu, and Y. Levi, Relative importance of the phenomena responsible for
chlorine decay in drinking water distribution systems. Water Science and Technology, 2000. 38(6): p. 219-227.
112. Uyguner, C.S. and M. Bekbolet, Implementation of spectroscopic parameters for
practical monitoring of natural organic matter. Desalination, 2005. 176(1): p. 47-55. 113. Gagnon, G.A., J.L. Rand, K.C. O'Leary, A.C. Rygel, C. Chauret, and R.C. Andrews,
Disinfectant efficacy of chlorite and chlorine dioxide in drinking water biofilms. Water Research, 2005. 39(9): p. 1809-1817.
114. Sarin, P., V.L. Snoeyink, J. Bebee, K.K. Jim, M.A. Beckett, W.M. Kriven, and J.A.
Clement, Iron release from corroded iron pipes in drinking water distribution systems: effect of dissolved oxygen. Water Research, 2004. 38(5): p. 1259-1269.
115. Tang, Z., S. Hong, W. Xiao, and J. Taylor, Characteristics of iron corrosion scales
established under blending of ground, surface, and saline waters and their impacts on iron release in the pipe distribution system. Corrosion Science, 2006. 48(2): p. 322-342.
116. Merkela, T.H., H. Grob, and W. Werner, Copper corrosion by-product release in long-
term stagnation experiments. Water Research, 2002. 36(6): p. 1547-1555. 117. Valentine, R.L., P.J. Vikersland, B.D. Angerman, S.A. hackett, M. Shoup, and S.
Slattenow, The Role of the Pipe-Water Interface in DBP Formation and Disinfectant Loss. 2000, AWWA Research Foundation and the American Water Works Association: Denver, CO.
118. Henderson, R., K. Carlson, and D. Gregory, The impact of ferrous ion reduction of
chlorite ion on drinking water process performance. Water Research, 2001. 35(18): p. 4464-4473.
104

119. Hurst, G.H. and W.R. Knocke, Evaluating ferrous iron for chlorite ion removal. Journal
of American Water Works Association, 1997. 89(8): p. 98-105. 120. Moore, E.R., A.E. Bourne, T.J. Hoppe, P.J. Abode, S.R. Boone, and G.H. Purser,
Kinetics and mechanism of the oxidation of iron(II) ion by chlorine dioxide in aqueous solution. International Journal of Chemical Kinetics, 2004. 36(10): p. 554-565.
105