use of carbon isotope analysis to understand semi-arid erosion dynamics and long-term semi-arid land...
TRANSCRIPT
RAPID COMMUNICATIONS IN MASS SPECTROMETRY
Rapid Commun. Mass Spectrom. 2008; 22: 1697–1702
) DOI: 10.1002/rcm.3514
Published online in Wiley InterScience (www.interscience.wiley.comUse of carbon isotope analysis to understand semi-arid
erosion dynamics and long-term semi-arid land
degradationy
Laura Turnbull1, Richard E. Brazier2*, John Wainwright1, Liz Dixon3 and Roland Bol3
1Sheffield Centre for International Drylands Research, Department of Geography, University of Sheffield, Winter St, Sheffield S10 2TN, UK2Department of Geography, University of Exeter, Amory Building, Rennes Drive, Exeter EX4 4RJ, UK3Cross Institute Programme for Sustainable Soil Function (SoilCIP), IGER, North Wyke Research Station, Okehampton EX20 2SB, UK
Received 26 February 2008; Accepted 26 February 2008
*CorrespoUniversitE-mail: r.yPresenteSpectromby the Inability (Isciences,Contract/ResearchDEB-0217
Many semi-arid areas worldwide are becoming degraded, in the form of C4 grasslands being replaced
by C3 shrublands, which causes an increase in surface runoff and erosion, and altered nutrient
cycling, which may affect global biogeochemical cycling. The prevention or control of vegetation
transitions is hindered by a lack of understanding of their temporal and spatial dynamics, particu-
larly in terms of interactions between biotic and abiotic processes. This research investigates (1) the
effects of soil erosion on the d13C values of soil organic matter (SOM) throughout the soil profile and
its implications for reconstructing vegetation change using carbon-isotope analysis and (2) the spatial
properties of erosion over a grass-shrub transition to increase understanding of biotic-abiotic
interactions by using d13C signals of eroded material as a sediment tracer. Results demonstrate that
the soils over grass-shrub transitions are not in steady state. A complex interplay of factors
determines the input of SOM to the surface horizon of the soil and its subsequent retention and
turnover through the soil profile. A positive correlation between event runoff and d13C signatures of
eroded sediment was found in all plots. This indicates that the d13C signatures of eroded sediment
may provide a means of distinguishing between changes in erosion dynamics over runoff events of
different magnitudes and over different vegetation types. The development of this technique using
d13C signatures of eroded sediment provides a new means of furthering existing understanding of
erosion dynamics over vegetation transitions. This is critical in terms of understanding biotic-abiotic
feedbacks and the evolution of areas subject to vegetation change in semi-arid environments.
Copyright # 2008 John Wiley & Sons, Ltd.
Semi-arid areas occupy approximately 17% of the global land
area.1 Many semi-arid areas have undergone desertification
and land degradation since the intensification of agriculture.
During the last 150 years in the south-western United States,
for example, large areas of semi-arid grasslands have been
replaced by arid shrublands.2. Replacement of grassland by
shrubland induces a change in surface processes, notably
increased runoff and erosion,3 and altered nutrient
cycling.4–6 The replacement of grassland by shrubland is
of major concern since it is thought that changes in nutrient
cycling may affect biogeochemical cycles, thus affecting
ecosystems and climate worldwide7 through atmosphere
and land-surface interactions. The enhanced soil erosion that
ndence to: R. E. Brazier, Department of Geography,y of Exeter, Exeter EX4 4RJ, [email protected] at the annual meeting of the Stable Isotopes Massetry Users’ Group (SIMSUG), 20–22 June, 2007, hostedstitute for Research on the Environment and Sustain-RES) and the School of Civil Engineering and Geo-Newcastle University, UK.grant sponsor: Biotechnology and Biological ScienceCouncil (BBSRC); contract/grant number: NSF award774.
occurs over shrublands is a major contributor to land
degradation and the loss of essential nutrients such as carbon
and nitrogen.8 Understanding the past dynamics of vege-
tation change is thus important in terms of understanding
ongoing vegetation change and associated degradation of the
land.
Use of carbon-isotope analysis of sediment eroded at
different stages over a grassland-to-shrubland transition
provides the opportunity to understand the origin of eroded
sediment, since the carbon isotope analysis of eroded
sediment will discriminate between SOM originating
from C4 or C3 vegetation which has changed over the last
150 years.2 Carbon-isotope analysis of eroded sediment to
trace the source of the sediment is not an entirely new
concept. Bellanger et al.21 employed carbon- and nitrogen-
isotope analysis of eroded soil organic carbon to identify and
monitor the sources of soil organic carbon in runoff waters in
a tropical mountainous environment. Their research was
based upon the assumption that constant organic carbon
fluxes are generated during soil erosion and that the isotopic
composition of displaced organic carbon does not vary with
time.21 Another example is that of Bird et al.22 who used the
d13C signature of particulate organic carbon in fluvial
Copyright # 2008 John Wiley & Sons, Ltd.

Figure 1. (a) Schematic of the experimental design,
whereby four study plots have been set up over the grass-
shrub ecotone, from the grass end-member, across two
transitions plots, to the shrub end-member. (b) Photographs
of the four plots located over the grass-shrub transition.
1698 L. Turnbull et al.
sediments to determine the photosynthetic pathway of
vegetation at the origin of the eroded sediment, to infer
changes in the extent of tropical forests on a basin-wide scale.
These studies have demonstrated that, in their relative
contexts, isotopic discrimination by C3 and C4 plants is
recorded in eroded sediment, and this provides a sound
justification for using carbon isotope analysis of eroded
sediment to explore soil erosion over a grass-shrub transition.
The technique of reconstructing semi-arid vegetation
change based on carbon-isotope analysis of soil organic
matter (SOM) has been demonstrated previously, e.g.9–12 The
use of carbon-isotope analysis to reconstruct vegetation
change is based upon the principle that C4 grasses are
enriched with 13C relative to C3 shrubs; therefore, C4 grasses
and C3 shrubs have characteristic d13C values. However, it
is well established that in most soils organic matter becomes13C-enriched with depth12 by approximately 1 to 3%13 due to
processes such as the systematic kinetic fractionation of the
carbon isotopes through time,14 although this can only
account in-part for the increase in d13C of SOM with depth.
Consequently, the carbon isotopic composition of SOM
largely reflects the carbon isotopic composition of plant
material from which it originated, making it an appropriate
indicator of the photosynthetic pathway of past vegetation.9
The isotopic discrepancy created by the vegetation change
will persist for a length of time determined by the SOM
turnover rate.15 Implicit in the reconstruction of vegetation
change and changing carbon stocks is the assumption that
the soil is not undergoing erosion or deposition of sediment
and that the changes are preserved in SOM throughout the
soil profile (e.g.12). However, this assumption is comprom-
ised in semi-arid environments undergoing vegetation
transitions since, typically, high levels of erosion result
in the redistribution of sediment and organic material
around the landscape.3,16 There has been some previous
recognition of the effects of soil erosion when reconstructing
vegetation change; for example, Biedenbender et al.17
suggested that evidence of a truncated soil profile from
d13C analysis and 14C dating of SOMmay be due to the loss of
SOM by erosion. However, no studies have yet adequately
addressed the effects of soil erosion on reconstructing
vegetation change using d13C analysis of SOM.
Research into erosion over grassland and shrubland has
shown that sediment detached in grassland is redistributed
locally, whereas in shrubland it is transported over much
greater distances3,16,18 because of a change in the cover and
distribution of vegetation and increased flow connectivity in
intershrub areas.3 Hence, it is clear from previous research
that soil erosion varies significantly over grassland and
shrubland in terms of the amount of erosion that takes place,
and the spatial variations of erosion processes. What remains
poorly understood, however, is how vegetation and soil
erosion change concurrently over a transition from grassland
to shrubland and to what extent soil conditions over the
grassland to shrubland transition diverge from the pre-
viously assumed ‘non-eroding landscape’. Therefore, the
objectives of this paper are twofold:
This figure is available in colour online at www.interscience.
(1) twiley.com/journal/rcm
Cop
o investigate the effects of soil erosion on the d13C values
of SOM throughout the soil profile and its implications
yright # 2008 John Wiley & Sons, Ltd.
for reconstructing vegetation change using carbon-
isotope analysis; and
(2) t
o investigate the spatial properties of erosion over agrass-shrub transition to increase understanding of
biotic-abiotic interactions by using d13C signals of eroded
material as a sediment tracer.
EXPERIMENTAL
Four study sites were set up over a grassland-to-shrubland
ecotone at the Sevilleta National Wildlife Refuge in New
Mexico, USA (348190N, 1068420W), that are assumed to be
representative of different stages of the grassland-
to-shrubland transition. Thus, the experimental design of
the field study employs the ergodic hypothesis where spatial
dynamics are representative of changes through time (Fig. 1).
Anecdotal accounts and historic photographs indicate that
the ecotone is dynamic, since over the past 150 years desert
shrubland has been encroaching northwards into the
desert grasslands.2 The ‘native’ grasslands are composed
primarily of C4 species (dominated by black grama, Bouteloua
eriopoda) and the ‘invading’ shrublands mainly comprise C3
Rapid Commun. Mass Spectrom. 2008; 22: 1697–1702
DOI: 10.1002/rcm
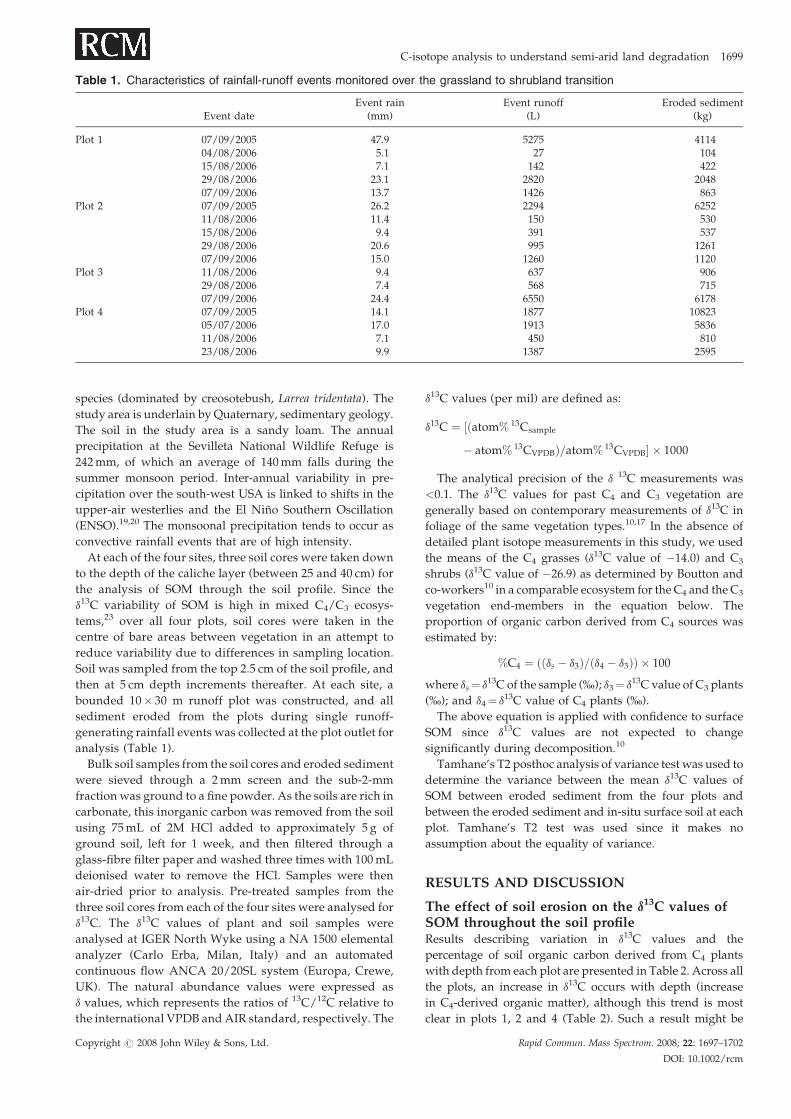
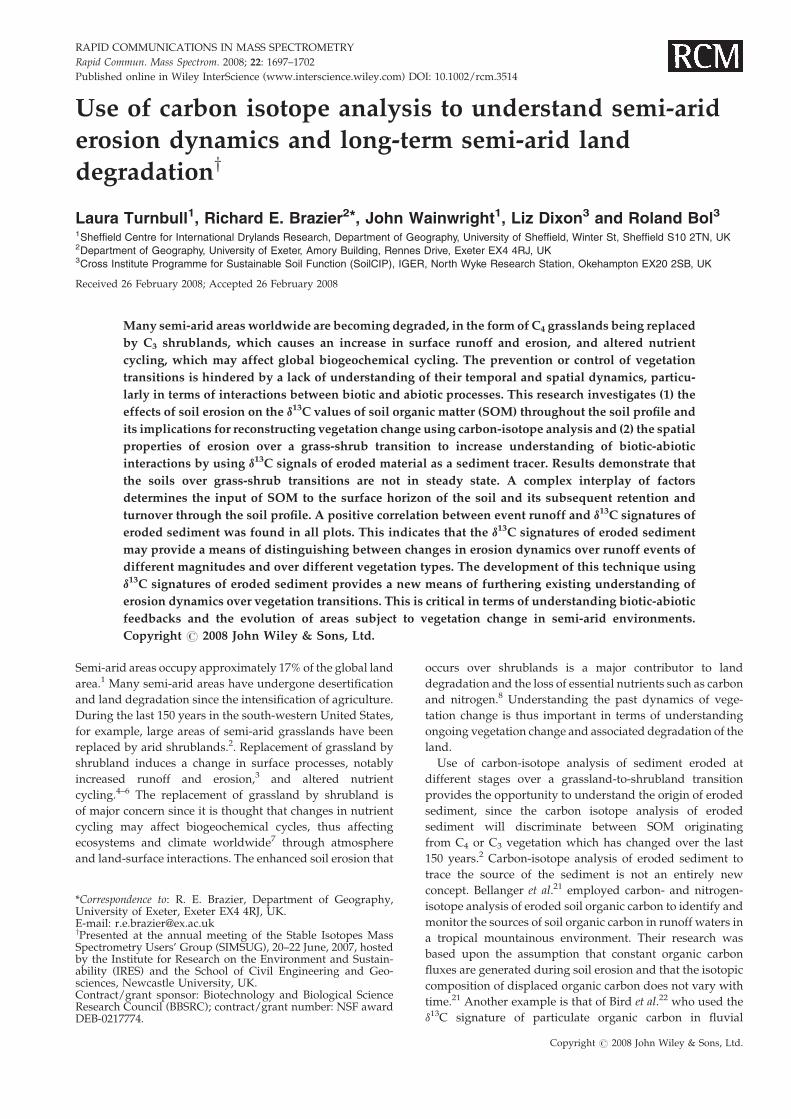
Table 1. Characteristics of rainfall-runoff events monitored over the grassland to shrubland transition
Event dateEvent rain
(mm)Event runoff
(L)Eroded sediment
(kg)
Plot 1 07/09/2005 47.9 5275 411404/08/2006 5.1 27 10415/08/2006 7.1 142 42229/08/2006 23.1 2820 204807/09/2006 13.7 1426 863
Plot 2 07/09/2005 26.2 2294 625211/08/2006 11.4 150 53015/08/2006 9.4 391 53729/08/2006 20.6 995 126107/09/2006 15.0 1260 1120
Plot 3 11/08/2006 9.4 637 90629/08/2006 7.4 568 71507/09/2006 24.4 6550 6178
Plot 4 07/09/2005 14.1 1877 1082305/07/2006 17.0 1913 583611/08/2006 7.1 450 81023/08/2006 9.9 1387 2595
C-isotope analysis to understand semi-arid land degradation 1699
species (dominated by creosotebush, Larrea tridentata). The
study area is underlain by Quaternary, sedimentary geology.
The soil in the study area is a sandy loam. The annual
precipitation at the Sevilleta National Wildlife Refuge is
242mm, of which an average of 140mm falls during the
summer monsoon period. Inter-annual variability in pre-
cipitation over the south-west USA is linked to shifts in the
upper-air westerlies and the El Nino Southern Oscillation
(ENSO).19,20 The monsoonal precipitation tends to occur as
convective rainfall events that are of high intensity.
At each of the four sites, three soil cores were taken down
to the depth of the caliche layer (between 25 and 40 cm) for
the analysis of SOM through the soil profile. Since the
d13C variability of SOM is high in mixed C4/C3 ecosys-
tems,23 over all four plots, soil cores were taken in the
centre of bare areas between vegetation in an attempt to
reduce variability due to differences in sampling location.
Soil was sampled from the top 2.5 cm of the soil profile, and
then at 5 cm depth increments thereafter. At each site, a
bounded 10� 30 m runoff plot was constructed, and all
sediment eroded from the plots during single runoff-
generating rainfall events was collected at the plot outlet for
analysis (Table 1).
Bulk soil samples from the soil cores and eroded sediment
were sieved through a 2mm screen and the sub-2-mm
fraction was ground to a fine powder. As the soils are rich in
carbonate, this inorganic carbon was removed from the soil
using 75mL of 2M HCl added to approximately 5 g of
ground soil, left for 1 week, and then filtered through a
glass-fibre filter paper and washed three times with 100mL
deionised water to remove the HCl. Samples were then
air-dried prior to analysis. Pre-treated samples from the
three soil cores from each of the four sites were analysed for
d13C. The d13C values of plant and soil samples were
analysed at IGER North Wyke using a NA 1500 elemental
analyzer (Carlo Erba, Milan, Italy) and an automated
continuous flow ANCA 20/20SL system (Europa, Crewe,
UK). The natural abundance values were expressed as
d values, which represents the ratios of 13C/12C relative to
the international VPDB and AIR standard, respectively. The
Copyright # 2008 John Wiley & Sons, Ltd.
d13C values (per mil) are defined as:
d13C ¼ ½ðatom% 13Csample
� atom% 13CVPDBÞ=atom% 13CVPDB� � 1000
The analytical precision of the d 13C measurements was
<0.1. The d13C values for past C4 and C3 vegetation are
generally based on contemporary measurements of d13C in
foliage of the same vegetation types.10,17 In the absence of
detailed plant isotope measurements in this study, we used
the means of the C4 grasses (d13C value of �14.0) and C3
shrubs (d13C value of �26.9) as determined by Boutton and
co-workers10 in a comparable ecosystem for the C4 and the C3
vegetation end-members in the equation below. The
proportion of organic carbon derived from C4 sources was
estimated by:
%C4 ¼ ððds � d3Þ=ðd4 � d3ÞÞ � 100
where ds¼ d13C of the sample (%); d3¼ d13C value of C3 plants
(%); and d4¼ d13C value of C4 plants (%).
The above equation is applied with confidence to surface
SOM since d13C values are not expected to change
significantly during decomposition.10
Tamhane’s T2 posthoc analysis of variance test was used to
determine the variance between the mean d13C values of
SOM between eroded sediment from the four plots and
between the eroded sediment and in-situ surface soil at each
plot. Tamhane’s T2 test was used since it makes no
assumption about the equality of variance.
RESULTS AND DISCUSSION
The effect of soil erosion on the d13C values ofSOM throughout the soil profileResults describing variation in d13C values and the
percentage of soil organic carbon derived from C4 plants
with depth from each plot are presented in Table 2. Across all
the plots, an increase in d13C occurs with depth (increase
in C4-derived organic matter), although this trend is most
clear in plots 1, 2 and 4 (Table 2). Such a result might be
Rapid Commun. Mass Spectrom. 2008; 22: 1697–1702
DOI: 10.1002/rcm

Table 2. Descriptive statistics of d13C values of eroded sediment and at increasing depth throughout the soil profile at each plot
Depth (cm)
Plot 1 Plot 2 Plot 3 Plot 4
Mean d13C� S.E. % C4 Mean d13C� S.E. % C4 Mean d13C� S.E. % C4 Mean d13C� S.E. % C4
Eroded sediment �21.0� 0.3|a 46� 2 �21.1� 0.5|b 45� 4 �21.4� 0.2|b 43� 2 �25.1� 0.5^b 14� 4(Surface sediment) 0–2.5 �19.5� 1.2a 57� 9 �18.1� 0.2a 68� 2 �16.9� 0.2a 78� 2 �21.9� 0.5a 39� 42.5–7.5 �17.4� 0.9 74� 7 �17.6� 0.3 72� 2 �16.2� 0.4 83� 3 �19.1� 0.4 60� 47.5–12.5 �16.6� 0.6 80� 5 �17.2� 0.3 75� 2 �15.6� 0.4 88� 3 �18.3� 0.8 67� 612.5–17.5 �16.4� 0.4 81� 3 �17.1� 0.8 76� 6 �15.6� 0.5 88� 4 �18.6� 0.9 64� 717.5–22.5 �15.8� 0.7 86� 5 �16.6� 0.7 80� 5 �16.1� 0.4 84� 3 �17.9� 0.8 70� 622.5–27.5 �15.1� 0.2 91� 2 �16.9� 0.9 78� 7 �15.1� 0.3 91� 2 �16.4 8127.5–32.5 �15.3� 0.4 90� 3 �16.0� 0.2 84� 232.5–37.5 �15.3� 0.2 90� 2 �16.0� 0.1 84� 1
|^Between-plot comparisons of mean d13C values of eroded sediment: mean d13C values of eroded sediment followed by the same symbol arenot significantly different (p< 0.05).a bWithin-plot comparison of mean d13C value of eroded sediment and mean d13C value of surface sediment: d13C values of soil and erodedsediment followed by the same letter are not significantly different (p¼<0.05).
1700 L. Turnbull et al.
expected as increases in the d13C with depth have been
observed in previous studies and have been primarily
attributed to factors such as systematic kinetic fractionation14
and the contribution ofmicrobial biomass to the soil matrix.12
The trends of increasing d13C of SOMat plot 1 are comparable
with the trends observed over grasslands in other studies,
e.g.10,12 Results from plot 2, which is predominantly
grass-covered with only a few creosotebush, suggest that
throughout the soil profile, the majority of organic matter
was C4-derived. Plot 3, which has a greater shrub cover and
only a sparse, fragmented grass-cover, had the highest
d13C values of soil organic matter observed for the top 15 cm
of the soil profile, and this changed only very slightly with
depth. Results from the top 2.5 cm (i.e. the most recent
organic matter inputs) of the soil profile at plot 3 suggest that
78� 2% of the soil organic carbon was derived from C4
species, indicating that primary productivity is from C4
species (i.e. black grama grass), which is in great contrast
with the visual observations of primary productivity as the
plot is partially covered by C3 shrubs (Fig. 1). It is plausible
that because shrubs do not occupy a great area within plot 3,
the influence of C3-derived organic matter has little effect on
the overall SOM content of the soil because of the remnants of
grass throughout the profile. The surface soils fromplot 3 had
higher d13C values than those from plot 1, implying that a
greater percentage of SOM input to the soil at plot 3 is derived
from C4 plants than plot 1, which is counter-intuitive. The
d13C signature of SOM in the surface horizon at plot 3 was
similar to the d13C signature of SOM found at a depth of 10 cm
at plot 1, which may indicate progressive erosion as shrubs
have invaded the grassland causing erosion of the A-horizon,
leaving older horizons (with a high d13C signature of SOM)
exposed at the surface. Over plot 4, the shrub end-member,
the lowest d13C values of SOM were measured, which is
probably due to the increase in shrub cover producing
more C3-derived organic matter. Furthermore, the increase in
shrub cover may impede the connectivity of flow, thereby
decreasing the potential for erosion relative to plot 3 and
consequently facilitating the incorporationofSOMinto the soil
profile.
The isotopic signatures and the estimated percentage of
organic C derived from C4 plants for the surface profiles over
Copyright # 2008 John Wiley & Sons, Ltd.
plots 1, 2, 3 and 4 do not match up with the visual
observations and the distribution of C3- and C4-derived SOM
throughout the soil profile from previous studies. Connin
et al.24 and Parsons et al.25 observed that replacement of the
grassland vegetation by shrubs can lead to a loss of surface
soil up to a depth of 20–40 cm, encompassing a loss of both
the A and the upper B soil horizons. Such rates of soil erosion
are comparable with rates from studies at the Sevilleta
National Wildlife Refuge27 and similar arid environments26
which indicates therefore that erosionmay be responsible for
the lack of comparability between profiles of d13C values
from plots 1 to 4.
The spatial properties of erosion over a grass-shrub transition using d13C signals of erodedmaterial as a sediment tracerThe mean d13C values of surface sediment and eroded
sediment from each plot are presented in Table 2. The
d13C (�25.1� 0.5) values of eroded sediment from plot 4 are
significantly different from those of eroded sediment from all
other plots (p� 0.05), with eroded sediments from plot 4
showing lower d13C characteristic of C3-derived sediment
(14� 4%). Within each plot, a means comparison of the
d13C of surface sediment and eroded sediment shows that
there are significant differences for all but plot 1 (p� 0.05). It
seems likely that the plot 1 sediments are sourced from the
younger surface soils, retained under the pristine grasslands.
The mixed story that is shown for plots 2 and 3 is less easy to
understand, although it might be assumed that such a signal
represents the erosion of sediments from soils rich in both C3
and C4 vegetation and from soils rich in C3 vegetation over
plot 4. It is plausible that although plot 3 has a greater shrub
cover than plot 2, the erosion of surface soil exposed older
soil horizons that are enriched in d13C (due to
d13C enrichment of SOM with depth). Thus, the input
of C3 SOM at plot 3 is outweighed by the enriched
d13C signatures of the soil surface. Therefore, from the
existing information it appears that more than one expla-
nation of where sediments are sourced from and why they
differ in isotopic signature from both the surrounding
vegetation and the soils is viable.
Rapid Commun. Mass Spectrom. 2008; 22: 1697–1702
DOI: 10.1002/rcm

Figure 2. The relationship between event erosion and the d13C signatures of eroded material for each plot. This figure is available
in colour online at www.interscience.wiley.com/journal/rcm
Figure 3. Concentration of runoff in inter-shrub areas lead-
ing to interill erosion. This figure is available in colour online at
www.interscience.wiley.com/journal/rcm
C-isotope analysis to understand semi-arid land degradation 1701
Figure 2 shows the relationship between the d13C signature
of eroded material and event erosion for all plots. There is a
positive linear relationship on plots 1, 3 and 4 between the
d13C signature of eroded material and the total amount of
event erosion (plot 1: R2¼ 0.95; plot 3: R2¼ 0.59; plot 4:
R2¼ 0.81). This positive relationship implies that with an
increase in runoff and erosion, the eroded sediment has a
higher d13C signature which is probably due to the increased
incision into older soil horizons, in accordance with
observations of increased runoff concentration in intershrub
areas and increased rilling in shrublands, e.g.16 (Fig. 3).
Where grasses predominate, the increase in the
d13C signature of eroded sediment could also be due to
the increased detachment and entrainment of soil rich in C4
SOM from grass patches. However, from these preliminary
Copyright # 2008 John Wiley & Sons, Ltd.
data, it is not possible to constrain exactly the processes
leading to the observed variations in d13C signatures of
eroded sediment over the grassland-to-shrubland transition.
CONCLUSIONS
Evidence in this paper has revealed the complexities of using
d13C signatures of SOM through the soil profile for studying
vegetation change and changes in carbon storage in an
environment where changes in erosion are a key abiotic
component of ecosystem change over a grassland-to-
shrubland transition. It is likely that biotic-abiotic feedbacks
over a grassland-to-shrubland transition do not follow a
linear trajectory.27 Therefore, at each stage of a grassland-
to-shrubland transition, a complex interplay of factors is
likely to determine the input of SOM to the surface horizon of
the soil and its subsequent retention and turnover through
the soil profile. As high rates of erosion have been observed
in degrading semi-arid landscapes over recent years (and
similar erosion is likely to have occurred over the last
150 years given the increases in erosion upon a transition to
shrubland), it is probable that current soil surfaces under
different vegetation types are of significantly different ages
and that, therefore, profiles through depth also represent
profiles through soils of different ages. Thus, reconstructions
of semi-arid vegetation change that neglect the role of erosion
and sediment deposition are fundamentally flawed.
An initial exploration using carbon isotope analysis to
explore the spatial properties of soil erosion over a grass-
shrub transition has revealed that there are distinct
differences in the isotopic signatures of eroded sediment
between plots 1 and 4 (representing the temporal transition
of grass to shrub dominated landscapes). The positive
correlation between event runoff and d13C signatures of
Rapid Commun. Mass Spectrom. 2008; 22: 1697–1702
DOI: 10.1002/rcm

1702 L. Turnbull et al.
eroded sediment that is consistent over plots 1, 3 and 4
indicates that the d13C signatures can be used to distinguish
between changes in erosion dynamics over events of
different magnitudes and over different vegetation types.
The next step in refining the d13C signatures of eroded
sediment with reference to their source is to undertake
d13C analysis of particle-size fractions of soil and eroded
sediment to derive more unique signatures.
This study has presented the problems associated with
erosion in reconstructing vegetation change in semi-arid
environments using d13C values of SOM. A key conclusion is
that further work is required, perhaps using 14C dating of
SOM to determine the time course of vegetation change to
ensure that comparisons of d13C signatures across the
ecotone are well constrained through time. 14C dating of
SOM through the soil profile alongside d13C analysis of SOM
will facilitate the past trajectory of vegetation change to be
determined even when soils are eroded, although gaps in the
historical record may persist due to prolonged periods of
erosion. This study has also demonstrated that there are
variations in d13C values of SOM in bulk eroded sediment
over different vegetation types and under runoff events of
different magnitudes, which provides a sound rationale for
methodological refinements to be made in order to improve
applications exploring the spatial dynamics of erosion using
d13C signatures of surface soil and eroded sediment.
AcknowledgementsThis research acknowledges support from the University of
Sheffield, IGER, which is grant aided by the Biotechnology
and Biological Science Research Council (BBSRC), NSF
award DEB-0217774 to the University of New Mexico for
Long-term Ecological Research and the University of Exeter.
We are also grateful to the anonymous referees for helpful
comments on a previous version of this manuscript.
REFERENCES
1. UNEP. World Atlas of Desertification. Edward Arnold:Sevenoaks, UK, 1992.
2. Buffington LC, Herbel CH. Ecol. Monographs 1965; 35: 139.3. Wainwright J, Parsons AJ, Abrahams AD. Hydrological Pro-
cesses 2000; 14: 2921.
Copyright # 2008 John Wiley & Sons, Ltd.
4. Brazier RE, Parsons AJ, Wainwright J, Powell DM, Schle-singer W. Biogeochemistry 2007; 82: 265.
5. Schlesinger WH, Abrahams AD, Parsons AJ, Wainwright J.Biogeochemistry 1999; 45: 21.
6. Schlesinger WH, Ward TJ, Anderson J. Biogeochemistry 2000;49: 69.
7. Schlesinger WH, Reynolds JF, Cunningham GL, HuennekeLF, Jarrell WM, Virginia RA,WhitfordWG. Science 1990; 247:1043.
8. Jackson RB, Banner JL, Jobbagy EG, PockmanWT, Wall DH.Nature 2002; 418: 623.
9. Boutton TW. Stable Carbon Isotope Ratios of Soil Organic Matterand Their Use as Indicators of Vegetation and Climate Change inMass Spectrometry of Soils, Boutton TW, Yamasaki S (eds).Marcel Dekker: New York, 1996.
10. Boutton TW, Archer SR, Midwood AJ, Zitzer SF, Bol R.Geoderma 1998; 82: 5.
11. Liao JD, Boutton TW, Jastrow JD. Soil Biol. Biochem. 2006; 38:3197.
12. Krull ES, Skjemstad JO, BurrowsWH, Bray SG,Wynn JG, BolR, Spouncer L, Harms B. Geoderma 2005; 126: 241.
13. Balesdent J, Mariotti A. Measurement of Soil Organic MatterTurnover Using 13CNatural Abundance, inMass Spectrometry ofSoils Boutton TW, Yamasaki S Editors 1996, Marcel Dekker:New York.
14. Wynn JG. Palaeogeography, Palaeoclimatology, Palaeoecology2007; 251: 437.
15. Boutton TW, Archer S, Midwood AJ. Rapid Commun. MassSpectrom. 1999; 13: 1263.
16. Parsons AJ, Abrahams AD, Wainwright J. Geomorphology1996; 14: 311.
17. Biedenbender SH, McClaren MP, Quade J, Weltz MA. Geo-derma 2004; 119: 69.
18. Abrahams AD, Parsons AJ, Wainwright J. Geomorphology1995; 13: 37.
19. Wainwright J. Adv. Environ. Monit. Modelling 2005;1: 39.
20. Dahm CN, Moore DI. The El Nino/Southern Oscillationphenomenon and the Sevilleta long-term ecological researchsite. In El Nino and Long-Term Ecological Research (LTER) Sites,Greenland D (ed). LTER Network Office, University ofWashington: Seattle, 1994; 12.
21. Bellanger B, Huon S, Velasquez F, Valles V, Girardin C,Mariotti A. Catena 2004; 58: 125.
22. Bird MI, Giresse P, Chivas AR. Limnology and Oceanography1994; 39: 1845.
23. Veldkamp E, Weitz AM. Soil Biol. Biochem. 1994; 26: 153.24. Connin SL, Virginia RA, Chamberlain CP. Oecologia 1997;
110: 374.25. Parsons AJ, Abrahams AD, Simanton JR. Journal of Arid
Environments 1992; 22: 107.26. Parsons AJ, Brazier RE, Wainwright J, Powell DM. Earth
Surface Processes and Landforms 2006; 31: 1384.27. Turnbull L, Wainwright J, Brazier RE. Ecohydrology 2008;
in press
Rapid Commun. Mass Spectrom. 2008; 22: 1697–1702
DOI: 10.1002/rcm