use of biological assessment in state water programs: focus on
TRANSCRIPT

®
Use of Biological Assessment
in State Water Programs:
Focus on Nutrients
October 2012
Association of Clean Water Administrators
1221 Connecticut Avenue, N.W., 2nd Floor
Washington, D.C. 20036
TEL: 202-756-0600
FAX: 202-756-0605
WWW.ACWA-US.ORG

TABLE OF CONTENTS
ACKNOWLEDGEMENTS & PURPOSE ................................................................................................. 3
EXECUTIVE SUMMARY & OVERVIEW .............................................................................................. 4
STATE/INTERSTATE RESPONSES
ALABAMA ................................................................................................................................................... 7
ALASKA ....................................................................................................................................................... 9
ARIZONA ................................................................................................................................................... 11
ARKANSAS ................................................................................................................................................ 13
CALIFORNIA .............................................................................................................................................. 15
COLORADO ................................................................................................................................................ 17
CONNECTICUT ........................................................................................................................................... 19
DELAWARE ................................................................................................................................................ 22
DELAWARE RIVER BASIN COMMISSION .................................................................................................... 24
DISTRICT OF COLUMBIA ............................................................................................................................ 26
FLORIDA .................................................................................................................................................... 29
GEORGIA ................................................................................................................................................... 31
HAWAII ..................................................................................................................................................... 33
IDAHO........................................................................................................................................................ 35
ILLINOIS .................................................................................................................................................... 37
INDIANA .................................................................................................................................................... 39
IOWA ......................................................................................................................................................... 40
KANSAS ..................................................................................................................................................... 43
KENTUCKY ................................................................................................................................................ 45
LOUISIANA ................................................................................................................................................ 48
MAINE ....................................................................................................................................................... 50
MARYLAND ............................................................................................................................................... 52
MASSACHUSETTS ...................................................................................................................................... 54
MICHIGAN ................................................................................................................................................. 59
MINNESOTA ............................................................................................................................................... 63
MISSISSIPPI ................................................................................................................................................ 67
MISSOURI .................................................................................................................................................. 69
MONTANA ................................................................................................................................................. 71
NEBRASKA ................................................................................................................................................ 74
NEVADA .................................................................................................................................................... 76
NEW HAMPSHIRE ...................................................................................................................................... 78
NEW JERSEY .............................................................................................................................................. 81
NEW MEXICO ............................................................................................................................................ 84
NEW YORK ................................................................................................................................................ 86
NORTH CAROLINA ..................................................................................................................................... 89
NORTH DAKOTA ........................................................................................................................................ 91
OHIO ......................................................................................................................................................... 93
OKLAHOMA ............................................................................................................................................... 95
OREGON .................................................................................................................................................... 98
PENNSYLVANIA ....................................................................................................................................... 100
RHODE ISLAND ........................................................................................................................................ 102
SOUTH CAROLINA ................................................................................................................................... 105
SOUTH DAKOTA ...................................................................................................................................... 108
TENNESSEE .............................................................................................................................................. 110
TEXAS ..................................................................................................................................................... 114
UTAH ....................................................................................................................................................... 119
VERMONT ................................................................................................................................................ 122
VIRGINIA ................................................................................................................................................. 125
WASHINGTON .......................................................................................................................................... 128
The Association of Clean Water Administrators
Page 1 of 138 | Use of Biological Assessment in State Water Programs: Focus on Nutrients

WEST VIRGINIA ....................................................................................................................................... 130
WISCONSIN .............................................................................................................................................. 132
WYOMING ............................................................................................................................................... 134
APPENDIX A: ACRONYMS .................................................................................................................. 137
The Association of Clean Water Administrators
Page 2 of 138 | Use of Biological Assessment in State Water Programs: Focus on Nutrients

ACKNOWLEDGEMENTS:
This report was assembled by the Association of Clean Water Administrators (ACWA) National
Office, coordinated by Environmental Program Manager Sara Vinson. We would like to extend
our appreciation to the state and interstate officials who took the time to complete ACWA’s
questionnaire. The Association acknowledges Paul E. Davis (retired, Tennessee Department of
Environmental Conservation (TDEC)) for his time and effort analyzing the questionnaire
responses and developing the report Executive Summary and Overview.
PURPOSE:
In October 2011, seventeen states participated in a workshop with the U.S. Environmental
Protection Agency’s Office of Water (EPA) to discuss the use of biological assessment, with
respect to nutrients, in state water programs. In preparation for the meeting, participating states
offered responses to a series of questions developed by ACWA to provide a baseline assessment
of each state’s biological assessment program. Following the meeting, ACWA determined it
would be valuable to collect this information from all states, as well as interstates and the District
of Columbia, as part of a continuing effort to promote a “rich mosaic” of innovative solutions to
the nation’s nutrient pollution problems, recognizing that numeric nutrient criteria are only one
tool in the nutrient reduction toolbox.
We are pleased to announce that this report consists of responses from every state, the District of
Columbia, and the Delaware River Basin Commission [hereinafter “state(s)”].
Please note that these documents are for REFERENCE USE ONLY. These responses do not
represent the full picture of each state’s criteria or standards program. Responses provided are at
a high level and meant to offer a general overview. For specific, detailed, or additional
information on a particular state’s program, please see the state’s designated contact(s). The
information in this report was current at the time each entity responded (between October 2011
and May 2012). Changes to state programs since the time of response are not reflected.
ACWA takes full responsibility for any errors or omissions. New information may be submitted
to ACWA Environmental Program Manager Susan Kirsch at [email protected]. As time and
resources allow, ACWA hopes to produce periodic updates to this report.
The Association of Clean Water Administrators
Page 3 of 138 | Use of Biological Assessment in State Water Programs: Focus on Nutrients
EXECUTIVE SUMMARY AND OVERVIEW:
This report consists of responses from every state, the District of Columbia, and the Delaware
River Basin Commission. The following provides a high level summary of responses ACWA
received, categorized by question.
Questions 1 & 2 asked respondents to discuss the relevant biological/ecological assessment work
their state is conducting and identify which indicators are being used or considered to assess
nutrient impairment of aquatic life.
Most states reported using some form of biological monitoring to assess their waters,
with macroinvertebrates predictably the most common indicators of aquatic life support.
Many states have developed indices of biological integrity (IBIs); some, such as Georgia,
have also developed nutrient-specific pollution tolerance indices. Fish are also widely
used, in combination with other measures, to assess waters.
Biomass is often measured, particularly in lakes and reservoirs. Many states reported
biological assessments based on algae, while others reported using periphyton, diatoms or
chlorophyll a. Michigan considers “nuisance algal conditions” and plant cover, but
acknowledged the subjectivity of such assessments. Some states use water clarity or
Secchi depth.
Several states noted the use of diurnal flux in dissolved oxygen as an indicator. For
example, Utah is studying measures of whole-stream metabolism: Gross Primary
Production and Community Respiration.
In Questions 3 & 4, respondents were asked about sensitivity of nutrients to the various
biometrics and the correlation of causal and response variables.
States generally reported limited ability to correlate nutrient concentrations in streams
with measurable effects. New Hampshire reported a weak relationship between Total
Phosphorus (TP) and macroinvertebrates in streams, but found “no indication that
macroinvertebrate communities respond to total nitrogen.” Further, Pennsylvania
observed that “drawing the correlations between the causal and response variables [for
streams] is difficult due to the confounding factors involved.” Maryland also referred to
“many confounding variables.”
New York and Tennessee documented relationships at the ecoregion level.
Massachusetts likewise found correlation to be site-specific, noting that “phosphorus and
nitrogen do not follow a typical dose-response relationship, as with toxic substances.
Rather, waterbody-specific factors such as detention time, color, depth, light availability,
Nitrogen/Phosphorus ratio, internal cycling, and local water chemistry also influence the
response of aquatic systems.”
Better correlation was reported for lentic conditions. Indiana found “moderately strong
correlation” between TP and chlorophyll a in lakes, Oklahoma found “[c]lear relations …
for reservoir chlorophyll a and nutrients,” and Florida saw a correlation not only in lakes,
but springs as well.
Other states reported that nutrients relate more to biomass than other response indicators,
or that they simply did not see any relationship.
The Association of Clean Water Administrators
Page 4 of 138 | Use of Biological Assessment in State Water Programs: Focus on Nutrients

Question 5 asked states how biological/ecological assessment information is used in combination
with chemical and physical data to make impairment decisions.
Generally, states treat nutrients differently than other pollutants when making listing
decisions. Many responders said they identify nutrient-impaired water by a combination
of biological conditions and nutrient concentrations.
Vermont said that, in contrast to most chemicals they monitor, nutrient criteria “have a
high likelihood of generating false positive impairment determination.” For Vermont,
“placement of a reach or lake on the list of impaired waters without direct biological
assessments is uncommon.” New Hampshire reported that “[f]or nutrients, the response
variable must exceed criteria for the nutrient parameter to be considered an impairment,”
but added that “[f]or other chemical measurements[, such as] pH, DO, toxics, …
independent applicability applies.” The Delaware River Basin Commission said that it
uses “a list of chemical/physical parameters for aquatic life use assessment, though these
results are secondary to the biological data in making impairment calls.” Illinois cites
“greater reliability of biological-assemblage data over water-chemistry measurements in
assessing attainment of Aquatic Life Use.”
States also acknowledged that if they had numeric criteria for nutrients, they would list
waters strictly on that basis. According to Iowa, “[a]vailable water quality data are
compared against applicable water quality standards criteria. Impairment listing can
occur independently on the basis of biological or water quality data, or from a
combination of both.” However, since their standards do not currently include numeric
criteria for nutrients, “nutrient monitoring data are not utilized to make aquatic life use
impairment determinations.”
The same principle applies to numeric biocriteria. Arizona reported that its “biocriteria
standard (like all their standards) is applied independently for assessments.” Likewise,
Ohio has biological criteria for fish and macroinvertebrates, which are the basis for listing
waters as impaired. Ohio then considers other information such as chlorophyll a and
dissolved oxygen in determining if nutrient enrichment is to be listed as the basis for
impairment.
Question 6 asked states if they consider biological assessment information when developing
NPDES permits.
Some respondents do not have National Pollutant Discharge Elimination System
(NPDES) authority, and thus this question does not apply to them. Most states that did
answer, however, reported either limited or no consideration of biological assessment
information when developing NPDES permits.
In other states, however, biological information does have a place in permitting. For
example, in Florida, “Biological data is assessed as part of the NPDES permit cycle to
provide reasonable assurance that the facility is, or is not, complying with criteria
designed to protect aquatic life use.” In addition, Michigan said that if there is evidence
of nuisance aquatic plant conditions downstream of an NPDES facility, that information
figures into permit decisions.
The Association of Clean Water Administrators
Page 5 of 138 | Use of Biological Assessment in State Water Programs: Focus on Nutrients

Some states included a discussion of how bioassessments may be required by permits.
For example, South Carolina said that many of its permits require one to four
upstream/downstream macroinvertebrate bioassessments per year, which are paid for by
the regulated entity, conducted by a certified laboratory, and reviewed by agency staff.
New Jersey allows permittees on listed waters to study whether their nutrients cause
impairment.
Following, please find a summary by state, along with helpful links and contact information.
The Association of Clean Water Administrators
Page 6 of 138 | Use of Biological Assessment in State Water Programs: Focus on Nutrients

Alabama Contact: Lynn Sisk, [email protected]
1. Please provide a brief overview of relevant biological/ecological assessment work your state
is conducting.
Alabama’s Water Quality Monitoring Strategy includes assessment protocols for
macroinvertebrate communities, fish communities, habitat, and periphyton in wadeable
streams. In addition, the state has initiated the development of a macroinvertebrate
community assessment and a fish community assessment for non-wadeable streams that
should be available for use within a couple of years.
2. Which biological indicators/parameters does your state use (or plan to use) to assess aquatic
life impacts due to nutrients?
Macroinvertebrate community assessment
Fish community assessment
Periphyton assessment
Chlorophyll a
3. How sensitive to nutrients have those indicators/parameters been? How did you determine
that?
Periphyton and chlorophyll a are somewhat sensitive to nutrient concentrations but are
also influenced by other factors such as substrate and light availability. In studies
conducted in support of nutrient TMDL development in the Cahaba River, AL found that
periphyton densities in shallow, open stretches of the river increased considerably when a
significant nutrient source was located upstream. In addition, the percent of the
macroinvertebrate community considered to be nutrient tolerant increased as nutrient
concentrations increased. Chlorophyll a concentrations in the embayed portions of
tributaries to reservoirs increase in response to increased nutrient loading from the
watershed. In the Sougahatchee Creek embayment of Yates Reservoir, a nutrient TMDL
determined that a reduction in total phosphorus from point and nonpoint sources in the
watershed was needed to reduce the growing season mean chlorophyll a concentration in
the embayment. The Index of Biotic Integrity is still under development for fish
community assessments in Alabama but it is suspected that fish communities will be
good indicators of nutrient enrichment.
4. During criteria development, how have you found the correlation between causal (chemical)
and response (biological/ecological) variables for nutrients? If so, what approach(es) has
your state used to refine those relationships (e.g., subcategorizing waters, adjusting the
frequency and duration components of the criteria, using a range of TN and TP values,
developing site-specific numeric criteria, streamlining site-specific criteria approaches, or
other approaches)? Please discuss challenges and successes you have experienced.
The Association of Clean Water Administrators
Page 7 of 138 | Use of Biological Assessment in State Water Programs: Focus on Nutrients

To date, Alabama has not been able to establish strong correlations between causal and
response variables, with a couple of notable exceptions. Alabama’s Rivers and
Reservoirs Monitoring Program has established a long history of chlorophyll a response
to changes in nutrient loading in large reservoirs. In general, reservoirs which receive
higher loads of total phosphorus have the highest mean growing season chlorophyll a
concentrations. For example, Weiss Lake on the Coosa River in northeast Alabama
receives nutrients (especially phosphorus) from naturally enriched soils and from various
point and nonpoint sources in the watershed. The reservoir is shallow and experiences
elevated chlorophyll a levels during the spring and summer. Harris Reservoir on the
Tallapoosa River is located in a different physiographic region with nutrient-poor soils
and chlorophyll a levels are much lower in the spring and summer. However, very little
correlation between measured phosphorus or nitrogen concentrations and chlorophyll a
concentrations exists beyond these general observations. In the Cahaba River, mentioned
earlier, nutrients were contributing to significant periphyton densities (algae) downstream
of an industrial wastewater source. Once the industrial source was removed the
periphyton densities declined.
The state is still evaluating data from its Rivers and Streams Monitoring Program to
determine if correlations can be established between causal and response variables in
wadeable streams. A project currently underway with researchers at Auburn University
is looking at biological, chemical, and physical data collected in 2010 from the
Tallapoosa River basin to determine if causal – response relationships can be identified.
5. How is your biological/ecological assessment information used in combination with chemical
and physical data to make impairment decisions?
Chemical and physical data are used to identify likely stressors when a macroinvertebrate
assessment results in a poor or very poor community rating. For example, nitrogen and
phosphorus concentrations at a location receiving a poor macroinvertebrate community
rating would be compared to concentrations at “least impaired” ecological reference sites
to determine if nitrogen or phosphorus was significantly elevated. In addition, periphyton
density information could be used to indicate if the macroinvertebrate habitat was
degraded.
6. Do you currently consider biological assessment information when developing NPDES
permits? If so, please describe how this is done.
Biological assessment information is generally not considered when developing NPDES
permits unless the applicant is seeking a §316a temperature variance. In those cases, the
applicant must submit biological community assessment information to demonstrate that
the variance will not result in significant harm. In a few other rare cases, biological
assessment data was required in NPDES permits to demonstrate that permit conditions
were protective of water quality standards.
The Association of Clean Water Administrators
Page 8 of 138 | Use of Biological Assessment in State Water Programs: Focus on Nutrients
Alaska
Contact: Nancy Sonafrank, [email protected]
1. Please provide a brief overview of relevant biological/ecological assessment work your state
is conducting.
Biological indices for macroinvertebrates have been developed for streams in two regions
of Alaska (i.e. Southeast and Southcentral). Limited baseline biological data including
macroinvertebrates, periphyton, diatoms and fish were collected for some regions, i.e.
Interior, Southwest) and on a facility specific basis for large mines.
Alaska is not planning to adopt biocriteria as water quality standards due to the limited
biological data (usually 3 years or less). Biological monitoring is used in permits and
nonpoint source assessments as to support standard water quality data in assessing the
status of the designated uses for aquatic life.
2. Which biological indicators/parameters does your state use (or plan to use) to assess aquatic
life impacts due to nutrients?
No waters have been listed as impaired for nutrients in Alaska. Biomonitoring is
generally not used for permits outside of the mining sector. Nonpoint source assessment
projects may (e.g. stormwater) or may not (e.g. heavy sport fishing recreation use) be
related to marginally related to nutrients.
3. How sensitive to nutrients have those indicators/parameters been? How did you determine
that?
This is unknown, since AK has not directly compared nutrient water quality parameters
with biomonitoring results.
4. During criteria development, how have you found the correlation between causal (chemical)
and response (biological/ecological) variables for nutrients? If so, what approach(es) has
your state used to refine those relationships (e.g., subcategorizing waters, adjusting the
frequency and duration components of the criteria, using a range of TN and TP values,
developing site-specific numeric nutrient criteria, streamlining site-specific criteria
approaches, or other approaches)? Please discuss challenges and successes you have
experienced.
AK has found correlations between persistent exceedances for water quality criteria for
petroleum and turbidity with macroinvertebrate and fish monitoring.
5. How is your biological/ecological assessment information used in combination with chemical
and physical data to make impairment decisions?
The Association of Clean Water Administrators
Page 9 of 138 | Use of Biological Assessment in State Water Programs: Focus on Nutrients

Biological information is used as supporting evidence that the designated use is impaired
in addition to exceeding the chemical based water quality criteria based level.
6. Do you currently consider biological assessment information when developing NPDES
permits? If so, please describe how this is done.
Biomonitoring is typically done for mining activity, both for pre-mine baseline data and
to monitoring reductions (or improvements) in the biological condition during the life of
the mine.
The Association of Clean Water Administrators
Page 10 of 138 | Use of Biological Assessment in State Water Programs: Focus on Nutrients

Arizona
Contact: Patti Spindler, [email protected]
1. Please provide a brief overview of relevant biological/ecological assessment work your state
is conducting.
Arizona DEQ (ADEQ) is conducting macroinvertebrate and habitat surveys currently as
part of targeted, reference condition and probabilistic surveys in our monitoring program.
Arizona Game and Fish Department (AGFD) participated in the Western Ecological
Monitoring and Assessment Program (EMAP) surveys 2000-04 and ADEQ participated
in the National Rivers and Streams survey of 2008-09. In addition, ADEQ obtained a
Regional Ecological Monitoring and Assessment Program (REMAP) grant to improve
the statewide perennial map and conduct an example probabilistic survey of one basin
using state sampling methods, producing 2 reports. A biocriteria standard was established
in our WQS in 2009 and ADEQ is now conducting 305b assessments using the new
standard, beginning in our 2010 Assessment report.
2. Which biological indicators/parameters does your state use (or plan to use) to assess aquatic
life impacts due to nutrients?
ADEQ has drafted a nutrient survey plan to collect macroinvertebrate, plant cover, stream
bottom habitat and chemical data by which to assess nutrient enrichment in streams,
using a narrative –weight of evidence approach. Parameters of interest include: pH, DO,
TN, TP, %algae & plant cover, macrophyte diversity, macroinvertebrate IBI score, pool
sediment/organic condition & presence of bloodworms. ADEQ is in the 2nd
year of a 5-
year study. ADEQ’s lakes program has established narrative/numeric standards for
chlorophyll-a and other nutrient-related parameters in a weight of evidence approach for
assessing nutrient enrichment in several lake types across AZ.
3. How sensitive to nutrients have those indicators/parameters been? How did you determine
that?
ADEQ has not evaluated the response yet.
4. During criteria development, how have you found the correlation between causal (chemical)
and response (biological/ecological) variables for nutrients? If so, what approach(es) has
your state used to refine those relationships (e.g., subcategorizing waters, adjusting the
frequency and duration components of the criteria, using a range of TN and TP values,
developing site-specific numeric nutrient criteria, streamlining site-specific criteria
approaches, or other approaches)? Please discuss challenges and successes you have
experienced.
The Association of Clean Water Administrators
Page 11 of 138 | Use of Biological Assessment in State Water Programs: Focus on Nutrients

ADEQ’s Lakes program has conducted multivariate analyses and published a study on
nutrient dynamics in AZ lakes.1 Based on this study, numeric targets for 5 lake types and
9 parameters were developed and placed in our WQS. This has not been done for streams
at this time.
5. How is your biological/ecological assessment information used in combination with chemical
and physical data to make impairment decisions?
ADEQ’s biocriteria standard (like all ADEQ standards) is applied independently for
assessments.
6. Do you currently consider biological assessment information when developing NPDES
permits? If so, please describe how this is done.
ADEQ has included bioassessment in several Arizona Pollutant Discharge Elimination
System (AZPDES) permits for large mines, where impacts to the aquatic life in
downstream perennial wadeable streams is of concern. The bioassessment is conducted as
part of a receiving water ambient monitoring requirement rather than a permit condition.
1 Study available here: http://www.azdeq.gov/environ/water/standards/download/draft_nutrient.pdf
The Association of Clean Water Administrators
Page 12 of 138 | Use of Biological Assessment in State Water Programs: Focus on Nutrients
Arkansas
Contact: Steve Drown, [email protected]; Mo Shafii,
1. Please provide a brief overview of relevant biological/ecological assessment work your state
is conducting.
Lentic
Arkansas Department of Environmental Quality (ADEQ), in conjunction with Beaver
Water District and United States Geological Survey (USGS), completed an extensive
study of Beaver Lake in north Arkansas. The completion of the project through extensive
hydrological and limnological modeling produced
Arkansas recently completed evaluation of Type C and D (lowland) reference lakes and
is currently investigating Type B (upland) reference reservoirs. Investigations of these
least-disturbed lakes were began with the intention of developing water quality standards
for lakes at the ecoregion level.
Lotic
Upper Saline River Pilot Study (USPS) was completed in 2010. This pilot study was the
“Draft Evaluation Protocol for Assessing Nutrient Indicators for Streams and Rivers of
the Upper Saline River Watershed, Arkansas.” The purpose of the pilot study was to test
and refine methodologies outlined in the State of Arkansas Nutrient Criteria
Development Plan. Currently, no other nutrient based lotic studies are ongoing.
2. Which biological indicators/parameters does your state use (or plan to use) to assess aquatic
life impacts due to nutrients?
Lentic
The Department is currently using Secchi depth, chlorophyll a, and dissolved oxygen
profiles (vertical and diurnal).
Lotic
A suite of periphyton, macroinvertebrate, and fish assemblage metrics, in conjunction
with extensive physical and chemical assessments will be used to evaluate systems.
3. How sensitive to nutrients have those indicators/parameters been? How did you determine
that?
Lentic
See response below.
Lotic
Results of the USPS correlation tests indicated that four of eight fish metrics and eight of
twenty-three macroinvertebrate metrics had significant (p<0.05) relationship with a given
The Association of Clean Water Administrators
Page 13 of 138 | Use of Biological Assessment in State Water Programs: Focus on Nutrients

nutrient constituent. Seventy-five percent of fish metrics (3 of 4) were most correlated to
phosphorus concentrations. While 63% of macroinvertebrate metrics were most
correlated to nitrate+nitrite nitrogen. Both fish and macroinvertebrate metrics which
were correlated were those described in literature as being most indicative and predictive
of nutrient enrichment.
4. During criteria development, how have you found the correlation between causal (chemical)
and response (biological/ecological) variables for nutrients? If so, what approach(es) has
your state used to refine those relationships (e.g., subcategorizing waters, adjusting the
frequency and duration components of the criteria, using a range of TN and TP values,
developing site-specific numeric nutrient criteria, streamlining site-specific criteria
approaches, or other approaches)? Please discuss challenges and successes you have
experienced.
Lentic
Extensive limnological models which focused on stochastic variability were used by
USGS, ADEQ, and Beaver Water District for Beaver Lake to look at chlorophyll a and
Secchi depth, as related to total phosphorus concentrations. As lentic environments are
drastically more stable and predictable compared to lotic systems, empirical model
development and correlative approaches were effective in Beaver Lake criteria
development. Total phosphorus and total nitrogen targets, not criteria, were
recommended.
Arkansas has yet to adopt numeric nutrient criteria.
Lotic
Arkansas has yet to adopt numeric nutrient criteria.
5. How is your biological/ecological assessment information used in combination with chemical
and physical data to make impairment decisions?
Waterbodies impaired based upon chemical and physical may be later assessed with
biological assessments to determine if indeed physical and chemical exceedances are
impacting aquatic life designated uses.
6. Do you currently consider biological assessment information when developing NPDES
permits? If so, please describe how this is done.
In general, there is no consideration for biological assessments unless they pertain to
threatened or endangered species.
The Association of Clean Water Administrators
Page 14 of 138 | Use of Biological Assessment in State Water Programs: Focus on Nutrients

California
Contact: Karen Larsen, [email protected]
1. Please provide a brief overview of relevant biological/ecological assessment work your state
is conducting.
The California State Water Resources Control Board’s (CA State Water Board) Surface
Water Ambient Monitoring Program (SWAMP) conducts a statewide perennial streams
assessment using biological and habitat assessment methods. Indicators include benthic
macroinvertebrates, algae, and physical habitat measures. Approximately 100 sites are
assessed annually and are selected using a probabilistic study design. The study is
designed to assess condition of perennial wadeable streams (i.e., number of streams miles
in good, degraded or very degraded condition), to compare condition among streams
based on predominant land use types, evaluate trends in condition over time, and to
provide context for targeted monitoring and assessment. There also are regional programs
in Southern California and the San Francisco Bay area that are designed to nest within the
statewide program. This allows the statewide program to utilize data collected at the
regional level for statewide assessments.
In addition, SWAMP established a reference condition management program. An expert
panel was convened in 2007 to develop a science-based plan for establishing and
managing a pool of reference sites for the State. To date, the State has established a pool
of over 600 reference sites, which provide coverage across the wide variety of natural
gradients in the State. One notable exception is the Central Valley floor, where streams
are so highly modified, reference sites do not exist.
2. Which biological indicators/parameters does your state use (or plan to use) to assess aquatic
life impacts due to nutrients?
The CA State Water Board currently is initiating the process to develop a nutrient policy
for inland surface waters. The nutrient policy could include objectives and control
strategies to help improve water quality in aquatic habitats by providing the benchmarks
that describe conditions necessary to protect beneficial uses. The State Water Board
intends to develop narrative nutrient objectives, with numeric guidance to translate the
narrative objectives. This numeric guidance, could include the Nutrient Numeric
Endpoint (NNE) framework which establishes numeric endpoints based on the response
of a water body to nutrient overenrichment. Indicators used include nutrient
concentrations, algal biomass (chlorphyll a), dissolved oxygen, temperature, biological
community structure, and physical habitat measures (e.g., shading).
3. How sensitive to nutrients have those indicators/parameters been? How did you determine
that?
The CA State Water Board currently is conducting a study to assess these indicators for
sensitivity to nutrient impacts. The study will document the linkage between algal
The Association of Clean Water Administrators
Page 15 of 138 | Use of Biological Assessment in State Water Programs: Focus on Nutrients

biomass, pH, and dissolved oxygen to aquatic life uses measure using benthic
macroinvertebrate and algal indices of biological integrity. The algae IBI, in particular,
will be used to determine whether more precise, and possibly more cost effective,
indicators of stream function can be identified (e.g., macroalgae cover).
4. During criteria development, how have you found the correlation between causal (chemical)
and response (biological/ecological) variables for nutrients? If so, what approach(es) has
your state used to refine those relationships (e.g., subcategorizing waters, adjusting the
frequency and duration components of the criteria, using a range of TN and TP values,
developing site-specific numeric nutrient criteria, streamlining site-specific criteria
approaches, or other approaches)? Please discuss challenges and successes you have
experienced.
The NNE tools provide scoping level analyses of nutrient targets. The challenge is that
there is high variability in chlorophyll a concentrations so there is need to establish site
specific targets for stream segments. The CA State Water Board are using case studies in
streams impaired for nutrient enrichment to determine site-specific relationships between
nutrients and response variables. The State also needs to conduct further studies to
address downstream estuary response variables to determine upstream nutrient targets.
5. How is your biological/ecological assessment information used in combination with chemical
and physical data to make impairment decisions?
The Policy for Developing California’s Clean Water Act Section 303(d) List allows water
bodies to be listed as impaired based on the index of biological integrity; however, the
listing must be associated with a chemical contaminant that has exceeds water quality
objectives (narrative or numeric). The CA State Water Board currently is in the process
of developing biological objectives. It is likely that the California’s 303(d) listing policy
will need to be amended to incorporate the new biological objectives.
6. Do you currently consider biological assessment information when developing NPDES
permits? If so, please describe how this is done.
Some of the CA Regional Water Quality Control Boards have included biological
assessment monitoring requirements in NPDES permits. However, the requirements are
exploratory in nature and designed to provide information for future policy development.
The CA State Water Board currently is in the process of developing biological objectives
(criteria) that will describe how biological monitoring should be used for assessing
compliance with NPDES permits.
The Association of Clean Water Administrators
Page 16 of 138 | Use of Biological Assessment in State Water Programs: Focus on Nutrients

Colorado Contact: Sarah Johnson, [email protected]
1. Please provide a brief overview of relevant biological/ecological work your state is
conducting.
Colorado Department of Public Health and Environment (CDPHE) has developed a
macroinvertebrate-based multimetric index (MMI) that is used for direct assessment of
biological condition of Colorado’s rivers and streams. The MMI is a general indicator of
biological condition and Colorado has not used it in the context of stressor identification.
Colorado has also adopted (in policy, not rule) MMI-based numeric thresholds for
aquatic life use attainment for streams with watershed less than 2,700 mi2.
Colorado’s MMI and the thresholds are described in WQCC Policy 10-1 and appendices
which can be found at
http://www.cdphe.state.co.us/op/wqcc/StatutesRegsPolicies/wqpol.html
2. Which biological indicators / parameters does your state use (or plan to use) to assess aquatic
life use impacts due to nutrients?
Colorado has not established (or proposed) any biological indicators for use specifically
or impacts due to nutrients. CDPHE is using the MMI (see above) and Total Taxa in
conjunction with nutrient concentrations to quantify the general stressor-response
relationship between nutrients and aquatic condition (using Quantile regression).
3. How sensitive to nutrients have those indicator/parameters been? How did you determine
that?
Our assessment is that there is a significant stressor-response relationship between
nutrients and aquatic condition in rivers and streams, using the log of TP and TN
concentration and the 90th quantile.
4. During criteria development, how have you found the correlation between causal (chemical)
and response (biological/ecological) variables for nutrients? If so, what approach (es) has
your state used to refine those relationships (e.g., subcategorizing waters, adjusting the
frequency and duration components of the criteria, using a range of TN and TP values,
developing site-specific numeric nutrient criteria, streamlining site-specific criteria
approaches, or other approaches)? Please discuss challenges and successes you have
experienced.
CDPHE already has subcategories of waters – warm vs cold. CDPHE also has the
regulatory flexibility / processes set up to provide opportunity for site-specific numeric
criteria. CDPHE has not anticipated what sort of evidence needs to be provided to
support adoption of site-specific criteria.
The Association of Clean Water Administrators
Page 17 of 138 | Use of Biological Assessment in State Water Programs: Focus on Nutrients
For water quality-based effluent limit calculation, CDPHE proposes to use a 1 in 5 yr
exceedance frequency and establish the critical low flow as the median of the July 1-
October 31 daily average flow that can be expected in the second driest year in 5 years.
That represents the post-runoff base flow that is expected to occur when aquatic
community metabolism are highest (summer and fall).
5. How is your biological/ecological assessment information used in combination with chemical
and physical data to make impairment decisions?
Where MMI scores fall below the aquatic life thresholds (see #1 above) and there is no
known pollutant, the waterbody is included on the 303(d) list as “Provisionally
Impaired”. Where there is a known pollutant, the waterbody is listed as “Impaired”.
Waters that are listed as “Provisionally Impaired” are targeted for monitoring and
assessment to determine if the impairment is caused by a pollutant or pollution. If it is
determined that it is caused by pollution, the waterbody would then moved to the
Integrated Report Category 4c list.
6. Do you currently consider biological assessment information when developing NPDES
permits? If so, please describe how this is done.
No.
The Association of Clean Water Administrators
Page 18 of 138 | Use of Biological Assessment in State Water Programs: Focus on Nutrients

Connecticut Contact: Traci Iott, [email protected]
1. Please briefly describe your biological/ecological assessment program and its goals. Please
discuss what indicator/parameters your state uses to assess aquatic life impacts due to
nutrients.
Connecticut Department of Energy and Environmental Protection (CT DEEP) believes
that developing nutrient criteria and establishing regulatory control programs must be
focused on anthropogenic sources of nutrients and their effects on the biological integrity
of affected surface waters. Based on work CT DEEP has conducted to date, they are
focusing on nutrient loading inputs on a watershed scale, not concentration based criteria.
Additionally, CT DEEP recognizes that the effect of nutrients on biological communities
is not linear and is strongly impacted by other considerationssuch as habitat and stream
morphology. For that reason, CT DEEP is working to evaluate nutrients in a manner to
allow for the site-specific development of appropriate nutrient loading targets for
individual watersheds within the State tied to the response of the biological community.
Freshwater:
Connecticut is in the process of developing phosphorus criteria for freshwater wadable
rivers and streams based on biological responses as observed in the periphyton
community. The periphyton community is a complex mixture of algae, bacteria and fungi
which responds to varying stream conductions including nutrient loads. As primary
producers, changes in the periphyton community provides a direct measurement of
biological response to nutrients, among other factors, and can respond to changing water
quality conditions more rapidly that secondary communities such as benthic invertebrates
and fish. Connecticut has incorporated the use of a statistical technique, Threshold
Indicator Taxa Analysis (TITAN), to evaluate shifts within the species composition
within the periphyton community in response to varying Enrichment Factors. The
Enrichment Factors are derived using a GIS based analysis to determine the
anthropogenic loadings of phosphorus to each watershed in the State. A target
Enrichment Factor is determined based on the threshold of species composition change
within the periphyton community. This target Enrichment Factor is then used to develop
necessary loading reductions in phosphorus throughout the watershed to promote
attainment of a healthy periphyton community within watersheds affected by excessive
loadings of anthropogenic-based phosphorus. As part of this effort, Connecticut is
collecting physical, chemical, and biological data including measurements of habitat
quality, general chemistry, nutrient concentrations, and data on the periphyton, benthic
and fish communities.
Marine:
Connecticut, together with the State of New York, developed a TMDL for Long Island
Sound, approved by EPA in 2001, to address aquatic life impairments due to low
dissolved oxygen levels caused by excessive nitrogen loading. Necessary reductions in
nitrogen loading were determined using the LIS 3.0 Model and implemented into a
The Association of Clean Water Administrators
Page 19 of 138 | Use of Biological Assessment in State Water Programs: Focus on Nutrients

general permit for wastewater treatment plant facilities. Dissolved oxygen level is
currently the indicator parameter that is used to relate improvements in the aquatic life
community as it is directly tied to the identification of impairments. However, extensive
physical, chemical and biological sampling is conducted within the Sound including the
analysis of general chemistry parameters, nutrients, and the phytoplankton community.
Connecticut is seeking to use these data to develop a program for derivation of nutrient
criteria for Long Island Sound. Additionally, CT DEEP is supporting research efforts to
evaluate the potential impacts to eelgrass communities based on nutrient load inputs. This
information will also be considered in any future efforts for criteria derivation.
2. What other aspects of your program do you consider important for informing the assessment
of water quality for nutrients (e.g., designated uses and sub-categories of uses, monitoring
strategies, quality and abundance of data)?
Our water quality programs are focused on the established designated uses for each water
body, such as restoration of maintenance of a health aquatic life community or
recreational opportunities, for example. Therefore, our efforts to determine acceptable
ambient levels of nutrients will be tied to these designated uses. Existing monitoring data
is used where available and plans to collect additional information developed to support
an evaluation of biologically based criteria for anthropogenic nutrient loadings. As with
any program, there is a challenge to collect sufficient quantity and quality of data to
support a robust and meaningful program. This is affected by both staffing and funding
levels and relies on flexibility to shift resources from various program areas to maintain
progress on nutrient criteria development and interim nutrient control strategies.
In addition to the obvious challenges of deriving appropriate scientifically based water
quality criteria, a strong partnership with the permitted community and other affected
stakeholders both within and outside the agency is key to achieving progress on
establishing appropriate nutrient thresholds and achieving necessary reductions.
3. Has your state tried to reduce the potential incongruity in causal and response nutrient
variables at the criteria development stage? That is, has your state tried to develop site-
specific numeric nutrient criteria by subcategorizing waters, adjusting the frequency and
duration components of the criteria, using a range of TN and TP values, streamlining site-
specific criteria approaches, or other approaches? If so, please speak to the challenges and
successes you have had.
CT DEEP is focusing a development of a consistent approach to deriving acceptable
nutrient conditions within surface waters but an approach which can be applied to yield
site-specific results. It is our intention to have watershed specific criteria and do not
expect to adopt any statewide values. Our successes have been in developing a
scientifically sound and technically robust approach to evaluating the effect of
anthropogenic nutrient loadings within target watersheds. CT DEEP has had success in
explaining this method to affected stakeholders who prefer that their regulatory
requirements reflect that which is necessary for achieving appropriate local water quality.
The challenge CT DEEP has had is gaining acceptance of this method from EPA which
has been focused on application of generic, statistically derived values within broad areas
The Association of Clean Water Administrators
Page 20 of 138 | Use of Biological Assessment in State Water Programs: Focus on Nutrients

of the country and has identified a concern that extensive use of site-specific approaches
may prove to be difficult for timely review. Through committed dialog and effort,
Connecticut and EPA Region 1 staff have been able to move forward on Connecticut’s
proposed interim approach; however, it is unclear if such an approach will satisfy
national concerns in the long term.
4. How do you envision enhancing/refining your biological/ecological assessment program to
address future environmental challenges?
CT DEEP intends to continue to use a biologically and watershed based approach to
establishing acceptable anthropogenic loadings of nutrients to Connecticut waters which
will support attainment and maintenance of established designated uses. CT DEEP is
most active currently in the development of freshwater phosphorus criteria for wadable
stream and rivers but intend to move on to evaluate phosphorus in other freshwater
habitats, such as lakes and impoundments, as well nitrogen within marine waters. CT
DEEP intends to work closely with EPA on these issues and seek funding and other
assistance to support our efforts.
The Association of Clean Water Administrators
Page 21 of 138 | Use of Biological Assessment in State Water Programs: Focus on Nutrients

Delaware
Contact: David Wolanski, [email protected]
1. Please provide a brief overview of relevant biological/ecological assessment work your state
is conducting.
Delaware has a long standing program that uses biological assessments to look at
biological communities and compare communities to reference/best available
communities. That data is used to look at overall aquatic life impacts in waters of the
state.
2. Which biological indicators/parameters does your state use (or plan to use) to assess aquatic
life impacts due to nutrients?
Delaware has been using macroinvertebrates as its main indicator since 1991. Studies
were performed over a 5 year period using periphyton but were discontinued due to lack
of correlation with nutrients. Delaware is planning a pilot study this summer to look at
fish as indicators.
3. How sensitive to nutrients have those indicators/parameters been? How did you determine
that?
Delaware has worked with statisticians to look at links between nutrients and biological
communities under the auspices of the Nutrient Scientific Technical Exchange
Partnership (NSTEPS) program. Connections between nutrients and the biological
community were extremely weak or nonexistent due to a lack of true reference conditions
in the state and possibly other factors.
4. During criteria development, how have you found the correlation between causal (chemical)
and response (biological/ecological) variables for nutrients? If so, what approach(es) has
your state used to refine those relationships (e.g., subcategorizing waters, adjusting the
frequency and duration components of the criteria, using a range of TN and TP values,
developing site-specific numeric nutrient criteria, streamlining site-specific criteria
approaches, or other approaches)? Please discuss challenges and successes you have
experienced.
Delaware is unable to demonstrate an obvious cause/effect relationship at this time. See
the answer to #3 above.
5. How is your biological/ecological assessment information used in combination with chemical
and physical data to make impairment decisions?
Delaware has used the biological assessments and physical habitat assessments to make
listing decisions, for biological or habitat degradation, for waters where the
communities/physical characteristics were significantly different from the reference
The Association of Clean Water Administrators
Page 22 of 138 | Use of Biological Assessment in State Water Programs: Focus on Nutrients

conditions. This has led to considerable challenges in determining the exact cause or
source of the biological impairments. EPA, via Tetratech, is presently working on a
stressor ID analysis in a Delaware watershed using biological, physical habitat and
chemical analysis.
6. Do you currently consider biological assessment information when developing NPDES
permits? If so, please describe how this is done.
No
The Association of Clean Water Administrators
Page 23 of 138 | Use of Biological Assessment in State Water Programs: Focus on Nutrients

Delaware River Basin Commission
(Interstate – NY, NJ, PA, DE) Contact: Thomas Fikslin, [email protected]
1. Please provide a brief overview of relevant biological/ecological assessment work your state
is conducting.
The Delaware River Biomonitoring Program samples the Delaware River annually at 25
sites, with occasional sampling of large tributaries. Nutrient gradients are among the
stressors examined for biological response in the macroinvertebrate and periphyton
assemblages. The Delaware River Basin Commission (DRBC) also conducted an algal
response to nutrients study using Matlock periphytometers.
2. Which biological indicators/parameters does your state use (or plan to use) to assess aquatic
life impacts due to nutrients?
DRBC uses macroinvertebrates, diatoms, and soft algae metrics of diversity, abundance,
balance, and pollution tolerance. DRBC also uses Chlorophyll a and ash-free dry mass.
3. How sensitive to nutrients have those indicators/parameters been? How did you determine
that?
Macroinvertebrate indicators appear to be indirectly associated with increased nutrients,
though the data are noisy. DRBC observed more direct and less variable response from
selected algal metrics, using both longitudinal plots of algal metrics vs. nutrient
concentrations; and statistical comparison of diatom response to increased nutrients
during the Matlock study.
4. During criteria development, how have you found the correlation between causal (chemical)
and response (biological/ecological) variables for nutrients? If so, what approach(es) has
your state used to refine those relationships (e.g., subcategorizing waters, adjusting the
frequency and duration components of the criteria, using a range of TN and TP values,
developing site-specific numeric nutrient criteria, streamlining site-specific criteria
approaches, or other approaches)? Please discuss challenges and successes you have
experienced.
DRBC has not yet reached the point of numeric criteria for nutrients or the biological
variables. The Matlock study was informative, and seemed to indicate a nutrient
threshold related to dominance and relative abundance of high-nutrient and low-nutrient
diatom taxa, but too few samples were taken to reveal a clear threshold.
Macroinvertebrate data have not been analyzed extensively for nutrient responses, though
DRBC intends to apply A.J. Smith’s (NYSDEC) methodology. In short, DRBC needs to
conduct more data analyses and increase the number of samples at each location. The
most challenging aspects of criteria development are: 1. The indirect pathways of
The Association of Clean Water Administrators
Page 24 of 138 | Use of Biological Assessment in State Water Programs: Focus on Nutrients

biological response to increased nutrients, and 2. The difficulty of conducting in-stream
experimental studies with sufficient statistical power to overcome natural variability of
both nutrients and biological indicators. The common approach of relating nutrients to
benthic or water column chlorophyll concentrations simply has not worked. Chlorophyll
a is extremely variable and does not appear to directly respond to nutrient concentrations.
5. How is your biological/ecological assessment information used in combination with chemical
and physical data to make impairment decisions?
DRBC applies an Index of Biological Integrity (multi-metric approach) to determine
aquatic life use impairment. DRBC also uses a list of chemical / physical parameters for
aquatic life use assessment, though these results are secondary to the biological data in
making impairment calls. See DRBC’s integrated assessment methodology.
6. Do you currently consider biological assessment information when developing NPDES
permits? If so, please describe how this is done.
For some permits, especially those involving a TDS limit determination, DRBC requires
before/after and upstream/downstream biological monitoring. Iterative use of the BACI
(Before/After Control/Impact) approach reveals that if the TDS limit is set too high,
DRBC will see a decline in macroinvertebrate community metrics. Similar studies are
sometimes conducted for other types of NPDES permits, especially in high-quality
streams.
The Association of Clean Water Administrators
Page 25 of 138 | Use of Biological Assessment in State Water Programs: Focus on Nutrients

District of Columbia
Contact: Shah Nawaz (DDOE), [email protected]
1. Please provide a brief overview of relevant biological/ecological assessment work your state
is conducting.
The District Department of the Environment (DDOE) relies on biological/habitat data
and chemical/physical standards to make aquatic life use (Class C) support decisions.
Streams are evaluated using both conventional pollutant data and biological data.
The District uses a combination of the US EPA Rapid Bioassessment Protocols and
the Maryland Biological Stream Survey (MBSS) to conduct benthic
macroinvertebrate and physical habitat assessments.
Fish tissue studies are conducted to determine the use support for Class D human
health criteria. This data is also used to issue fish consumption advisories for fish
caught in waters within the boundary of the District of Columbia.
The biological effects-based approach which focuses on measuring chemical impacts
such as toxicity and/or fish tissue contamination data used to issue advisories.
Biological Integrity class scores are determined using scoring criteria developed by
the District using Maryland coastal plain and piedmont as reference streams. Habitat
assessments were compared directly to each ecoregions’ corresponding reference
condition habitat evaluation.
The attainable level of biological integrity for any water is the state’s determination
involving public participation.
2. Which biological indicators/parameters does your state use (or plan to use) to assess aquatic
life impacts due to nutrients?
Water quality criteria for Dissolved Oxygen, Water Clarity and Chlorophyll (a) are
used for the tidal waters of the District. 2009 observations revealed 7 different
species of SAV (District of Columbia Water Quality Assessment, 2010 Integrated
Report). This is indicative of SAV recovery, as species diversity, and acreage has
improved over the past six observation periods. These indicators are the evidence to
demonstrate their effectiveness for the purposes of eutrophication.
3. How sensitive to nutrients have those indicators/parameters been? How did you determine
that?
EPA’s implementing regulations specify that states must adopt criteria that contain
sufficient parameters to protect designated uses. In order to achieve and maintain
water quality conditions necessary to protect the aquatic life of the Chesapeake Bay
The Association of Clean Water Administrators
Page 26 of 138 | Use of Biological Assessment in State Water Programs: Focus on Nutrients

and its tidal tributaries from the effects of nutrients and sedimentation pollution, EPA
has developed Ambient Water Quality Criteria for Dissolved Oxygen, Water Clarity
and Chlorophyll a for the Chesapeake Bay and its Tidal Tributaries in April 2003.
These ambient water quality indicators are vital because they are nutrient driven
parameters as recommended by the EPA Chesapeake Bay Program.
The District has adopted water quality standards for dissolved oxygen, water clarity
and chlorophyll (a) in accordance with the Chesapeake Bay Water Quality Criteria
Guidance Document published in 2003 (EPA, April 2003). DDOE Water Quality
Division (WQD) worked with the Chesapeake Bay Program to assess the tidal waters
in the District using the 2003 guidance document and all the addendums published
through 2010. For the 2008 listing, the tidal waters were assessed for the 30-day DO
attainment and Chlorophyll (a).
4. During criteria development, how have you found the correlation between causal (chemical)
and response (biological/ecological) variables for nutrients? If so, what approach(es) has
your state used to refine those relationships (e.g., subcategorizing waters, adjusting the
frequency and duration components of the criteria, using a range of TN and TP values,
developing site-specific numeric nutrient criteria, streamlining site-specific criteria
approaches, or other approaches)? Please discuss challenges and successes you have
experienced.
DC water quality standards contain Magnitude, Duration and Frequency approach
and the implementation procedures are within the body of the regulations and revised
thru promulgation.
5. How is your biological/ecological assessment information used in combination with chemical
and physical data to make impairment decisions?
See item 1
6. Do you currently consider biological assessment information when developing NPDES
permits? If so, please describe how this is done.
The District certifies EPA issued permits. The NPDES permits for point sources in
the District reflect total nitrogen and total phosphorus effluent limits. The major
permit holders in the District conduct Whole Effluent Toxicity tests as required by the
permit.
Additional information:
DDOE has biological monitoring and assessment program which reports on the condition of
aquatic biota in the waters of the District. The biological assessment information is published in
the Integrated Report to Congress every two years.
The Association of Clean Water Administrators
Page 27 of 138 | Use of Biological Assessment in State Water Programs: Focus on Nutrients

The biological assessment provides information on the status of condition of the existing aquatic
biota in a waterbody, provide the chemical characteristics of a waterbody, whether designated
use is being met.
The other important uses of biological assessment component include identifying baseline
biological conditions against which the effects of global climate change on aquatic life can be
studied and compared. Such information could enable a water quality management program to
calibrate biological assessment endpoints and criteria to adjust for long-term climate change
conditions.
The Association of Clean Water Administrators
Page 28 of 138 | Use of Biological Assessment in State Water Programs: Focus on Nutrients
Florida Contact: Russ Frydenborg, [email protected]
1. Please provide a brief overview of relevant biological/ecological assessment work your state
is conducting.
Florida Department of Environmental Protection (FDEP) conducts Stream Condition
Index (invertebrates), Rapid Periphyton Survey, Linear Vegetation Survey, Habitat
Assessment, Lake Vegetation Index, chlorophyll a, and Wetland Condition Index (plants
and invertebrates) sampling for a variety of FDEP objectives and environmental
decisions. These include studies for making decisions on point source permits, impaired
waters assessments/stressor identification, nutrient criteria development and
implementation, success of restoration activities and Best Management Practices, and
discerning status and trends in the State’s waters.
2. Which biological indicators/parameters does your state use (or plan to use) to assess aquatic
life impacts due to nutrients?
Chlorophyll a, Stream Condition Index (invertebrates), Rapid Periphyton Survey, Linear
Vegetation Survey, Habitat Assessment, Lake Vegetation Index, and Wetland Condition
Index (plants and invertebrates).
3. How sensitive to nutrients have those indicators/parameters been? How did you determine
that?
The Rapid Periphyton Survey was a line of evidence for Florida’s 0.35 mg/L springs
nitrate criteria, based on regression/change point analyses. The Lake Vegetation Index
was correlated with a Human Disturbance Gradient, which includes nutrients. The
Wetland Indices were correlated to the Landscape Development Intensity Index, which is
associated with nutrient loading, in part.
Chlorophyll in lakes was strongly correlated to nutrient concentrations.
Despite intensive study, FDEP could not find convincing cause-effect relationships
between nutrients and biological variables in streams (other than clear springs).
4. During criteria development, how have you found the correlation between causal (chemical)
and response (biological/ecological) variables for nutrients? If so, what approach(es) has
your state used to refine those relationships (e.g., subcategorizing waters, adjusting the
frequency and duration components of the criteria, using a range of TN and TP values,
developing site-specific numeric nutrient criteria, streamlining site-specific criteria
approaches, or other approaches)? Please discuss challenges and successes you have
experienced.
Lakes and springs had strong cause-effect relationships, and FDEP based criteria on this
evidence. In streams, the lack of cause-effect relationships led FDEP to use the reference
The Association of Clean Water Administrators
Page 29 of 138 | Use of Biological Assessment in State Water Programs: Focus on Nutrients
site approach coupled with biological information to assess impairment (or lack thereof).
See the FDEP technical Support Document at:
http://www.dep.state.fl.us/water/wqssp/nutrients/index.htm
5. How is your biological/ecological assessment information used in combination with chemical
and physical data to make impairment decisions?
See Section 2.7 of Sampling and Use of the Stream Condition Index (SCI)for Assessing
Flowing Waters: A Primer (Oct. 2011) available here:
http://www.dep.state.fl.us/water/bioassess/docs/sci-primer.pdf
6. Do you currently consider biological assessment information when developing NPDES
permits? If so, please describe how this is done.
Biological data is assessed as part of the NPDES permit cycle to provide reasonable
assurance that the facility is, or is not, complying with criteria designed to protect aquatic
life use.
The Association of Clean Water Administrators
Page 30 of 138 | Use of Biological Assessment in State Water Programs: Focus on Nutrients

Georgia
Contact: Michele Brossett, [email protected]
1. Please provide a brief overview of relevant biological/ecological assessment work your state
is conducting.
Georgia Department of Natural Resources (GA DNR) is currently collecting diatom and
macroinvertebrate data in streams and zooplankton in lakes.
2. Which biological indicators/parameters does your state use (or plan to use) to assess aquatic
life impacts due to nutrients?
GA DNR is currently working with Kalina Manolylov, Georgia State College and
University, to develop a nutrient pollution tolerant index (PTI). With the nutrient PTI
and water quality data the goal is to try to develop nutrient criteria for streams.
3. How sensitive to nutrients have those indicators/parameters been? How did you determine
that?
This has not been determined yet, we are still in the development stages of data collection
and correlation analysis with nutrient data.
4. During criteria development, how have you found the correlation between causal (chemical)
and response (biological/ecological) variables for nutrients? If so, what approach(es) has
your state used to refine those relationships (e.g., subcategorizing waters, adjusting the
frequency and duration components of the criteria, using a range of TN and TP values,
developing site-specific numeric nutrient criteria, streamlining site-specific criteria
approaches, or other approaches)? Please discuss challenges and successes you have
experienced.
GA DNR is still in data collection and analysis phase and has not determined if there is a
correlation between biology and water quality.
5. How is your biological/ecological assessment information used in combination with chemical
and physical data to make impairment decisions? Biological data is generally assessed
separately from chemical/physical data when making decisions as to whether a water is
impaired.
Currently, Georgia has chlorophyll a criteria on some of our major reservoirs. These
criteria (along with a total nitrogen, an annual phosphorus lake loading criteria and an
annual phosphorus loading criteria on the lakes’ major tributaries) serve to protect the
reservoirs from nutrient over-enrichment. When making listing decisions, each of these
criteria is evaluated separately. If our biological parameter (chlorophyll a) exceeds the
criteria then the lake will be listed as impaired whether the nitrogen and phosphorus
criteria area exceeded or not.
The Association of Clean Water Administrators
Page 31 of 138 | Use of Biological Assessment in State Water Programs: Focus on Nutrients

Georgia assesses the results of fish and macroinvertebrate data when assessing its waters
(this data is not specific to nutrient impairment though). If a Fish IBI scores poor or very
poor, the water is listed as impaired for Bio F (Impaired Fish Community). If
macroinvertebrate sites scored poor or very poor based on a multimetric index, then the
water is also listed as impaired for Bio M (Impaired Macroinvertebrate Community).
The actual cause of the impairment is not provided in the 305b/303d report unless GA
DNR has the data to support the cause of impairment. The cause of the biological
impairment is addressed in the TMDL process.
6. Do you currently consider biological assessment information when developing NPDES
permits? If so, please describe how this is done.
Biological impairment listings on the 305b/303d list are considered in permitting. If a
water has been listed for impaired for biology (chlorophyll a, Bio F, Bio M), then permits
may be impacted. For instance, in our General Industrial stormwater permit, if the
facility is located within 1 linear mile of an impaired stream, then the facility must
sample for the parameter of concern and if the TMDL is completed, it must be in
compliance with the TMDL. Similarly for the MS4 permits, if a city discharges to an
impaired stream, they must sample for the parameter of concern. For the General land
disturbing/construction permit, if a site is located within 1 linear mile of a stream
impaired for Bio M or Bio F, they must do extra BMPs to protect the water. Permits for
municipal and industrial wastewater facilities must be in compliance with TMDLs.
The Association of Clean Water Administrators
Page 32 of 138 | Use of Biological Assessment in State Water Programs: Focus on Nutrients

Hawaii
Contact: Watson T. Okubo, [email protected]
1. Please provide a brief overview of relevant biological/ecological assessment work your state
is conducting.
Hawaii Department of Health (HI DOH) has contracted with USGS in a joint funding
agreement to develop a benthic macroinvertebate index of stream quality for Hawaiian
Streams. HI DOH is waiting for the final report and will have more to say when the
report is received. There has been a contract extension due to weather and personnel
emergencies.
The Association of Clean Water Administrators
Page 33 of 138 | Use of Biological Assessment in State Water Programs: Focus on Nutrients

The Association of Clean Water Administrators
Page 34 of 138 | Use of Biological Assessment in State Water Programs: Focus on Nutrients

Idaho
Contact: Mary Anne Nelson, [email protected]
1. Please provide a brief overview of relevant biological/ecological assessment work your state
is conducting.
Idaho currently uses indices of biological integrity based on benthic macroinvertebrates,
fish and periphyton to assess the support status of beneficial uses in the state’s waters.
These biological indices are multi-metric in design and incorporate various indicators of
biological health of those communities.
2. Which biological indicators/parameters does your state use (or plan to use) to assess aquatic
life impacts due to nutrients?
Idaho does not currently incorporate measures of nutrient impairment in the biological
indices used to determine impairment of beneficial uses. However, a study is currently
being proposed that will evaluate the feasibility of incorporating both numeric nutrient
thresholds as trigger values and biological response variables to help assess aquatic life
impacts.
3. How sensitive to nutrients have those indicators/parameters been? How did you determine
that?
Not applicable
4. During criteria development, how have you found the correlation between causal (chemical)
and response (biological/ecological) variables for nutrients? If so, what approach(es) has
your state used to refine those relationships (e.g., subcategorizing waters, adjusting the
frequency and duration components of the criteria, using a range of TN and TP values,
developing site-specific numeric nutrient criteria, streamlining site-specific criteria
approaches, or other approaches)? Please discuss challenges and successes you have
experienced.
Not applicable at this time
5. How is your biological/ecological assessment information used in combination with chemical
and physical data to make impairment decisions?
Idaho’s biological monitoring program is the basis for most of the impairment listing
decisions made in the state. Following the Water Body Assessment Guidance document,
biological data is considered in conjunction with chemical and physical data to determine
beneficial use support. In Idaho, the majority of the data used to make these listing
decisions come from the state’s Beneficial Use Reconnaissance Program and are
biological/ecological data.
The Association of Clean Water Administrators
Page 35 of 138 | Use of Biological Assessment in State Water Programs: Focus on Nutrients

6. Do you currently consider biological assessment information when developing NPDES
permits? If so, please describe how this is done.
Idaho does not have primacy for the NPDES program. However, Idaho Department of
Environmental Quality does not have biocriteria in our standards so most often the
permits are written based on TMDLs in the watershed or to meet numeric criteria. Idaho
certifies that permits written by EPA conform to our state water quality standards and the
current criteria for nutrients is a narrative criteria that states waters shall be free from
excess nutrients causing a visible slime growth or nuisance algal growth. At this time it
is not known if EPA permit writers are taking Idaho’s biological assessment information
into account when developing permit limits.
The Association of Clean Water Administrators
Page 36 of 138 | Use of Biological Assessment in State Water Programs: Focus on Nutrients

Illinois
Contact: Roy Smogor, [email protected]
1. Please provide a brief overview of relevant biological/ecological assessment work your state
is conducting.
Illinois EPA uses macroinvertebrate-assemblage and fish-assemblage information to
assess attainment of Aquatic Life Use in Illinois streams.
2. Which biological indicators/parameters does your state use (or plan to use) to assess aquatic
life impacts due to nutrients?
Illinois EPA currently does not use any direct biological indicators of nutrient impacts on
aquatic life.
3. How sensitive to nutrients have those indicators/parameters been? How did you determine
that?
Not applicable. See #2.
4. During criteria development, how have you found the correlation between causal (chemical)
and response (biological/ecological) variables for nutrients? If so, what approach(es) has
your state used to refine those relationships (e.g., subcategorizing waters, adjusting the
frequency and duration components of the criteria, using a range of TN and TP values,
developing site-specific numeric nutrient criteria, streamlining site-specific criteria
approaches, or other approaches)? Please discuss challenges and successes you have
experienced.
The scientific information available from Illinois streams indicates that simplistic
statistical relations between nutrient concentrations and biological variables do not
provide a sufficiently reliable basis for determining when specific nutrients are causing
negative impacts on aquatic life.
5. How is your biological/ecological assessment information used in combination with chemical
and physical data to make impairment decisions?
Illinois EPA uses biological-assemblage information in a decision framework that
recognizes and capitalizes on the greater reliability of biological-assemblage data over
water-chemistry measurements in assessing attainment of Aquatic Life Use.
6. Do you currently consider biological assessment information when developing NPDES
permits? If so, please describe how this is done.
The Association of Clean Water Administrators
Page 37 of 138 | Use of Biological Assessment in State Water Programs: Focus on Nutrients

Not directly. Rather, biological information is used to assess attainment of Aquatic Life
Use and a decision of non-attainment does affect permitting from a Clean Water Act
303(d)/TMDL perspective.
The Association of Clean Water Administrators
Page 38 of 138 | Use of Biological Assessment in State Water Programs: Focus on Nutrients
Indiana
Contact: Shivi Selvaratnam, [email protected]
1. Please provide a brief overview of relevant biological/ecological assessment work your state
is conducting.
IBI looking at fish, macroinvertebrates, and algae
2. Which biological indicators/parameters does your state use (or plan to use) to assess aquatic
life impacts due to nutrients?
TBD for flowing waters, none for lakes.
3. How sensitive to nutrients have those indicators/parameters been? How did you determine
that?
No response provided.
4. During criteria development, how have you found the correlation between causal (chemical)
and response (biological/ecological) variables for nutrients? If so, what approach(es) has
your state used to refine those relationships (e.g., subcategorizing waters, adjusting the
frequency and duration components of the criteria, using a range of TN and TP values,
developing site-specific numeric nutrient criteria, streamlining site-specific criteria
approaches, or other approaches)? Please discuss challenges and successes you have
experienced.
Analysis for flowing waters is on-going. Stressor-response analysis for lakes showed
moderately strong correlation between TP and chlorophyll a.
5. How is your biological/ecological assessment information used in combination with chemical
and physical data to make impairment decisions?
Indiana Department of Environmental Management (IDEM) evaluates multiple lines of
evidence using both qualitative and quantitative information.
6. Do you currently consider biological assessment information when developing NPDES
permits? If so, please describe how this is done.
Only through WET testing.
The Association of Clean Water Administrators
Page 39 of 138 | Use of Biological Assessment in State Water Programs: Focus on Nutrients

Iowa
Name: Tom Wilton, [email protected]
1. Please provide a brief overview of relevant biological/ecological assessment work your states
is conducting.
Since 1994, the Iowa Department of Natural Resources (IDNR) and the State Hygienic
Laboratory (SHL) cooperatively have monitored stream fish and macroinvertebrate
assemblages along with physical habitat and water quality characteristics. The Iowa
DNR has formed a technical advisory committee (TAC) to analyze data from the
IDNR/SHL bioassessment program and review scientific/technical literature pertaining to
relationships of stream nutrients and aquatic community indicators. The TAC is
scheduled to complete its work and provide nutrient criteria recommendations in 2012.
Additional information and notes from TAC meetings are available at:
http://www.iowadnr.gov/InsideDNR/RegulatoryWater/WaterQualityStandards/Nutrients.
aspx.
IDNR is supporting research by Iowa State University that is developing biological
indicators for assessing the health of Iowa’s lakes and reservoirs. The research includes
analysis of aquatic community relationships with habitat and water quality conditions,
including nutrient/trophic status. The anticipated time of completion for this project is
December 2012.
Since 2004, IDNR has been conducting monitoring of biological, chemical, and physical
parameters in wetlands to determine the ecological condition of wetlands while
documenting the leading contaminants and stressors found in these systems. Nutrient
parameters are included in the suite of water quality analyses. Aquatic community
assemblages monitored include fish, invertebrates, and plants. The program initially
focused on developing standardized monitoring and assessment protocols for
depressional ‘pothole’ wetlands in one region of the state, and has recently expanded
monitoring to additional wetland systems including shallow lakes often impacted by
excess nutrients. Additional information about the wetland monitoring program and
wetland strategic plan are available at
http://www.iowadnr.gov/Environment/WaterQuality/WaterMonitoring/MonitoringProgra
ms/Wetlands.aspx.
2. Which biological indicators/parameters does your state use (or plan to use) to assess aquatic
life impacts due to nutrients?
For streams, the existing benthic macroinvertebrate and fish assemblage IBIs (Index of
Biotic Integrity) are best-suited for assessing aquatic life impacts from nutrients. Work is
currently underway to develop a freshwater mussel IBI that might provide additional
insight into nutrient impacts. It is very likely that Chlorophyll A, serving as a measure of
benthic and sestonic algal biomass, will serve as nutrient response indicator. It is too
early in the development stages to predict which aquatic community indicators will be the
The Association of Clean Water Administrators
Page 40 of 138 | Use of Biological Assessment in State Water Programs: Focus on Nutrients
most useful for examining nutrient response relationships in lakes, reservoirs, and
wetlands.
3. How sensitive to nutrients have those indicators/parameters been? How did you determine
that?
Iowa’s analysis of stream nutrient-biological relationships has not yet been completed;
however, evidence of two plausible causal mechanistic pathways has been found thus far.
The first pathway links elevated nutrient levels with elevated seston algae chlorophyll a
levels with decreased levels in certain benthic macroinvertebrate data metrics (e.g., taxa
richness, relative abundance of tolerant and sensitive taxa, proportional abundance of
scraper (functional feeding group) organisms. Visual examination of graphs and various
statistical techniques such as correlation, quantile regression, regression tree, and
conditional probability were used to examine and quantify the strength of relationships.
While it is difficult to generalize, the sensitivity of Iowa stream benthic
macroinvertebrate assemblages to elevated levels of seston algal chlorophyll A might be
characterized as slight-to-moderate. One likely reason the sensitivity is not stronger is
the potential co-occurrence of physical habitat and water quality co-stressors that make it
difficult to isolate nutrient effects.
The second causal pathway links elevated nutrient levels with elevated algal chlorophyll
A levels and/or stream metabolic rates (e.g., primary production, respiration) with lower
diurnal dissolved oxygen minima and/or elevated d.o. fluctuation with decreased benthic
macroinvertebrate and/or fish IBI levels. In this case, the sensitivity of benthic
macroinvertebrate and fish indicators can probably be characterized as moderate-to-
strong, particularly with regard to sensitivity to low dissolved oxygen levels. Identical
techniques described in the previous paragraph were used to examine aquatic community
sensitivity via this mechanistic pathway.
4. During criteria development, how have you found the correlation between causal (chemical)
and response (biological/ecological) variables for nutrients? If so, what approach(es) has
your state used to refine those relationships (e.g., subcategorizing waters, adjusting the
frequency and duration components of the criteria, using a range of TN and TP values,
developing site-specific numeric nutrient criteria, streamlining site-specific criteria
approaches, or other approaches)? Please discuss challenges and successes you have
experienced.
Using conventional bi-variate, linear regression statistical techniques, significant
relationships between stream nutrient parameters and some biological response variables
have been found, yet these relationships typically account for a small minority of the
variation between the nutrient and nutrient response variable in question. Analysis of
potential stream classification schemes (e.g., stream watershed area, order, and
ecoregion) is being conducted to determine their potential to reduce uncertainty in these
relationships. Based on the outcome of the TAC data analysis and recommendations, the
Iowa DNR will consider the available frequency and duration alternatives, as well as the
advantages/disadvantages of site-specific implementation of nutrient criteria.
The Association of Clean Water Administrators
Page 41 of 138 | Use of Biological Assessment in State Water Programs: Focus on Nutrients

5. How is your biological/ecological assessment information used in combination with chemical
and physical data to make impairment decisions?
Stream benthic macroinvertebrate index and fish index monitoring results are compared
against ecoregion-specific biological assessment criteria (BIC) to assess the support
status of aquatic life uses. A stream segment for which at least one index consistently
ranks below the BIC is a potential candidate for impairment listing. Available water
quality data are compared against applicable water quality standards criteria. Impairment
listing can occur independently on the basis of biological or water quality data, or from a
combination of both. Iowa water quality standards
(http://www.iowadnr.gov/InsideDNR/RegulatoryWater/WaterQualityStandards.aspx) do
not currently include numeric criteria for nutrients; therefore, nutrient monitoring data are
not utilized to make aquatic life use impairment determinations.
6. Do you currently consider biological assessment information when developing NPDES
permits? If so, please describe how this is done.
There is no direct link of biological assessment information to NPDES permits that IDNR
is aware of in their program. It may be used indirectly, however.
IDNR looks at narrative toxicity implementation based on a pollutant-by-pollutant
approach that considers which species may be present in certain waterbodies and uses
bioassessment information to assist in these determinations.
Bioassessment data are also currently used for impairment purposes. Thus, the same
bioassessment data could be used for TMDL development, which could then result in
water quality-based limits being included in the NPDES permit for point source
discharges to the watershed.
The Association of Clean Water Administrators
Page 42 of 138 | Use of Biological Assessment in State Water Programs: Focus on Nutrients
Kansas
Contact: Mike Tate, [email protected]
1. Please provide a brief overview of relevant biological/ecological assessment work your state
is conducting.
Stream - sestonic chlorophyll-a, macroinvertebrate indices (MBI, EPT), fish tissue
(bioaccumulatives), mussel count/loss
Lake - chlorophyll-a, bluegreen algae percent composition, and microcystin
concentration (ELISA method)
USGS – algal toxins, geosmin, MIB
2. Which biological indicators/parameters does your state use (or plan to use) to assess aquatic
life impacts due to nutrients?
For lakes – chlorophyll-a
For streams - exploring the use of periphyton. Currently use DO; pH; and total
phosphorus as a screening mechanism to identify phosphorus hot spots and further study
via a TMDL.
3. How sensitive to nutrients have those indicators/parameters been? How did you determine
that?
In streams, not very sensitive. In lakes chlorophyll-a shows better sensitivity, however
since all lakes in KS are manmade reservoirs, the morphology of those reservoirs can
confound the relationships. Turbidity plays a significant role. Determined by the
strength of statistical relationships.
4. During criteria development, how have you found the correlation between causal (chemical)
and response (biological/ecological) variables for nutrients? If so, what approach(es) has
your state used to refine those relationships (e.g., subcategorizing waters, adjusting the
frequency and duration components of the criteria, using a range of TN and TP values,
developing site-specific numeric nutrient criteria, streamlining site-specific criteria
approaches, or other approaches)? Please discuss challenges and successes you have
experienced.
N/A yet
5. How is your biological/ecological assessment information used in combination with chemical
and physical data to make impairment decisions?
The Association of Clean Water Administrators
Page 43 of 138 | Use of Biological Assessment in State Water Programs: Focus on Nutrients

The two are used independently. Impairment listing decisions can be made on the basis
of chemical, physical, or biological data – independent applicability if you will. Kansas
Department of Health and Environment (KDHE) has been unable to consistently link the
biological impairments to chemical impairments – particularly nutrients. This appears to
be the major problem across the nation. Thus, the attractiveness of Florida’s latest
proposal to couple a mandatory biological impact to a chemical impact.
6. Do you currently consider biological assessment information when developing NPDES
permits? If so, please describe how this is done.
Not often, but it has been done. In one instance, a permittee for a new facility was
required to model nutrient impacts on a receiving water via the antidegradation process.
The model was adjusted for TN and TP to try to keep periphyton below 150 mg/m2. TP
permit limits were derived based on the model.
Presence of mussels has also influenced ammonia limits in a small number of permits.
The Association of Clean Water Administrators
Page 44 of 138 | Use of Biological Assessment in State Water Programs: Focus on Nutrients

Kentucky
Contact: Randy Payne, [email protected]
1. Please provide a brief overview of relevant biological/ecological assessment work your state
is conducting.
The Kentucky Division of Water (DOW) is assessing streams and reservoirs statewide for
the 2012 305(b) cycle. This entails data collected from our ambient water quality
network, probabilistic biomonitoring, ambient biomonitoring, reservoir monitoring and
special studies monitoring programs. All of these programs collect a minimum set of
nutrient data. Our ambient water quality network provides trend information on nutrients
on our larger watersheds while the biological data are collected with a suite of nutrient
constituents. All data that pass QA are considered for 305(b) assessment. One ongoing
special study related to nutrients is our chlorophyll study began in 2010 at select boatable
river locations; this study is expected to continue for a minimum of five years.
2. Which biological indicators/parameters does your state use (or plan to use) to assess aquatic
life impacts due to nutrients?
Currently nutrient criteria development has been paired with biological community data.
Response variables are being tested with macroinvertebrates, fishes and diatoms. Most of
our boatable lentic waterbodies are created reservoirs, limiting our choice of biological
indicators; currently chlorophyll a is under study.
3. How sensitive to nutrients have those indicators/parameters been? How did you determine
that?
Kentucky DOW’s existing fish, macroinvertebrate and diatom community data from
bioassessment sampling from 1999-2007 were analyzed to identify possible thresholds in
TN and TP above which there were clear changes in biological integrity or community
attributes. Kentucky bioregions were used as the regional classification, and
relationships were examined using non-parameteric changepoint analysis and visual
inspection of scatterplots with LOWESS smoothing functions. Results were used to
identify regions with good or poor relationships, highlight potential confounding factors,
and prioritize further data collection activities.
Data from Kentucky’s Reference Reach network were used as estimates of least impacted
condition regionally. Data from the probabilistic bioassessment program were used to
describe the typical range and distribution of nutrient concentrations across ecoregions
and bioregions. Finally, nutrient data associated with all samples resulting in “Good” or
“Excellent” scores on Kentucky’s Macroinvertebrate Bioassessment Index were
summarized to estimate nutrient concentration ranges in streams that fully support
aquatic life use. Nutrient data for these summaries were primarily from one-time grab
samples during spring or summer baseflow conditions (i.e., the index period for
biological sampling for assessments).
The Association of Clean Water Administrators
Page 45 of 138 | Use of Biological Assessment in State Water Programs: Focus on Nutrients
A set of 30 sites selected from Kentucky’s Reference Reach network to represent a full
range of ecoregions and stream sizes. Nutrients were sampled twice during high flow or
runoff conditions (spring 2006 and spring 2008) and twice during periods of low flow
(summer 2006 and late spring 2007) in order to characterize nutrient conditions during
those flow conditions.
Fish, macroinvertebrates, and diatoms were sampled in spring and summer 2008 at 22
streams selected to represent a gradient of expected nutrient inputs but with good to fair
instream habitat. Nutrients were sampled monthly in order to capture short and longer-
term antecedent nutrient conditions potentially impacting biological responses.
A USGS report on analysis of nutrient breakpoints in macroinvertebrate community
attributes has been published:
Crain, A.S. and Caskey, B.J., 2010, Breakpoint analysis and relations of nutrient and
turbidity stressor variables to macroinvertebrate integrity in streams in the Crawford-
Mammoth Cave Uplands Ecoregion, Kentucky, for the development of nutrient criteria:
U.S. Geological Survey Scientific Investigations Report 2010—5164, 29 p
(http://pubs.usgs.gov/sir/2010/5164/)
Kentucky participated in a 2007 study conducted by EPA Region 4. Kentucky sampled
benthic algae in 10 streams using the R4 methodology and submitted these samples along
with nutrient data to the R4 project coordinator. The goal of the study was to examine
response of algal communities to nutrients in the Southeastern US and to promote
collaboration on regional studies. EPA’s report on this study is under review with no
expected release date available
4. During criteria development, how have you found the correlation between causal (chemical)
and response (biological/ecological) variables for nutrients? If so, what approach(es) has
your state used to refine those relationships (e.g., subcategorizing waters, adjusting the
frequency and duration components of the criteria, using a range of TN and TP values,
developing site-specific numeric nutrient criteria, streamlining site-specific criteria
approaches, or other approaches)? Please discuss challenges and successes you have
experienced.
In addition to the below, please see response to question 3. Data analyses are ongoing
with some bioregion biological communities (primarily macroinvertebrates) indicating a
response to nutrient gradation and others less so. For example, in the bluegrass region
(inner bluegrass in particular), where naturally high concentrations of phosphorus occur
due to the geology, the biological communities are adapted to these conditions and a clear
threshold response has not been found.
As with most datasets, there is always a need for more data. Especially data collected of
sufficient rigor and frequency under varying hydrologic as well as chemical conditions.
The Association of Clean Water Administrators
Page 46 of 138 | Use of Biological Assessment in State Water Programs: Focus on Nutrients

5. How is your biological/ecological assessment information used in combination with chemical
and physical data to make impairment decisions?
At locations where biological and physicochemical data exist, all data are considered
when making assessment decisions. Kentucky DOW has developed multimetric indices
for fish, macroinvertebrate and diatom communities in its wadeable and headwater
streams. When assessing warm- or coldwater aquatic habitat designated uses the weight
of evidence is given to the biological community(s). Often two or more biological
communities were sampled for a given waterbody or segment, adding to the robustness of
the biological dataset. When less than two biological communities were sampled, the
fish or macroinvertebrate community were used in making assessment decisions; the
diatom community must have at least one other community in making such decisions
(this multimetric index has not been through the same level of rigor of the other two).
6. Do you currently consider biological assessment information when developing NPDES
permits? If so, please describe how this is done.
Yes, to the extent the biological information was used to list a water body or segment on
the 303(d) list. If the stream is listed as impaired that affects whether the permit may be
issued and if it is what limits may be placed on a discharger. For example, where nutrient
enrichment is indicated a POTW permit renewal will have reduced TP concentration that
can be discharged, and they’ll come under sampling requirements specific to the
pollutant(s) under scrutiny. With Kentucky’s current nutrient criteria narrative rather
than numeric, in addition to the necessity of requiring chemical data, biological
information is required that indicates the stream is not supporting the aquatic life use.
The biological community data provides information to assist interpretation of the
chemical data.
The Association of Clean Water Administrators
Page 47 of 138 | Use of Biological Assessment in State Water Programs: Focus on Nutrients
Louisiana
Contact: Kris Pintado, [email protected]; Steph Braden, [email protected]
1. Please provide a brief overview of relevant biological/ecological assessment work your state
is conducting.
The Louisiana Department of Environmental Quality (LDEQ) has adopted biological
assessment criteria for wetlands based on above-ground vegetative productivity as a key
measure of overall wetland ecosystem health. LDEQ has collected, and continues to
collect, ecological and biological data sets to evaluate the attainable aquatic life
communities throughout the different ecoregions in Louisiana and to evaluate and revise
water quality criteria supportive of attainable uses. LDEQ’s biological collections and
data evaluations have focused on fish communities; however LDEQ has collected
additional biological data sets (e.g. macroinvertebrates, chlorophyll-a) and is proposing to
collect fish, macroinvertebrates, chlorophyll-a, and periphyton during an upcoming study.
2. Which biological indicators/parameters does your state us (or plan to use) to assess aquatic
life impacts due to nutrients?
LDEQ has not adopted indicators/parameters to assess aquatic life impacts due to nutrient
enrichment; however, biological collections are planned as a component of a monitoring
study designed to inform nutrient criteria development.
3. How sensitive to nutrients have those indicators/parameters been? How did you determine
that?
This has not been determined yet.
4. During criteria development, how have you found the correlation between causal (chemical)
and response (biological/ecological) variables for nutrients? If so, what approach(es) has
your state used to refine those relationships (e.g., subcategorizing waters, adjusting the
frequency and duration components of the criteria, using a range of TN and TP values,
developing site-specific numeric nutrient criteria, streamlining site-specific criteria
approaches, or other approaches)? Please discuss challenges and successes you have
experienced.
LDEQ is in the early stages of conducting a nutrient stressor-response study to inform
nutrient criteria development. The study includes biological data collections as described
above (in #1 and 2). Additionally, LDEQ is planning to collect information that can be
used to evaluate whether water body classes, watershed sizes, temporal and other
components are useful in streamlining nutrient criteria development and implementation
processes. LDEQ (as are all states/territories) is challenged with understanding causal
and response relationships and plans to thoroughly evaluate relationships in order to
minimize confounding factors that could lead to inappropriate criteria and/or
The Association of Clean Water Administrators
Page 48 of 138 | Use of Biological Assessment in State Water Programs: Focus on Nutrients

assessments.
5. How is your biological/ecological assessment information used in combination with chemical
and physical data to make impairment decisions?
LDEQ is in the early stages of determining how biological and ecological data sets can
and should be used to support water quality standards attainment support decisions. Data
sets evaluated may include LDEQ biological and habitat data, and general fisheries data
(e.g. LA Wildlife and Fisheries, USGS, USEPA, USFWS, NOAA, USEPA, etc.).
6. Do you currently consider biological assessment information when developing NPDES
permits? If so, please describe how this is done.
Yes, LDEQ considers biological assessment information when developing Louisiana
Pollutant Discharge Elimination System (LPDES) permits.
LDEQ reviews whole effluent toxicity (WET) and biomonitoring data reported in the
permit application and/or discharge monitoring reports (DMRs) as part of the draft permit
process. WET limits are established in permits if there is a reasonable potential for
toxicity due to lethal and/or sub-lethal failures as indicated in the application and/or
DMRs.
Aboveground net primary production (NPP), marsh grass aboveground productivity,
understory vegetation density and basal area, tree species composition, nutrient and
metals analysis of green leaves, and sediment analysis for metals and nutrients are
reviewed as part of a baseline study required for wetland assimilation projects and
permitting.
For facilities that operate a cooling water intake structure with a design intake of 50
MGD or greater, source water biological characterization data (species for all life stages
of fish and shellfish in the vicinity of cooling water intake structures (CWIS) and their
relative abundance (population) in the vicinity of the CWIS; identification and evaluation
of periods of reproduction, larval recruitment, and peak abundance for species; data
representative of the seasonal and daily activities; and identification of all threatened,
endangered, and other protected species that might be susceptible to impingement and
entrainment) are submitted and reviewed as part of the 316(b) requirement in LPDES
permits.
The Association of Clean Water Administrators
Page 49 of 138 | Use of Biological Assessment in State Water Programs: Focus on Nutrients
Maine
Contact: Dave Courtemanch, [email protected]
1. Please provide a brief overview of relevant biological/ecological assessment work your state
is conducting.
Biological assessment is the primary monitoring tool used in Maine waters. Presently,
Maine has narrative standards in statute for rivers and streams, lakes and marine waters.
Additionally, Maine Department of Environmental Protection (DEP) has numeric
biological criteria established by rule (Maine DEP Chapter 579) that use
macroinvertebrate data for rivers and streams, and has draft algae criteria prepared for
adoption. Both use multivariate linear discriminant models to determine classification
attainment. The macroinvertebrate models have been used since 1996 for listing
decisions. The algae models have been used since 2008. The data is also used for stressor
identification to set permit limits and define restoration plans.
2. Which biological indicators/parameters does your state use (or plan to use) to assess aquatic
life impacts due to nutrients?
Macroinvertebrates (multivariate), Algae (multivariate), Chlorophyll a
3. How sensitive to nutrients have those indicators/parameters been? How did you determine
that?
Multiple lines of analysis have been used to establish the associations between nutrients
(phosphorus) and biological effect. Publications in press. Reports available online:
http://www.maine.gov/dep/blwq/docmonitoring/biomonitoring/material.htm
4. During criteria development, how have you found the correlation between causal (chemical)
and response (biological/ecological) variables for nutrients? If so, what approach(es) has
your state used to refine those relationships (e.g., subcategorizing waters, adjusting the
frequency and duration components of the criteria, using a range of TN and TP values,
developing site-specific numeric nutrient criteria, streamlining site-specific criteria
approaches, or other approaches)? Please discuss challenges and successes you have
experienced.
Yes, extensive analysis is provided from a variety of waters including reference quality to
severely impaired. See available report:
http://www.maine.gov/dep/blwq/rules/Other/nutrients_freshwater/091202_report.pdf
5. How is your biological/ecological assessment information used in combination with chemical
and physical data to make impairment decisions?
Physical, Chemical, and Biological information are used in an integrative manner to
make impairment decisions. Biological information is the first line of evidence used
The Association of Clean Water Administrators
Page 50 of 138 | Use of Biological Assessment in State Water Programs: Focus on Nutrients

since it provides the most direct assessment of designated use attainment.
6. Do you currently consider biological assessment information when developing NPDES
permits? If so, please describe how this is done.
Yes. Biological information is regularly used in all permitting decisions including
establishment of permit limits (see example in EPA Stressor Identification Guidance
Document (EPA/822/B-00/025))
The Association of Clean Water Administrators
Page 51 of 138 | Use of Biological Assessment in State Water Programs: Focus on Nutrients

Maryland
Contacts: Matthew Rowe, [email protected]; John Backus,
1. Please provide a brief overview of relevant biological/ecological assessment work your state
is conducting.
Maryland Department of Environment (MDE) uses biological data in the following ways:
(1) fish and benthic community data in our nontidal streams to determine aquatic life use
impairment; (2) benthic estuarine data in Chesapeake Bay to determine aquatic life use
impairment; and, (3) fish tissue data in both tidal and nontidal areas to assess human
health criteria and to protect public health. MDE has also used clams in special PCB
studies to identify “hot spots”, as well as used whole effluent toxicity in our permitting
programs.
2. Which biological indicators/parameters does your state use (or plan to use) to assess aquatic
life impacts due to nutrients?
Currently, MDE does not use biological indicators in isolation as indicators of nutrient
pollution, though MDE does use biology in a supportive role when they see reduced
biology in conjunction with other nutrient indicators. In tidal areas MDE has water
quality standards (WQS) for dissolved oxygen (DO) and ammonia to assess nutrient
impacts. Chlorophyll is used as narrative criteria. Numeric Chl-a criteria are under
consideration in tidal areas. In nontidal areas MDE has WQS for DO and ammonia.
Additionally in drinking water reservoirs MDE has numeric Chl-a criteria as an indicator
of nutrient enrichment.
3. How sensitive to nutrients have those indicators/parameters been? How did you determine
that?
MD’s experience is that the current biological indicators that are used (fish and benthos)
are not sensitive to nutrient pollution unless it reaches the point of depressing DO below
critical levels. As a result, MDE focuses more on DO.
4. During criteria development, how have you found the correlation between causal (chemical)
and response (biological/ecological) variables for nutrients? If so, what approach(es) has
your state used to refine those relationships (e.g., subcategorizing waters, adjusting the
frequency and duration components of the criteria, using a range of TN and TP values,
developing site-specific numeric nutrient criteria, streamlining site-specific criteria
approaches, or other approaches)? Please discuss challenges and successes you have
experienced.
So far MDE has not found a direct correlation between causal and response variables.
MDE has found many confounding variables that make sorting out nutrient maxima
thresholds extremely challenging, and thus far, not possible. For example, a
The Association of Clean Water Administrators
Page 52 of 138 | Use of Biological Assessment in State Water Programs: Focus on Nutrients

periphyton/nutrient study was hoped to show taxa shifts at clear nutrient thresholds, yet
there were wide range (nearly ten-fold) of “P” concentrations at taxa shifts. Nutrient
loads and the exposure of periphyton assemblages to those loads over time are likely
much more important and significant. A recently completed in-depth analysis of
statewide nutrient concentration data paired with biological data (fish and benthic inverts)
identified some potential to determine thresholds at small-scales (sub-watershed), yet
confounding variables prevented the determination of clear causal/response relationships.
5. How is your biological/ecological assessment information used in combination with chemical
and physical data to make impairment decisions?
MD basically uses the biology to determine aquatic life use impairment, then goes
through a stressor identification process where they look at other chemical/physical
parameters to identify the specific pollutant (or pollution/habitat alteration) causing the
biological degradation.
6. Do you currently consider biological assessment information when developing NPDES
permits? If so, please describe how this is done.
Yes, not routinely, but on a case-by-case basis. For example, when facility discharge
monitoring reports indicate WQS or permit limit exceedances, MDE has conducted
special biological studies to see if the aquatic life use is being affected. If so, MDE
tightens up permit limits. As mentioned above, MDE also requires WET testing for some
permits. Further, when MDE knows trout are present, they require more stringent
temperature limits for dischargers. Also, Tier II (high quality) waters are designated as
such with the use of fish and benthic indices of biological integrity (FIBI and BIBI). If a
new or significant increase to an existing discharge occurs in a watershed upstream of
Tier II stream segment, case-by-case antidegradation police requires that consideration is
given to protecting the Tier II segment when developing NPDES permits via consultation
between the WQS and NPDES personnel.
The Association of Clean Water Administrators
Page 53 of 138 | Use of Biological Assessment in State Water Programs: Focus on Nutrients
Massachusetts
Contacts: Kimberly Groff, [email protected]; Mark Mattson,
[email protected]; Dennis Dunn, [email protected]; Rick McVoy,
[email protected]; Art Johnson, [email protected]; Laurie
Kennedy, [email protected]
1. Please provide a brief overview of relevant biological/ecological assessment work your state
is conducting.
A strategic goal of the MassDEP is to implement a comprehensive monitoring program
(biological, chemical, and physical integrity status/assessment , trends and flows, and
targeted) that serves all water quality management needs and addresses streams, rivers,
lakes, reservoirs, estuaries, coastal areas, wetlands, and groundwater. Major components
of the monitoring program fulfill requirements of the Federal Clean Water Act (CWA)
and are described in A Water Quality Monitoring Strategy for the Commonwealth of
Massachusetts which is available at
http://www.mass.gov/dep/water/resources/envmonit.htm.
MassDEP follows a phased holistic program for watershed-based assessment, Total
Maximum Daily Load (TMDL) evaluation, permitting, and implementation, has been
adopted by MassDEP's Bureau of Resource Protection (BRP) to address its Watershed
Management goals.
The results from biological (and habitat), toxicological, and chemical investigations are
integrated to assess “Aquatic Life Use”. Data are collected for:
Benthic macroinvertebrate (rivers),
Fish population (rivers),
Habitat and flow (rivers, lakes, estuaries),
Eeelgrass bed habitat (estuaries),
Non-native aquatic species (rivers, lakes),
Periphyton/algal bloom (rivers, lakes, estuaries),
Toxicity testing (rivers, estuaries), and
Water quality (rivers, lakes, estuaries).
The quality of data generated in each of these information categories is also weighed
during the assessment decision-making process. However, because the biological
community integrates the effects of pollutants and other conditions over time, the
biological community data are considered by MassDEP to be the best and most direct
measure of the Aquatic Life Use, given equal levels of data quality. The weight-of-
evidence gradient used by MassDEP analysts generally follows this line-- biological
(including habitat), toxicological, and chemistry (physico-chemical, sediment chemistry
guidelines, whole-fish tissue residue guidelines) are weighted most to least heavily in that
order.
The Association of Clean Water Administrators
Page 54 of 138 | Use of Biological Assessment in State Water Programs: Focus on Nutrients
To address federal requirements for nutrient criteria development, components have been
added to the monitoring program to enhance knowledge through data collection, method
development, and research. This information is expected to provide additional
information with respect to the general and site-specific factors that cause or contribute to
nutrient impairment in Massachusetts fresh water systems.
2. Which biological indicators/parameters does your state use (or plan to use) to assess aquatic
life impacts due to nutrients?
Massachusetts is considering biological response variables such as secchi disk,
chlorophyll-a, filamentous algae coverage, duckweed, and dissolved oxygen, when
performing use assessments for reporting the status of its fresh waters in accordance with
Sections 305(b) and 303(d) of the Clean Water Act (CWA). Eelgrass Bed Habitat is uses
to assess the “Aquatic Life use” for marine waters. Massachusetts has historically relied
on best professional judgment and weight-of-evidence in its water quality assessment of
“Aquatic Life” impacts due to nutrients.
MassDEP Division of Watershed Management (DWM), Watershed Planning Program, is
in the process of developing a Comprehensive Assessment and Listing Method (CALM)
document. Waters supporting the “Aquatic Life Use” are suitable for sustaining a native,
naturally diverse, community of aquatic flora and fauna, including, but not limited to,
wildlife and threatened and endangered species and for their reproduction, migration,
growth and other critical functions. Below is an except from the DRAFT CALM for
assessment of “Aquatic Life Use” that contains a list of biological response indicators
that are under consideration in the evaluation of “Aquatic Life Use” and the
identification of nutrients as the cause of impairment.
To evaluate a waterbody for nutrient related impairment, MassDEP analysts rely on
whether or not there are indicators of nutrient enrichment. Such indicators include
presence of nuisance algal blooms/algal mats, excessive macrophyte growth, or decreases
in density or areal coverage of seagrasses or other submerged aquatic vegetation.
Physicochemical indications of high productivity such as excessive diel
oxygen/saturation/pH swings and/or elevated chlorophyll a concentrations are also
evaluated. While total phosphorus or nitrogen concentration data alone are not utilized to
determine impairment due to nutrient enrichment, these data do help to corroborate the
other indicator data and occasionally help to identify potential sources (e.g., release of
phosphorus from anoxic sediments). When these types of data are available but they do
not indicate nutrient enrichment the Aquatic Life Use is assessed as support. When they
do indicate nutrient enrichment the analyst must use best professional judgment (BPJ) to
evaluate the severity of the problems based on the types of indicator data and any
indication that they occur frequently or for prolonged periods. When combinations of
indicators are present the Aquatic Life Use will likely be assessed as impaired.
The Association of Clean Water Administrators
Page 55 of 138 | Use of Biological Assessment in State Water Programs: Focus on Nutrients

DRAFT Aquatic Life Use Assessment
Variable Support Impaired
Data available clearly indicates no or
minor modification of the biological
community. Excursions from chemical
criteria (MassDEP 2006) are not frequent
or prolonged and may be tolerated if the
biosurvey results demonstrate support.
There is moderate or severe
modification of the biological
community, presence of toxicity (acute
and/or chronic), and/or frequent or
severe violations of chemical criteria.
BIOLOGY
Eelgrass Bed Habitat
(Howes et al. 2003, Costello
2003, Costello 2008,
MassGIS, 2008)
Increasing or stable (i.e., no or minimal
loss), BPJ
Substantial decline in bed size or total
loss of beds no matter their size.
Determinations - assume a high
confidence in the data sources,
particularly 1951 data).
Plankton/Periphyton No/infrequent algal blooms or growths of
periphyton, <25% cover of aquatic plants
such as Lemna, periphyton cover within
riffle/reach <40%, chlorophyll a <200
mg/m2.
Frequent and/or prolonged algal blooms,
>25% noxious aquatic plant cover,
percent periphyton cover within the
riffle or reach >40%, cyanobacteria
blooms result in advisories recurring
and/or prolonged, chlorophyll a >200
mg/m2.
CHEMISTRY-WATER**
Indicators of nutrient
enrichment (MassDEP 2006)
All surface waters shall be
free from pollutants in
concentrations or
combinations that settle to
form objectionable deposits;
float as debris, scum or other
matter to form nuisances;
produce objectionable odor,
color, taste or turbidity; or
produce undesirable or
nuisance [growth or amount]
species of aquatic life
None/infrequent algal blooms or growths
of periphyton, physicochemical data
generally in following ranges: chlorophyll
a concentrations generally <3 – 10 mg/L,
diel oxygen swings generally change <1.5
mg/L, saturation rarely >100 to 110%, pH
in normal range. total phosphorus or
nitrogen concentration data help to
corroborate the indicator data
Frequent and/or prolonged indicators of
enriched conditions (e.g., algal blooms,
excessive macrophyte growth, decrease
in the distribution (either in density or
areal coverage) of seagrasses or other
submerged aquatic vegetation,
physicochemical data in following
ranges: chlorophyll a concentrations >10
mg/L, excessive diel oxygen swings,
saturation >110%, high pH. total
phosphorus or nitrogen concentration
data help to corroborate the indicator
data
3. How sensitive to nutrients have those indicators/parameters been? How did you determine
that?
MassDEP has evaluated the relationship between ambient level of phosphorus and
observed biological responses for freshwater systems. MassDEP has used linear
regression between total phosphorus and chlorophyll, and has also used logistic
regression to determine biological response indicators that determine support or non-
support of uses as a function of total phosphorus.
Preliminary results show that Secchi disk and chlorophyll a are sensitive to phosphorus at
the low range 0-150 ppb if measured in lakes and/or some impoundments. Duckweed is
under evaluation and appears to be somewhat sensitive, however, studies are ongoing.
Filamentous algae appears to be somewhat sensitive in wadeable streams if light is
The Association of Clean Water Administrators
Page 56 of 138 | Use of Biological Assessment in State Water Programs: Focus on Nutrients

available. Secchi disk and chlorophyll a do not appear to be sensitive in running non-
wadeable rivers. UMass Dartmouth’s work on the Massachusetts Estuaries Project
indicates that Eelgrass loss appears to be somewhat sensitive to nitrogen in shallow
estuaries.
4. During criteria development, how have you found the correlation between causal (chemical)
and response (biological/ecological) variables for nutrients? If so, what approach(es) has
your state used to refine those relationships (e.g., subcategorizing waters, adjusting the
frequency and duration components of the criteria, using a range of TN and TP values,
developing site-specific numeric nutrient criteria, streamlining site-specific criteria
approaches, or other approaches)? Please discuss challenges and successes you have
experienced.
In general the correlation between causal (chemical) and response (biological/ecological)
variables for nutrients in river systems appears to be site specific. The primary reason for
this is that phosphorus and nitrogen do not follow a typical dose-response relationship, as
with toxic substances. Rather, waterbody-specific factors such as detention time, color,
depth, light availability, Nitrogen/Phosphorus ratio, internal cycling, and local water
chemistry also influence the response of aquatic systems. This results in the need to
develop site-specific concentration targets for each waterbody.
Over the last decade, Massachusetts has proposed the adoption of site-specific
phosphorus standards for a number of ponds and determined that site-specific analysis
should be used in deriving WQS criteria. On a parallel path, site-specific nitrogen criteria
were promulgated in the SWQS in 2006 for a number of estuaries. These site-specific
criteria were derived from a complex water quality modeling effort conducted by the
University of Massachusetts /Dartmouth School of Marine Science and Technology
(SMAST) and Massachusetts Department of Environmental Protection (MassDEP) under
the Massachusetts Estuaries Program (MEP). The pace of work and resources needed to
develop site specific criteria has not met EPA mandates.
As a result MassDEP has been investigating other systematic approaches to developing
numeric nutrient guidance (biological response indicators and numeric TP/TN). A
MassDEP Nutrient workgroup analyzed a range of response indicators and concluded
that there was a higher degree of confidence in nutrient-response relationships for lakes
followed by wadeable rivers (<0.6 m). In order to assign TP or response indicator
numeric guidance limits, waterbodies will need to be further sub-classified based on
parameters like waterbody type (lake, river, impoundment) and physical-chemical
characteristics like color, depth, residence time, slope, and substrate.
5. How is your biological/ecological assessment information used in combination with chemical
and physical data to make impairment decisions?
MassDEP typically relies on the biological indicators for assessment and only uses
nutrient concentrations to ‘confirm’ a problem with a nutrient source.
The Association of Clean Water Administrators
Page 57 of 138 | Use of Biological Assessment in State Water Programs: Focus on Nutrients
6. Do you currently consider biological assessment information when developing NPDES
permits? If so, please describe how this is done.
Biological assessment is considered with BPJ to call for reduced TP or TN limits at
WWTP discharges using an adaptive management approach. NPDES limits are typically
set more to limit of technology which is moving effluent limits from 0.5 to 0.2 or 0.1
mg/l for phosphorus and 8 mg/L to 5 mg/L for total nitrogen.
Biological response indicators have been used as targets in TMDL development. For
example the Upper/Middle Phosphorus TMDL for the Charles River established an in
stream target of <10 ug/L chlorophyll-a (seasonal mean) and <18.9 ug/L chlorophyll-a
(peak). An HSPF model was used to evaluate a range of management scenarios that
included a combination of point and non-point source load reductions. Water quality
standards and the biological indicator targets were predicted to be met under worst case
conditions (both extreme low flow and extreme high flow) through water quality
modeling efforts when management scenarios set wastewater discharge limits for all
WWTFs at 0.1 mg/L TP during the summer months and 0.3 mg/L TP during the winter
months. The next round of NPDES permits will include these limits.
For stormwater, the Upper/Middle Charles TMDL sets phosphorus discharge limits by
land use category. The total phosphorus reductions from current conditions include:
Open/Agriculture 35%; Low Density Residential 45%; Medium Density Residential
65%; High Density Residential/Multi-Family 65%; Commercial/Industrial 65%; and
Transportation 65%. It is anticipated that these reductions will be include in future MS-4
permits.
The Association of Clean Water Administrators
Page 58 of 138 | Use of Biological Assessment in State Water Programs: Focus on Nutrients

Michigan
Contact: Gary Kohlhepp, [email protected]
1. Please provide a brief overview of relevant biological/ecological assessment work your state
is conducting.
The primary biological assessment conducted by the Michigan Department of
Environmental Quality (MDEQ) – Water Resources Division (WRD) includes fish and
benthic macroinvertebrate community assessments in streams and rivers. The MDEQ-
WRD has developed specific procedures and multi-metric indices for both communities,
mainly to determine attainment with Michigan Water Quality Standards. For the most
part, these bioassessments are conducted on a 5-year rotating basin schedule.
The MDEQ-WRD evaluates flowing waters and shorelines for nuisance algal conditions
although these assessments are subjective. For rivers and streams, the presence of
excess/nuisance growths of algae (i.e., Cladophera, Rhizoclonium, and cyanbacteria), or
aquatic macrophytes are used to determine if the other indigenous aquatic life and
wildlife use is being supported. A river or stream is considered impaired if one or more
of the following conditions are present: (1) Cladophera and/or Rhizodonium strands are
greater than 10 inches long covering greater than 25% of a riffle, (2) rooted macrophytes
are present at densities that impair designated uses of the water, and (3) the presence of
excess/nuisance growths of bacterial slimes. Field-based rapid bio-survey assessments of
periphyton biomass and coarse-level taxonomic composition have been used on a limited
basis to characterize macroalgae, microalgae, and substrate size to calculate algal cover
and density. Best professional judgment would then be used to determine if
excess/nuisance growths of algae occur, and whether or not designated uses are being
attained.
Although the MDEQ-WRD does not routinely collect biological data on inland lakes, the
department does conduct aquatic macrophyte surveys, and in conjunction with physical
(i.e., secchi depth) and chemical (i.e., total phosphorus and chlorophyll a) data, uses this
information to determine use support based on trophic status.
The Department of Natural Resources collects fish data in flowing waters and lakes, and
this information is sometimes used to evaluate designated use support. The MDEQ-
WRD also often uses water chemistry data to assess the aquatic life, wildlife, and fish
community designated uses.
The MDEQ-WRD has provided grant funding since 1999 to a researcher at the
University of Maryland (previously at Lake Superior State University and Clemson
University) to assess bald eagle productivity and contaminant levels. The MDEQ-WRD
also funds the Michigan Department of Community Health to analyze contaminant levels
in fish tissues.
Finally, the MDEQ-WRD has provided grant funding since the late 1990s to a variety of
local governments, universities, and watershed organizations for specific monitoring
The Association of Clean Water Administrators
Page 59 of 138 | Use of Biological Assessment in State Water Programs: Focus on Nutrients

projects which often include the collection of biological or ecological data from all types
of waterbodies.
2. Which biological indicators/parameters does your state use (or plan to use) to assess aquatic
life impacts due to nutrients?
The MDEQ-WRD currently makes limited use of aquatic macrophyte and algae (i.e.,
Cladophera, Rhizoclonium, and cyanobacteria) data to assess aquatic life impacts due to
nutrients.
3. How sensitive to nutrients have those indicators/parameters been? How did you determine
that?
The current approach using aquatic macrophyte and limited algal information to assess
impairments has not been very sensitive, and evaluates only whether nutrients are in
excess to cause, or contribute to, nuisance conditions. However, efforts are underway to
develop a more sensitive process of evaluating nutrient contributions to surface waters.
This process is necessary so that impacts due to nutrients can be detected before nuisance
levels occur, and waterbodies with low nutrient conditions can be protected.
4. During criteria development, how have you found the correlation between causal (chemical)
and response (biological/ecological) variables for nutrients? If so, what approach(es) has
your state used to refine those relationships? Please discuss challenges and successes you
have experienced.
This question was interpreted as asking “what relationships were found between causal
(chemical) and response (biological/ecological) variables for nutrients”. For lakes and
reservoirs, relationships between total phosphorus and biological response variables such
as algal biomass, macrophyte cover, and zooplankton metrics were evaluated. Linear
regression was used to quantify linear relationships, and regression tree analysis was used
to quantify non-linear relationships. These relationships were found to be moderately
strong. In flowing waters, relationships between nutrients and response variables such as
diatoms, benthic macroinvertebrates, and fish were examined. The strongest nutrient
relationship was with diatoms.
5. How is your biological/ecological assessment information used in combination with chemical
and physical data to make impairment decisions?
In general, most designated uses have one or more types of assessment that may be used
to determine support. For example, to determine support for the other indigenous aquatic
life or wildlife designated use, biological or physical/chemical assessment (e.g., rapid
bioassessment of the macroinvertebrate community or chemical analysis of water
samples) may be used. The assessment types include biological, habitat, physical,
chemical, toxicological, pathogen indicators, other public health indicators, and other
aquatic life indicators (default types from the USEPA Assessment Database (ADB)). In
addition, a variety of parameters may be considered for the same assessment type. For
The Association of Clean Water Administrators
Page 60 of 138 | Use of Biological Assessment in State Water Programs: Focus on Nutrients

example, chemical assessments to determine fish consumption designated use support
may include analysis of mercury concentration in fish tissue or PCB concentration in the
water.
Michigan uses the principle of independent applicability when making a support
determination for each designated use for each water body. If data for more than one
parameter are available that are used to determine support for the same designated use,
then each data type is evaluated independently to determine support for the designated
use. If any one type of data indicates that the designated use is not supported, then
generally, the water body is listed as not supporting that designated use. Some particular
data types or situations require consideration of multiple data types in combination.
In regards to nutrients, Michigan currently does not have numeric nutrient criteria for
assessing impacts to surface waters. However, narrative nutrient criteria (rule
R323.1060), best professional judgment, and ambient water column total phosphorus
concentrations, and secchi depth, in conjunction with biological indicators (i.e., algal
biomass measured by chlorophyll a, aquatic macrophyte surveys, coarse-level algal
taxonomy) are used to determine support of the other indigenous aquatic life and wildlife
designated use.
For inland lakes, Carlson’s trophic state index (TSI) uses secchi depth, total phosphorus
concentrations and chlorophyll a concentrations in conjunction with aquatic macrophyte
surveys to determine use support based on trophic status. The chlorophyll a component of
the TSI is used as a surrogate for algal biomass. Lakes classified as oligotrophic,
mesotrophic or eutrophic are generally determined to support the other indigenous
aquatic life and wildlife designated use. Inland lakes classified as hypereutrophic are
generally listed as having insufficient information to make an assessment of designated
use support, or are considered to not meet designated uses. The non-attaining lakes are
listed on the 303(d) list as impaired due to nutrients and are scheduled for TMDL
development.
For rivers and streams, the presence of excess/nuisance growths of algae (i.e.,
Cladophera, Rhizoclonium, and cyanbacteria), or aquatic macrophytes are used to
determine if the other indigenous aquatic life and wildlife use is being supported. A river
or stream is considered impaired if one or more of the following conditions are present:
(1) Cladophera and/or Rhizodonium strands are greater than 10 inches long covering
greater than 25% of a riffle, (2) rooted macrophytes are present at densities that impair
designated uses of the water, and (3) the presence of excess/nuisance growths of bacterial
slimes.
Field-based rapid biosurvey assessments of periphyton biomass and coarse-level
taxonomic composition have been used on a limited basis to characterize macroalage,
microalgae, and substrate size to calculate algal cover and density. Best professional
judgment would be used to determine if excess/nuisance growths of algae occur, and
whether or not designated uses are being attained.
The Association of Clean Water Administrators
Page 61 of 138 | Use of Biological Assessment in State Water Programs: Focus on Nutrients

6. Do you currently consider biological assessment information when developing NPDES
permits? If so, please describe how this is done.
Biological assessment data are often considered when developing NPDES permits. If a
new or increased use is being considered, then the MDEQ-WRD considers whether
threatened/endangered species, or trout populations, may be impacted by the discharge.
Likewise, fish and/or benthic macroinvertebrate community data also may be considered,
especially if there are upstream/downstream data indicating potential impacts from a
discharge. Fish data also are used to determine whether a receiving water is a coldwater
stream/river.
If the NPDES facility is known to have, or potentially has, one or more bioaccumulative
chemicals in its discharge, then the MDEQ-WRD often will analyze fish tissue (native
fish and/or caged fish studies) to look for the presence of these contaminants. In some
cases, fish contaminant monitoring may be incorporated as a requirement into the
NPDES permit.
On a case-by-case basis, the MDEQ-WRD may conduct (or require a facility to conduct)
special biological/ecological studies. For example, biological sampling has been
conducted to assess impacts of biofilms resulting from an airport discharge and selenium
impacts from a mining facility with an NPDES permit.
Finally, if there is evidence of nuisance aquatic plant conditions downstream of an
NPDES facility, this information will be considered in relation to nutrient loadings from
the facility. Michigan’s current nutrient rule (R323.1060) contains a numeric effluent
standard of 1 mg/l that is generally applied to discharges that contain phosphorus. The
rule also contains narrative language that allows control of phosphorus at lower levels to
protect a waterbody from impacts due to nutrients if necessary. In those cases, the
MDEQ-WRD may issue NPDES permits with a phosphorus limit less than 1 mg/l.
The Association of Clean Water Administrators
Page 62 of 138 | Use of Biological Assessment in State Water Programs: Focus on Nutrients

Minnesota
Contact: Shannon Lotthamer, [email protected]
1. Please provide a brief overview of relevant biological/ecological assessment work your state
is conducting.
The Minnesota Pollution Control Agency (MPCA) conducts biological assessment of
streams based on fish and invertebrate IBIs, eutrophication assessment of lakes, and
biological assessment of wetlands based on plant and invertebrate IBIs (among other
assessments).
Minnesota is implementing a rotating watershed approach whereby the biology,
chemistry and physical characteristics of each of the state’s 81 major (i.e. HUC-8)
watersheds is intensively monitored two years out of every 10 (Figure 1). Using this
watershed approach, the MPCA conducts monitoring in an average 8 major watersheds
each year, and will complete statewide monitoring over a 10-year period.
For streams, monitoring sites are selected following a “pour point” design, with
biological, habitat and 1x chemistry monitoring at all the sites; more intensive chemistry
monitoring at the 11-digit HUC sites; and a permanent flow and chemistry station at the
mouth of the major watershed (see Figure 2). Data are collected over a two year period,
and the data are then assessed for impairment determination.
For lakes, MPCA and its partners collect paired phosphorus, Secchi depth and
chlorophyll-a samples over at least two years for assessing the aquatic recreation
designated use. The goal is to sample all lakes 500 acres or larger and at least 50 percent
of lakes 100 to 500 acres in size over each 10-year cycle. This translates to sampling
about 100 lakes each year. The MPCA primarily relies on local partners funded through
state grants to sample lakes smaller than 100 acres in size, as well as additional lakes in
the 100 to 500 acre size range. Through the state Department of Natural Resources,
Minnesota is also developing IBIs for assessing aquatic life in lakes in the future.
MPCA’s wetland monitoring and assessment activities are not integrated into the
watershed approach in a systematic way. MPCA does not routinely monitor wetlands for
the purpose of watershed assessment, except for wetlands that are connected to or affect
an adjacent or nearby impaired water body.
2. Which biological indicators/parameters does your state use (or plan to use) to assess aquatic
life impacts due to nutrients?
As noted above, MPCA currently only assess lakes for aquatic recreation impacts due to
nutrients; that assessment includes chlorophyll-a (i.e. suspended algae) and Secchi depth
as indicators (along with TP). Minnesota is in the process of developing IBIs based on
fish and (most likely) plants to use in future aquatic life assessments of lakes.
The Association of Clean Water Administrators
Page 63 of 138 | Use of Biological Assessment in State Water Programs: Focus on Nutrients
For streams, MPCA is using or plans to use chlorophyll-a (suspended algae), fish IBIs
and invertebrate IBIs to assess for aquatic life impacts. Chlorophyll-a, along with
dissolved oxygen flux (daily DO range), pH and BOD5, represent the three response
variables that are proposed for Minnesota’s river eutrophication standard; while TP
represents the causative variable. Benthic or periphyton chlorophyll-a will be used as a
numeric translator for a portion of our narrative water quality standards. In the case of
biological (fish or macroinvertebrate) impairments and periphyton chlorophyll-a, a
stressor identification process will be used to determine the pollutant(s) or other factors
causing the problem.
3. How sensitive to nutrients have those indicators/parameters been? How did you determine
that?
For lakes, chlorophyll-a (and Secchi depth) is extremely sensitive to total phosphorus,
with a very strong correlation exhibited. This was determined through regression
analysis. The work to compare the lake IBIs under development to nutrients to evaluate
their relationship is still underway.
For streams, the relationship between total phosphorus, chlorophyll-a, DO flux and BOD
is also very strong (see the MPCA’s river eutrophication criteria technical support
document at http://www.pca.state.mn.us/index.php/view-document.html?gid=14947 for
details). MPCA also found strong relationships between total phosphorus and specific
components of the fish and invertebrate IBIs; that data was also used in the development
of the draft river eutrophication criteria. The sensitivity analysis was determined via
quantile regression and changepoint analysis. Preliminary analyses indicate that rivers
that fail to meet the proposed eutrophication criteria also fail biocriteria. Although
multiple stressors can impact the biological community, these analyses indicate that the
fish and macroinvertebrate IBIs are sensitive to eutrophication. Targeted research
indicated that sestonic chlorophyll-a will be most applicable to medium- to high-order
rivers, while periphyton chlorophyll-a will be most applicable to shallow low-order
streams.
4. During criteria development, how have you found the correlation between causal (chemical)
and response (biological/ecological) variables for nutrients? If so, what approach(es) has
your state used to refine those relationships (e.g., subcategorizing waters, adjusting the
frequency and duration components of the criteria, using a range of TN and TP values,
developing site-specific numeric nutrient criteria, streamlining site-specific criteria
approaches, or other approaches)? Please discuss challenges and successes you have
experienced.
For lakes the relationships among TP, chlorophyll-a, algal bloom frequency and Secchi
transparency are well established in the literature and in the monitoring and research
conducted in development of our lake eutrophication standards. All of this is detailed in
the technical support documents and Statement of Need and Reasonableness (SONAR)
developed in support of Minnesota’s 2007-2008 water quality rule revision available at
http://www.pca.state.mn.us/index.php/view-document.html?gid=7269.
The Association of Clean Water Administrators
Page 64 of 138 | Use of Biological Assessment in State Water Programs: Focus on Nutrients

For rivers MPCA has detailed the correlations and relationships used to develop our
proposed river eutrophication standards in a series of technical support documents and
the SONAR. These may be found at http://www.pca.state.mn.us/index.php/water/water-
permits-and-rules/water-rulemaking/proposed-water-quality-standards-rule-revision.html.
5. How is your biological/ecological assessment information used in combination with chemical
and physical data to make impairment decisions?
For streams, data for individual parameters or biological indicators are first compiled,
analyzed, reviewed and compared against the relevant criterion/benchmark for that
parameter or indicator. Next the individual dataset reviews are brought forward to a
comprehensive review organized either by major watershed, for watersheds that have
been intensively monitored, or statewide for parameters that are monitored using a
statewide design.
Following the “parameter-level” analysis, an interdisciplinary team of technical reviewers
is convened for each watershed to review the data comprehensively. In cases where
individual parameter/indicator datasets to not agree, the team looks further into the
datasets – considering factors such as the relative robustness and applicability of the
datasets, the timing of monitoring, etc. – to arrive at a proposed use-support decision for
each stream assessment unit. That proposed decision is then carried forward to a
Professional Judgment Group discussion that includes resource managers from other
local and state agencies in addition to MPCA technical staff for additional review and
discussion as needed.
MPCA employs a stressor-response approach to assessing lakes for aquatic recreation
use-support. A lake is determined to be impaired for aquatic recreation use if phosphorus
and either chlorophyll-a or Secchi depth do not meet the lake eutrophication criteria. For
lakes to be assessed a minimum of eight paired observations of TP, Chl-a, and Secchi,
collected over a minimum of two summers must be available. Mean measurements are
compared to the standards. For rivers a similar approach is proposed whereby a minimum
of 6-8 samples are collected per summer over a minimum of two summers. In most
instances samples for TP and sestonic Chl-a will be collected; However diurnal DO flux,
BOD5 and pH may also be used as response variables. Again a river reach will need to
exhibit elevated TP and one or more of the four response variables to be considered
impaired.
6. Do you currently consider biological assessment information when developing NPDES
permits? If so, please describe how this is done.
Yes. At a minimum, where a biological impairment has been found and the stressor(s)
identified, MPCA considers that impairment information in the development of the
permit effluent limits if the facility is discharging a pollutant that could cause or
contribute to the impairment. Biological information and modeling is also considered
when developing NPDES permits for dischargers that may affect lakes. In addition,
The Association of Clean Water Administrators
Page 65 of 138 | Use of Biological Assessment in State Water Programs: Focus on Nutrients

Minnesota is currently working to develop tiered aquatic life uses (TALUs). In such a
system, the biological assessment will be a major factor in determining the aquatic life
use designation and therefore in setting NPDES permit limits.
The Association of Clean Water Administrators
Page 66 of 138 | Use of Biological Assessment in State Water Programs: Focus on Nutrients

Mississippi
Contact: Kim Caviness, [email protected]
1. Please provide a brief overview of relevant biological/ecological assessment work your state
is conducting.
Mississippi Department of Environmental Quality (MDEQ) has established the
Mississippi Benthic Index of Stream Quality (M‐BISQ) for wadeable streams throughout
the state (excluding the Mississippi Alluvial Plain). The M‐BISQ was developed in 2001
and was recalibrated in 2008.
MDEQ is currently in the process of developing a benthic index for streams within the
Mississippi Alluvial Plan (Mississippi Delta) as well as a benthic index for Mississippi’s
coastal and estuarine waters.
2. Which biological indicators/parameters does your state use (or plan to use) to assess aquatic
life impacts due to nutrients?
MDEQ is currently in the process of developing numeric nutrient criteria for all water
body types across the state. At this time, Mississippi is considering the use of benthic
macroinvertebrate communities, fish communities, and chlorophyll a concentrations as
biological indicators/parameters to assess aquatic life impacts due to nutrients.
MDEQ will continue to use the M‐BISQ to assess support ALUS. Once the other indices
are complete, they will also be used to assess ALUS in those regions of the state.
3. How sensitive to nutrients have those indicators/parameters been? How did you determine
that?
The M‐BISQ was sensitive (significant decline) to both N and P, based on
correlation/regression models using survey data. These relationships were considered
sufficient by review of the Nutrient Technical Advisory Group (TAG) to be used as a line
of evidence in deriving preliminary thresholds.
4. During criteria development, how have you found the correlation between causal (chemical)
and response (biological/ecological) variables for nutrients? If so, what approaches) has your
state used to refine those relationships (e.g., subcategorizing waters, adjusting the frequency
and duration components of the criteria, using a range of TN and TP values, developing site-
specific numeric nutrient criteria, streamlining site-specific criteria approaches, or other
approaches)? Please discuss challenges and successes you have experience.
Mississippi has used classification to reduce variability associated with biological
response. In addition, the state has incorporate propensity score analysis to verify the
causal relationship between nutrients and invertebrate indices. These analyses have
helped increased confidence in the basis for endpoints derived from the empirical models.
The Association of Clean Water Administrators
Page 67 of 138 | Use of Biological Assessment in State Water Programs: Focus on Nutrients
But this stressor‐response relationship is also being weighed against other lines of
evidence including reference based, modeled reference, mechanistic model output, and
scientific literature.
5. How is your biological/ecological assessment information used in combination with chemical
and physical data to make impairment decisions?
MDEQ’s position is that biological community measures (especially, robust, well
calibrated indices) provide a direct measure of ALUS. As such, biological data are given
more weight in the assessment process. When a community is determined to be impaired
(based on 25th percentile of the least disturbed condition), a stressor identification
process is undertaken to determine the primary probable cause of impairment. During the
stressor process, all chemical data are reviewed along with point source and land use
information to determine the primary probable cause of impairment.
6. Do you currently consider biological assessment information when developing NPDES
permits? If so, please describe how this is done.
In Mississippi, a biological assessment is made based on the M‐BISQ program. The
MDEQ Water Quality Assessment Staff determine, based on the data collected, if the
water body is attaining its designated use(s). If not, the water would be listed on
Mississippi’s 303(d) List of Impaired Waters. The water body is listed for “biologically
impairment.” The water body will then go through a stressor identification process to
identify the stressor (as described in #5 above). Once the primary probable stressor is
identified, a TMDL is developed for that stressor.
When issuing a NPDES permit, especially within an impaired water body, MDEQ will
consider all available data and information for the receiving water body. All data and
information are considered to ensure that protective permit limits are established.
The Association of Clean Water Administrators
Page 68 of 138 | Use of Biological Assessment in State Water Programs: Focus on Nutrients

Missouri Contact: John Ford, [email protected]
1. Please provide a brief overview of relevant biological/ecological assessment work your state
is conducting.
Missouri Department of Natural Resources (MDNR) has developed biocriteria for aquatic
invertebrate communities in wadeable (3rd
-4th
order) streams (and accompanying
sampling and enumeration protocols) and chooses about 50 sites each year which are
monitored twice during the year. The Missouri Dept. of Conservation (MDC) monitors
fish and invertebrate communities at about 70 to 100 sites each year. Sites are selected
randomly from most 2nd
to 5th
order streams. MDC uses MDNR protocols for
invertebrates and has developed fish community biocriteria for Ozark Plateau and Ozark
Border streams but not for Prairie or Mississippi Embayment streams.
2. Which biological indicators/parameters does your state use (or plan to use) to assess aquatic
life impacts due to nutrients?
MDNR has not looked at that question yet.
3. How sensitive to nutrients have those indicators/parameters been? How did you determine
that?
MDNR did do one invertebrate survey of a stream below a large WWTP and found that
some changes in the invertebrate fauna appeared to persist for over 20 miles downstream.
Nearer the WWTP there were obvious differences but further downstream we were still
seeing apparent substitutions of one species or genera for another even though diversity
indices were similar. Thus, MDNR believes invertebrate surveys may be quite sensitive
to nutrient levels.
4. During criteria development, how have you found the correlation between causal (chemical)
and response (biological/ecological) variables for nutrients? If so, what approach(es) has
your state used to refine those relationships (e.g., subcategorizing waters, adjusting the
frequency and duration components of the criteria, using a range of TN and TP values,
developing site-specific numeric nutrient criteria, streamlining site-specific criteria
approaches, or other approaches)? Please discuss challenges and successes you have
experienced.
MDNR has not yet looked at cause/effect relationships for nutrients in any systematic
way at this time.
5. How is your biological/ecological assessment information used in combination with chemical
and physical data to make impairment decisions?
The Association of Clean Water Administrators
Page 69 of 138 | Use of Biological Assessment in State Water Programs: Focus on Nutrients

A water can be assessed as “impaired” if either physical or chemical wq standards or
biological criteria are exceeded.
6. Do you currently consider biological assessment information when developing NPDES
permits? If so, please describe how this is done.
If waters are rated as impaired, the pollutant(s) causing the impairment must be
controlled by both point and nonpoint sources as per the allocations prescribed by the
TMDL study. If a point source discharges a pollutant(s) that was subject to a TMDL
allocation, the permit limits must reflect either the load allocated to this discharge or the
best practical treatment technology, whichever results in the higher limits.
The Association of Clean Water Administrators
Page 70 of 138 | Use of Biological Assessment in State Water Programs: Focus on Nutrients

Montana Contact: David Feldman, [email protected]; Michael Suplee, [email protected]
1. Please provide a brief overview of relevant biological/ecological assessment work your state
is conducting.
The state of Montana conducts biological/ecological evaluations to aid sediment, and
nutrient assessments when the physical and/or chemical data do not provide a clear
answer. You can find an overview of the Montana water quality assessment methods
online: http://deq.mt.gov/wqinfo/QAProgram/PDF/SOPs/FINAL_AssessmentMethod.pdf
2. Which biological indicators/parameters does your state use (or plan to use) to assess aquatic
life impacts due to nutrients?
Montana Department of Environmental Quality (MT DEQ) uses benthic algal biomass, a
diatom biometric, and a Montana-specific version of the Hilsenhoff Biotic Index (HBI)
for macroinvertebrates, to assess aquatic life impacts due to nutrients.
3. How sensitive to nutrients have those indicators/parameters been? How did you determine
that?
MT DEQ selected all three biological indicators using a combination of a literature
review, and an analysis of empirical data collected over many years. MT DEQ
extensively studied all three biological indicators, and selected them because they
consistently responded to increased nutrient levels. MT DEQ posted a document online
that provides an overview of the nutrient assessment method and how the biological
indicators were selected at this link:
http://deq.mt.gov/wqinfo/QAProgram/PDF/SOPs/final_nutrientmethod.pdf
4. During criteria development, how have you found the correlation between causal (chemical)
and response (biological/ecological) variables for nutrients? If so, what approach(es) has
your state used to refine those relationships (e.g., subcategorizing waters, adjusting the
frequency and duration components of the criteria, using a range of TN and TP values,
developing site-specific numeric nutrient criteria, streamlining site-specific criteria
approaches, or other approaches)? Please discuss challenges and successes you have
experienced.
A brief synopsis of the approaches used to make the correlations between biological
variables and nutrient levels is provided below. Please refer to the nutrient assessment
method link provided in response to question #3 for a detailed response to this question.
MT DEQ employed different strategies to determine if any correlations existed between
increased nutrient levels and instream biota. The streams in Montana were organized by
whether they were Mountain, or Plains streams. MT DEQ grouped those streams that
flowed through transitional areas between the mountains and plains with the mountain
The Association of Clean Water Administrators
Page 71 of 138 | Use of Biological Assessment in State Water Programs: Focus on Nutrients

streams. Each grouping was based upon TN and TP values measured from the DEQ
reference site network.
MT DEQ intended the benthic algae portion of the assessment method to help protect the
recreational use of streams. It was based upon scientific literature and a public opinion
survey where people were shown a photo series where they had to answer the question:
“Which photograph had too much algae?” MT DEQ collected benthic algal growth data
at the same time that the photos were taken so as to be able to relate the two together. The
people taking the survey were presented with photos from several streams with different
levels of benthic algal growth. The people that were interviewed consistently selected
photographs of streams with benthic algal levels greater than what was measured in
reference sites. They consistently answered the question by selecting the photos that were
taken from streams with benthic algal levels greater than 150 mg/m2. MT DEQ used the
results from that study combined with the levels measured from reference sites to justify
that level (150 mg/m2) as a potential numeric criterion to protect the recreational use of a
stream.
MT DEQ developed the diatom biometric to show biological change associated with
elevated instream nutrient, sediment, and metals values. First, the streams were classified
by their location in mountain transitional or plains regions in Montana. MT DEQ then
grouped the sites as either reference or impaired based upon any available data, and then
used a discriminant function analysis to identify the “increaser” diatom taxa that
consistently responded to the specific stressors within those streams.
MT DEQ has been using the Montana-specific Hilsenhoff Biotic Index (HBI) in different
DEQ Multimetric Indices for many years. MT DEQ worked with the EPA and Tetra
Tech and evaluated over 200 sampling events in Montana where they had both nutrient
and macroinvertebrate samples. The macroinvertebrate data was organized into several
hundred macroinvertebrate metrics. MT DEQ then compared those values to TN and TP
values using a change-point analysis. That analysis consistently showed a noisy, but
discernable (and significant) relationship between the HBI and nutrients. MT DEQ found
a consistent shift in the macroinvertebrate population around an HBI score of 4, and also
noticed that there was a precedent set for that HBI threshold because earlier versions of
the DEQ macroinvertebrate SOPs, used the same threshold to indicate impairment.
There is one big success to mention. MT DEQ dosed a stream in eastern Montana with
different levels of nitrogen and phosphorus. A BACIP (Before, After, Control, Impaired,
Paired) study design was used. This allowed MT DEQ to evaluate any macroinvertebrate,
diatom, or benthic algae community shifts before dosing began, during, and after the
dosing event. MT DEQ measured significant shifts of all three biological indicators
associated with the nutrient dosing event. This is a big deal because there has not been
much luck relating nutrient impairment with biological indicators in plains streams. MT
DEQ did discover that the Montana-specific HBI did not show a significant shift
associated with the dosing event. This is interesting because it worked so well in the other
analysis where we selected it for use with the Montana nutrient assessment method. MT
DEQ will draft a technical report describing this study in 2012.
The Association of Clean Water Administrators
Page 72 of 138 | Use of Biological Assessment in State Water Programs: Focus on Nutrients
5. How is your biological/ecological assessment information used in combination with chemical
and physical data to make impairment decisions?
MT DEQ uses biological and ecological assessment information to help clarify if the
aquatic life use of a stream or waterbody is impaired by a given pollutant or pollution.
This information is used when the chemical and physical data are close to the standard, or
occasionally exceeded the standard. Please refer to the document referenced in question
#1 for a detailed answer to this question.
6. Do you currently consider biological assessment information when developing NPDES
permits? If so, please describe how this is done.
MT DEQ does not use biological information to develop NPDES permits.
The Association of Clean Water Administrators
Page 73 of 138 | Use of Biological Assessment in State Water Programs: Focus on Nutrients

Nebraska
Contact: Ken Bazata, [email protected]
1. Please provide a brief overview of relevant biological/ecological assessment work your state
is conducting.
Nebraska Department of Environmental Quality (NDEQ) has used fish and
macroinvertebrate biological assessments for stream evaluations since the mid-80s.
However, the metrics were not finalized until the mid-90s. NDEQ used the REMAP data
set as our source of standardization.
2. Which biological indicators/parameters does your state use (or plan to use) to assess aquatic
life impacts due to nutrients?
The metrics are not set up for nutrients as such. Nutrients are a general consideration, but
there is not enough data to do this. NDEQ does not have standards for nutrients.
3. How sensitive to nutrients have those indicators/parameters been? How did you determine
that?
Unknown.
4. During criteria development, how have you found the correlation between causal (chemical)
and response (biological/ecological) variables for nutrients? If so, what approach(es) has
your state used to refine those relationships (e.g., subcategorizing waters, adjusting the
frequency and duration components of the criteria, using a range of TN and TP values,
developing site-specific numeric nutrient criteria, streamlining site-specific criteria
approaches, or other approaches)? Please discuss challenges and successes you have
experienced.
NDEQ used a reference site approach to setting criteria. The reference site selection sets
up higher ratings. From there, trisections were used to calculate the various ratings.
NDEQ also divided waters into cold/warm water, small/medium/large/river flows, and
ecoregions. The state was divided into sandhills and western Nebraska versus the rest of
the state.
5. How is your biological/ecological assessment information used in combination with chemical
and physical data to make impairment decisions?
NDEQ uses chemistries, fish and macroinvertebrate bioassessments, fish kills, and fish
tissue chemistries for the integrated report.
6. Do you currently consider biological assessment information when developing NPDES
permits? If so, please describe how this is done.
The Association of Clean Water Administrators
Page 74 of 138 | Use of Biological Assessment in State Water Programs: Focus on Nutrients

At this time, NDEQ does not use the biological assessments for this.
The Association of Clean Water Administrators
Page 75 of 138 | Use of Biological Assessment in State Water Programs: Focus on Nutrients
Nevada
Contact: Kathy Sertic, [email protected]
1. Please provide a brief overview of relevant biological/ecological assessment work your state
is conducting.
Nevada Division of Environmental Protection (NDEP) has developed Nutrient
Assessment Protocols for Wadeable Streams, which is a multi-tiered approach for
assessing nutrient impairment status. Level I assessments are primarily qualitative visual
surveys and estimation of algal biomass or the percentage of the stream bottom covered
by filamentous algae, microalgae and macrophytes. Generally, if the coverage is greater
than 25%, Level II assessments are conducted which include more quantitative
measurements of algal biomass, daily minimum/maximum dissolved oxygen, pH and
temperature.
Nevada is also in the process of developing models to assess biological assemblages
including the RIVPACS-based observed/expected indices and multimetric indices.
2. Which biological indicators/parameters does your state use (or plan to use) to assess aquatic
life impacts due to nutrients?
Algal characteristics including biomass, chlorophyll-a and ash free dry weight and
macroinvertebrate assemblages.
3. How sensitive to nutrients have those indicators/parameters been? How did you determine
that?
In general, high algae levels are seen in waters that exceed the numeric or narrative
nutrient standards; however, exceptions have been documented.
4. During criteria development, how have you found the correlation between causal (chemical)
and response (biological/ecological) variables for nutrients? If so, what approach(es) has
your state used to refine those relationships (e.g., subcategorizing waters, adjusting the
frequency and duration components of the criteria, using a range of TN and TP values,
developing site-specific numeric nutrient criteria, streamlining site-specific criteria
approaches, or other approaches)? Please discuss challenges and successes you have
experienced.
Program is still under development and much more data is needed to quantify the
correlation between causal and response variables.
5. How is your biological/ecological assessment information used in combination with chemical
and physical data to make impairment decisions?
At this time, impairment decisions are made solely on exceedances of numeric criteria.
The Association of Clean Water Administrators
Page 76 of 138 | Use of Biological Assessment in State Water Programs: Focus on Nutrients

6. Do you currently consider biological assessment information when developing NPDES
permits? If so, please describe how this is done.
Not at this time.
The Association of Clean Water Administrators
Page 77 of 138 | Use of Biological Assessment in State Water Programs: Focus on Nutrients

New Hampshire
Contact: Gregg Comstock, [email protected]; David Neils,
[email protected]; Phil Trowbridge, [email protected]; Ken
Edwardson, [email protected]
1. Please provide a brief overview of relevant biological/ecological assessment work your state
is conducting.
Rivers are currently assessed for aquatic life use using fish and macroinvertebrates. Over
the past five years, the NH Department of Environmental Services (NHDES) has
collected nutrient and macroinvertebrate data from approximately 100 streams and rivers
to assist in establishing numeric nutrient criteria. In 2011 NHDES began collecting algal
abundance and composition data from rivers and streams in conjunction with the
parameters noted above. Given our current level of staffing sampling is restricted to
approximately 20 sites / year. Fish are not considered to be an important indicator for use
in setting numeric nutrient criteria.
In estuaries, seagrass habitat is mapped every year because New Hampshire has a small
coastline and only one major estuary. Benthic invertebrates and pelagic fish are
monitored every five years as part of national probabilistic surveys, although these
species are not considered relevant to eutrophication.
2. Which biological indicators/parameters does your state use (or plan to use) to assess aquatic
life impacts due to nutrients?
To assess the primary contact recreation designated use, NHDES uses a chlor a threshold
of 15 ug/l in fresh waters and 20 ug/L chlor a in tidal waters.
Freshwater Rivers: NHDES envisions macroinvertebrates and algae will serve as the
primary response variable used to establish numeric nutrient criteria in freshwater rivers
and streams for the aquatic life designated use.
Lakes: Trophic class based total phosphorus and chlor a criteria is currently used to
protect the aquatic life designated use in lakes. TP is assessed as a cause of impairment
only when the response variable (chlor a) exceeds the threshold for a given lake’s best
historic trophic class. The criteria were primarily determined using the EPA reference
approach. For more details see the NH 2010 Consolidated Assessment and Listing
Methodology (CALM), page 57 at
http://des.nh.gov/organization/divisions/water/wmb/swqa/documents/2010calm.pdf and
http://des.nh.gov/organization/divisions/water/wmb/wqs/documents/20090122_lake_phos
_criteria.pdf.
Estuaries: In NH estuaries, the primary indicators of nutrient enrichment are seagrass
habitat and dissolved oxygen. DES also uses proposed criteria for total nitrogen
concentrations for make assessments of estuarine waters. See
The Association of Clean Water Administrators
Page 78 of 138 | Use of Biological Assessment in State Water Programs: Focus on Nutrients
http://des.nh.gov/organization/divisions/water/wmb/wqs/documents/20090610_estuary_c
riteria.pdf for details.
3. How sensitive to nutrients have those indicators/parameters been? How did you determine
that?
Rivers: Analysis of macroinvertebrate data with respect to nutrient levels is currently
limited to approximately 70 locations. The preliminary results show this response
variable to be coarse indicator. The difficulty in detecting a strong threshold using
macroinvertebrate is reflective of the narrow and low range of nutrient concentrations
found in NH waters. Additional results will be available in spring 2012 through a draft
report submitted to EPA in order to satisfy a 104(b)(3) grant. A complete analysis of
algal data will not be available until additional sites are sampled over the course of the
next 4-5 years.
Lakes : As discussed our response to question 2 above, the EPA reference approach was
used to determine trophic based total phosphorus and chlor a criteria for the protection of
aquatic life in lakes.
Estuaries: DES completed a five year study of nutrients and eutrophication in the Great
Bay Estuary. Dissolved oxygen and seagrass habitat were identified by an advisory
committee as being the most sensitive endpoints for excess nutrients. Regressions of
dissolved inorganic, total dissolved, and total nitrogen concentrations versus seagrass
habitat and dissolved oxygen deficits were used to establish causal linkages between the
nutrients and the effects. For details, see:
http://des.nh.gov/organization/divisions/water/wmb/wqs/documents/20090610_estuary_c
riteria.pdf.
4. During criteria development, how have you found the correlation between causal (chemical)
and response (biological/ecological) variables for nutrients? If so, what approach(es) has
your state used to refine those relationships (e.g., subcategorizing waters, adjusting the
frequency and duration components of the criteria, using a range of TN and TP values,
developing site-specific numeric nutrient criteria, streamlining site-specific criteria
approaches, or other approaches)? Please discuss challenges and successes you have
experienced.
Rivers: As noted above, to date New Hampshire Discharge Elimination System
(NHDES) has only explored the relationship between nutrients and macroinvertebrates.
The techniques used include linear regression, weighted averaging (taxa optima),
changepoint, conditional probability, and basic distributional plots. At this point,
macroinvertebrate community condition is weakly correlated to total phosphorus
concentration. It is believed that the strength of this relationship could be improved upon
with additional samples, specifically if NHDES could expand the upper range of
phosphorus concentrations. There is no indication that macroinvertebrate communities
respond to total nitrogen. For these analyses, streams were broken into 3 classes in order
The Association of Clean Water Administrators
Page 79 of 138 | Use of Biological Assessment in State Water Programs: Focus on Nutrients

to limit the influence of natural variation. NHDES has not explored the development of
site specific criteria.
Lakes: As discussed in the response to question 2 above, the EPA reference approach
was used to determine trophic based total phosphorus and chlor a criteria for the
protection of aquatic life in lakes.
Estuaries: Relationships between causal and response variables were improved when
long-term average concentrations at stations were used, instead of individual results.
Monthly grab sample results for chlorophyll-a and dissolved oxygen are highly
dependent on weather patterns, zooplankton populations, and other factors. These
covariates often mask the relationships between nutrient and primary productivity. This
approach is discussed in the final report. For details, see:
http://des.nh.gov/organization/divisions/water/wmb/wqs/documents/20090610_estuary_c
riteria.pdf.
5. How is your biological/ecological assessment information used in combination with chemical
and physical data to make impairment decisions?
For nutrients, the response variable must exceed criteria for the nutrient parameter to be
considered an impairment. For estuarine assessments using this approach see:
http://des.nh.gov/organization/divisions/water/wmb/swqa/2008/documents/20090813_30
3d_list_update.pdf.
For other chemical measurements; pH, DO, toxics,… independent applicability applies.
In cases of sediment data, a sediment triad approach makes use of the Hazard Quotient-
Threshold Effect Concentrations (HQ-TEC), then Bioassays, and then full biological
surveys depending on the availability of data.
6. Do you currently consider biological assessment information when developing NPDES
permits? If so, please describe how this is done.
NH is not a delegated State. All wastewater treatment facilities (WWTFs) in NH
discharge to either rivers or tidal waters.
For WWTFs that discharge directly to freshwater rivers, EPA typically uses the mass
balance equation to establish WWTF phosphorus effluent limits where the downstream
instream concentration is set at 0.1 mg/L, the upstream river flow is set at the 7Q10 low
flow, the upstream concentration is based on background measurements, and the WWTF
flow is set at the design flow.
In estuaries, EPA is currently using the results of nitrogen loading models prepared by
NHDES to estimate the nitrogen concentration in the estuary under different WWTF
loading scenarios. The nitrogen loading models predict the maximum watershed load of
nitrogen for which the estuary will attain standards for dissolved oxygen and seagrass
habitat.
The Association of Clean Water Administrators
Page 80 of 138 | Use of Biological Assessment in State Water Programs: Focus on Nutrients

New Jersey
Contact: Debra Hammond, [email protected]
1. Please provide a brief overview of relevant biological/ecological assessment work your state
is conducting.
Benthic macroinvertebrates: Early on New Jersey Department of Environmental
Protection (NJDEP) used the NJ Impairment (NJIS) score to assess wadeable streams.
NJIS was based on family-level taxonomy and classified results into three conditions. In
2003, NJDEP began working on refinements to NJIS based on genus/species-level
taxonomy that is more appropriate to the various ecoregions. NJDEP also worked with
TetraTech to establish scores using the Biological Condition Gradient (BCG). NJDEP
now uses three ecoregional indexes and is working to further refine these indices for
application in assessing headwaters. http://www.state.nj.us/dep/wms/bfbm/amnet.html
NJDEP is currently working to develop an IBI using benthic organisms for nearshore
ocean waters and estuaries.
Fish: NJDEP has a Fish IBI for high gradient waters and is currently working to develop
a Fish IBI for NJ coastal plains. http://www.state.nj.us/dep/wms/bfbm/fishibi.html
Diatoms: A diatom index for wadeable streams has been developed and is currently
under review by the Science Advisory Board. NJDEP is also currently developing a lake
diatom index. http://www.state.nj.us/dep/dsr/nutrient/streams.htm
2. Which biological indicators/parameters does your state use (or plan to use) to assess aquatic
life impacts due to nutrients?
Freshwaters: Currently use benthic macroinvertebrates and fish to assess aquatic life
use. NJDEP is adding periphyton chlorophyll a, and diatoms to further evaluate if the
biological conditions could be due to excessive nutrients. The resources needed to
conduct periphyton monitoring which is used to calculate chlorophyll a and enumerate
diatoms so that the sites can be assessed by the index are not adequate.
Estuarine waters: NJDEP is developing a benthic index but is also working to
incorporate other nutrient related biological responses into a more comprehensive
eutrophication index. These other indicators include chlorophyll a, brown tide, SAV.
3. How sensitive to nutrients have those indicators/parameters been? How did you determine
that?
NJ adopted 0.1mg/l TP in the 1980’s. NJDEP identified waters with higher levels with
concentrations of phosphorus – fast flowing, full canopy, colored waters, with good
biological conditions. Waters with very low concentrations of nutrients but exhibit
significant biological responses were also identified. Generally macroinvertebrates don’t
display a strong relationship to nutrients. In many cases, benthic macroinvertebrates are
The Association of Clean Water Administrators
Page 81 of 138 | Use of Biological Assessment in State Water Programs: Focus on Nutrients
affected more by habitat disturbance. It’s critical that there be some measure of
productivity, which is why NJDEP has included diurnal dissolved oxygen. NYDEC has
successfully created a nutrient biotic index but we didn’t have enough nutrient data to
create similar index for NJ waters. NJDEP decided to evaluate the development of
diatom index that would better predict nutrient levels. The Science Advisory Board is
reviewing this work and upon completion NJDEP will consider what revisions would be
made to the assessment process.
4. During criteria development, how have you found the correlation between causal (chemical)
and response (biological/ecological) variables for nutrients? If so, what approach(es) has
your state used to refine those relationships (e.g., subcategorizing waters, adjusting the
frequency and duration components of the criteria, using a range of TN and TP values,
developing site-specific numeric nutrient criteria, streamlining site-specific criteria
approaches, or other approaches)? Please discuss challenges and successes you have
experienced.
NJDEP’s WQS include a narrative nutrient criteria and a numeric phosphorus criteria.
The impacts of nutrients are best assessed through a weight of evidence approach. Load
Allocations and wasteload allocations need to have a numeric phosphorus value to
establish reductions when necessary. Since NJDEP’s WQS do not specify averaging
period or frequency, NJDEP has used Chlorophyll a as the end point, developed site-
specific averaging periods, and developed reference conditions, while they continue
working towards enhancing our nutrient criteria. To avoid rulemaking, NJDEP included
a provision in its WQS that allow the TMDL program to develop response indicators or
other criteria (DO, pH) or modify the state-wide TP criteria to ensure compliance with
the narrative nutrient criteria as part of the TMDL. This provides the interested public an
opportunity to review and comment on the criteria as part of the TMDL. Once adopted, a
site-specific criteria can be added to the WQS.
http://www.state.nj.us/dep/wms/bwqsa/swqs.htm
5. How is your biological/ecological assessment information used in combination with chemical
and physical data to make impairment decisions?
While NJDEP has been listing waters based on biological monitoring – benthics and fish,
they only began using a weight of evidence approach based on biological monitoring for
nutrient assessments 2010. NJDEP’s 2010 Assessment Methods incorporated a narrative
nutrient assessment for wadeable streams which required biological monitoring along
with continuous dissolved oxygen. The assessment methods specified that 3ppm swing
was an indication of excessive photosynthetic activity caused by nutrients. For
inconclusive assessment (DO does not exceed the minimum criteria but does display
diurnal fluctuation, NJDEP looked at seasonal periphyton chlorophyll a to determine
whether nutrients are impacted the waterbody.
http://www.state.nj.us/dep/wms/bwqsa/generalinfo.htm
6. Do you currently consider biological assessment information when developing NPDES
permits? If so, please describe how this is done.
The Association of Clean Water Administrators
Page 82 of 138 | Use of Biological Assessment in State Water Programs: Focus on Nutrients

NJ has a numeric phosphorus criteria which is used to develop WQBELs. NJDEP
continues listing waters based on our numeric phosphorus criteria where the data is
lacking to conduct an assessment, but will also be listing phosphorus based on the
narrative nutrient assessment which will capture waters where the levels of nutrients are
below the current numeric criteria but are sufficient to cause nutrient related impacts.
NJDEP’s permitting program imposes effluent limits for phosphorus if the water is listed
on our 303(d) list regardless of whether it’s based on exceeding the numeric or narrative
nutrient criteria. However, the facility is provided an opportunity to conduct a water
quality study to demonstrate that nutrients do not render the waters unsuitable for their
designated uses. This study incorporates diurnal dissolved oxygen monitoring,
periphyton chlorophyll a, and other parameters. http://www.nj.gov/dep/dwq/pdf/p-
manual-07-30-08.pdf
The Association of Clean Water Administrators
Page 83 of 138 | Use of Biological Assessment in State Water Programs: Focus on Nutrients

New Mexico
Contact: Shelly Lemon, [email protected]; Seva Joseph, [email protected]
1. Please provide a brief overview of relevant biological/ecological assessment work your state
is conducting.
Benthic Macroinvertbrates – New Mexico Environment Department (NMENV)
developed multimetric index for mountainous region; use reference site comparison
for other regions (plains/xeric); use these approaches to assess (and list if no other
physical/chemical causes are identified). Benthic data has also been used to develop
stream bottom sediment thresholds to assess the State’s narrative criteria
Periphyton – have collected 10 years of species enumeration data – recent analysis
has not found any relevant thresholds/ metrics useful for assessment purposes etc.
NMENV also analyzes stream periphyton chlorophyll a concentration for its nutrient
assessment protocol
Phytoplankton – in lakes and reserovoirs NMENV collects both chlorophyll a and
species composition data; chlorophly a and %blue-green algal composition are
currently being investigated for development of a lakes nutrient assessment protocol
Fish – NMENV has collected 10 years’ worth of fish species enumeration and is in
the process of investigating the possibility of a Fish IBI
2. Which biological indicators/parameters does your state use (or plan to use) to assess aquatic
life impacts due to nutrients?
For wadeable perennial streams nutrient assessment – currently the only one which
NMENV uses for 303d listing – NMENV looks at cause variables (TN and TP)
concentrations and response variables (chlorophyll a, DO diel variability, pH). In general
the sensitivity is dictated by the location – mountain streams are very sensitive whereas
xeric (and turbid) streams are no sensitive and have much high thresholds for causal
variables and typically do not show significant change in response variability (they are
light limited systems not nutrient limited)
For lakes MNENV is still in development but for response variables they are also
considering water column chlorophyll a and % blue-green abundance
3. How sensitive to nutrients have those indicators/parameters been? How did you determine
that?
See above. For wadeable streams NMENV furthered EPA’s ecoregion approach to set
TN/TP thresholds and followed a similar process for chlorophyll a targets; for DO and
pH we uses values found in our standards.
4. During criteria development, how have you found the correlation between causal (chemical)
and response (biological/ecological) variables for nutrients? If so, what approach(es) has
your state used to refine those relationships (e.g., subcategorizing waters, adjusting the
The Association of Clean Water Administrators
Page 84 of 138 | Use of Biological Assessment in State Water Programs: Focus on Nutrients

frequency and duration components of the criteria, using a range of TN and TP values,
developing site-specific numeric nutrient criteria, streamlining site-specific criteria
approaches, or other approaches)? Please discuss challenges and successes you have
experienced.
NMENV has not looked at this explicitly – rather our assessment approach (for a
narrative standard) requires us to look at both causal and response variables in order to
list a stream an impaired for nutrients. If a response variable was found without elevated
TN/TP it would simply be listed for that parameter (e.g. DO) as nutrients are not the
cause. Conversely if TN/TP exceeds the targets but there is not response variable
impairment – then the level of nutrients in this stream is still acceptable (i.e. it does not
lead to an exceedence of our narrative criterion which puts the limit on “produce
undesirable aquatic life”). NMENV can use this approach because they have a narrative
standard and it is one of the reasons why they do not intend to pursue numeric criteria.
5. How is your biological/ecological assessment information used in combination with chemical
and physical data to make impairment decisions?
See above – regarding nutrients specifically. In general New Mexico does not list for
biological/ecological (e.g. benthic index) or other response variables (e.g. DO) if a cause
variable is identified (e.g. nutrients or excessive fines on the stream bottom)
6. Do you currently consider biological assessment information when developing NPDES
permits? If so, please describe how this is done.
New Mexico does not issue NPDES permits as we do not have primacy. EPA R6 issues
New Mexico’s permits and NMENV is not aware that they consider biological
assessment information in the NPDES permit development.
The Association of Clean Water Administrators
Page 85 of 138 | Use of Biological Assessment in State Water Programs: Focus on Nutrients

New York
Contact: NYSDEC Division of Water (A.J. Smith, [email protected];
Margaret Novak, [email protected]; Jeff Myers,
1. Please provide a brief overview of relevant biological/ecological assessment work your state
is conducting.
New York Department of Environmental Conservation (NYSDEC) maintains an ongoing
(40 year history) biological monitoring program using macroinvertebrates and diatoms,
for assessing biological condition and water quality of flowing surface waters statewide.
A four tiered assessment framework is used to rank water quality based on biological
condition. In addition to this core program, efforts are underway to look at biological
condition and develop appropriate assessment methodologies for lakes and high-elevation
low-order streams. Recently NYS has begun to integrate its biological assessment
methods into water quality standards development in the form of effects-based nutrient
criteria. Biological response is an integral piece in identifying impairment and
exceedence of criteria.
2. Which biological indicators/parameters does your state use (or plan to use) to assess aquatic
life impacts due to nutrients?
Benthic macroinvertebrae community metrics will be used to assess aquatic life impacts
due to nutrients. While NYS uses diatoms in making water quality assessments, these
metrics are not currently incorporated as a response variable in the nutrient criteria under
development.
3. How sensitive to nutrients have those indicators/parameters been? How did you determine
that?
In New York State, a nutrient biotic index for macroinvertebrates was developed, which
has proven to be a robust measure of the effects of nutrient enrichment on these
communities (Smith and others 2007). This has been incorporated into the multi-metric
index used in NY, the Biological Assessment Profile (Smith and others 2009).
4. During criteria development, how have you found the correlation between causal (chemical)
and response (biological/ecological) variables for nutrients? If so, what approach(es) has
your state used to refine those relationships (e.g., subcategorizing waters, adjusting the
frequency and duration components of the criteria, using a range of TN and TP values,
developing site-specific numeric nutrient criteria, streamlining site-specific criteria
approaches, or other approaches)? Please discuss challenges and successes you have
experienced.
NYSDEC has found that as long as they use nutrient-specific community metrics they see
significant response to chemical variables. Capitalizing on these metrics and integrating
The Association of Clean Water Administrators
Page 86 of 138 | Use of Biological Assessment in State Water Programs: Focus on Nutrients

them into regular assessment methods provides a mechanism for assessing nutrient
condition and over-enrichment.
NYSDEC finds small differences in response variables between ecoregions and water
body size. NYSDEC conducted several investigations including splitting data into
ecoregional and/or various stream size classes. Differences were never great enough to
warrant establishing separate criteria for each (Smith and Tran 2010).
NYSDEC has defined a mechanism of using a combination of assessing response
variable condition along with chemical values to indicate impairment status. This
provides something similar to site-specific nutrient criteria but allows the biological
condition to be the driver in the decision making process.
5. How is your biological/ecological assessment information used in combination with chemical
and physical data to make impairment decisions?
NYSDEC uses a combination of the chemical value (base criterion) and the status of
biological condition within their four tiered assessment framework. The process is as
follows:
[Nutrient] < Base
Criterion
[Nutrient] ≥ Base
Criterion
Biological Condition Non-Slight Not nutrient impaired Nutrient threatened
Biological Condition Mod-
Severe
Nutrient threatened Nutrient impaired
Surface waters that fall into the threatened category are allowed to exceed the “base
criterion” up to a level defined as the “modified criterion” as long as biological condition
is proven not to enter into the assessed condition of moderate-severe impact.
6. Do you currently consider biological assessment information when developing NPDES
permits? If so, please describe how this is done.
Occasionally, biological assessment information is used by permit writers when
developing permits and very occasionally subsequent assessment work is required of the
discharger, but this is not currently standard procedure used in NYS.
References
Smith AJ, Bode RW, Kleppel GS (2007) A nutrient biotic index (nbi) for use with benthic
macroinvertebrate communities. Ecological Indicators 7: 371-386.
Smith AJ, Heitzman DL, Duffy BT (2009) Standard operating procedure: Biological monitoring
of surface waters in New York State, New Yoprk State Department of Environmental
Conservation, Stream Biomonitoring Unit. Technical Report, p. 159.
The Association of Clean Water Administrators
Page 87 of 138 | Use of Biological Assessment in State Water Programs: Focus on Nutrients

Smith AJ, Tran CP (2010) A weight-of-evidence approach to define nutrient criteria protective of
aquatic life in large rivers. Journal of the North American Benthological Society 29: 875-891.
The Association of Clean Water Administrators
Page 88 of 138 | Use of Biological Assessment in State Water Programs: Focus on Nutrients

North Carolina
Contact: Dianne Reid, [email protected]
1. Please provide a brief overview of relevant biological/ecological assessment work your state
is conducting.
Monitoring Chlorophyll-a. North Carolina Department of Environment and Natural
Resources (NCDENR) has a strong biological assessment program (benthic
macroinvertebrates, phytoplankton and fish) and has done some work to determine if
benthic macroinvertebrates and periphyton can be used for assessment of nutrients.
Budget constraints have hampered this work.
2. Which biological indicators/parameters does your state use (or plan to use) to assess aquatic
life impacts due to nutrients?
Chlorophyll-a is the main parameter as NCDENR has statewide numeric standards for
chlorophyll-a.
3. How sensitive to nutrients have those indicators/parameters been? How did you determine
that?
Chlorophyll-a has proven to be very sensitive based on comparison to phytoplankton
samples and visual observations. NCDENR regularly uses their data to determine
Nitrogen and Phosphorus reductions necessary to meet the chlorophyll-a standards.
4. During criteria development, how have you found the correlation between causal (chemical)
and response (biological/ecological) variables for nutrients? If so, what approach(es) has
your state used to refine those relationships (e.g., subcategorizing waters, adjusting the
frequency and duration components of the criteria, using a range of TN and TP values,
developing site-specific numeric nutrient criteria, streamlining site-specific criteria
approaches, or other approaches)? Please discuss challenges and successes you have
experienced.
NCDENR uses modeling to assess the correlation between causal and response variables.
North Carolina has adopted nutrient management regulations based on modeling and
chlorophyll-a numeric standard to achieve reductions in nitrogen and phosphorus from all
sources.
5. How is your biological/ecological assessment information used in combination with chemical
and physical data to make impairment decisions?
NCDENR uses the biological/ecological assessment information on its own to make
impairment decisions.
The Association of Clean Water Administrators
Page 89 of 138 | Use of Biological Assessment in State Water Programs: Focus on Nutrients

6. Do you currently consider biological assessment information when developing NPDES
permits? If so, please describe how this is done.
Yes, based on NCDENR’s chlorophyll-a numeric standard. For waters that are not
currently impaired, NCDENR requires a demonstration that standard will be met if the
permit is issued. NCDENR uses the demonstration (e.g. modeling) to set Nitrogen and
Phosphorus permit limits.
The Association of Clean Water Administrators
Page 90 of 138 | Use of Biological Assessment in State Water Programs: Focus on Nutrients
North Dakota
Contact: Mike Ell, [email protected]
1. Please provide a brief overview of relevant biological/ecological assessment work your state
is conducting.
The main focus of our work is Index of Biological Integrity (IBI) development. The
North Dakota Department of Health (NDDoH) is implementing a systematic plan for the
collection of reference site data within each of the four level III ecoregions in the state.
Each year the state collects macroinvertebrate, physical habitat and chemistry data at 30-
40 reference and “impaired” sites. The goal is to collect data at 30 reference and
impaired sites each in each of the four ecoregions. These data are being used to develop
IBIs on an ecoregion basis and using the reference data to set thresholds for making
impairment decisions. Using IBIs and thresholds developed for the Red River basin, the
Department also implemented a regional biological condition assessment using a
probabilistic sampling design.
2. Which biological indicators/parameters does your state use (or plan to use) to assess aquatic
life impacts due to nutrients?
Macroinvertebrates and possibly periphyton
3. How sensitive to nutrients have those indicators/parameters been? How did you determine
that?
To date NDDoH has limited data to test the sensitivity of macroinvertebrates to nutrients
in ND streams and no data for periphyton.
4. During criteria development, how have you found the correlation between causal (chemical)
and response (biological/ecological) variables for nutrients? If so, what approach(es) has
your state used to refine those relationships (e.g., subcategorizing waters, adjusting the
frequency and duration components of the criteria, using a range of TN and TP values,
developing site-specific numeric nutrient criteria, streamlining site-specific criteria
approaches, or other approaches)? Please discuss challenges and successes you have
experienced.
These types of analysis have not been conducted.
5. How is your biological/ecological assessment information used in combination with chemical
and physical data to make impairment decisions?
Biological data are used independently from chemical data in making use impairment
decision. Where impairments are identified using biological data, chemical and physical
data are used to determine the source or cause of the impairment. Where chemical and
The Association of Clean Water Administrators
Page 91 of 138 | Use of Biological Assessment in State Water Programs: Focus on Nutrients

physical data are not available the waterbody is still assessed as impaired, but put on a list
for further stressor identification/assessment.
6. Do you currently consider biological assessment information when developing NPDES
permits? If so, please describe how this is done.
No.
The Association of Clean Water Administrators
Page 92 of 138 | Use of Biological Assessment in State Water Programs: Focus on Nutrients

Ohio
Contact: Robert J. Miltner, [email protected]
1. Please provide a brief overview of relevant biological/ecological assessment work your state
is conducting.
Ohio EPA conducts biological and water quality surveys of several river systems per
year. The size of the systems vary, but typically range between 400 and 1000 square
miles in surface area. Media sampled includes the water column and sediments for
chemical quality, fish and macroinvertebrate assemblages, and algal abundance. Physical
habitat quality is assessed at all sampling locations.
Watershed level chemical and biological surveys ( fish & bugs)
Stream nutrient criteria study (as above + benthic chl a, continuous DO)
Lake and reservoir sampling on limited scale (classic parameters + algal toxins)
Lake Erie nearshore sampling (includes benthic invertebrates)
2. Which biological indicators/parameters does your state use (or plan to use) to assess aquatic
life impacts due to nutrients?
Biological indicators include fish, macroinvertebrates, algal abundance as given by
chlorophyll-a, and serial dissolved oxygen monitoring. Results from these data are
rarefied into a composite index called the Trophic Index Criterion (TIC) to position a
waterbody relative to the nutrient enrichment continuum.
Trophic Index Criterion (TIC, multi-metric built on IBI/ICI, chl a, DO and
nutrient concentration data)
3. How sensitive to nutrients have those indicators/parameters been? How did you determine
that?
Chlorophyll-a is very sensitive to nutrient concentrations as determined empirically
through field observations. Fish and macroinvertebrates, being more distal to nutrients
than algae, are comparatively less sensitive, but show significant associations with
nutrient concentrations based on retrospective data analyses.
4. During criteria development, how have you found the correlation between causal (chemical)
and response (biological/ecological) variables for nutrients? If so, what approach(es) has
your state used to refine those relationships (e.g., subcategorizing waters, adjusting the
frequency and duration components of the criteria, using a range of TN and TP values,
developing site-specific numeric nutrient criteria, streamlining site-specific criteria
approaches, or other approaches)? Please discuss challenges and successes you have
experienced.
The correlations between nutrients and benthic chlorophyll were from a prospective study
wherein a nutrient gradient was defined based on historic observations and recent land
use (from desktop GIS). The relationship is broadly applicable to streams less than 1000
The Association of Clean Water Administrators
Page 93 of 138 | Use of Biological Assessment in State Water Programs: Focus on Nutrients

square miles in drainage area. The prospective design deliberately excluded streams
where the relationship between nutrients and enrichment would be confounded (e.g., low-
gradient swamp streams, mine drainage, highly urbanized catchments).
5. How is your biological/ecological assessment information used in combination with chemical
and physical data to make impairment decisions?
Ohio has biological criteria for fish and macroinvertebrates, and those criteria are the
basis for listing waters as impaired. To assess nutrient enrichment, information from
algae (chlorophyll-a) and dissolved oxygen regimes will be incorporated into condition
assessments to determine where a given waterbody is positioned along the continuum of
enrichment, such that waters where the existing biocriteria are met, but show signs of
significant enrichment, can be listed as impaired or threatened.
6. Do you currently consider biological assessment information when developing NPDES
permits? If so, please describe how this is done.
The use of the biological assessment information is contextual, but typically it is included
when developing NPDES permits. The results of biological surveys trigger more
stringent permit limits when impairment is demonstrated, and sometimes less stringent
limits when survey results show biological communities are fully attaining the designated
use. Limits for nutrient (usually total phosphorus) and in-direct but persistent low level
toxic chemical (e.g., selenium, PAHs) get generated due to impact signatures seen in
survey data.
The Association of Clean Water Administrators
Page 94 of 138 | Use of Biological Assessment in State Water Programs: Focus on Nutrients

Oklahoma
Contact: Phillip Moershel, [email protected]
1. Please provide a brief overview of relevant biological/ecological assessment work your state
is conducting.
For Streams/Rivers: Fish, macroinvertebrates, quantitative habitat data and algae (both
benthic and sestonic) are collected. Both probabilistic and fixed sites are used. Fish are
collected once every four years while macroinvertebrates are collected every other year.
For small to medium streams, at a minimum, one site in every HUC 11 watershed is
assessed every 5 years with 24 monthly water quality samples a fish collection and 4
benthic invertebrate collections. Qualitative periphyton ranking is included in the
assessemtns.
For Lakes: Zooplankton, phytoplankton, habitat data and macrophyte coverage are
collected on small lakes.
The biological assessment program goals are:
- Clean Water Act responsibilities to report on beneficial use support of biological
communities of our waterbodies.
- Increasing the amount of biological data available which can be utilized for Water
Quality Standards development.
- The use of bio-indicators to help potentially develop other criteria.
2. Which biological indicators/parameters does your state use (or plan to use) to assess aquatic
life impacts due to nutrients?
Periphyton Chlor a
Seston Chlor a
Qualitative periphyton
Benthic invertebrates
Algal and diatom community metrics would be monitored if promulgated
3. How sensitive to nutrients have those indicators/parameters been? How did you determine
that?
Below is a summary from a recently completed probabilistic survey of 51 stream sites in
an Ozarkian watershed.
FY-2005 Section 104(b)3 (CA# CP-966144-01)—Probabilistic Monitoring in the Illinois
River Watershed to Determine Multi-Assemblage Biotic Condition and Stressor
Relationships
The relative risk analyses produced widely variable results depending upon both biotic
condition and stressor. For the most part, the attempt to draw relationships of stressors to
The Association of Clean Water Administrators
Page 95 of 138 | Use of Biological Assessment in State Water Programs: Focus on Nutrients

fish and condition using relative risk produced mixed results depending on stressor
category.
For nutrients, only the Use Support Assessment Protocol (USAP) screening level
for total nitrogen and available nitrogen produced significant associated risk to
fish condition. With a highly inconsistent relationship of stressor to biological
condition, nutrients become a poor predictor of fish and benthic
macroinvertebrate (BMI) condition.
Habitat stressors had some predictive capacity when considering fish and BMI.
Fish condition was significantly related to both the overall habitat score and
percentage of deep pools. The BMI-Riffle habitat was significantly related to the
percentage of deep pools. Habitat does show more predictive capacity and
appears to be related to overall habitat change and/or loss.
General water quality stressors demonstrated the greatest predictive capacity
when considering fish and BMI. Dissolved oxygen and turbidity related to water
quality standards was significant for each assemblage, but it should be noted that
only one site exceeded the respective criteria. However, the historical 75th
percentile of dissolved oxygen (DO) percent saturation shows promising
predictive capacity. It is significant for BMI-Riffle condition, but also produced
non-significant relative risks for the other two conditions. In fact, for all
conditions, a number of stressors were above 1.0 but not significant.
When comparing both fish and BMI to a broad spectrum of stressors, it appears
that stressor/condition relationships are difficult to pin down. This study looked at
a very diverse set of stressors that represented a broad range of nutrient and
general water quality values. Regardless of site concentrations, some notable
relationship should have been formed between condition and stressor condition.
This study also used IBI’s as well as reference conditions that have been widely
published in studies by both the Oklahoma Water Resources Board (OWRB) and
Oklahoma Conservation Commission (OCC). However, either the IBI or
reference may not be sensitive enough. Streams in the watershed are generally
cool water aquatic communities and have exceptional habitat, including substrate
and flow. In fact, habitat was likely the most relevant stressor for both BMI and
fish. Because habitat is so exceptional, fish and BMI assemblages are often much
more diverse and have many more sensitive species than other parts of Oklahoma.
Using an IBI that is more refined to the particular characteristics of the Ozark
Highlands may allow for a better defined relationship between condition and
stressors.
For sestonic algal biomass, a number of notable significant relationships exist between
stressor and condition.
For nutrients, it appears that using the either the historical median or 25th
percentile of chlorophyll-a for algal condition produces the most significant
results. Each condition is highly related to total phosphorus in ranges from 0.018
mg/L to near 0.10 mg/L, and the highest relative risks are associated with the total
phosphorus in the range of 0.018 mg/L to the 0.037 mg/L scenic river criterion.
Low level total phosphorus appears to function well as a predictor of potential
degradation due to increasing algal biomass.
The Association of Clean Water Administrators
Page 96 of 138 | Use of Biological Assessment in State Water Programs: Focus on Nutrients

Similarly, all general water quality stressors, with the exception of pH, are
significantly related to poor sestonic algal condition. Increasing temperatures,
turbidity, and DO saturation all have significant predictive capacity.
Habitat has no predictive capacity.
Conversely, benthic algal biomasses shows very few significant relationships.
Significant risk relationships are present between nitrogen and DO percent
saturation
The most interesting significant relationship occurs when the percentage of deep
pools is acting as a stressor. As pool width to depth ratios decrease, the stream
area providing a suitable photic zone for algal growth may increase.
4. During criteria development, how have you found the correlation between causal (chemical)
and response (biological/ecological) variables for nutrients? If so, what approach(es) has
your state used to refine those relationships (e.g., subcategorizing waters, adjusting the
frequency and duration components of the criteria, using a range of TN and TP values,
developing site-specific numeric nutrient criteria, streamlining site-specific criteria
approaches, or other approaches)? Please discuss challenges and successes you have
experienced.
In the probabilistic survey of the Illinois river watershed no clear cut relationships were
found between the low levels of nutrients and the biological communities and periphyton
(Chlorophyll a). Other Oklahoma ecoregions have not yet been analyzed in that fashion.
Clear relations are seen across the state for reservoir chlorophyll a and nutrients. Chlor a
Criteria was set at 10 µg/l for drinking water lakes. Other lakes require an impairment
study to confirm the need for listing.
5. How is your biological/ecological assessment information used in combination with chemical
and physical data to make impairment decisions?
In a rule separate from the WQS, nutrient threatened condition is assed based upon
streams type, slope, canopy cover and substrate. They are also identified by periphyton
and sestonic chlorophyll a. When the nutrient threatened condition is identified, a
“nutrient impairment study” is required to determine if a stream should be listed. While
an impairment study is not defined, nor a protocol established in Oklahoam rules, an
impaired determination would be based upon impaired biological condition or on
conventional things like DO and pH.
6. Do you currently consider biological assessment information when developing NPDES
permits? If so, please describe how this is done.
At this time, only after a TMDL for an impaired condition is completed.
The Association of Clean Water Administrators
Page 97 of 138 | Use of Biological Assessment in State Water Programs: Focus on Nutrients

Oregon
Contact: Karla Urbanowicz, [email protected]; Jennifer Wigal,
[email protected] 1. Please provide a brief overview of relevant biological/ecological assessment work your state
is conducting.
For Oregon’s 2010 Integrated Report (303(d)/305(b)), Oregon Department of
Environmental Quality (DEQ) assessed aquatic life beneficial use support using
biological assessments as an indicator. DEQ’s protocol is based on biological assemblage
information for freshwater macroinvertebrates collected at reference sites in Oregon.
DEQ used a predictive model to analyze data for sample sites compared to expected or
reference assemblages and developed numeric benchmarks to identify impaired and
attaining conditions.
2. Which biological indicators/parameters does your state use (or plan to use) to assess aquatic
life impacts due to nutrients?
Oregon assesses aquatic life impacts from excess nutrients using indicators including
excess aquatic weeds or algal growth and harmful algae blooms. Oregon also uses
numeric water quality criteria such as pH, chlorophyll a, ammonia, and dissolved oxygen.
During the TMDL process, Oregon determines whether nutrients are a limiting factor
resulting in waters not meeting criteria for these pollutants.
3. How sensitive to nutrients have those indicators/parameters been? How did you determine
that?
DEQ has used these indicators and parameters successfully to develop TMDLs for waters
throughout the state to address and control nutrients causing beneficial use impairments.
During TMDL development, DEQ determines the combination of pollutants, sources, and
conditions that cause impairment. These pollutants and factors can vary given the
characteristics and conditions of specific water bodies. During TMDL development, DEQ
sets load limits and develops control strategies for the key pollutants. DEQ has seen
improvements in waters and watersheds throughout the state as key pollutants loads are
reduced or control strategies implemented.
4. During criteria development, how have you found the correlation between causal (chemical)
and response (biological/ecological) variables for nutrients? If so, what approach(es) has
your state used to refine those relationships (e.g., subcategorizing waters, adjusting the
frequency and duration components of the criteria, using a range of TN and TP values,
developing site-specific numeric nutrient criteria, streamlining site-specific criteria
approaches, or other approaches)? Please discuss challenges and successes you have
experienced.
The Association of Clean Water Administrators
Page 98 of 138 | Use of Biological Assessment in State Water Programs: Focus on Nutrients

Oregon has not developed nutrient criteria per se, but has developed criteria for the
pollutants discussed in (2). DEQ determines the correlation between those pollutants and
response variables on a reach or water-specific basis during TMDL development.
5. How is your biological/ecological assessment information used in combination with chemical
and physical data to make impairment decisions?
Oregon applies a policy of independent applicability of pollutant criteria, data, and
information to assess and make 303(d) impairment determinations. For the 2010
Integrated Report, DEQ identified impaired biological conditions without linking the
beneficial use impairment to a specific pollutant or physical cause of impairment. DEQ’s
initial decision not to 303(d) list waters identified as biologically impaired, where
pollutants were unknown, was disapproved by EPA in their March 2012 action. EPA is
proposing to add those waters to Oregon’s 303(d) list.
6. Do you currently consider biological assessment information when developing NPDES
permits? If so, please describe how this is done.
Environmental mapping and beneficial uses are considered during mixing zone
evaluations and permitting, but Oregon DEQ rarely uses indices of biological integrity
and other biological assessment information for individual permitting decisions. Oregon
DEQ may be doing more in the future.
The Association of Clean Water Administrators
Page 99 of 138 | Use of Biological Assessment in State Water Programs: Focus on Nutrients

Pennsylvania
Contact: Gary Walters, [email protected]
1. Please provide a brief overview of relevant biological/ecological assessment work your state
is conducting.
None, see #2
2. Which biological indicators/parameters does your state use (or plan to use) to assess aquatic
life impacts due to nutrients?
The Pennsylvania Department of Environmental Protection (PA DEP) is currently
developing a more robust protocol to assess aquatic life impacts due to nutrients.
Biological indicators such as macroinvertebrates, algal biomass, algal indicator species or
community structure and diurnal oxygen fluctuations will be used in some capacity.
3. How sensitive to nutrients have those indicators/parameters been? How did you determine
that?
Currently evaluating the sensitivity/relationships.
4. During criteria development, how have you found the correlation between causal (chemical)
and response (biological/ecological) variables for nutrients? If so, what approach(es) has
your state used to refine those relationships (e.g., subcategorizing waters, adjusting the
frequency and duration components of the criteria, using a range of TN and TP values,
developing site-specific numeric nutrient criteria, streamlining site-specific criteria
approaches, or other approaches)? Please discuss challenges and successes you have
experienced.
PA DEP finds that drawing the correlations between the causal and response variables is
difficult due to the confounding factors involved.
PA DEP has contracted several studies with Penn State, the Stroud Water Research
Center, the Academy of Natural Sciences, USGS et al. to investigate the causal and
correlative links between nutrients, algae and macroinvertebrates.
5. How is your biological/ecological assessment information used in combination with chemical
and physical data to make impairment decisions?
The updated protocol for making impairment decisions in still in development.
6. Do you currently consider biological assessment information when developing NPDES
permits? If so, please describe how this is done.
The Association of Clean Water Administrators
Page 100 of 138 | Use of Biological Assessment in State Water Programs: Focus on Nutrients

Impairment status of the receiving water is considered when developing permits.
Application of this information varies on a NPDES program by program basis (e.g.,
POTWs, stormwater, construction).
The Association of Clean Water Administrators
Page 101 of 138 | Use of Biological Assessment in State Water Programs: Focus on Nutrients
Rhode Island Contacts: Sue Kiernan, [email protected] ; Jane Sawyers,
[email protected]; Connie Carey, [email protected]
1. Please provide a brief overview of relevant biological/ecological assessment work your state
is conducting.
Rhode Island Department of Environmental Management (RIDEM) has a biological
monitoring program that assesses benthic macroinvertebrates at over 200 monitoring
stations in wadeable freshwater streams and rivers throughout the state. The data
obtained by the benthic macroinvertebrate monitoring program is used for a general
assessment of aquatic life, not specific to nutrients. Historically, this data was evaluated
through the use of a reference station approach. RIDEM has recently completed a project
to define the reference condition in RI and create a biotic index and relating this index to
the Biological Condition Gradient (BCG) for interpretation of the biological responses.
In deeper freshwater rivers and streams the state conducts limited artificial substrate
sampling of the macroinvertebrate community for a general assessment of aquatic life,
not specific to nutrients.
As part of the numeric nutrient criteria development for rivers and streams, the state has
recently initiated extended monitoring on wadeable streams for primary data on
taxonomic identification of diatoms, chlorophyll a abundance of periphyton, percent
coverage of periphyton and macrophytes, and habitat features.
For lakes the state is collecting surrogates of biological indicators such as water column
chlorophyll a and Secchi depth. Data on macrophyte coverage is also being collected for
consideration in nutrient criteria development.
RIDEM is not currently working on any projects related to bioassessment of estuarine
waters. There is some work being done by researchers pertaining to potential
applicability of the biological condition gradient conceptual framework to the benthic
community in Narragansett Bay as well as work to develop ecological indicators, such as
measures of eelgrass coverage, that may be pertinent to nutrient management in coastal
waters.
2. Which biological indicators/parameters does your state use (or plan to use) to assess aquatic
life impacts due to nutrients?
For freshwater lakes, aquatic life use impacts due to nutrients are assessed on a narrative
criteria basis using water column chlorophyll a and macrophyte coverage as well as
Secchi depth.
For wadeable rivers and streams, the state is planning to evaluate the use of taxonomic
identification of diatoms, chlorophyll a abundance of periphyton, percent coverage of
The Association of Clean Water Administrators
Page 102 of 138 | Use of Biological Assessment in State Water Programs: Focus on Nutrients
periphyton and macrophytes, percent coverage of non-vascular plants and duckweed, for
nutrient criteria development and aquatic life use assessments.
For estuaries, nutrient impacts are assessed largely by evaluating dissolved oxygen.
However, RIDEM is also monitoring for and considering chlorophyll a. The
Narragansett Bay Estuary Program has also been monitoring macroalgae through aerial
photography and is currently working on improved methods for algal identification and
quantification with an aim toward developing the capacity to measure the response in this
community to planned nutrient pollutant loading reductions from WWTFs to
Narragansett Bay.
3. How sensitive to nutrients have those indicators/parameters been? How did you determine
that?
For freshwater lakes, and rivers and streams, the statistical analysis and data collection is
on-going and RIDEM has not yet reached conclusions on this question.
4. During criteria development, how have you found the correlation between causal (chemical)
and response (biological/ecological) variables for nutrients? If so, what approach(es) has
your state used to refine those relationships (e.g., subcategorizing waters, adjusting the
frequency and duration components of the criteria, using a range of TN and TP values,
developing site-specific numeric nutrient criteria, streamlining site-specific criteria
approaches, or other approaches)? Please discuss challenges and successes you have
experienced.
RI’s current nutrient criteria development strategy for freshwater lakes and streams is to
evaluate sub-categorization of waters based on Bayesian treed analysis including many
geographic and physical characteristics. Typical tree analyses for categorization defines
groups based on a population measurement, such as the mean or median, a Bayesian treed
analysis searches for groups based on the linear regression relationships in the final
groups. This work is on-going.
5. How is your biological/ecological assessment information used in combination with chemical
and physical data to make impairment decisions?
For lakes, the state’s water quality regulations contain a numeric criteria for total
phosphorus which is utilized to make aquatic life use impairment decisions.
In rivers and streams, benthic macroinvertebrate data are currently the type of biological
information used in an integrative manner with water chemistry and physical data to
determine aquatic life use impairment decisions. The biological information is
considered the core indicator during assessments since it provides the most direct
measure of aquatic life use attainment/impairment status.
A more complete description of RI’s assessment process can be found in the state’s
Consolidated Assessment and Listing Methodology
(http://www.dem.ri.gov/programs/benviron/water/quality/pdf/finlcalm.pdf).
The Association of Clean Water Administrators
Page 103 of 138 | Use of Biological Assessment in State Water Programs: Focus on Nutrients

6. Do you currently consider biological assessment information when developing NPDES
permits? If so, please describe how this is done.
RIDEM is delegated to administer the NPDES program, known as RIPDES, for Rhode
Island. Regulated major facilities discharge into rivers and coastal waters. There are no
RIPDES permitted discharges into lakes in the state. The RIPDES permitting program
considers biological data in the development of permits. Information on observed
conditions, including excessive macrophyte plant growth, nuisance algal blooms, etc. has
been used in combination with other information to set targets for reducing nutrient
pollutant loadings to rivers.
The Association of Clean Water Administrators
Page 104 of 138 | Use of Biological Assessment in State Water Programs: Focus on Nutrients

South Carolina
Contact: James B. Glover, Ph.D., [email protected]
1. Please provide a brief overview of relevant biological/ecological assessment work your state
is conducting.
A. Bioassays (Toxicity Tests):
The South Carolina Department of Health and Environmental Control (SCDHEC)
requires effluent toxicity tests on NPDES permits, the results of which are used in a
regulatory manner. Instream bioassasseys are not conducted on a routine basis but
have on occasion been used for special investigations.
B. Community Bioassessments of surface water
i. Macroinvertebrate Bioassessments. The first bioassessment report by
SCDHEC was produced in 1974 and the Agency has had a strong program for
many years. Ambient data are used primarily for environmental surveys with
the results being used for the 305b report, 303d listing, and watershed water
quality reports. Other regulatory activities include special investigations
involving spills and other point and non-point pollution events. In addition,
there are instream macroinverterbate bioassessments required by many
NPDES permits. The storm water permitting program and 401/404 programs
may also require macroinvertebrate bioassessments. These studies are
conducted by SCDHEC certified labs and reviewed by agency staff.
ii. Benthic Algal Bioassessments. The Agency embarked on the development of
a benthic algal bioassessment program of streams in 2007 and SCDHEC is
nearing the point of being able to evaluate the data in a meaningful way. It is
hoped that this assemblage can be linked with the macroinvertebrate data to
provide a more holistic assessment of stream condition. SCDHEC is also
hopeful that a linkage can be made between excess nutrients and various
primary producer measures to inform regulatory decisions in the future.
iii. Fish Community Assessments. At this time the SCDHEC is not conducting
fish community assessment work as part of the ambient monitoring program.
These studies are occasionally required through various permitting programs.
Various other federal and state government agencies and universities often
conduct such studies in SC but are often for a specific purpose related to the
mission of their Agency.
iv. Phytoplankton. There is a rather large dataset of phytoplankton community
data that was generated by a recently retired SCDHEC phycologist. SCDHEC
has yet to fully analyze these data in a meaningful way but hopes these can
inform decisions regarding lake nutrient criteria. At this time the SCDHEC
has criteria for TP and TN for lakes >40 acres that were developed using EPA
guidance and assistance from EPA Region IV.
v. Aquatic and Wetland Plants- SC is participating in the 2011 EPA National
Wetland Condition Assessment project. Plants are the primary biological end
point for this project. One of the goals of the project is to help states build
The Association of Clean Water Administrators
Page 105 of 138 | Use of Biological Assessment in State Water Programs: Focus on Nutrients

capacity and methods to assess wetlands. It remains to be seen if SCDHEC
can continue these activities past the end of project. Much will depend on the
results of the analysis and economic conditions.
vi. Amphibians- This assemblage will be used in 2012 during the southeastern
wetland intensification project being conducted by AL, GA, SC, and NC. As
in number 5 the utility of this assemblage to assess condition will depend on
results.
vii. Chlorophyll a analysis- Chlorophyll a sensu-stricto is not a biological
measure but, because living organisms produce this pigment, can serve as a
surrogate biological end point. At this time the SCDHEC collects this
measure in lakes of a least 40 acres in size and have set standards for
Chlorophyll a in this waterbody type. Standards exist for TP and TN as well
for this waterbody type. Because South Carolina does not have true lakes, but
rather regulated rivers, having standards in these large reservoirs may drive
regulatory decisions for the lotic portion of the rivers and streams in the
watershed. For example see
http://www.scdhec.gov/environment/water/tmdl/doc/Draft_Reedy_nut_TMDL
s.pdf.
viii. Phytoplanton and Chlorophyll analysis from estuaries and coastal ponds.
SCDHEC has been part of the Harmful Algal Bloom Related Surveillance
Network (HABISS) for many years and have participated jointly with the SC
Department of Natural Resources (SCDNR) with activities related to this
project. While the primary goal and intent of the CDC grant, which fund
various activities related to Harmful Algal Blooms, is the protection of human
health SCDHEC has compiled Chlorophyll a and marine phytoplankton data
for coastal waterbodies. These data have been published in various forms
over the years primarily through staff with the SCDNR. Currently the
SCDHEC and the SCDNR are collaborating with Dr. Dianne Greenfield of the
Bell Baruch Institute for Marine and Coastal Sciences, University of South
Carolina, on an EPA Region IV funded project titled “Development of
monitoring and assessment tools for nitrogen and phosphorous in South
Carolina coastal wetlands.” This project will be examining seasonal changes
in nutrients and phytoplankton community composition from various coastal
sites in SC.
2. Which biological indicators/parameters does your state use (or plan to use) to assess aquatic
life impacts due to nutrients?
In SC, the data analysis phase of examining nutrient criteria and biological end points is
in its infancy. SCDHEC has conducted some cursory analysis using statistical techniques
such as Spline and LOESS regression that have shown relatively good relationships
between TP (but not TN) and Chlorophyll a in reservoirs. Benthic algal assemblage data
are being collected statewide and it is hoped that these may prove useful as a biological
end point for nutrients in flowing streams. In addition benthic algal and nutrient data are
being collected within a watershed in which a nutrient TMDL has been developed
(pending approval) and several years of pre-implementation data are available. SCDHEC
The Association of Clean Water Administrators
Page 106 of 138 | Use of Biological Assessment in State Water Programs: Focus on Nutrients

anticipates implementation efforts will begin on this stream 2011/2012 and continued
monitoring will occur throughout the life of the project and beyond.
3. How sensitive to nutrients have those indicators/parameters been? How did you determine
that?
As indicated above a relationship has been found between TP and Chlorophyll a for
reservoirs but more analysis is needed. Because of the heterogeneity of waters of the US
and the numerous stressors that have been placed on these waters for centuries a perfect
indicator will likely remain elusive. It is the difficulty one has with trying to manage the
natural world with numbers. That said, SCDHEC is moving forward with the goal of
establishing a reasonably strong causal relationship between nutrients and an aquatic
biological end point.
4. During criteria development, how have you found the correlation between causal (chemical)
and response (biological/ecological) variables for nutrients? If so, what approach(es) has
your state used to refine those relationships (e.g., subcategorizing waters, adjusting the
frequency and duration components of the criteria, using a range of TN and TP values,
developing site-specific numeric nutrient criteria, streamlining site-specific criteria
approaches, or other approaches)? Please discuss challenges and succeses you have
experienced.
5. How is your biological/ecological assessment information used in combination with chemical
and physical data to make impairment decisions?
Streams are listed as impaired or unimpaired for “Bio” based on the aquatic
macroinvertebrate bioclassification scores.
6. Do you currently consider biological assessment information when developing NPDES
permits? If so, please describe how this is done.
Yes, macroinvertebrate bioassessments are required on many NPDES permits. These
generally involve an upstream/downstream study in which a stream is assessed downriver
of an effluent discharge point and compared with an assessment upriver of the effluent. It
is the change in the bioassessment score that may result in a determination of impact.
These studies are paid for by the regulated entity, conducted by an SCDHEC certified
laboratory, and reviewed by agency staff. Compliance and enforcement activities can
occur if there is evidence of impact. Instream assessment schedules generally range from
1 to 4 times annually, depending on several factors such as failure of toxicity tests.
The Association of Clean Water Administrators
Page 107 of 138 | Use of Biological Assessment in State Water Programs: Focus on Nutrients

South Dakota
Contact: Rich Hanson, [email protected]
1. Please provide a brief overview of relevant biological/ecological assessment work your state
is conducting.
The South Dakota Department of Environment and Natural Resources (SD DENR) has
contracted with South Dakota State University to develop a biological toolkit that may be
used to assess aquatic life impairment or stream quality. The toolkit will primarily
concentrate on macroinvertebrates but fish may also be included. In a few cases SD
DENR used macroinvertebrate data to support water quality standards changes. SD
DENR has no statewide biological monitoring effort and in only a few cases have they
had biological monitoring as part of an assessment project.
2. Which biological indicators/parameters does your state use (or plan to use) to assess aquatic
life impacts due to nutrients?
Don’t know. SD DENR has not gotten that far yet.
3. How sensitive to nutrients have those indicators/parameters been? How did you determine
that?
SD DENR has not looked into this.
4. During criteria development, how have you found the correlation between causal (chemical)
and response (biological/ecological) variables for nutrients? If so, what approach(es) has
your state used to refine those relationships (e.g., subcategorizing waters, adjusting the
frequency and duration components of the criteria, using a range of TN and TP values,
developing site-specific numeric nutrient criteria, streamlining site-specific criteria
approaches, or other approaches)? Please discuss challenges and successes you have
experienced.
SD DENR has not looked into this.
5. How is your biological/ecological assessment information used in combination with chemical
and physical data to make impairment decisions?
See #1. In a few cases we’ve used biological data from an impaired site and compared
that to a reference site to support water quality standard changes (when impaired versus
reference data isn’t different). SD DENR has very little biological data and so biological
data is generally not used for impairment decisions.
6. Do you currently consider biological assessment information when developing NPDES
permits? If so, please describe how this is done.
The Association of Clean Water Administrators
Page 108 of 138 | Use of Biological Assessment in State Water Programs: Focus on Nutrients

Yes. As noted above, SD DENR has very little biological data available. However, in a
couple of cases, SD DENR has required NPDES permittees to conduct biological
assessments of their receiving streams. This information is reviewed annually and
considered upon re-issuance of the permit. In addition, South Dakota requires whole
effluent toxicity testing in a number of NPDES permits. This information is reviewed
quarterly. If the testing data shows toxicity, the facility is required to identify the source
and reduce the toxicity in the discharge.
The Association of Clean Water Administrators
Page 109 of 138 | Use of Biological Assessment in State Water Programs: Focus on Nutrients
Tennessee
Contact: Sandra Dudley, [email protected]
1. Please provide a brief overview of relevant biological/ecological assessment work your state
is conducting.
a. 305(b)/303(d) assessments – Semi-quantitative macroinvertebrate samples and
nutrient samples (minimum total phosphorus and nitrate/nitrite) are collected at all
wadeable streams on the 303(d) list for nutrients as well as those suspected of nutrient
impairment. Results are compared to biological and nutrient criteria for each
ecoregion. Biorecon screenings are collected at numerous other sites in each
watershed. Failing scores will result in follow-up nutrient and possibly more
intensive biological sampling if field observations, land-use or taxa lists indicate
nutrient impairment is likely. In 2010, periphyton samples were added. Chlorophyll
and nutrient samples are collected in lakes/reservoirs and non-wadeable streams.
b. TMDL – For nutrient TMDLS, staff collect flow, ammonia, nitrate+nitrite, total
phosphorus, orthophosphate, TKN, total suspended solids, turbidity total organic
carbon, periphyton (wadeable) or chlorophyll (nonwadeable), pH, temperature,
conductivity and diurnal DO (minimum 2 weeks during growing season). Water
quality samples are collected monthly. Chlorophyll monthly during growing season.
Periphyton once during growing season. Macroinvertebrates are collected once for
assessment purposes but not used in TMDL.
c. Ecoregion Reference – Macroinvertebrate, periphyton and nutrient samples are
collected at approximately 100 reference streams on a five year rotational basis.
Macroinvertebrates are collected in spring and fall; periphyton during growing season
and nutrients quarterly. Periphyton data will be used to develop periphyton
assessment index within the next five years.
d. Headwater reference stream project - Five year project began in 2008. Goal to select
and monitor 77 reference streams with drainage less than or equal to two square
miles. Nutrients, macroinvertebrate and periphyton samples (along with flow and
field parameters) are collected at each site. The goal is to develop biocriteria
(macroinvertebrate and periphyton index) and nutrient criteria (numeric translators
for narrative) for headwater streams. Macroinvertebrates and nutrients are collected
spring and fall. Periphyton is collected once during growing season.
e. Probabilistic monitoring – collect nutrients, macroinvertebrates and periphyton at 90
probabilistic monitoring sites. Target is every 3 to 5 years as funding allows.
(Collected in 2007 and 2010).
f. NPDES monitoring – In-stream macroinvertebrate and nutrient monitoring is
incorporated in permits below dischargers in wadeable streams. Note that nutrient
monitoring is only conducted for discharges to nutrient impaired waters.
The Association of Clean Water Administrators
Page 110 of 138 | Use of Biological Assessment in State Water Programs: Focus on Nutrients
2. Which biological indicators/parameters does your state use (or plan to use) to assess aquatic
life impacts due to nutrients?
Currently using:
Tennessee macroinvertebrate index – comprised of seven biometrics designed to pick
up a broad range of impairment. One of the biometrics (Tennessee Nutrient Tolerant
Index -%TNTOL) is also looked at individually when nutrient levels are above
ecoregion guidelines. Index includes taxa that were found to be dominant in known
nutrient impaired waters. (Prior to 2011 used NUTOL (nutrient tolerant organism)
developed by KY – recalibrated to TN bioregions in 2011).
Kentucky Diatom Index – begin using in 2010
Within next five years intend to develop:
Tennessee Periphyton Index or recalibrate KY Diatom index to Tennessee bioregions.
Headwater periphyton index (streams less than 2 sq mi drainage)
Headwater macroinvertebrate index (streams less than 2 sq mi drainage)
3. How sensitive to nutrients have those indicators/parameters been? How did you determine
that?
During nutrient criteria development in 2002, Tennessee macroinvertebrate Index (TMI)
scores were compared to nutrient samples in various ecoregions. There was an 85%
agreement between sites that failed nutrient criteria and sites that failed biocriteria.
In 2006, Tennessee adopted a nutrient tolerant metric developed by the state of Kentucky
(%Nutol) into the TMI. There was an 86% agreement between sites that failed nutrient
criteria and sites that failed to meet regional guidelines for this metric.
In 2011 Tennessee recalibrated the %Nutol to Tennessee ecoregions. Calibration
consisted of pulling any animal that was at least 20% of sample from each site exceeding
nutrient criteria for that bioregion. Multiple samples from the same station were
combined to avoid weighting = 284 sites. Taxa were ranked by percentage from each
site. Trial and error (box and whisker plots) was used to determine a cut-off point for the
percent dominant and frequency of occurrence that had the most sensitivity in the most
bioregions. This worked out to the top 10 most frequently occurring taxa with at least one
observation > 50% of the sample. Scores at reference sites and sites failing nutrient
criteria using the Ky %Nutol and recalibrated Nutol in each bioregion were compared
graphically. The revised scoring proved more sensitive to nutrient impairment in a wider
range of bioregions and less likely to give false positives.
The Kentucky Diatom index is currently used as a supplemental in conjunction with
macroinvertebrate samples and has not been tested for sensitivity since WPC is
developing an index calibrated to Tennessee ecoregions. Based on comparison of
nutrient levels and macroinvertebrate samples, the index appears to be fairly sensitive in
ecoregion 71 but is not sensitive enough in ecoregions 65, 73 and 74. It is overly
The Association of Clean Water Administrators
Page 111 of 138 | Use of Biological Assessment in State Water Programs: Focus on Nutrients

sensitive (false positives) in ecoregions 66, 68 and 69 in Tennessee. Confounding factors
include canopy cover and abundance of scrapers. An attempt will be made to
compensate for these factors during index development.
4. During criteria development, how have you found the correlation between causal (chemical)
and response (biological/ecological) variables for nutrients? If so, what approach(es) has
your state used to refine those relationships (e.g., subcategorizing waters, adjusting the
frequency and duration components of the criteria, using a range of TN and TP values,
developing site-specific numeric nutrient criteria, streamlining site-specific criteria
approaches, or other approaches)? Please discuss challenges and successes you have
experienced.
Nutrient criteria were developed by compiling total phosphorus and nitrate+nitrite data
from 100 reference streams in 25 Level IV ecoregions (sub-ecoregions). Standard
statistical methods were used to identify differences in nutrient concentrations between
each sub-ecoregion. Where differences were significant, the adoption of sub-ecoregion
based criteria was considered appropriate due to improved accuracy. Where differences
were not significant, data were aggregated so that the resulting criteria could apply to
streams that cross ecoregion boundaries. This resulted in 15 total phosphorus and 15
nitrate+nitrite criteria regions in the state (they are not the same 15). Criteria were based
on the 90th
percentile of reference data in each region. The 75th
percentile was also tested
but there was less agreement with biological response.
Biological response was tested by comparison to biocriteria (The Tennessee
Macroinvertebrate Index – TMI). The index is comprised of 7 biometrics from four
distinct categories (richness, composition, tolerance and trophic state) that reflected
various aspects of the whole macroinvertebrate community. Metrics that showed the
most sensitivity to various pollutants in the most ecoregions were incorporated.
Reference data were compiled to develop biometric ranges in each of 13 bioregions.
Lessons learned (adjustments since original criteria development in 2002):
a. Inclusion of a biometric calibrated specifically to nutrient tolerant organisms.
b. Also use single biometrics sensitive to nutrient tolerance to determine possible
nutrient impairment when TMI score passes but nutrient levels are high.
c. Adjust %EPT (Ephemeroptera, Plecoptera, and Trichoptera) metric to exclude
Cheumatopsyche (a nutrient tolerant EPT)
d. Incorporate periphyton index and/or visual observations of algal growth in
addition to TMI.
5. How is your biological/ecological assessment information used in combination with chemical
and physical data to make impairment decisions?
When nutrient (TP or Nitrate+Nitrite) values exceed numeric translators for ecoregion
(based on reference data) there must be an associated biological response. Examples of
biological response include:
Biorecon scores below 11
The Association of Clean Water Administrators
Page 112 of 138 | Use of Biological Assessment in State Water Programs: Focus on Nutrients

TMI scores below 32
%TNTOL exceeds expectations for bioregion
Kentucky Diatom Index is in fair or poor category
Field observations of excessive algae or aquatic plant growth
Elevated chlorophyll
Also consider low dissolved oxygen and/or excessive diurnal swings as possible
evidence of algal growth.
6. Do you currently consider biological assessment information when developing NPDES
permits? If so, please describe how this is done.
Both chemical and biological data are used to asses for nutrients, and assessment data is
considered when setting permit limits.
The Association of Clean Water Administrators
Page 113 of 138 | Use of Biological Assessment in State Water Programs: Focus on Nutrients

Texas
Contact: Kelly Holligan, [email protected]
1. Please provide a brief overview of relevant biological/ecological assessment work your state
is conducting.
The development of biological sampling and assessment methods are coordinated
through an interagency workgroup, which includes staff from the Texas Commission on
Environmental Quality (TCEQ) and Texas Parks and Wildlife Department (TPWD). In
general, assessments of fish and benthic communities are conducted to develop site-
specific water quality standards and to determine status of attainment with criteria
established for the protection of aquatic life. The Texas Surface Water Quality Standards
have established exceptional, high, intermediate, or limited aquatic life use (ALU)
categories; based on the physical, chemical, and biological characteristics exhibited by
the water body.
Procedures have been developed for the collection of benthic macro-invertebrates, fish,
and habitat data, and are described in Surface Water Quality Monitoring Procedures, Vol
2, RG-416. These procedures include quantitative and rapid bioassessment methods for
the collection of benthic macro-invertebrates, as well as electro-shocking and seine
protocols for fish sampling. Habitat protocols have been developed primarily for
wadeable streams. A habitat quality evaluation is accomplished by measurement of
physical habitat parameters at evenly-spaced transects over a defined stream reach and
are evaluated with a multimetric habitat quality index.
Use attainment can be assessed for water bodies where ALU categories have been
designated or presumed. Determination of attainment is based on the use of multimetric
Indices of Biological Integrity (IBIs) which integrate structural and functional attributes
of biotic assemblages. Regional IBIs incorporating characteristics of eco-regions and
associated fish assemblages have been developed for freshwater streams and rivers in
most of Texas. IBI’s have not been developed for reservoirs or tidal streams. TPWD
and TCEQ are coordinating to conduct additional sampling and evaluation of tidal
streams and estuaries to develop and evaluate improved metrics to describe tidal fish
communities, and TCEQ staff in the Houston/Galveston Region is working on
preliminary indices for tidal benthic macro-invertebrates.
2. Which biological indicators/parameters does your state use (or plan to use) to assess aquatic
life impacts due to nutrients?
The primary indicator to summarize biological data is the Index of Biotic Integrity (IBI)
for fish and benthic invertebrates for freshwater streams. The IBI categories of aquatic
life health have been tailored to different eco-regions for fish data, and eco-regional IBIs
are in development for benthic invertebrates. IBIs for tidal rivers and estuaries remain
under development. Over the past 5 years, the TCEQ has also coordinated a variety of
supplementary freshwater stream nutrient surveys. These surveys included data on the
The Association of Clean Water Administrators
Page 114 of 138 | Use of Biological Assessment in State Water Programs: Focus on Nutrients

abundance of attached algae, and also included a comparison of different methods to
estimate algal coverage. However, further work to implement estimates of periphyton in
biological monitoring is needed for it to be a viable indicator. The TPWD has historical
fisheries surveys of the major reservoirs in Texas that include estimates of the percent
coverage of rooted macrophytes and other vegetation. TPWD has also sponsored aerial
surveys and maps of coastal seagrasses. TCEQ and TPWD are coordinating on more
extensive sampling to better define seagrass condition and coverage around the coast of
Texas. Indicators of planktonic primary productivity and algal abundance in streams,
reservoirs, and estuaries include substantial historical data on 24-hour dissolved oxygen
ranges, water column measurements of chlorophyll a, and Secchi disk transparency.
3. How sensitive to nutrients have those indicators/parameters been? How did you determine
that?
TCEQ is coordinating an extensive ongoing evaluation of statewide historical data for
freshwater streams and reservoirs, conducted by researchers at the University of
Arkansas, in order to identify nutrient response thresholds. Preliminary statistical
evaluations include categorical and regression tree analysis on long-term median values
of nutrient parameters and the above response variables for a large number of sampling
stations. Initial analyses for stream and also for reservoirs have identified statistically
significant threshold change points at relatively low concentrations of both total
phosphorus and total nitrogen (derived using nitrate, nitrite and total Kjedahl nitrogen).
Initial analyses in reservoirs showed statistically significant responses of total phosphorus
and response variables – particularly Secchi disk transparency. These initial results
indicate the parameters are relatively sensitive to nutrients, phase two of these statistical
evaluations will continue through FY2013.
4. During criteria development, how have you found the correlation between causal (chemical)
and response (biological/ecological) variables for nutrients? If so, what approach(es) has
your state used to refine those relationships (e.g., subcategorizing waters, adjusting the
frequency and duration components of the criteria, using a range of TN and TP values,
developing site-specific numeric nutrient criteria, streamlining site-specific criteria
approaches, or other approaches)? Please discuss challenges and successes you have
experienced.
The correlation of nutrient concentrations with response variables was partly addressed in
the response to number 3. In freshwater streams, the relationships with most response
variables are statistically significant but highly variable. For example, fish and benthic
IBIs are more closely related to a habitat quality index than to nutrient concentrations. In
reservoirs, median total phosphorus concentration had a fairly strong statistical
relationship with both Secchi disk transparency and chlorophyll a concentration. One
useful aggregation for statistical analyses appears to be geographic categorizing by Level
III eco-regions, and potentially combining eco-region categorization with river basin
categorization for larger watersheds. Another potentially useful categorization was
dividing the dataset into high and low categories of total phosphorus. For reservoirs,
simple regressions of total phosphorus versus chlorophyll are statistically relatively
The Association of Clean Water Administrators
Page 115 of 138 | Use of Biological Assessment in State Water Programs: Focus on Nutrients

strong using long-term medians for entire reservoirs; whereas regressions using
individual sampling dates and stations as data points (even if various time lags are
incorporated for chlorophyll a) are typically not statistically significant. TCEQ has
adopted numerical criteria for 75 reservoirs in the form of chlorophyll a. These criteria,
which are still under review by EPA, were calculated separately for each reservoir based
on historical data. Ongoing challenges include (1) determining the levels and the amount
of allowable change of response variables that are appropriate to define use-support, (2)
statistically evaluating water bodies with numerous nondetects for nutrient parameters
and/or chlorophyll a, (3) addressing changes in lab methods, sampling procedures, and
reported quantification levels in long-term historical databases, and (4) incorporating
multiple indicators (weight-of-evidence) to assess attainment of nutrient criteria in ways
that are statistically valid and acceptable to EPA.
5. How is your biological/ecological assessment information used in combination with chemical
and physical data to make impairment decisions?
When available, the determination of fish and/or benthic macro-invertebrate integrity is
used in conjunction with physical and chemical data to provide an integrated assessment
of support of the aquatic life use for water bodies identified in the Texas Surface Water
Quality Standards. Support for a given water body is assessed according to the decision
matrix specified below in Table 1.
Attainment of bioassessment data (fish or macro-benthic) is based on the mean of a
minimum of two samples collected from each of one or more representative sites within
the water body, in conjunction with an eco-region coefficient of variability (CV) for the
designated ALU. The ecoregion CV establishes an interval around the mean and
incorporates the observed variability of historical sampling into the final results,
increasing the level of confidence in the attainment decision.
6. Do you currently consider biological assessment information when developing NPDES
permits? If so, please describe how this is done.
As part of TPDES permit application evaluations, TCEQ determines the stream flow
characteristics (perennial, intermittent, or intermittent with perennial pools) for the
receiving waters along the proposed discharge route. TCEQ uses these flow
characteristics to assign assigning presumed uses to unclassified streams. Receiving
Water Assessments (RWAs) are often conducted for wastewater permitting actions where
additional site specific information is needed to determine that appropriate Standards
criteria and effluent limits are applied to protect water quality. RWAs consist of a
sampling of fish and invertebrate stream communities. The resulting data is evaluated
using indices of biotic integrity to assign an appropriate aquatic-life category to the water
body. The aquatic-life category dictates the applicable numerical and narrative criteria to
protect the aquatic life uses of the water body.
When an attainable aquatic life use for a particular unclassified water body might be
lower than the presumed aquatic life use, a use-attainability analysis (UAA) is conducted.
Data collection, compilation, and analysis may be conducted by TCEQ, the applicant,
The Association of Clean Water Administrators
Page 116 of 138 | Use of Biological Assessment in State Water Programs: Focus on Nutrients

river authorities, or governmental or other entities. The TCEQ reviews the UAA to
ensure conformance with basic protocol. If the UAA indicates that the attainable use is
lower than the designated use, the TNRCC sends the UAA to EPA for review.
Preliminary approval of a UAA by EPA for classified streams constitutes a finding that
the lowered aquatic life use is "approvable" as the new designated use for the classified
stream. The change in the designated use is placed in the next revision of the Texas
Surface Water Quality Standards.
The UAA procedure is as follows:
Identify reference areas and define stream reach or reaches to be included in the
assessment.
Summarize stream morphometry, flow characteristics, and habitat characteristics
in the reference area in accordance with:
o a standardized stream characteristics form (from a TNRCC wastewater
permit application), which also contains a description of the proposed or
existing discharge; or
o the TNRCC Receiving Water Assessment Procedures Manual, GI253, June
1999 or the most recent publication.
Conduct fish sampling (or in some cases macroinvertebrate sampling) in the
reference area in accordance with the GI-253 (see preceding bulleted item)
Apply quantitative indices in accordance with the GI-253, cited above.
The Association of Clean Water Administrators
Page 117 of 138 | Use of Biological Assessment in State Water Programs: Focus on Nutrients
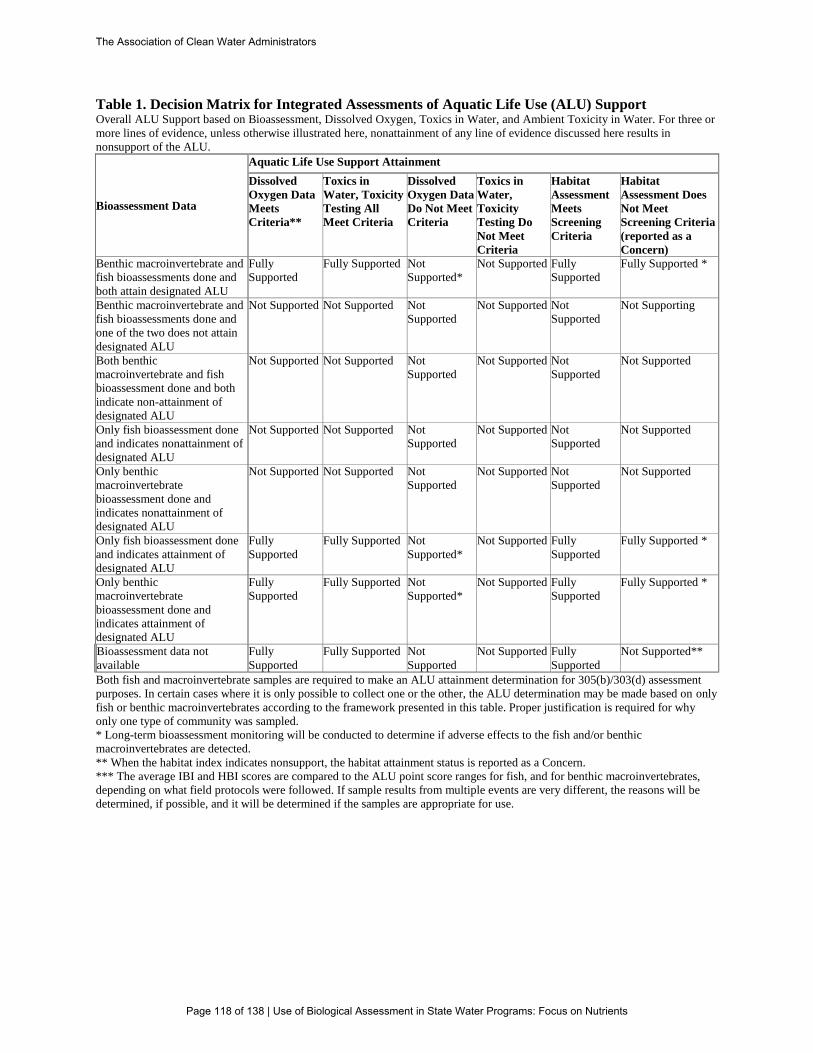
Table 1. Decision Matrix for Integrated Assessments of Aquatic Life Use (ALU) Support Overall ALU Support based on Bioassessment, Dissolved Oxygen, Toxics in Water, and Ambient Toxicity in Water. For three or
more lines of evidence, unless otherwise illustrated here, nonattainment of any line of evidence discussed here results in
nonsupport of the ALU.
Bioassessment Data
Aquatic Life Use Support Attainment
Dissolved
Oxygen Data
Meets
Criteria**
Toxics in
Water, Toxicity
Testing All
Meet Criteria
Dissolved
Oxygen Data
Do Not Meet
Criteria
Toxics in
Water,
Toxicity
Testing Do
Not Meet
Criteria
Habitat
Assessment
Meets
Screening
Criteria
Habitat
Assessment Does
Not Meet
Screening Criteria
(reported as a
Concern)
Benthic macroinvertebrate and
fish bioassessments done and
both attain designated ALU
Fully
Supported
Fully Supported Not
Supported*
Not Supported Fully
Supported
Fully Supported *
Benthic macroinvertebrate and
fish bioassessments done and
one of the two does not attain
designated ALU
Not Supported Not Supported Not
Supported
Not Supported Not
Supported
Not Supporting
Both benthic
macroinvertebrate and fish
bioassessment done and both
indicate non-attainment of
designated ALU
Not Supported Not Supported Not
Supported
Not Supported Not
Supported
Not Supported
Only fish bioassessment done
and indicates nonattainment of
designated ALU
Not Supported Not Supported Not
Supported
Not Supported Not
Supported
Not Supported
Only benthic
macroinvertebrate
bioassessment done and
indicates nonattainment of
designated ALU
Not Supported Not Supported Not
Supported
Not Supported Not
Supported
Not Supported
Only fish bioassessment done
and indicates attainment of
designated ALU
Fully
Supported
Fully Supported Not
Supported*
Not Supported Fully
Supported
Fully Supported *
Only benthic
macroinvertebrate
bioassessment done and
indicates attainment of
designated ALU
Fully
Supported
Fully Supported Not
Supported*
Not Supported Fully
Supported
Fully Supported *
Bioassessment data not
available
Fully
Supported
Fully Supported Not
Supported
Not Supported Fully
Supported
Not Supported**
Both fish and macroinvertebrate samples are required to make an ALU attainment determination for 305(b)/303(d) assessment
purposes. In certain cases where it is only possible to collect one or the other, the ALU determination may be made based on only
fish or benthic macroinvertebrates according to the framework presented in this table. Proper justification is required for why
only one type of community was sampled.
* Long-term bioassessment monitoring will be conducted to determine if adverse effects to the fish and/or benthic
macroinvertebrates are detected.
** When the habitat index indicates nonsupport, the habitat attainment status is reported as a Concern.
*** The average IBI and HBI scores are compared to the ALU point score ranges for fish, and for benthic macroinvertebrates,
depending on what field protocols were followed. If sample results from multiple events are very different, the reasons will be
determined, if possible, and it will be determined if the samples are appropriate for use.
The Association of Clean Water Administrators
Page 118 of 138 | Use of Biological Assessment in State Water Programs: Focus on Nutrients

Utah
Contact: Jeff Ostermiller, [email protected]; Mike Shupryt,
1. Please provide a brief overview of relevant biological/ecological assessment work your state
is conducting.
Macroinvertebrate empirical models (RIVPACS) are used to assess waters for 303(d)
purposes. Model outputs (O/E) and several metrics have been related to changes in
nutrient concentrations. Recently, Utah Department of Environmental Quality (UT DEQ)
has been exploring creating nutrient-specific indicators to more directly tie
macroinvertberate compositional measures to N & P concentrations.
Measures of algae abundance have traditionally been used to identify sites with nutrient-
related problems. Two measures of benthic algal abundance are obtained from
streams―chlorophyll-a and Ash Free Dry Mass (AFDM). In lakes, UT DEQ primarily
uses TSI indicators. Utah is in the process of strengthening compositional diatom
biological assessment indicators.
Utah’s most unique program involves the development of functional indicators of stream
conditions. Assessment methods that are under investigation include: bioassays to
quantify nutrient limitation, measures of whole-stream metabolism (Gross Primary
Production (GPP) and Community Respiration (CR)), reach-scale measures of organic
matter standing stock, leaf pack decomposition, and nutrient spiraling. The intent of this
research is to develop water quality indicators that provide quantitative linkages between
nutrients and aquatic life uses.
In another related project UT DEQ is developing ~15 Qual2K models for streams
throughout the state. The intent of this work is to establish causal relationships between
nutrients and other water quality parameters (i.e., pH, DO, SOD, BOD).
Together, the field, laboratory, and analytical methods for all of these programs are being
compiled into a single document that can be used by DWQ and our stakeholders to create
site-specific nutrient criteria. Each of these methods is relatively inexpensive to
incorporate into routine monitoring programs. These methods can be used together or
individually whenever site-specific standard investigations are required.
2. Which biological indicators/parameters does your state use (or plan to use) to assess aquatic
life impacts due to nutrients?
Streams
Macroinvertebrates: O/E and nutrient-specific metrics (e.g., % hydropsychids, Carlson
Index)
Algae: Benthic Biomass and compositional indicators
The Association of Clean Water Administrators
Page 119 of 138 | Use of Biological Assessment in State Water Programs: Focus on Nutrients

Functional Indicators: limiting nutrient bioassays, whole stream metabolism, reach-scale
and habitat-specific organic matter standing stocks, and leaf pack decomposition
Lakes
Trophic State Index (TSI)
Algae Composition Metrics (i.e., % cayanobacteria)
3. How sensitive to nutrients have those indicators/parameters been? How did you determine
that?
Developing and refining biological indicators with the express purpose of informing
nutrient programs is an active area of research. To date our results suggest that O/E and
other traditional macroinvertebrates measures are significantly albeit weakly related to
nutrient gradients. UT DEQ determined this with different “best fit” measures,
depending on the particular empirical model that was used to establish these
relationships.
Our recent work developing functional assessment tools is very promising, probably
because these measures are more directly linked to nutrient responses. Again, UT DEQ
is using a variety of analytical measures to quantify the sensitivity of these measures.
4. During criteria development, how have you found the correlation between causal (chemical)
and response (biological/ecological) variables for nutrients? If so, what approach(es) has
your state used to refine those relationships (e.g., subcategorizing waters, adjusting the
frequency and duration components of the criteria, using a range of TN and TP values,
developing site-specific numeric nutrient criteria, streamlining site-specific criteria
approaches, or other approaches)? Please discuss challenges and successes you have
experienced.
As commonly observed elsewhere, initial efforts to establish causal relationships between
compositional macroinvertebrate scores and nutrient concentrations showed fairly weak
relationships. However, these approaches identified several key data gaps including: a
paucity of reference site data and few measures of TN (TIN and Ammonia were more
common). Measures of algae abundance were more reliable indicators, but UT DEQ did
not have sufficient data to determine the extent of deleterious effects of increased algae
growth on stream biota.
Subsequent work as focused on improving these relationships using nearly all of the
examples discussed above. Through these subsequent efforts UT DEQ is optimistic that
they will be able to develop regional TN and TP indicators that can be used in concert
with ecological response variables to identify sites with nutrient-related problems. Once
these sites are identified, the TN and TP indicators can be promulgated as site-specific
numeric criteria. Alternatively, studies can be conducted to verify these indicators or
develop alternative site-specific criteria.
The Association of Clean Water Administrators
Page 120 of 138 | Use of Biological Assessment in State Water Programs: Focus on Nutrients

5. How is your biological/ecological assessment information used in combination with chemical
and physical data to make impairment decisions?
Utah currently applies “independent applicability” with chemical and biological data.
However, UT DEQ has also stated, in Integrated Reports, that such approaches are not
appropriate for non-toxic data. This policy is in revision.
6. Do you currently consider biological assessment information when developing NPDES
permits? If so, please describe how this is done.
Not generally. If the site was impaired and if the impairment was tied to a specific
pollutant, then then permit limits would be affected through TMDL load allocations.
Several load allocations have been established for nutrient-related TMDLs, particularly
for reservoir and lake impairments.
The Association of Clean Water Administrators
Page 121 of 138 | Use of Biological Assessment in State Water Programs: Focus on Nutrients
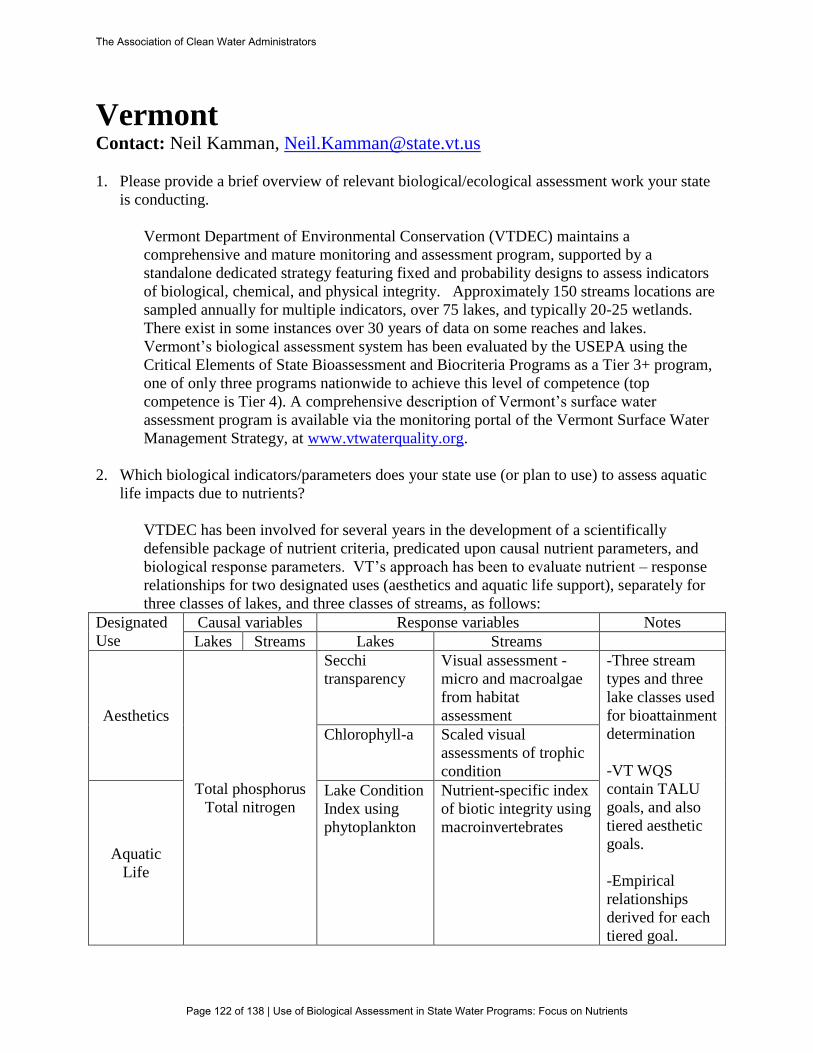
Vermont
Contact: Neil Kamman, [email protected]
1. Please provide a brief overview of relevant biological/ecological assessment work your state
is conducting.
Vermont Department of Environmental Conservation (VTDEC) maintains a
comprehensive and mature monitoring and assessment program, supported by a
standalone dedicated strategy featuring fixed and probability designs to assess indicators
of biological, chemical, and physical integrity. Approximately 150 streams locations are
sampled annually for multiple indicators, over 75 lakes, and typically 20-25 wetlands.
There exist in some instances over 30 years of data on some reaches and lakes.
Vermont’s biological assessment system has been evaluated by the USEPA using the
Critical Elements of State Bioassessment and Biocriteria Programs as a Tier 3+ program,
one of only three programs nationwide to achieve this level of competence (top
competence is Tier 4). A comprehensive description of Vermont’s surface water
assessment program is available via the monitoring portal of the Vermont Surface Water
Management Strategy, at www.vtwaterquality.org.
2. Which biological indicators/parameters does your state use (or plan to use) to assess aquatic
life impacts due to nutrients?
VTDEC has been involved for several years in the development of a scientifically
defensible package of nutrient criteria, predicated upon causal nutrient parameters, and
biological response parameters. VT’s approach has been to evaluate nutrient – response
relationships for two designated uses (aesthetics and aquatic life support), separately for
three classes of lakes, and three classes of streams, as follows:
Designated
Use
Causal variables Response variables Notes
Lakes Streams Lakes Streams
Aesthetics
Total phosphorus
Total nitrogen
Secchi
transparency
Visual assessment -
micro and macroalgae
from habitat
assessment
-Three stream
types and three
lake classes used
for bioattainment
determination
-VT WQS
contain TALU
goals, and also
tiered aesthetic
goals.
-Empirical
relationships
derived for each
tiered goal.
Chlorophyll-a Scaled visual
assessments of trophic
condition
Aquatic
Life
Lake Condition
Index using
phytoplankton
Nutrient-specific index
of biotic integrity using
macroinvertebrates
The Association of Clean Water Administrators
Page 122 of 138 | Use of Biological Assessment in State Water Programs: Focus on Nutrients

VTDEC submitted a technical document on Proposed Nutrient Criteria for Vermont’s
Lakes and Wadeable Streams to the Vermont Water Resources Panel in August 2009,
along with proposed rule language to incorporate additional nutrient criteria into the
Vermont Water Quality Standards. The analyses relied upon the conditional probability
analysis tool promoted by Paul et al. of EPA ORD. Consideration of the VT proposal
was subsequently deferred from rulemaking pending resolution of concerns raised by
USEPA Region 1 about nutrient criteria proposals in both Maine and Vermont regarding
the issue of independent applicability. In order to resolve these concerns and to refine the
analysis overall, the VTDEC Water Quality Division has decided to conduct a reanalysis
of the supporting data. The reanalysis is taking advantage of several more years of
relevant water quality and biological data that are now available, and will explore the use
of logistic regression as a potentially better statistical approach. Analyses will continue
to rely upon the data described in the Table above. Using logistic regression, it will be
possible to directly quantify the risk of impairment associated with any proposed criterion
value, and to predict the rates of false positive and false negative impairment
determinations. Criteria values can then be selected in a way that minimizes the risk of
use impairment and assessment errors. A milestone schedule for adopting additional
nutrient criteria in the Vermont Water Quality Standards for lakes and wadeable streams
has been required of the VTDEC Water Quality Division by our Performance Partnership
Agreement.
3. How sensitive to nutrients have those indicators/parameters been? How did you determine
that?
-and-
4. During criteria development, how have you found the correlation between causal (chemical)
and response (biological/ecological) variables for nutrients? If so, what approach(es) has
your state used to refine those relationships (e.g., subcategorizing waters, adjusting the
frequency and duration components of the criteria, using a range of TN and TP values,
developing site-specific numeric nutrient criteria, streamlining site-specific criteria
approaches, or other approaches)? Please discuss challenges and successes you have
experienced.
The relationship between nutrient concentration and use attainment based on the response
indicators is variable. The strength of association was determined statistically, by
examination of confidence intervals, p-values, and by examining probability
distributions. These evaluations are robust, and VT has a high degree of confidence in
the results. In descending order, nutrient-response relationships were tightest for
aesthetic indicators for lakes, followed by biological indicators for streams, biological
indicators for lakes, and least robust for aesthetic indicators in streams. VTDEC
determined that relationships are sufficiently robust to support deriving proposed criteria
thresholds for lake aesthetic and aquatic life uses, and stream aquatic life uses. VTDEC
has used multiple statistical evaluation tools to verify these relationships (e.g., applying
different lenses to the same date. Yet, despite reasonable strengths of association, there
remains an unacceptably high likelihood of false positive determinations for impairment
The Association of Clean Water Administrators
Page 123 of 138 | Use of Biological Assessment in State Water Programs: Focus on Nutrients

if nutrient thresholds are not corroborated by independent aesthetic or biological use
determinations for both lakes and streams.
5. How is your biological/ecological assessment information used in combination with chemical
and physical data to make impairment decisions?
Vermont’s Surface Water Assessment and Listing Methodology describes the process of
attainment determination. Typically, determinations of biological attainment are based
upon direct measurement of biological and habitat indicators. In instances where only
chemical data are available, these data may be used as a substantiation of impairment, but
placement of a reach or lake on the list of impaired waters without direct biological
assessments is uncommon in Vermont. Operationally, if there exists evidence of
impairment based on surface water chemical or conventional measurements, biological
assessments are prioritized. Exceptions to this are acidified lakes and acid mine drainage
impacted streams, which may be assessed as impaired for aquatic life use based simply
upon pH and alkalinity. To date in Vermont, there have been few to no instances where
chemical measurements indicated impairment, but biological measures did not. This may
not be the case for nutrient criteria, which have a high likelihood of generating false
positive impairment determinations, based on analyses conducted to date. The Vermont
Surface Water Assessment and Listing Methodology can be found at
www.vtwaterquality.org.
6. Do you currently consider biological assessment information when developing NPDES
permits? If so, please describe how this is done.
Vermont has developed an approved guidance for the assessing the likelihood that
regulated effluent may cause or contribute to impairment, which includes the use of
biological assessment. Wherever data are available, up and downstream biological
attainment is evaluated during permit re-authorizations. This assessment includes
physical, chemical and biological indicators. Vermont wastewater treatment plants in the
Lake Champlain Basin are subject to a regulatory limit of 0.8 mg/L total phosphorus in
effluent, in addition to wasteload allocations under the 2002 Lake Champlain TMDL.
Vermont has recently modified its assessment cycle to harmonize the timing of sampling
to basin planning cycles, thus providing updated information for wastewater facility re-
authorizations. Biological assessments are also performed regularly on all stormwater-
impaired streams that are or may be subject to MS4 permits, and as appropriate, on urban
and suburban streams to document the cumulative impacts of development. Further, the
documented biological condition of waters can affect the type of permit coverage
available (e.g. general permit versus individual permit), and may influence monitoring
requirements for discharges of industrial stormwater under the multi-sector general
permit.
The Association of Clean Water Administrators
Page 124 of 138 | Use of Biological Assessment in State Water Programs: Focus on Nutrients

Virginia
Contact: Alex Barron, [email protected]
1. Please provide a brief overview of relevant biological/ecological assessment work your state
is conducting.
Virginia has a biological monitoring program that assesses benthic macroinvertebrates in
freshwater streams, shallow rivers and also in estuaries. Multimetric scores have been
calibrated for different ecosystems and are used to define expected aquatic life
communities. The data provided by the benthic monitoring is used to assess whether the
waterbody is meeting the designated use so that the waterbody contains a balanced
community of aquatic life which might reasonably be expected to inhabit it.
2. Which biological indicators/parameters does your state use (or plan to use) to assess aquatic
life impacts due to nutrients?
In freshwater streams and rivers, Virginia uses benthic macroinvertebrates in our
biological monitoring program. Virginia is also investigating the use of fish community
information in assessing some aquatic life uses.
Chlorophyll a criteria are used in freshwater reservoirs and in some segments of the
Chesapeake Bay.
Also in the Chesapeake Bay, Virginia assesses the general narrative standard for aquatic
life use through assessment of benthic invertebrate community condition, and use of
segment specific criteria for submerged aquatic vegetation (SAV), “percent light-
through-water “and “water clarity acres.”
3. How sensitive to nutrients have those indicators/parameters been? How did you determine
that?
Virginia currently has an Academic Advisory Committee composed of Virginia
University scientists conducting a study in freshwater streams and shallow rivers, looking
for correlations between nutrient concentrations and unacceptable changes in freshwater
benthic community structure. The purpose of this study is to provide recommendations
for the development of nutrient criteria in streams and shallow rivers. The study is
attempting to find correlations between TN and/or TP and adverse changes to the benthic
macroinvertebrate community. Initial results have indicated that the benthic invertebrates
are not especially sensitive to nutrient concentrations. The study is continuing and a final
report is due by the end of 2011.
4. During criteria development, how have you found the correlation between causal (chemical)
and response (biological/ecological) variables for nutrients? If so, what approach(es) has
your state used to refine those relationships (e.g., subcategorizing waters, adjusting the
frequency and duration components of the criteria, using a range of TN and TP values,
The Association of Clean Water Administrators
Page 125 of 138 | Use of Biological Assessment in State Water Programs: Focus on Nutrients

developing site-specific numeric nutrient criteria, streamlining site-specific criteria
approaches, or other approaches)? Please discuss challenges and successes you have
experienced.
Preliminary investigations by Virginia’s Academic Advisory Committee have suggested
that nutrients (TN and TP) do not have a pronounced effect on benthic macroinvertebrate
communities in flowing freshwater ecosystems. The first round of investigations
tentatively identified concentrations of nutrients that might be useful in identifying a “no
observed effect concentration”, below which there is no evidence of any adverse effect of
nutrients on the aquatic life community. However, it has been difficult to identify any
threshold concentration of nutrients above which adverse responses are seen in the
benthic community that can be reliably attributed as a response to elevated nutrient
levels. This is not surprising as it is recognized that due to a variety of site-specific
factors, there is a general difficulty in identifying a specific concentration of TN or TP
that can be reliably associated with an adverse change in aquatic communities. This
makes it difficult to identify a specific concentration of nutrient to regulate as a criterion.
Virginia’s Academic Advisory Committee continues to work on this study.
Because of the difficulty in identifying a clear threshold of nutrient concentrations for use
in establishing a criterion or as a threshold guideline, the Virginia Academic Advisory
Committee (AAC) has recommended using a weight of evidence or decision-tree
approach to determining when or if a freshwater stream or shallow river is impaired due
to elevated nutrients. For assessing flowing freshwaters, the AAC has recommended
identifying a combination of threshold concentrations of nutrient consisting of a low
concentration referred to as a “no observed effect concentration” (NOEC) below which
there is no evidence that a nutrient caused adverse change in the benthic community is
likely to be caused by this level of nutrients. If nutrient concentrations are below this
NOEC concentration, the waterbody should be judged as unimpaired based only on the
nutrient concentration and no additional biological monitoring or assessment is needed.
If environmental data can show that there is a higher concentration of the nutrient that is
associated with adverse effects on the aquatic community and that these changes in the
aquatic community are likely to be caused by the elevated nutrient concentration, then
this higher threshold concentration of the nutrient can be used as another threshold. If
this upper threshold concentration can be identified, it could be used as a threshold to
assess the stream of river as impaired due to nutrients, without the need for additional
biological monitoring. If the concentration of nutrients lies between the NOEC and the
upper threshold nutrient concentration, then additional biological monitoring is needed to
determine if the nutrients are the cause of the poor aquatic life community scores (or
whether physical or other factors are the cause of the altered benthic community). The
AAC is currently conducting a study to help identify concentrations of nutrients that can
be used as the low NOEC and the higher upper threshold concentration. The AAC is
finishing this study and a final report is due by the end of 2011.
5. How is your biological/ecological assessment information used in combination with chemical
and physical data to make impairment decisions?
The Association of Clean Water Administrators
Page 126 of 138 | Use of Biological Assessment in State Water Programs: Focus on Nutrients
Currently in Virginia, impairment decisions are based on a variety of data or information,
including:
a) Comparisons of concentrations of pollutants from chemical or bacteria monitoring
data compared to water quality criteria concentrations.
b) Assessment of benthic macroinvertebrate community using a multi-metric score
that represent a minimum expected community.
c) Comparisons of fish contamination concentrations compared to the concentrations
of the toxic pollutant that is the basis for the “human health” water quality criteria
that are based on human exposure via eating contaminated fish.
6. Do you currently consider biological assessment information when developing NPDES
permits? If so, please describe how this is done.
Permit writers consider all ambient data, including biological data in permit development.
If the receiving waterbody has been assessed as impaired, they would be expected to
include a special condition that says when a Total Maximum Daily Load (TMDL) is
approved (and the stressor identified); the permit will be opened to incorporate the limits
needed. Biological assessment information may be used if developing NPDES permits,
once a waterbody has been listed as impaired and a TMDL study has identified a stressor
that can be addressed by a permit limit. The main implementation tool for biological
assessment data for use in establishing NPDES permits is via a TMDL or a water quality
management plan. An instream biological assessment could necessitate a TMDL where
the stressor is identified (say for solids, nutrients or toxics) which would / could point to a
WLA for a permit. By developing a TMDL in response to an identified impaired
condition, the site-specific conditions that influence the biological community are taken
into consideration and a site-specific stressor is identified and appropriate measures can
be taken to provide the correct remedy for the site-specific problem.
The Association of Clean Water Administrators
Page 127 of 138 | Use of Biological Assessment in State Water Programs: Focus on Nutrients

Washington
Contact: Karen Adams, [email protected]
1. Please provide a brief overview of relevant biological/ecological assessment work your state
is conducting.
Currently, Washington State Department of Ecology (ECY WA DOE) is using
bioassessment in our monitoring programs, water quality assessment and effectiveness
monitoring programs. ECY WA DOE uses both macroinvertebrates and to a lesser
degree, periphyton, although as yet, have no bioassessment models built for periphyton.
ECY WA DOE is beginning to use bioassessment as a parameter to measure for TMDL
studies, particularly for stormwater studies. The Department recently laid out sample
collection protocols and is promoting the standard use of these protocols by others across
the state. This streamlines the data sharing process and allows us to compare stream
health on a single standard of data quality. Specific studies related to nutrients using
bioassessment are rare to this date, although ECY WA DOE is increasingly incorporating
bioassessment into their activities as they continue to build bioassessment tools
appropriate for the various regions of the state.
2. Which biological indicators/parameters does your state use (or plan to use) to assess aquatic
life impacts due to nutrients?
ECY WA DOE currently uses as much information as they can pull together. The
Department starts with multi-metric (IBI style) and multi-variate O/E analysis. In
addition, other indices are looked at, including ratios of functional feeding groups
including Scraper:Filterer and Hilsenhoff Biotic Index. ECY WA DOE has also started
to collect and analyze periphyton, which are known to be more responsive to nutrient
fluctuations.
3. How sensitive to nutrients have those indicators/parameters been? How did you determine
that?
Because of the relatively recent history of the use of bioassessment techniques in
Washington State, sensitivity to nutrients has not been investigated. This is something
the Department foresees investigating in the future as more data is collected.
4. During criteria development, how have you found the correlation between causal (chemical)
and response (biological/ecological) variables for nutrients? If so, what approach(es) has
your state used to refine those relationships (e.g., subcategorizing waters, adjusting the
frequency and duration components of the criteria, using a range of TN and TP values,
developing site-specific numeric nutrient criteria, streamlining site-specific criteria
approaches, or other approaches)? Please discuss challenges and successes you have
experienced.
The Association of Clean Water Administrators
Page 128 of 138 | Use of Biological Assessment in State Water Programs: Focus on Nutrients

ECY WA DOE recently developed a stressor ID guidance document and intends to begin
stressor ID studies this year. Because of the limited history with conducting stressor ID,
the Department is unable to address this question at this time.
5. How is your biological/ecological assessment information used in combination with chemical
and physical data to make impairment decisions?
Currently, a stream can be listed as impaired (Category 5 of the Washington Water
Quality Assessment, which is the 303d List) based on bioassessment alone. ECY WA
DOE looks at the scores for the Western Washington O/E model (Utah State Bug Lab) or
from the multi-metric model to determine impairment. The Department’s policy is a
narrative policy, but they have set numeric guidelines using the O/E model, stating that a
score of >0.86 is not impaired (Category 1), while a score of <0.73 is impaired (Category
5). Scores between 0.86 and 0.73 are considered “of concern” (Category 2). ECY WA
DOE hopes to develop similar guidelines for the various multimetric models as they are
developed for each region of the state. These guidelines will be and have been
established based on percentiles.
Chemical and physical data are used to support the stressor ID process, and depending on
the results of that study ECY WA DOE determines how to address the impairment.
These data are either collected and submitted at the time of the biological data that led to
the impairment or they are collected as part of the stressor ID when not available.
6. Do you currently consider biological assessment information when developing NPDES
permits? If so, please describe how this is done.
At the moment, ECY WA DOE has not used biological assessment for NPDES permits.
It is unclear at this point if or how the Department might do this.
The Association of Clean Water Administrators
Page 129 of 138 | Use of Biological Assessment in State Water Programs: Focus on Nutrients

West Virginia
Name: John Wirts, [email protected]; Kevin Coyne, [email protected]
1. Please provide a brief overview of relevant biological/ecological assessment work your state
is conducting.
Starting in 1998, West Virginia Department of Environmental Protection’s (WVDEP’s)
Watershed Assessment Branch has annually collected benthic macroinvertebrate (~475
sites per year) data from streams and rivers (and to a lesser extent, fish community data)
utilizing: a probabilistic/random sampling design approach; intensive monitoring to
support-TMDL development; targeted monitoring using a rotating basin approach; and
long-term monitoring from both our Ambient Monitoring (largest streams and rivers in
the state) and LTMS (generally smaller streams) programs.
2. Which biological indicators/parameters does your state use (or plan to use) to assess aquatic
life impacts due to nutrients?
WVDEP continues to investigate the use of both benthic macroinvertebrate and fish
communities for nutrient related impacts. WVDEP has not ruled out the use of other
indicators, including periphyton and algal communities that may exhibit better elevated
nutrient response relationships.
3. How sensitive to nutrients have those indicators/parameters been? How did you determine
that?
Previous attempts to correlate benthic macroinvertebrate metrics with nutrient data
revealed very weak relationships. WVDEP typically sees detectable levels of TP during
higher flow events, which typically don’t coincide with macroinvertebrate sampling
events and is most likely impacting these results. WVDEP plans to continue this work
utilizing new data, methods of assessment, and results from other studies.
4. During criteria development, how have you found the correlation between causal (chemical)
and response (biological/ecological) variables for nutrients? If so, what approach(es) has
your state used to refine those relationships (e.g., subcategorizing waters, adjusting the
frequency and duration components of the criteria, using a range of TN and TP values,
developing site-specific numeric nutrient criteria, streamlining site-specific criteria
approaches, or other approaches)? Please discuss challenges and successes you have
experienced.
As stated in the answer to question #3, previous attempts to correlate benthic
macroinvertebrate metrics with nutrient data revealed very weak relationships.
5. How is your biological/ecological assessment information used in combination with chemical
and physical data to make impairment decisions?
The Association of Clean Water Administrators
Page 130 of 138 | Use of Biological Assessment in State Water Programs: Focus on Nutrients

Assessments of biological and chemical and physical data are all assessed independently
(ie., if WQ bad and bugs good, WVDEP would list as WQ impaired)
6. Do you currently consider biological assessment information when developing NPDES
permits? If so, please describe how this is done.
WVDEP utilizes biological assessment information in various programs, including
NPDES programs in the Division of Water and Waste and Division of Mining, granted
the majority of the assessment work is not focused on nutrients. In places where a 316(a)
thermal variances has been granted, WVDEP requires fish surveys to be conducted.
WVDEP also requires toxicity testing on all major municipal facilities and typically on
all major industrial process discharges, and may also require toxicity testing on minor
permits where there is a large discharge to a small stream, a potential for impact due to a
particular pollutant in the discharge, and/or if there is a known issue in the receiving
stream. Historically, biological impairments to WV waters were not been attributed
directly to specific sewage/industrial discharges. However, if there was a known issue
that was linked to a particular discharge, WVDEP would likely consider any information
available and develop appropriate requirements in a permit to ensure the discharge does
not cause or contribute to the issue.
The Association of Clean Water Administrators
Page 131 of 138 | Use of Biological Assessment in State Water Programs: Focus on Nutrients

Wisconsin
Contact: Amanda Minks, [email protected]
1. Please provide a brief overview of relevant biological/ecological assessment work your state
is conducting.
Wisconsin Department of Natural Resources (WDNR) conducts baseline (Tier 1)
monitoring at a broad spatial scale and includes collection of fish surveys and
macroinvertebrate samples. WDNR also conducts targeted (Tier 2) monitoring at priority
locations, which includes the collection of these biological data at multiple locations on a
waterbody and replicate sampling events at a particular site.
2. Which biological indicators/parameters does your state use (or plan to use) to assess aquatic
life impacts due to nutrients?
Streams and river biological condition is assessed using indices of biotic integrity (IBI)
for both fish and macroinvertebrate communities. Lake and reservoir biological
condition is primarily assessed using trophic state indicators, including measures of
clarity (e.g., secchi depth and satellite imagery) and algal productivity (e.g. chlorophyll a
concentration).
3. How sensitive to nutrients have those indicators/parameters been? How did you determine
that?
Indicator responses to nutrients can vary greatly from site-to-site. Therefore, WDNR used
reference conditions to determine baselines. WDNR used the information in Robertson et
al. (2008) to help make this determination – http://pubs.usgs.gov/pp/1754/.
4. During criteria development, how have you found the correlation between causal (chemical)
and response (biological/ecological) variables for nutrients? If so, what approach(es) has
your state used to refine those relationships (e.g., subcategorizing waters, adjusting the
frequency and duration components of the criteria, using a range of TN and TP values,
developing site-specific numeric nutrient criteria, streamlining site-specific criteria
approaches, or other approaches)? Please discuss challenges and successes you have
experienced.
This question is primarily answered in the Robertson et al. (2008) study. Again, the
reference condition method was used to derive the statewide criteria for phosphorus.
Nitrogen criteria have yet to be developed for the state. Wisconsin is also currently in the
process of investigating a site-specific nutrient criteria methodology. Per the Robertson
study, water subcategories and ecoregion did not seem to significantly change the effects
of phosphorus on waters.
5. How is your biological/ecological assessment information used in combination with chemical
and physical data to make impairment decisions?
The Association of Clean Water Administrators
Page 132 of 138 | Use of Biological Assessment in State Water Programs: Focus on Nutrients

Wisconsin Consolidated Assessment and Listing Methodology (WisCALM) uses a
hierarchical approach for assessing waters when multiple data types/indicators are
available. Generally, biological indicators are weighted more heavily than physical or
chemical parameters. For example, Current WisCALM requires an observation of
biological impairment in order to corroborate an impairment listing related to exceedance
of total phosphorus criterion. Biological indicators for assessment of the fish and aquatic
life use may have precedence over chemical/physical indicators, because they are direct
measures of the health of aquatic life. Biological data alone may also be used to assess a
water’s fish and aquatic life use, but has a higher minimum data requirement than
assessments based on a combination of biological and physical/chemical data.
6. Do you currently consider biological assessment information when developing NPDES
permits? If so, please describe how this is done.
No. Wisconsin uses the provisions in s. NR 217.13, Wis. Ad. Code to develop limits for
NPDES permits. Biological assessment is only considered when deriving site-specific
criteria or assessing downstream protection.
The Association of Clean Water Administrators
Page 133 of 138 | Use of Biological Assessment in State Water Programs: Focus on Nutrients

Wyoming
Contact: Eric Hargett, [email protected]
1. Please provide a brief overview of relevant biological/ecological assessment work your state
is conducting.
Monitoring and Assessment Program objectives
Primary Objectives
1) Rotating basin probabilistic monitoring for wadeable streams and rivers to help
fulfill 305(b) requirements
2) Targeted monitoring on wadeable streams and rivers to assess designated use
support and in support of 303(d) requirements
3) Reference network monitoring - repeat visits to historical reference sites and
identification of new reference sites on wadeable streams and rivers
4) Overall condition and trends for water quality of large reservoirs
Secondary Objectives
1) Monitoring in support of state water quality standards
2) Monitoring in support of TMDLs
3) 319 or TMDL effectiveness monitoring
4) Monitoring in support of Wyoming Pollutant Discharge Elimination System
(WYPDES) Program permits and policies
2. Which biological indicators/parameters does your state use (or plan to use) to assess aquatic
life impacts due to nutrients?
Wyoming Department of Environmental Quality (WY DEQ) uses two primary biological
indicators to assess aquatic life impacts: the multimetric Wyoming Stream Integrity
Index (WSII) and the predictive Wyoming River InVertebrate Prediction And
Classification System (WY RIVPACS) that both use benthic macroinvertebrates as the
indicator taxa. The WSII and WY RIVPACS were redeveloped in 2006 and 2005,
respectively, with new versions of both models due out in Spring 2012. Both models
only provide information on the relative departure of the benthic macroinvertebrate
community from some regional reference condition. They cannot directly be used to
ascertain what pollutant(s) may be impacting the community.
Wyoming also uses multiple periphyton/diatom metrics as secondary or supplemental
indicators in the assessment of aquatic life condition. The biological indicator models in
addition to periphyton; chlorophyll a, benthic macroinvertebrate metrics, other
biological, chemical and physical information; and scientific literature are used as part of
a weight-of-evidence approach to evaluate any potential impacts due to nutrient
enrichment or other pollutants.
3. How sensitive to nutrients have those indicators/parameters been? How did you determine
that?
The Association of Clean Water Administrators
Page 134 of 138 | Use of Biological Assessment in State Water Programs: Focus on Nutrients

Final output of the WY RIVPACS and WSII do not provide specific details as to what
pollutant(s) are impacting the benthic macroinvertebrate community - only the relative
degree of departure from an expected condition. Evaluation of specific metrics within the
WSII and other benthic macroinvertebrate metrics that may be influenced by nutrient
enrichment are also evaluated. If the WSII and/or WY RIVPACS indicate impacts to the
aquatic community and particular benthic macroinvertebrate metrics or other information
suggest nutrients as a possible stressor, then the periphyton/diatom metrics can be used to
help validate this claim. Periphyton/diatoms metrics appear to be sensitive to nutrient
enrichment in Wyoming and provide an enhanced level of resolution with respect to
nutrient enrichment. These metrics help us evaluate the analyte(s) of concern (P or N),
associated D.O. issues, origin (organic vs. inorganic) and/or relative frequency and
magnitude of any enrichment. Inferences of nutrient enrichment from the biological data
are then cross-referenced to the available chemical and physical data in a weight-of-
evidence approach that includes comparisons to appropriate control sites to determine the
relative risk/impact of any nutrient enrichment. Various stressor-response type analyses,
analysis of targeted assessment work and/or multivariate statistics have been used to
arrive at these conclusions.
4. During criteria development, how have you found the correlation between causal (chemical)
and response (biological/ecological) variables for nutrients? If so, what approach(es) has
your state used to refine those relationships (e.g., subcategorizing waters, adjusting the
frequency and duration components of the criteria, using a range of TN and TP values,
developing site-specific numeric nutrient criteria, streamlining site-specific criteria
approaches, or other approaches)? Please discuss challenges and successes you have
experienced.
Stressor-response relationships between periphyton or benthic macroinvertebrate
metrics/taxa and particular nutrients have seen limited correlation at the statewide level,
though relationships are difficult to ascertain at local/regional levels. WY DEQ
speculates this may be partially attributed to the frequency and duration of nutrient
enrichment in streams of Wyoming. Our state has few instances where there is a
continuous input of nutrients to a system that may impact aquatic life. Rather, episodic
pulses of nutrients are more common in our state. Secondly, because of the high
environmental heterogenity of our state, background nutrient concentrations are quite
variable. This can be partially addressed through stream stratification by origin,
ecoregion, bioregion, geology, flow regime, etc. though stressor-response relationships
remain weak. Our other complicating factor is that streams where nutrient enrichment
may be an issue are also subjected to other stressors such as channel degradation, excess
sediment, etc. Interactions between the biota and multiple stressors make for weak
relationships for any one stressor. Multivariate techniques help, but are not the cure-all.
5. How is your biological/ecological assessment information used in combination with chemical
and physical data to make impairment decisions?
The Association of Clean Water Administrators
Page 135 of 138 | Use of Biological Assessment in State Water Programs: Focus on Nutrients
Wyoming has a credible data law that requires the use of biological, chemical and
physical data to make use-support decisions. WY DEQ has applied this by using a
weight-of-evidence approach of all three data types. No one data type or indicator (i.e.
models) are used as 'black boxes', rather WY DEQ weighs the strength of each line of
evidence to arrive at a conclusion for aquatic life use condition. Scientific literature and
supplemental data from other sources are also used to arrive at a suitable aquatic life
condition conclusion.
6. Do you currently consider biological assessment information when developing NPDES
permits? If so, please describe how this is done.
As standard practice...no. Though more information on this topic can be obtained from
our WYPDES staff.
The Association of Clean Water Administrators
Page 136 of 138 | Use of Biological Assessment in State Water Programs: Focus on Nutrients
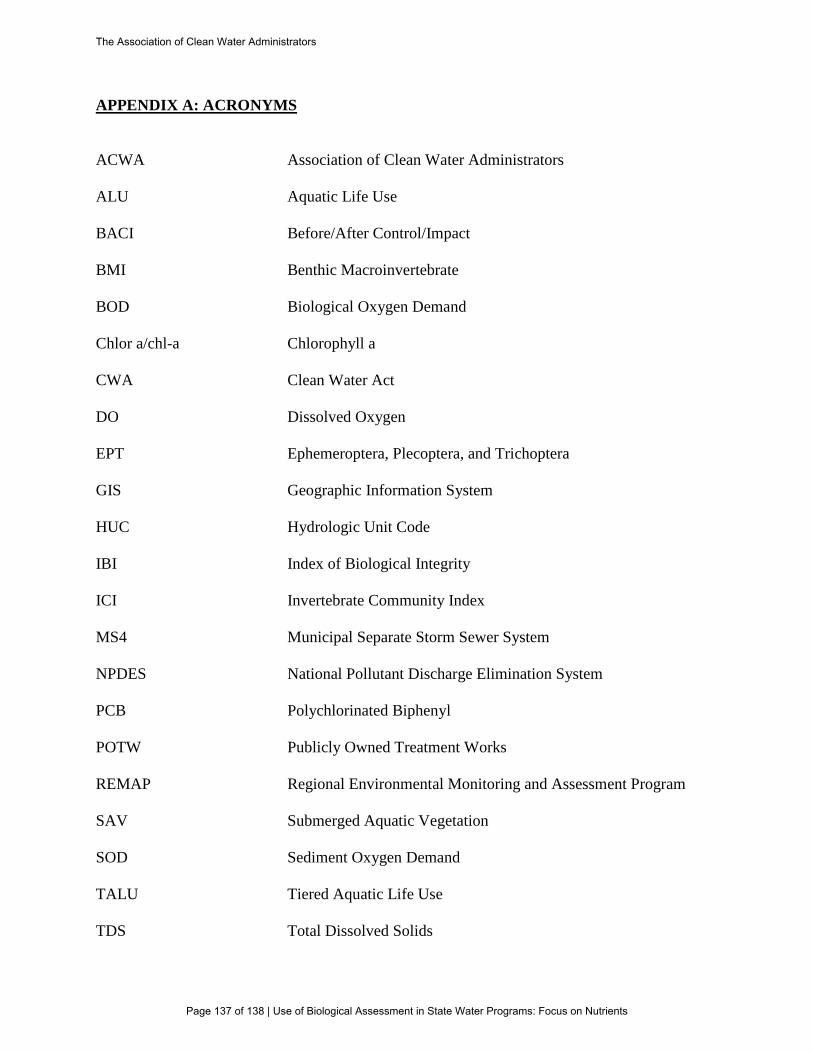
APPENDIX A: ACRONYMS
ACWA Association of Clean Water Administrators
ALU Aquatic Life Use
BACI Before/After Control/Impact
BMI Benthic Macroinvertebrate
BOD Biological Oxygen Demand
Chlor a/chl-a Chlorophyll a
CWA Clean Water Act
DO Dissolved Oxygen
EPT Ephemeroptera, Plecoptera, and Trichoptera
GIS Geographic Information System
HUC Hydrologic Unit Code
IBI Index of Biological Integrity
ICI Invertebrate Community Index
MS4 Municipal Separate Storm Sewer System
NPDES National Pollutant Discharge Elimination System
PCB Polychlorinated Biphenyl
POTW Publicly Owned Treatment Works
REMAP Regional Environmental Monitoring and Assessment Program
SAV Submerged Aquatic Vegetation
SOD Sediment Oxygen Demand
TALU Tiered Aquatic Life Use
TDS Total Dissolved Solids
The Association of Clean Water Administrators
Page 137 of 138 | Use of Biological Assessment in State Water Programs: Focus on Nutrients

TIN Total Inorganic Nitrogen
TMDL Total Maximum Daily Load
TN Total Nitrogen
TP Total Phosphorus
UAA Use Attainability Analysis
USEPA United States Environmental Protection Agency
USGS United States Geological Survey
WET Whole Effluent Toxicity
WLA Waste Load Allocation
WQBEL Water Quality-Based Effluent Limit
WQ Water Quality
WQS Water Quality Standard
WWTP/WWTF Wastewater Treatment Plant/Facility
The Association of Clean Water Administrators
Page 138 of 138 | Use of Biological Assessment in State Water Programs: Focus on Nutrients