use and habitat characteristics of sharp-tailed grouse ...€¦ · use and habitat characteristics...
TRANSCRIPT

Use and Habitat Characteristics of Sharp-tailed Grouse Leks in Northwest Alberta
CONSERVATIONCONSERVATION
REPORT REPORT
SERIESSERIES

CONSERVATIONCONSERVATION
REPORT REPORT
SERIESSERIES 25% Post Consumer Fibre
When separated, both the binding and paper in this document are recyclable
The Alberta Conservation Association is a Delegated Administrative Organization under Alberta’s Wildlife Act.

Use and Habitat Characteristics of Sharp‐tailed Grouse Leks in Northwest Alberta
Stephanie Grossman and Robb Stavne Alberta Conservation Association
Bag 900‐26 Peace River, Alberta, Canada
T8S 1T4

Report Series Editor PETER AKU P.O. Box 40027 Baker Centre Postal Outlet Edmonton, AB, T5J 4M9
Conservation Report Series Types: Data, Technical ISBN printed: 0‐7785‐4815‐5 ISBN online: 0‐7785‐4816‐3 Publication number: T/115
Disclaimer: This document is an independent report prepared by the Alberta Conservation Association. The authors are solely responsible for the interpretations of data and statements made within this report.
Reproduction and Availability: This report and its contents may be reproduced in whole, or in part, provided that this title page is included with such reproduction and/or appropriate acknowledgements are provided to the authors and sponsors of this project.
Suggested citation: Grossman, S. R. and R.B. Stavne. 2005. Use and habitat characteristics of sharp‐tailed
grouse leks in northwest Alberta. Technical Report, T‐2004‐004, produced by Alberta Conservation Association, Peace River, Alberta, Canada. 20 pp + App.
Cover photo credit: David Fairless
Digital copies of conservation reports can be obtained from: Alberta Conservation Association P.O. Box 40027, Baker Centre Postal Outlet Edmonton, AB, T5J 4M9 Toll Free: 1‐877‐969‐9091 Tel: (780) 427‐5192 Fax: (780) 422‐6441 Email: info@ab‐conservation.com Website: www.ab‐conservation.com
i

EXECUTIVE SUMMARY In 2004 the Alberta Conservation Association resumed its sharp‐tailed grouse
(Tymphanucus phasianellus jamesi) lek surveys to monitor historical locations throughout
the Peace Region. Leks were surveyed to assess their status (active, non‐active) and
define habitat characteristics adjacent to both active and non‐active leks. These surveys
were resumed to locate established lek sites and to begin to develop a plan for future
sharp‐tailed grouse stewardship agreements with local landowners.
Sixty‐six historical leks (locations identified prior to 2000) and 10 new leks (locations
identified in 2004) were surveyed with a total of 39 being active in 2004. The average
number of birds attending leks in 2004 (11.8 birds/lek) was slightly higher than that
between 1996 and 2000 (range in attendance at leks = 8.8 – 10.6 birds).
Comparison of habitat immediately adjacent to leks (i.e. within 0.64 km2) showed that
active leks were surrounded by significantly more non‐cultivated land (average = 63%,
p = 0.04) and shrublands (7%, p = 0.05) than non‐active leks (non‐cultivated land = 50%;
shrublands = 4%). At a landscape scale (i.e. centred within 5.8 km2), active leks were
also surrounded by more non‐cultivated lands (69%) than non‐active leks (54%,
p = 0.03). At this scale (5.8 km2), shrubland habitats and all native land cover types
were more abundant at active leks (shrublands = 12%, p = 0.00; native land cover = 35%,
p = 0.03) than at non‐active leks (shrublands = 8%, native land cover = 30%).
Results suggest that shrublands function as important nesting or brooding habitat for
sharp‐tailed grouse. However, there is currently no information on nest site
preferences of sharp‐tailed grouse in the Peace Region. We recommend that additional
studies be undertaken to: i) quantify nesting habitat requirements, and ii) determine the
extent to which differences in landuse influence the distribution and abundance of lek
sites and population dynamics. Furthermore, annual monitoring of specific leks and
landscapes is recommended to facilitate a greater understanding of population trends
over time.
Key words: Sharp‐tailed grouse, lek, habitat, population trend, Northwest Alberta.
ii

ACKNOWLEDGEMENTS
We are grateful to the following individuals and agencies for their contributions and
assistance in delivering this project. In particular, we would like to sincerely thank
Dave Jackson, Mike Rosendal, Ed Kolodychuk, and Mark Heckbert (Alberta
Sustainable Resource Development) for their dedication to early morning searches of
sharp‐tailed grouse leks. Velma Hudson, Julie Landry, and Leo Dube also provided
invaluable assistance in the completion of this report. Lastly, we thank Garry
Scrimgeour and one anonymous reviewer for providing constructive comments on an
early draft of this report.
iii

TABLE OF CONTENTS
EXECUTIVE SUMMARY..............................................................................................ii
ACKNOWLEDGEMENTS...........................................................................................iii
TABLE OF CONTENTS ...............................................................................................iv
LIST OF FIGURES ......................................................................................................... v
LIST OF TABLES ...........................................................................................................vi
LIST OF APPENDICES ...............................................................................................vii
1.0 INTRODUCTION .............................................................................................1 1.1 General introduction.................................................................................................... 1 1.2 Study rationale and objectives.................................................................................... 2
2.0 STUDY AREA....................................................................................................2 2.1 Ecoregion and land cover......................................................................................... 4
3.0 MATERIALS AND METHODS ......................................................................4 3.1 General sampling methods ......................................................................................... 5 3.2 Land cover mapping.................................................................................................... 5 3.3 Statistical analyses........................................................................................................ 6
4.0 RESULTS ............................................................................................................8 4.1 Land cover associated with active and non‐active lek sites ................................... 8 4.2 Historical lek activity and population trends......................................................... 10
5.0 DISCUSSION AND RECOMMENDATIONS ............................................11 5.1 Habitat associations of sharptail leks ...................................................................... 11 5.2 Historical lek activity and population trends......................................................... 12 5.3 Recommendations for future monitoring and stewardship activities................ 13
6.0 LITERATURE CITED .....................................................................................16
7.0 APPENDIX.......................................................................................................21
iv

LIST OF FIGURES
Figure 1. Locations of sharp‐tailed grouse lek sites in Northwest Alberta. ................... 3
v

LIST OF TABLES
Table 1. Land cover types measured at each lek site. ...................................................... 6
Table 2. Alternative hypotheses to test differences in lek attendance relating to land cover type. ............................................................................................................... 8
Table 3. Summary of Mann Whitney U test results quantifying differences in lek attendance at 0.64 km2 scale.. ................................................................................ 9
Table 4. Summary of Mann Whitney U test results indicating differences in lek attendance at 5.8 km2 scale. ................................................................................. 10
Table 5. Historical trends of lek characteristics in the north west region of Alberta. 11
vi

LIST OF APPENDICES Appendix 1. An example of an aerial photograph used to define habitat conditions
adjacent to sharp‐tailed grouse leks in Northwest Alberta.................. 21 Appendix 2. Lek activity in the Peace Region from 1996 to 2004 ................................ 22
vii
1.0 INTRODUCTION
1.1 General introduction
The sharp‐tailed grouse (Tymphanucus phasianellus jamesi; hereafter sharptails) is a
familiar bird across the Peace River region of north‐western Alberta, as well as other
open‐area habitats throughout the province. Populations of sharptails have been
declining since the 1960s (Sisson 1976, Goddard 1995). This trend is of concern to the
hunting and conservation community in the Peace region. Reasons for the population
decline of sharptails are generally unknown, however it is likely related to increased
conversion of native grassland to agriculture and the subsequent loss of breeding
habitat (Evans 1968, McDonald and Reese 1998, Broatch 2002a). Information on
sharptail populations in the Peace Region is limited and their status is largely unknown
(Ritcey 1995, Connelly et al. 1998).
Lek sites are critical habitat features for sharptails during their breeding cycle. In early
spring (late March through May), leks serve as a dancing ground at which males
display to compete for mating opportunities with available females. Following
courtship and breeding, females disperse within a 2‐km radius of the lek site to nest
and brood their young (Evans 1968, Pepper 1972, Jones and Miller 1998). Unbroken
native grasslands that include low shrubland habitat are preferentially used by
sharptails (Aldrich 1963, Moyles 1981, Klott and Lindsey 1990, Manzer 2004). Tame
hayland and pastures are used when native cover is sparse; cultivated land is generally
avoided (Pepper 1972).
In the Peace Region of Alberta, less than 0.4% (<2,000 ha) of historical upland native
grassland remains on the landscape, over 99% of it having been converted to crop
production or tame hay and pasture (Alberta Environmental Protection 1997; Baker
2004). This loss of native grassland has been associated with substantial declines of
traditional sharptail habitat throughout the region (Goddard 1995). Between 1995 and
2000, sharptail lek surveys were conducted by the Alberta Conservation Association
(ACA) to: i) assess the prevailing status of lek sites and ii) identify priority sites that
may be suitable for habitat stewardship opportunities (Broatch 2002a, b).
1

1.2 Study rationale and objectives
Conservation efforts needed to address the historical decline of sharptails in northern
Alberta require the support of local landowners because sharptail leks and suitable
habitat are located primarily on privately owned lands. As a result, an effective
collaboration between conservation organizations and landowners is required to:
i) quantify the distribution and abundance of sharptails and ii) discuss alternative
landuse practices that may support recovery of the species. Through these efforts, it
may be possible to establish stewardship agreements addressing the important habitat
elements associated with stable or increasing sharptail populations.
Sharptail lek surveys conducted by ACA between 1996 and 2000 in the northwest
region were resumed in 2004. This was part of continued efforts to develop habitat
stewardship agreements to conserve important sharptail habitat. The objectives of this
project were threefold: i) assess the status (active or non‐active) of all historical lek sites,
ii) identify changes in sharptail lek activity since 1996 and iii) identify habitat
characteristics adjacent to both active and non‐active lek sites. This information will
help the ACA to develop a plan for future sharptail stewardship agreements with local
landowners.
2.0 STUDY AREA
The study area for this survey included all historical lek locations originally identified
and mapped prior to 2000. These sites primarily occur within the white zone (mostly
privately owned or public leased land under agricultural production) of the Peace River
region (Figure 1). Although a few leks occur within provincial grazing leases, or in the
green zone (public land that is mostly forested), the majority are located on private land
(Public Lands 2004).
2

High Level
Grande Prairie
Peace River
Edmonton
CalgaryLegend
Active Sharp‐tailed grouse lek sites
Non‐active Sharp‐tailed grouse lek sites
Figure 1. Locations of sharptail lek sites in Northwest Alberta. Inset shows the location of the Northwest region in Alberta.
3

2.1 Ecoregion and land cover
The entire study area falls within the Peace Lowlands Ecoregion (Environment Canada
2004) and consists primarily of dry mixedwood natural subregion and some Peace
River parkland natural sub‐region (Strong and Leggat 1992, Achuff 1994). Most of this
ecoregion is settled and over the last 100 years nearly half of the landscape has been
converted to agricultural land use (almost 7 million acres of farmland in 2001;
Schneider 2002, Statistics Canada 2001). Agricultural land in the Peace Region is
approximately equally divided between crops (dominated by wheat and canola with
lesser amounts of barley, peas, rye and oats), and tame hay and pasture (dominated by
alfalfa and alfalfa mixtures) (Alberta Agriculture, Food and Rural Development 2001,
J. Zylstra, Alberta Agriculture, Food and Rural Development, pers. comm.,).
Interspersed within this agricultural landscape is a mosaic of native dry mixedwood
and aspen parkland forest with some small remnant grassland patches. In general, low
topographical relief and somewhat cooler temperatures characterize the Peace
Lowlands Ecoregion relative to similar mixedwood and parkland ecoregions to the
south. Forests within this ecoregion are dominated by trembling aspen (Populus
tremuloides), balsam poplar (P. balsamifera), and white spruce (Picea glauca) (Strong and
Leggat 1992). Native grasslands comprised primarily of slender wheatgrass (Agropyron
trachycaulum), western porcupine grass (Stipa curtiseta), and intermediate oatgrass
(Danthonia intermedia), interspersed with forbs (e.g. northern bedstraw [Galium boreale],
common yarrow [Achillea millefolium]) and shrubs (e.g. rose [Rosa spp.], saskatoon
[Amelanchier alnifolia], snowberry [Symphoricarpos occidentalis]). In many cases, these
native grasslands include some proportion of invasive non‐native species such as
dandelion (Taraxacum officinale) and Kentucky bluegrass (Poa pratensis), often in areas
exhibiting heavy grazing pressure (Baker 2004).
3.0 MATERIALS AND METHODS Historical lek site locations (i.e. those identified prior to 2000) were compiled into a
database to be surveyed in 2004. Given the time constraints imposed by the short
lekking season, sites were subsequently prioritized for surveying. Priority sites were
determined based on proximity to native grasslands, grazing reserve leases, and the
4

positive attitudes of landowners. Site selection was stratified such that all regions in
the study area were represented in surveys. Approximately 15% of all historical leks
were not surveyed in 2004 due to time constraints or inaccessibility.
3.1 General sampling methods To maintain data consistency across years, the survey method in 2004 was modeled
closely after the method used by Broatch (2002a) in the Peace Region between 1996 and
2000. A total of 76 historical lek sites (sites that had been active during at least one year
between 1996 and 2000) and 10 new sites were surveyed in 2004. New lek sites were
reported by landowners and biologists to the ACA and their location and status was
subsequently verified by the methods described below.
Lek site surveys were initiated approximately one half hour before sunrise, and were
carried out until two and a half hours after sunrise. Trained observers approached sites
on foot to assess lek status (active or non‐active) and to count males and females in
attendance (Baydack 1986). Lek sites unattended by sharptails were inspected for a
period of 10 minutes for sign of activity (fresh feathers or scat and trampled vegetation)
to verify their status. If lek sites were determined to be non‐active, a transect‐based
survey commenced, whereby investigators walked along two transects (260m apart)
across the 0.64 km2 (one quarter‐section) area of land immediately surrounding the site
to identify potential locational shifts (Broatch 2002a). If time allowed, sites determined
to be non‐active at the first visit were revisited to confirm their status (n = 3). All
surveys occurred between 26 April and 27 May.
3.2 Land cover mapping Aerial photos (taken between 2000 and 2004) were used to classify land cover into
seven distinct types (Table 1) across a 0.64 km2 area and a 5.8 km2 area (i.e. one and nine
quarter sections) surrounding each historic and current lek site (modified from Broatch
2002a). The 5.8 km2 area is smaller than that recommended by Pepper (1972), however
it encompasses approximately 80% of the dispersal range for nesting females, which
typically occurs within an 8‐km2 area surrounding the lek site (Evans 1968, Pepper
1972, Klott and Lindzey 1990, Jones and Miller 1998, Manzer 2004). Each 5.8 km2
5

landscape was ground‐truthed by observers following lek surveys to record changes in
landuse (Appendix 1).
Table 1. Land cover types measured at each lek sites and their definition.
Land cover Definition
Cultivated Annual crops Shrubland Woody perennial plants < 6 m tall Native grass Grasslands dominated by native graminoid species Forest All trees > 6m, generally dominated by Aspen Hay Tame grass with no evidence of grazing activity Pasture Tame grass with evidence of grazing activity All native Includes shrubland, native grass, and forest
3.3 Statistical analyses 3.3.1 Habitat associations of sharptail leks
A subset of all the lek sites monitored (Appendix 2) was used to analyse the habitat
association of sharptail leks (n = 84). Many sites that were visited in 2004 were very
close together (as close as 100 m); consequently habitat mapping blocks overlapped. To
avoid pseudoreplication, one lek from each overlapping pair was removed from
analysis. I assumed in some cases that two sites in close proximity to each other
represented a geographic shift of a lek, or the occurrence of a satellite lek (Lumsden
1965, Cannon and Knopf 1981, Baydack 1986, Berger and Baydack 1992). When
possible, the most recently active lek site was retained in the dataset; the site
representing an old or transient (i.e. active for only one or few years) lek site was
removed. In instances where such a relationship could not be established, one lek site
was randomly removed from the dataset. All sites with two or fewer birds were
arbitrarily determined to be non‐active.
6

Within the subsets, leks were assigned a status of active (n = 38) or non‐active (n = 46)
and then ranked according to the proportion of each habitat type surrounding the lek at
0.64 km2 and 5.8 km2 scales. One‐tailed Mann‐Whitney U‐tests (Sokal and Rohlf 1981,
Zar 1999) were then used to compare active and non‐active leks by the proportion of
each associated habitat type. In many cases, more than one sample held the same value
(e.g. many leks were recorded as having 0 values for percent native cover). In these
instances, ranks were averaged such that tied values were ranked identically (e.g. three
tied values of 0 were all assigned a rank of (1+2+3)/3 = 2) following Siegel and Castellan
(1988).
Sharptails commonly nest in grasslands, shrubby areas and occasionally in tame
haylands, but rarely in cultivated land (Pepper 1972, Prose 1987, Gratson 1988, Manzer
2004). We therefore predicted that active lek sites in the Peace River region would more
likely be associated with lower proportions of cultivated land than non‐active lek sites
at both 0.64 km2 and 5.8 km2 scales (Table 2). All other land cover types were expected
to provide some of the habitat requirements for sharptails (e.g. for roosting, protection
against inclement weather, nesting, brooding and foraging) and hence were predicted
to be in greater abundance at active lek sites relative to non‐active lek sites.
7

Table 2. Alternate hypotheses (Ha) to test differences in the habitat associations of active and non‐active lek sites at 0.64‐km2 and 5.8‐km2 scales using a Mann Whitney U test.
Land cover Ha
Cultivated Active ≤ Nonactive
Shrubland Active ≥ Nonactive
Native Grass Active ≥ Nonactive
Forest Active ≥ Nonactive
Hay Active ≥ Nonactive
Pasture Active ≥ Nonactive
All Native Active ≥ Nonactive 3.3.2 Historical lek site activity
Using five years of sharptail survey data (1996 – 2000, 2004) the activity of leks across
years was examined to assess trends in the number of active leks across years. We
calculated the number of new active leks detected, the number of abandoned leks each
year, and the number of leks that were active in two consecutive years. As well, the
average number of birds attending leks each year was compared. 4.0 RESULTS
4.1 Land cover associated with active and non‐active lek sites At the 0.64 km2 scale the proportion of cultivated land was significantly different
(p = 0.04) between active and non‐active leks (Table 3). Similarly, the difference in
proportion of shrubland between the two lek sites was marginally significant (p = 0.05;
(Table 3). Cultivated land made up a larger proportion of the immediate area
surrounding non‐active lek sites (on average comprising 50% of the area) than active
sites (on average comprising 37% of the quarter‐section). The average proportion of
shrubland in the 0.64 km2 surrounding active leks was 7%, while around non‐active
8

leks the proportion of shrubland was only 4% (p < 0.05). The proportions of all other
land cover types at active and non‐active leks were not different (Table 3).
Table 3. Summary of results of Mann Whitney U tests quantifying differences in
habitat associated with active and non‐active leks at the 0.64‐km2 scale. Ha = alternative hypothesis.
Land cover Ha p
Cultivated Active ≤ Nonactive 0.04 Shrubland Active ≥ Nonactive 0.05 Native Grass Active ≥ Nonactive 0.12 Forest Active ≥ Nonactive 0.24 Hay Active ≥ Nonactive 0.68 Pasture Active ≥ Nonactive 0.36 All Native Active ≥ Nonactive 0.07
At the 5.8 km2 scale, the proportion of cultivated land, shrubland, and combined native
land (all native) were all significantly different between active and non‐active lek sites
(Table 4). On average, the proportion of cultivated land was lower at active lek sites
than at non‐active sites constituting up to 31% and 46% of total area in active and non‐
active sites, respectively. Both shrublands (12% of the area surrounding active lek sites
and 8% of the area around non‐active leks) and combined native lands (all native) (35%
of the area around active leks and 30% of the area around non‐active lek) were more
abundant at active lek sites than at non‐active lek sites (Table 4).
9

Table 4. Summary of results of Mann Whitney U tests quantifying differences in habitat associated with active and non‐active leks at the 5.8‐km2. Ha = alternative hypothesis
Land cover Ha p
Cultivated Active ≤ Nonactive 0.03 Shrubland Active ≥ Nonactive 0.00 Native Grass Active ≥ Nonactive 0.43 Forest Active ≥ Nonactive 0.24 Hay Active ≥ Nonactive 0.10 Pasture Active ≥ Nonactive 0.19 All Native Active ≥ Nonactive 0.03
4.2 Historical lek activity and population trends
Lek activity was highly variable across survey years (Table 5). In 2004, 76 historical
sites and 10 newly discovered leks were visited. An additional 6 historical sites were
not visited due to time constraints. Of the sites that were visited in 2004 (n = 86), 39
were active (29 historical, 10 new) (Table 5). Because surveys were not conducted
between 2001 and 2003, population dynamics leading to the abandonment of 34 leks
active in 2000 are unknown. It is likely that some of the new leks discovered in 2004 are
merely historical leks that have shifted over time. However, given the information gap
between 2001 and 2003, this cannot be verified.
Lek surveys ran in consecutive years between 1996 and 2000. During this period, lek
abandonment occurred at a rate of approximately 25.7% (95% C.I. = 3.1 – 48.3%;
Table 5). By modelling this rate of abandonment between 2001 and 2004 (for which
actual active lek numbers are unknown), we expected to find approximately 23 (95%
C.I. = 6 ‐ 67) leks out of the 65 active sites in 2000 to be still active in 2004. Despite
missing surveys on 6 historic leks, we found 29 leks to have remained active between
2000 and 2004, which tracks very closely to what was modelled, and is well within the
95% confidence limits.
10

Table 5. Historical trends in characteristics of numbers of active sharptail lek,
percent changes in number of leks between years and number of birds per lek per year.
Characteristics 1996 1997 1998 1999 2000 2004
Number of new leks located 16 21 22 19 17 10
Number of leks abandoned ‐ 2 5 17 9 34
Number of historical leks still active (Percentage of historical leks)
‐ 14
(87.5)30
(85.7)36
(61.0) 18
(63.2)29
(38.2)
Average number of birds/lek 8.9 8.8 9.2 9.2 10.6 11.8
Maximum number of birds/lek 17 20 22 31 30 27
Total number of active leks 16 35 52 55 65 39
Total number of leks surveyed 16 37 59 78 93 86
5.0 DISCUSSION AND RECOMMENDATIONS 5.1 Habitat associations of sharptail leks
At both the 0.64‐km2 and 5.8‐km2 scales, active sharptail leks were associated with
higher proportions of native land cover (shrublands and all native cover types
combined) and showed avoidance of areas with higher proportions of cultivation.
While the immediate surroundings of a lek are assumed to be selected for their
visibility, (e.g. local topographic high points), males may select lek sites with
surrounding areas (radius of approximately 1.6 km) that have high quality nesting and
brooding habitat, and may in turn attract more female sharptails (Evans 1968, Pepper
1972, Neimuth and Boyce 2004). Cultivated land, consisting of bare ground and sparse
vegetation offers very little nesting cover, however stubble left over in the spring (when
leks begin to form) can make for excellent lekking grounds with high visibility (Pepper
1972, Wiley 1974, Baydack 1986, Gratson 1988). Although most active leks in the Peace
Region are located directly in cultivated fields or tame haylands, the surrounding area
was more likely to include a higher proportion of forest, shrubs, and grassland (all
11

significantly higher presence of shrublands at the 5.8 km2 scale. These results support
work in other areas where sharptails nest and brood their young in grass and shrub
(Pepper 1972, Moyles 1981, Klott and Lindzey 1990, Manzer 2004).
Ungrazed or moderately grazed grassland and shrubland may provide important cover
for sharptails and other ground nesting birds’ nest and young, concealing them from
avian and mammalian predators (Baydack 1986, Aldridge and Brigham 2002, Manzer
2004). Fragmentation and loss of this habitat through agricultural conversion can have
negative influences on the nesting success and survival of ground nesting birds (Kurki
et al. 2000). Manzer (2004) found that in southern Alberta, as the proportion of crop
surrounding nest sites increased, nesting success declined. Also, survival of female
sharptails was higher in landscapes where crops make up less than 35% of the cover.
The importance of shrubby habitat and tall grass for protective cover is evident in
Baydack (1988), where both male and female sharptails flushed to shrubby areas,
perches or dense grass when leks are disturbed. Furthermore, shrubs offer an
important food source for sharptails, which routinely feed on the berries and buds of
rose, chokecherry (Prunus virginianuea), buffalo berry (Shepherdia argentea), sumach
(Rhus spp.), and western snowberry (Mitchell and Riegert 1994, Prose 1987).
5.2 Historical lek activity and population trends
During the 9‐year period over which leks were monitored, there was an annual decline
of about 26% of leks per year. However, each year new leks were located; some in close
proximity to old lek locations. This supports previous observations of leks moving
across the landscape between years (Lumsden 1965, Cannon and Knopf 1981, Baydack
1988, Berger and Baydack 1992). The average number of birds attending leks remained
stable across the 9‐year period, however given the uncertainty regarding shifts in lek
sites in combination with abandonment of historic sites and formation of new leks, the
overall population trend remains unclear. Sharptail leks were not randomly
encountered, and no systematic searching of the landscape for leks was performed in
any year, resulting in inconsistent search effort over years. Given these inconsistencies,
it is very difficult to determine real changes in the population over time. Consistent
survey protocols (see recommendations below) are required to collect the information
necessary to get a more accurate assessment of population trends over time.
12

5.3 Recommendations for future monitoring and stewardship activities
In most cases landowners who participated in the ACA survey for sharptails expressed
interest in the fate of this species. Given the typically positive response to survey
efforts, stewardship opportunities to address sharp tailed grouse habitat concerns could
prove very successful in the Peace Region.
To most effectively implement a sharptail stewardship program a number of research
and monitoring questions need to be addressed. These issues are laid out below:
1. Sharptail nesting habitat in the Peace Region. Currently, there is little information
regarding the nesting habitat of sharptails in this region or similar highly modified
landscapes. Where native grasslands are abundant (e.g. parts of southern Alberta and
the great plains of the United States) sharptails nest extensively in native grassland
habitat (Aldrich 1963, Moyles 1981, Manzer 2004). In parts of Saskatchewan where
native grassland is sparse, sharptails make use of hayland, pasture and even cropland
for nesting (Pepper 1972). In the Peace Region it is unlikely that sharptails use native
grass exclusively for nesting, given its rarity across the landscape (less than 2000 ha of
upland native grassland; Baker 2004), though this habitat may be used
disproportionately to its availability. The extent of sharptail’s use of haylands and
pastures is unknown. However, anecdotal evidence from our study shows that active
sharptail leks are associated with shrub habitat at both the 0.64‐km2 scale (generally
selected for lekking and visibility) and the 5.8‐km2 scale (for nesting and brooding)
(Evans 1968). Therefore, shrublands may be important habitat for sharptails in the
Peace Region. Research on the nesting habitat and success of sharptails in this region is
required to adequately provide landowners and wildlife managers with useful
information concerning enhancement and preservation of sharptail habitat.
2. Long‐term trendblock monitoring. The large expanse of the Peace Region, it’s
primarily privately‐owned land base, and the low density of sharptails across the
landscape make the survey of the entire area for active leks extremely difficult. The
current practice of revisiting known lek sites is further impaired by the tendency of leks
to shift or become abandoned, making the identification of individual leks extremely
13

difficult and arbitrary. It is possible that some lek sites may continue to exist at some
distance from the original site, but are missed by observers checking historical or
previous years’ locations. As evidenced by this study, approximately 26% of leks are
abandoned each year. Given these concerns it is recommended that a trendblock
approach to monitoring be employed, whereby permanent monitoring plots are laid
out and are systematically surveyed on a regular basis (Scobie 2002). Long‐term
monitoring of permanent plots can provide the information necessary to assess
population trends over time (Shyry 1999). Trendblock monitoring protocols have been
used for monitoring burrowing owl (Athene cunicularia) populations in southern
Alberta, and are considered an important index of population trends for this species
(Scobie 2002). This approach may be useful in assessing long‐term sharptail population
trends due to the relative ease of finding the large and noisy lek sites from roadsides or
ground surveys. Lek sites near roads are generally easily identified (presence/absence)
and landowner permission may not be necessary in many cases. However, securing
long‐term access to private land may also allow the ACA to compare the effectiveness
of stewardship activities to land with no management intervention.
This trendblock approach has been used in southern Alberta for locating sharptails
with some success (Dube 2003). These trendblocks are 61.5 km2 (8 sections × 3 sections,
or 6 sections × 6 sections) and can be surveyed systematically for sharptail leks on an
annual or biannual basis. Helicopters were employed in early spring when there was
still snow on the ground to locate possible lek sites, determined by disturbed snow or
black patches on top of knolls or hills (Dube 2003). These suspected lek sites were then
visited on foot or by ATV to determine lek status and count the number of individuals
at the lek site. Once leks are established in the spring, when sharptail males are actively
displaying, leks are generally insensitive to disturbances such as automobiles, human
presence, or other loud noises. Even when leks are approached directly by observers or
leashed dogs, sharptail males will return to their lek territory within one to 15 minutes
(Moyles 1981, Baydack 1986). However, leks can be abandoned due to disturbances,
especially early in the season (Gratson 1988), so it is recommended that at this sensitive
time, leks be approached on foot no closer than 100 m.
On large expanses of privately owned lands in southern Alberta, ATVs were used to
access leks (Dube 2003). Transect lines were placed at 1 km intervals across the entire
14

trendblock and listening points were placed at 0.8 km intervals along the transect line.
Observers then rode ATVs between points, stopping for one minutes at each point to
record lek sites and count birds. While the noise associated with ATVs is not expected
to cause abandonment of lek sites (Gratson 1988), it is recommended that this approach
only be used in cases where walking surveys are impractical. Given the number of
landowners that would need to be contacted and the high prevalence of cultivated land
this technique may not be practical in the Peace Region. Walking transects may be
more effective (and landowners may be more open to this survey method), but this will
undoubtedly be more time consuming.
It is recommended that some combination of road surveys and on‐foot surveys be used
to locate lek sites within permanent sharptail monitoring blocks in the Peace Region. If
funding is available, aerial helicopter surveys of a single block (61.5 km2) could be
completed in one morning (Dube, L. Sr. Wildlife Technician, Alberta Sustainable
Development, Fish and Wildlife Division, pers. comm.) and follow up bird counts and
lek status monitoring could be conducted on foot.
15
6.0 LITERATURE CITED Achuff, P.L. 1994. Natural regions, subregions and natural history themes of Alberta:
A classification for protected areas management. Prepared for Alberta
Environmental Protection, Parks Services, Edmonton, Alberta. 72 pp.
Alberta Agriculture, Food and Rural Development. 2001. 1996 Agricultural Profile –
Peace Region. www.agric.gov.ab.ca.
Alberta Environmental Protection. 1997. The parkland natural region of Alberta:
Published report prepared for the Special Places 2000 Provincial Coordinating
Committee by the Alberta Environmental Protection, Natural Resources Service,
Recreation and Protected Areas Division, Edmonton, Alberta. 111 pp.
Aldrich, J.W. 1963. Geographical orientation of American tetraonidae. Journal of
Wildlife Management 27:529‐545.
Aldridge, C.L. and Brigham. 2002. Sage grouse nesting and brooding habitat in
southern Canada. Journal of Wildlife Management 66:433‐444.
Baker, A. 2004. Peace Native Grasslands Program, 2001‐2004. Unpublished
manuscript produced by Alberta Conservation Association, Peace River, Alberta,
Canada.
Baydack, R.P. 1986. Sharp‐tailed grouse response to lek disturbance in the Carberry
Hills of Manitoba. PhD. Thesis submitted to the Department of Fishery and
Wildlife Biology, Colorado State University, Fort Collins, Colorado. 83 pp.
Baydack, R.P. 1988. Characteristics of Sharp‐tailed grouse, Tympanuchus phasianellus,
leks in the parklands of Manitoba. Canadian Field‐Naturalist 102:39‐44.
Berger, R.P. and R.K. Baydack. 1992. Effects of aspen succession on Sharp‐tailed
grouse, Tympanuchus phasianellus, in the Interlake region of Manitoba.
Canadian Field‐Naturalist 106: 185‐191.
16
Broatch, C. 2002a. Sharp‐tailed grouse (Tymphanuchus phasianellus jamesi) lek
surveys: 5 year summary (1995 – 1999) Northwest Region. Report produced by
Alberta Conservation Association, Peace River, Alberta. 8 pp + app.
Broatch, C. 2002b. Sharp‐tailed grouse lek surveys: Landowner inquiry results – 2000.
Report produced by Alberta Conservation Association, Peace River, Alberta.
11 pp + app.
Cannon, R.W. and F.L. Knopf. 1981. Lek numbers as a trend index to prairie grouse
populations. Journal of Wildlife Management 45:776‐778.
Connelly, J.W., M.W. Gratson, and K.P. Reese. 1998. Sharp‐tailed grouse
Tympanuchus phasianellus). In A. Poole and F. Gill, eds. The Birds of North
America. No. 354. The Birds of North America, Inc., Philadelphia,
Pennsylvania. 20 pp.
Dube, L. 2003. Description and summary of sharp‐tailed grouse trend survey project
initiated by Sustainable Resource Development and Alberta Conservation
Association in the Milk River Ridge, Twin River and Writing‐on‐Stone areas.
Unpublished report. Alberta Sustainable Resource Development, Lethbridge,
Alberta. 9 pp.
Environment Canada. 2004. Terrestrial ecozones map, Peace lowland ecoregion.
Environment Canada, Ottawa, Ontario.
http://www.ecoinfo.ec.gc.ca/ecozones/ecozones.cfm
Evans, K.E. 1968. Characteristics and habitat requirements of the greater prairie
chicken and sharp‐tailed grouse – A review of the literature. Conservation
Research Report No 12. U.S. Department of Agriculture, Fort Collins, Colorado,
USA. 32 pp.
Goddard, R.K. 1995. Buck for wildlife proposal outlining two program areas as
recommended by the Wildlife Management Advisory Committee. Alberta
17

Environmental Protection, Natural Resource Services – Buck for Wildlife.
Lethbridge, Alberta. 40 pp.
Gratson, M.W. 1988. Spatial patterns, movements and cover selection by Sharp‐tailed
grouse. Pages 158 – 192. In: A. T. Bergerud and M.W. Gratson. Adaptive
strategies and population ecology of northern grouse. University of Minnesota
Press, Minneapolis, Minnesota.
Jones, P. and B. Miller. 1998. Sharp‐tailed grouse dancing ground surveys in southern
and central Alberta 1997 – 1998. Report produced by Alberta Conservation
Association, Lethbridge, Alberta.
Klott, J.H. and F.G. Lindzey. 1990. Brood habitats of sympatric sage grouse and
Columbian sharp‐tailed grouse in Wyoming. Journal of Wildlife Management
54: 84‐88.
Kurki, S., A. Nikula, P. Helle, and H. Lindén. 2000. Landscape fragmentation and
forest composition effects on grouse breeding success in boreal forests. Ecology
81:1985‐1997.
Lumsden, H.G. 1965. Displays of the sharp‐tailed grouse. Ontario Department of
Lands and Forests. Technical Series Research Report 66. Toronto, Ontario.
68 pp.
Manzer, D. L. 2004. Sharp‐tailed grouse breeding success, survival, and site selection
in relation to habitat measured at multiple scales. PhD. thesis submitted to the
Department of Biological Sciences, University of Alberta, Edmonton, Alberta.
151 pp.
McDonald, M.W., and Reese, K.P. 1998. Landscape changes within the historical
distribution of Columbian Sharp‐tailed Grouse in Eastern Washington: Is there
hope? Northwest Science 72: 34‐41.
18

Mitchell, G.J. and P.W. Riegert. 1994. Sharp‐tailed grouse, Typmanuchus phasianellus,
and grasshoppers: food is where you find it. Canadian Field‐Naturalist 108:288‐
291.
Moyles, D.L.J. 1981. Seasonal and daily use of plant communities by sharp‐tailed
grouse (Pedioecetes phasianellus) in the parklands of Alberta. Canadian Field‐
Naturalist 95:287‐291.
Neimuth, N.D. and M.S. Boyce. 2004. Influence of landscape composition on sharp‐
tailed grouse lek location and attendance in Wisconsin pine barrens. Ecoscience.
11:209‐217.
Pepper, G.W. 1972. The ecology of Sharp‐tailed Grouse during spring and summer in
the aspen parkland of Saskatchewan. Saskatchewan Department of Natural
Resources, Wildlife Report Number 1. Saskatoon, Saskatchewan. 56 pp.
Prose, B.L. 1987. Habitat suitability index models: plains Sharp‐tailed grouse.
Biological report number 82(10.142). Published by United States Department of
Interior, Fish and Wildlife Service, Fort Collins, Colorado. 31 pp.
Public Lands. 2004. Green/White Zone. Alberta Public Lands, Edmonton, Alberta.
http://www3.gov.ab.ca/srd/land.
Ritcey, R. 1995. Status of the Sharp‐tailed grouse – columbianus subspecies – in British
Columbia. B.C. Ministry of Environment, Lands and Parks, Wildlife Branch,
Victoria, British Columbia, Wildlife Working Report Number WR. 70 pp.
Schneider, R. R. 2002. Alternative futures: Alberta’s boreal forests at the crossroads.
The Federation of Alberta Naturalists and the Alberta Centre for Boreal
Research. Edmonton. Alberta, Canada. 152 pp.
Scobie, D. 2002. 2001 burrowing owl trend block survey and monitoring, Brooks and
Hanna areas. Alberta Sustainable Resource Development, Fish and Wildlife
Division, Alberta Species at Risk Report No. 51. Edmonton, Alberta. 12 pp.
19

Shyry, D. T. 1999. A summary report on burrowing owl (Athene cunicularia)
population trend surveys in southern Alberta: 1991 – 1998. Alberta
Environment, Wildlife Management Division, Occasional Paper, Alberta
Natural Resources Service, Edmonton, Alberta. 16 pp.
Siegel, S and N.J. Jr. Castellan. 1988. Non‐parametric Statistics for the Behavioural
Sciences (2nd Edition). McGraw‐Hill, New York. 752 pp.
Sisson, L. 1976. The sharp‐tailed grouse in Nebraska. Nebraska Game and Parks
Commission. Lincoln, Nebraska. 88 pp.
Sokal R.R. and F.J. Rohlf. 1981. Biometry: the principals and practice of statistics in
biological research. W.H. Freeman and Company, San Francisco, California.
859 pp.
Statistics Canada. 2001. Census of Agriculture Table 9.1: Farm land area classified by
use of land 2001. www1.agric.gov.ab.ca. Prepared by Statistics and Data
Development Unit, Alberta Agriculture, Food and Rural Development,
Edmonton, Alberta.
Strong, W.L and K.R. Leggat. 1992. Ecoregions of Alberta. Alberta Forestry, Lands
and Wildlife, Edmonton, Alberta. 55 pp + app.
Wiley, R.H. Jr. 1974. Evolution of social organization and life history patterns among
grouse. Quarterly Review of Biology 49:201‐227.
Zar, J.H. 1999. Biostatistical analysis. Prentice Hall, Upper Saddle River, New Jersey.
663 pp + app.
20
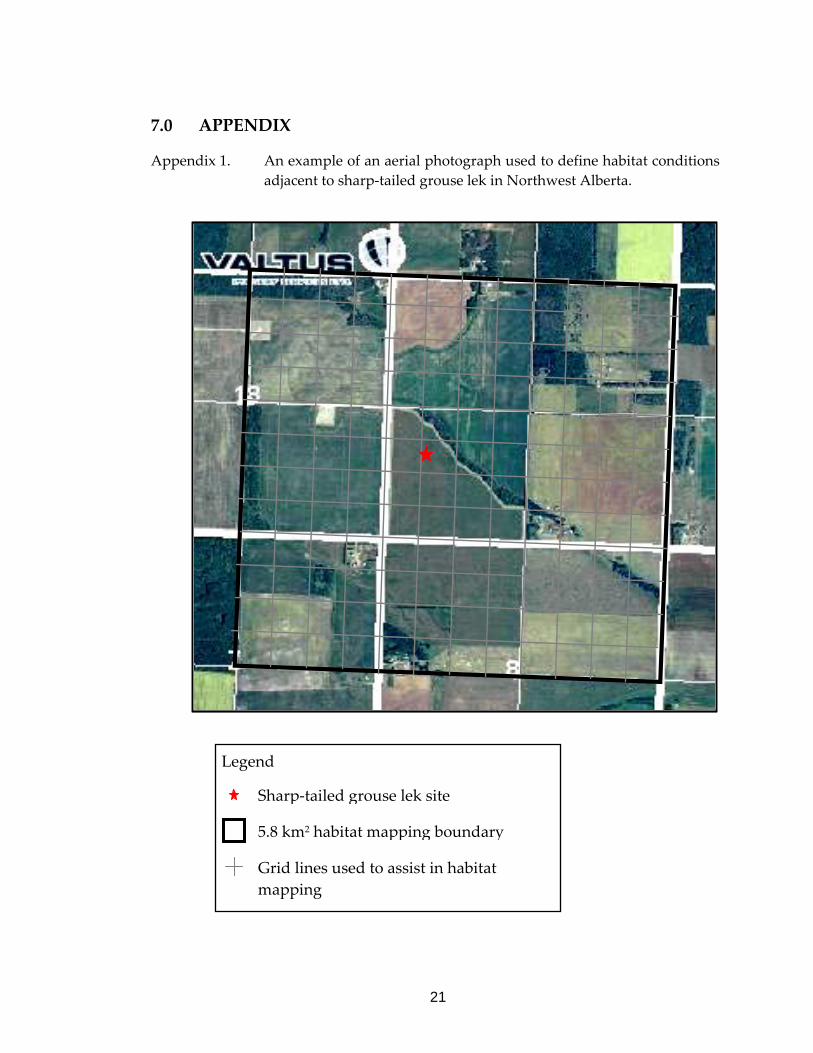
7.0 APPENDIX
Appendix 1. An example of an aerial photograph used to define habitat conditions adjacent to sharp‐tailed grouse lek in Northwest Alberta.
Legend
Sharp‐tailed grouse lek site
5.8 km2 habitat mapping boundary
Grid lines used to assist in habitat mapping
21
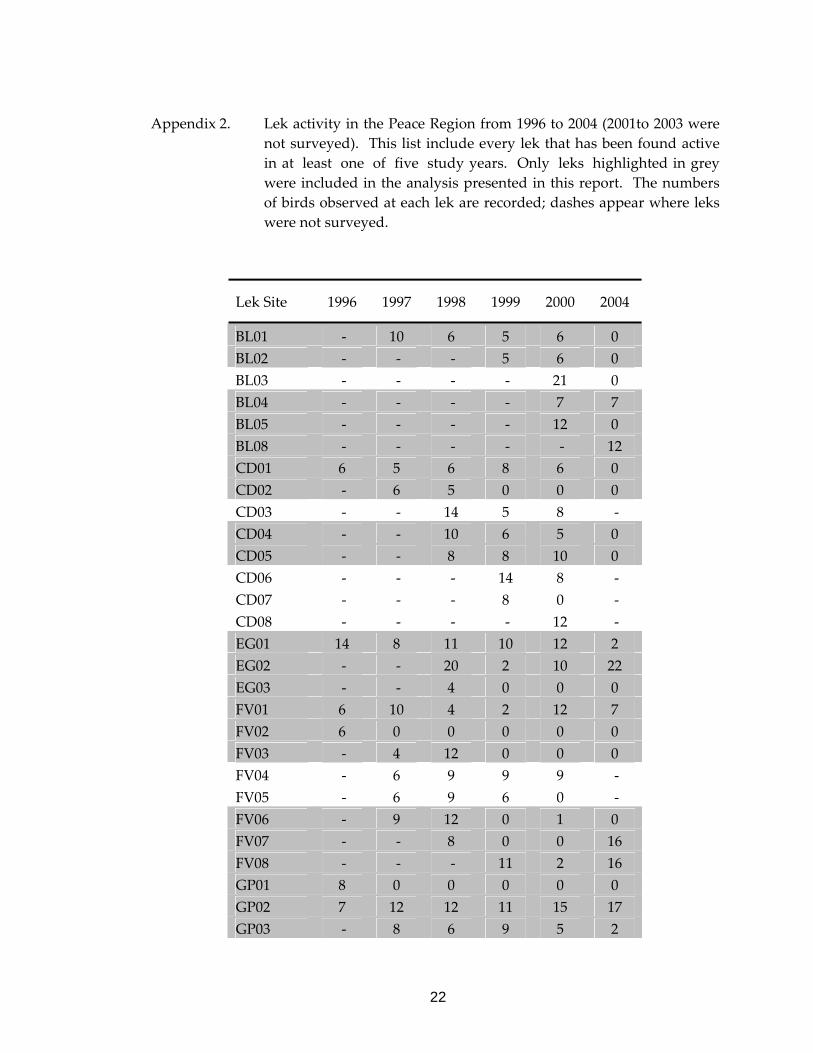
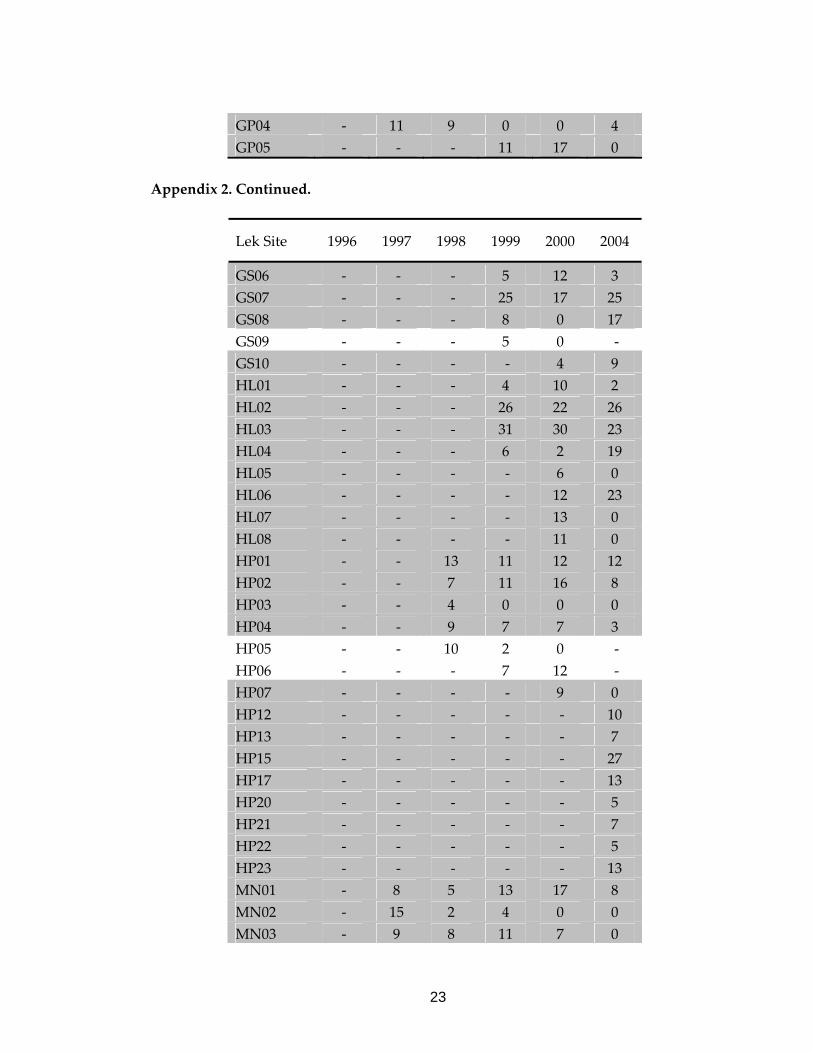
Appendix 2. Lek activity in the Peace Region from 1996 to 2004 (2001to 2003 were not surveyed). This list include every lek that has been found active in at least one of five study years. Only leks highlighted in grey were included in the analysis presented in this report. The numbers of birds observed at each lek are recorded; dashes appear where leks were not surveyed.
Lek Site 1996 1997 1998 1999 2000 2004
BL01 ‐ 10 6 5 6 0 BL02 ‐ ‐ ‐ 5 6 0 BL03 ‐ ‐ ‐ ‐ 21 0 BL04 ‐ ‐ ‐ ‐ 7 7 BL05 ‐ ‐ ‐ ‐ 12 0 BL08 ‐ ‐ ‐ ‐ ‐ 12 CD01 6 5 6 8 6 0 CD02 ‐ 6 5 0 0 0 CD03 ‐ ‐ 14 5 8 ‐ CD04 ‐ ‐ 10 6 5 0 CD05 ‐ ‐ 8 8 10 0 CD06 ‐ ‐ ‐ 14 8 ‐ CD07 ‐ ‐ ‐ 8 0 ‐ CD08 ‐ ‐ ‐ ‐ 12 ‐ EG01 14 8 11 10 12 2 EG02 ‐ ‐ 20 2 10 22 EG03 ‐ ‐ 4 0 0 0 FV01 6 10 4 2 12 7 FV02 6 0 0 0 0 0 FV03 ‐ 4 12 0 0 0 FV04 ‐ 6 9 9 9 ‐ FV05 ‐ 6 9 6 0 ‐ FV06 ‐ 9 12 0 1 0 FV07 ‐ ‐ 8 0 0 16 FV08 ‐ ‐ ‐ 11 2 16 GP01 8 0 0 0 0 0 GP02 7 12 12 11 15 17 GP03 ‐ 8 6 9 5 2
22
GP04 ‐ 11 9 0 0 4 GP05 ‐ ‐ ‐ 11 17 0
Appendix 2. Continued.
Lek Site 1996 1997 1998 1999 2000 2004
GS06 ‐ ‐ ‐ 5 12 3 GS07 ‐ ‐ ‐ 25 17 25 GS08 ‐ ‐ ‐ 8 0 17 GS09 ‐ ‐ ‐ 5 0 ‐ GS10 ‐ ‐ ‐ ‐ 4 9 HL01 ‐ ‐ ‐ 4 10 2 HL02 ‐ ‐ ‐ 26 22 26 HL03 ‐ ‐ ‐ 31 30 23 HL04 ‐ ‐ ‐ 6 2 19 HL05 ‐ ‐ ‐ ‐ 6 0 HL06 ‐ ‐ ‐ ‐ 12 23 HL07 ‐ ‐ ‐ ‐ 13 0 HL08 ‐ ‐ ‐ ‐ 11 0 HP01 ‐ ‐ 13 11 12 12 HP02 ‐ ‐ 7 11 16 8 HP03 ‐ ‐ 4 0 0 0 HP04 ‐ ‐ 9 7 7 3 HP05 ‐ ‐ 10 2 0 ‐ HP06 ‐ ‐ ‐ 7 12 ‐ HP07 ‐ ‐ ‐ ‐ 9 0 HP12 ‐ ‐ ‐ ‐ ‐ 10 HP13 ‐ ‐ ‐ ‐ ‐ 7 HP15 ‐ ‐ ‐ ‐ ‐ 27 HP17 ‐ ‐ ‐ ‐ ‐ 13 HP20 ‐ ‐ ‐ ‐ ‐ 5 HP21 ‐ ‐ ‐ ‐ ‐ 7 HP22 ‐ ‐ ‐ ‐ ‐ 5 HP23 ‐ ‐ ‐ ‐ ‐ 13 MN01 ‐ 8 5 13 17 8 MN02 ‐ 15 2 4 0 0 MN03 ‐ 9 8 11 7 0
23

MN04 ‐ 12 22 17 18 14 MN05 ‐ ‐ 17 5 12 0
Appendix 2. Continued.
Lek Site 1996 1997 1998 1999 2000 2004
MN06 ‐ ‐ 19 10 13 12 MN07 ‐ ‐ 8 9 5 11 MN08 ‐ ‐ 22 14 17 0 MN09 ‐ ‐ ‐ 4 9 0 MN10 ‐ ‐ ‐ ‐ 16 5 MN11 ‐ ‐ ‐ ‐ 15 0 PR01 17 17 7 0 0 5 PR02 ‐ 9 5 10 8 6 PR03 ‐ 3 0 0 0 0 PR04 ‐ 8 11 8 11 0 PR05 ‐ ‐ 8 6 9 0 PR06 ‐ ‐ 14 12 11 ‐ PR07 ‐ ‐ 11 0 0 ‐ PR08 ‐ ‐ ‐ 7 2 3 PR09 ‐ ‐ ‐ 14 0 ‐ PR10 ‐ ‐ ‐ 17 12 6 PR11 ‐ ‐ ‐ ‐ 5 0 PR12 ‐ ‐ ‐ ‐ 16 12 SR01 6 6 13 6 3 0 SR02 8 5 5 0 8 0 SR03 11 11 7 13 13 0 SV01 12 15 3 10 0 0 SV02 9 16 10 10 9 0 SV03 ‐ 11 6 0 0 8 SV04 ‐ ‐ 3 0 0 0 SV05 ‐ ‐ 6 0 0 0 SV06 ‐ ‐ ‐ 11 16 0 SV07 ‐ ‐ ‐ ‐ 5 0 VV01 5 5 5 0 0 ‐ VV02 ‐ 4 0 0 0 ‐ Total Birds 131 293 449 502 691 461
24

CONSERVATIONCONSERVATIONREPORT REPORT SERIESSERIES

The Alberta Conservation Association acknowledges the following partner for their generous support of
this project