use and dissemination of this working paper is encouraged
TRANSCRIPT

An empirical analysis on expanding rice production in Sub Sahara Africa
An Inquiry into the Process of Upgrading Rice Milling Service:
The Case of Mwea Irrigation Scheme in Kenya
Yukichi Mano, Timothy Njagi Njeru and Keijiro Otsuka
No. 220
March 2021
JICA Ogata Sadako Research Institute
for Peace and Development
JICA Ogata Research Institute Working Paper

Use and dissemination of this working paper is encouraged; however, the JICA Ogata
Sadako Research Institute for Peace and Development requests due acknowledgement
and a copy of any publication for which this working paper has provided input. The views
expressed in this paper are those of the author(s) and do not necessarily represent the
official positions of either the JICA Ogata Sadako Research Institute for Peace and
Development or JICA.
JICA Ogata Sadako Research Institute for Peace and Development
10-5 Ichigaya Honmura-cho
Shinjuku-ku
Tokyo 162-8433 JAPAN
TEL: +81-3-3269-3374
FAX: +81-3-3269-2054

1
An Inquiry into the Process of Upgrading Rice Milling Service:
The Case of Mwea Irrigation Scheme in Kenya*
Yukichi Mano†, Timothy Njagi Njeru‡, Keijiro Otsuka§
Abstract
Countries in sub-Sahara Africa (SSA) heavily rely on rice imported from Asia, partly because of
rapidly increasing rice demand and partly because of consumers’ preference for high-quality
Asian rice. A few entrepreneurial rice millers in Kenya adopted large-scale improved milling
machines, including the component called destoners, around 2010, which they learned from
China. Later, smaller-sized improved machines were introduced and more widely adopted.
These adopters successfully improved the quality of milled rice, which can compete with
imported rice, and their business performance. In contrast, many other millers without adopting
improved machines were forced to reduce their business or exit the industry.
Keywords: rice quality, rice milling, destoner, Kenya, sub-Sahara Africa
* This paper is a result of a research project being conducted at Japan International Cooperation Agency
– Ogata Sadako Research Institute for Peace and Development (JICA Ogata Research Institute), entitled
"An empirical analysis on expanding rice production in Sub Sahara Africa." The authors are deeply
indebted to Etsuko Masuko and Sachiko Mitsumori of JICA Ogata Research Institute for supporting the
research project. They also thank Takeshi Sakurai, Kazushi Takahashi, Yuko Nakano, Koji Makino and
Kei Kajisa for their valuable comments on earlier versions of this paper. We are grateful for the financial
support of JICA Ogata Research Institute, Grant-in-Aid for Scientific Research on Innovative
Areas-25101001 and Grant-in-Aid for Scientific Research (A)-17H00986. The authors remain solely
responsible for the contents of this paper. † Hitotsubashi University ([email protected]) ‡ Tegemeo Institute of Agricultural Policy and Development, Egerton University ([email protected]) § Kobe University ([email protected])
2
1. Introduction
Countries in sub-Sahara Africa (SSA) have made serious efforts to increase domestic staple food
production to improve food security and facilitate poverty reduction, especially after the
2007-08 food crisis. Meanwhile, rice is found to be a particularly promising crop to increase
food production in SSA (Otsuka and Larson 2012, 2016; CARD, 2019; Otsuka, 2019). In fact,
the annual growth rate of rice production was as high as 6.8 % between 2009 and 2019 (Soullier
et al., 2020). However, rice import is estimated to be increasing more rapidly at 7.8 % per annum,
and around one-third of rice consumed in SSA is still imported from Asia, with varying degrees
in various countries ranging from 10% to 93% (Mendez del Villar and Lançon, 2015; Saito et al.,
2015; FAO, 2018).
Population growth, urbanization, and increasing income raise rice consumption, and,
importantly, urban consumers generally prefer high-quality imported Asian rice over domestic
rice (Diako et al. 2010; Futakuchi et al. 2013; Demont et al. 2017; Ibrahim et al. 2020). Among
many factors affecting grain quality such as varieties, cultivation, harvesting, threshing, and
storage technologies (Futakuchi, et al., 2013), it is commonly argued that the use of
inappropriate milling machines is a major reason why domestic milled rice cannot compete with
imported rice from Asia (Fiamore, et al., 2017; Ragasa, et al., 2020). Research based on a
framed field experiment demonstrates that urban consumers are more willing to purchase rice
with high levels of cleanliness and low breakage rates of grains (Demont and Ndour, 2015;
Demont et al., 2017), which suggests the importance of appropriate rice milling. Importantly,
case studies by Tokida et al. (2014) and Kapalata and Sakurai (2020) reveal that the adoption of
destoners and other improved milling machines allows rice millers to charge higher milling fees
and increases their profitability in Uganda and Tanzania, respectively. However, the evidence is
still limited whether improved milling technologies enables domestic rice to compete with
imported rice.
3
This paper studies the development process of rice milling cluster in the largest rice
production area in Kenya, called the Mwea irrigation scheme, which is situated 90 km northeast
of Nairobi, with 8,500 hectares of irrigated paddy area, growing primarily improved Basmati
rice,1 and achieving rice yield of 6.2 tons per hectare with two crop cycles (Njeru et al. 2016;
Kikuchi, et al., 2021). Some of these rice millers have gradually adopted improved milling
machines over the past 10 years,2 and the rice milled by these millers is of higher quality and
successfully competes with imported rice from Asia in urban markets, including Nairobi, the
capital of Kenya. We observed supermarkets in Nairobi selling the improved Basmati rice from
Mwea at 140 to 200 Kshs per kg, compared with Pakistani long grain at 100 to 120 Kshs per kg
as of 11 December 2018.3 These observations indicate that African rice can compete with Asian
rice if improved milling machines are introduced to SSA.
We collected the primary data of the commercial millers operating in Mwea in 2011,
2016, 2018, and 2019 to analyze the adoption process of destoners and other improved milling
technologies and their effects on the quality of milling service, the business performance, and the
survival rate in the market. Because destoners and other improved devices used to be
components of mainly large-scale multi-stage milling machines, only 3 out of 82 sample millers
in 2011 and 15 out of 103 millers in 2016 were using destoners. But subsequently, small- and
medium-scale multi-stage milling machines with destoners became locally available, and 8 and
11 additional millers newly adopted destoners in 2018 and 2019, respectively. By contrast, many
millers without adopting improved technologies were forced to shrink their business or exit the
market. Using the doubly robust method and the endogenous switching regression to address the
endogeneity of destoner adoption, we find that the adoption of improved rice milling
1 Improved Basmati is cross-breed between Basmati and high-yielding modern varieties and widely
grown in India and Pakistan. It is lower quality but higher yielding than original Basmati rice. The only
small amount of other rice varieties is produced solely for farmers’ domestic consumption. 2 Improved milling machines have pre-cleaners, destoners, graders, and color sorters in addition to
de-huskers and polishers, the standard functions of traditional machines (see Appendix Table). 3 The Pakistani rice is not Basmati, but some type of long grain nonaromatic rice. According to our
informal interviews with local rice traders, some sellers blended Mwea rice with imported rice from
Pakistan, and they sold it as “Mwea rice.”

4
technologies is associated with higher milling fees, a greater amount of milled rice, and higher
profitability. Moreover, the millers using destoners are more likely to survive in the market.
These findings confirm the critical importance of improved rice milling technology in enhancing
the quality of African rice.
The rest of this paper is organized as follows. Section 2 explains the data and describes
the characteristics of sample rice millers in Mwea. Section 3 postulates the hypotheses and
explains the empirical strategy, and Section 4 describes the estimation results. Section 5
concludes the paper.
2. Millers in Mwea
Figure 1 presents changes in rice consumption, production, imports, and paddy price in Kenya
from 2010 to 2019. After the 2007-2008 food crisis, the paddy price declined over time,
consistent with the decline in the world rice price (Kikuchi et al., 2021). While rice consumption
and imports almost doubled, rice production was stagnant during this period in Kenya. There
was a severe drought in 2016 and 2017 in the horn of Africa region, which may have depressed
rice production in the country over this period.
The Mwea Irrigation Scheme produces 80 to 88 % of domestic rice in Kenya (Samejima
et al., 2020), and we study the rice millers in Mwea to inquire into the development process of
the rice milling sector. We find that learning new technologies from overseas played a crucial
role in the development of rice milling. In what follows, we would like to discuss the history of
the development of the rice milling industry and explain our primary data collection in Mwea.
2.1 Brief history
In the Mwea Irrigation Scheme, the history of modern rice milling dates back to 1967 when a
public rice miller, Mwea Rice Mill Ltd. (MRM), which had a monopoly right for rice milling

5
service, began operating four lines of large multi-stage milling machine imported from Germany.
In 1999 the rice sector was liberalized, and MRM started competing with other millers for
milling service. In early periods, operators of multi-stage milling machines received
on-the-job-training at MRM, and some moved to other millers later.
In 2000, Mwea Rice Growers Multipurpose Cooperative Society Ltd. (MRGM)
purchased a large Chinese multi-stage milling machine without a destoner because they did not
realize its importance as they bought the machine from a broker in Nairobi without visiting
China. In 2007, a private miller, Mwega, purchased a second-hand small-sized multi-stage
milling machine with destoners. But this installation did not influence other millers, probably
because Mwega was a small miller at that time.
A significant event occurred in 2010 when the chairman and two workers of MRGM
went to China to learn new milling technologies and purchased a new multi-stage milling
machine. Notably, the new machine this time was equipped with a destoner, which improved the
quality of milled rice by removing small stones and other impurities. In the following period,
some owners of millers who had expertise in rice marketing or accumulated wealth through
other business activities also started inquiring into new rice milling technologies by visiting
machine suppliers in China. As a result, a little over 10 private millers and MRM installed large
multi-stage milling machines in the first half of the 2010s. Aside from visiting China, these
owners employed experienced operators, especially from MRM and MRGM.
Because small- or medium-sized multi-stage milling machines were locally introduced
from China in the late 2010s and the importance of destoners became widely recognized in the
milling cluster, other millers, particularly those highly educated, also adopted destoners. By
contrast, the other millers either reduced their business while using traditional types of milling
machines without de-stoners (so-called “Jets” and “fridges”) or exited the market.

6
2.2 Data
We visited the Mwea Irrigation Scheme in 2011, 2017, and 2020 to interview the commercial
rice millers. As in other rice millers in SSA, their task is primarily to provide milling service for
farmers and traders, rather than purchasing paddy and selling milled rice to the markets. Because
December and January are the main season of rice harvesting and milling in Mwea, our survey
mainly focused on rice millers' characteristics and performance in January 2011, December 2016,
December 2018, and December 2019.
There was no official list of rice millers during our survey in 2011 and 2017, and the
coverage of the survey gradually expanded over the rounds as we discovered millers operating in
this area. In 2011, we visited the millers in Mwea town (locally known as Wanguru or
Ngurubani), stretching over 5 km along the Embu-Nairobi highway, connecting Mwea and
Nairobi in about 1.5 hours, and in Kandongu town, which is about 4 km off the Embu-Nairobi
highway. In 2017, we maintained this strategy, but we also visited other additional mills deemed
commercial on a local rice extension officer's advice. The 2020 survey is the most
comprehensive, as we compared our list of rice millers with the list that we obtained from the
county government, which had also tried to construct a census of all rice millers in the county.
2.3 Descriptive statistics
Table 1 presents our sample millers' basic characteristics by the destoner adoption status,
representing improved rice milling technologies including pre-cleaners and graders (see
Appendix Table), as of December 2019. The survey coverage was expanded over time, and 62
and 45 millers were added in the 2017 and the 2019 surveys, respectively. The early adopters are
the millers that adopted improved machines by 2016, and three did so in 2011. The adoption
rates were 3.7% (or 3/82) and 14.6% (or 15/103) in 2011 and 2016, respectively. The late
adopters are the millers that adopted destoners and other improved devices after 2016. Because
of their adoption, the adoption rate increased to 26.1% (or 22/84) in 2018 and 34.7% (or 33/95)

7
in 2019. Many millers that did not adopt improved technologies exited the market: Between
2012 and 2016, 40 of 41 exited millers were non-adopters, while 52 of 53 exited millers between
2017 and 2019 did not have destoners and other improved devices.
The average year of the establishment was 2008.9, while the early and the late adopters
were established in 2005 and 2011 on average, respectively. The Embu-Nairobi highway was
constructed in 2007, and one-third of non-adopters and most adopters of improved machines
were located along the highway. The average age of main decision-makers was 50 years old, and
they were mostly male. Only 45 % of the non-adopters were high school graduates, whereas
almost all the decision-makers of adopters were high school graduates. Many decision-makers
of non-adopters were previously farmers, whereas those of adopters have work experience in
other businesses or formal jobs.
Table 2 presents the total milling capacity, the value of milling machines, and the
number of employees. Almost all the sample rice millers had only one milling machine.4 In
2011 when only three early adopters used destoners, the average milling capacity was similar
among three groups of rice millers.5 From 2011 to 2016, the average capacity of early adopters
increased significantly. In 2019, the non-adopters had a total milling capacity of 816 kg per hour,
using the traditional type of milling machine. The early adopters had large-sized multi-stage
milling machines, with a total milling capacity of 6196 kg per hour, and the late adopters
installed small- or medium-sized multi-stage milling machines, with an average milling capacity
of 3479 kg per hour.6
We also collected the milling machines' present value, measured by the
decision-maker’s willingness to pay (WTP) in 2016, 2018, and 2019 (Table 2). The non-adopters’
4 Only nine millers had two machines, and only one had three machines in 2019. 5 Although we visited MRM and MRGM in 2011, we did not formally interview them because their
technologies and business size seemed to be too distinct from other millers. We interviewed them in
2017 and 2019. 6 Appendix Table presents that the areas of workshop, storage, and yard were also largest for the early
adopters, which were followed by the late adopters, and the non-adopters had the smallest space. The
early adopters attract traders by offering their large storage space free of charge.

8
WTP of milling machines was 0.19 million Kshs in 2019,7 whereas the early adopters’ WTP and
the late adopters’ WTP were 13.0 million Kshs and 4.9 million Kshs, respectively. Furthermore,
the non-adopters employed only 0.5 worker on average, while the early adopters and the late
adopters employed 10 and 4 workers, respectively, in 2019 (Table 2).
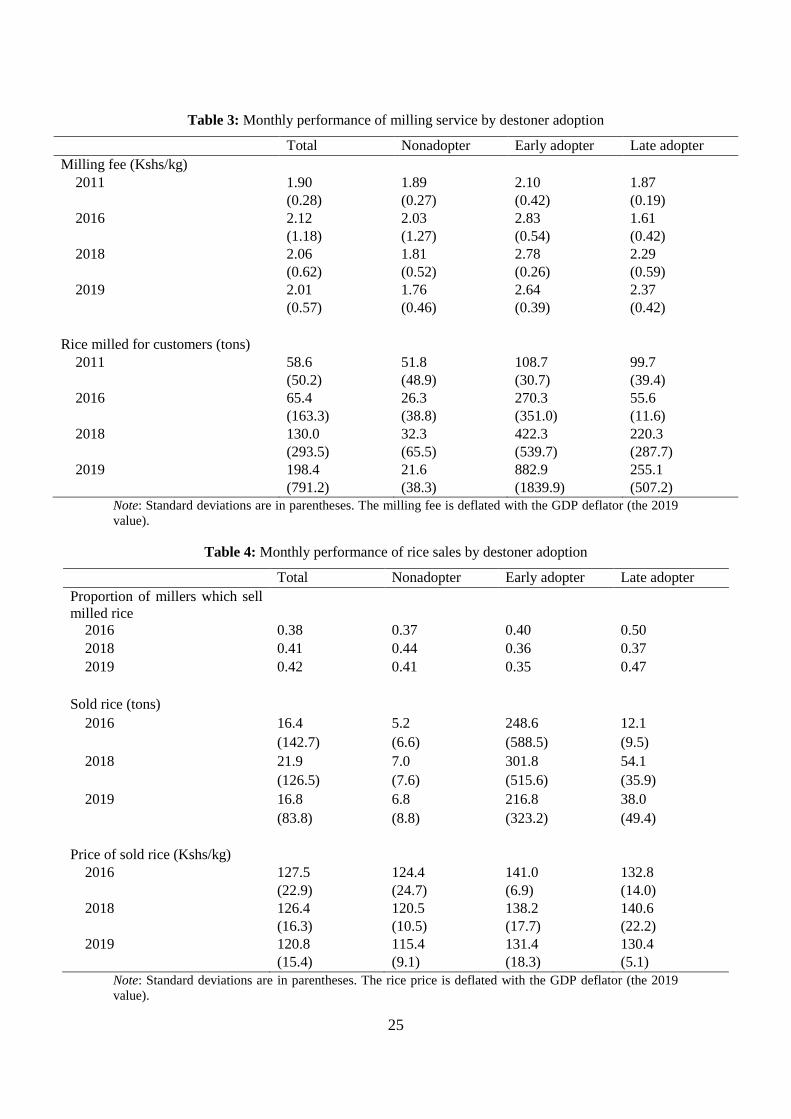
Table 3 presents the monthly milling performance of sample millers for January 2011,
December 2016, December 2018, and December 2019.8 The average milling fees, which are
expected to reflect the milling quality, of the early adopters and the late adopters were 2.64 Kshs
per kg and 2.37 Kshs per kg in 2019, respectively, which were substantially higher than the
milling fee of the non-adopters of 1.76 Kshs per kg. Over time, the non-adopters’ milling fee
increased from 1.89 Kshs per kg in 2011 to 2.03 Kshs per kg in 2016 but declined to 1.81 Kshs
per kg in 2018 and 1.76 Kshs per kg in 2019, which is likely to reflect decreased demand for
their milling service. The early adopters' milling fee increased more substantially from 2.10
Kshs per kg in 2011 to 2.83 Kshs per kg in 2016, when all of them adopted destoners. Similarly,
the late adopters' milling fee increased from 1.61 Kshs per kg in 2016 to 2.29 Kshs per kg in
2018 and 2.37 Kshs per kg in 2019. We do not know why the late adopters' milling fee was as
low as 1.61 Kshs per kg in 2016 when it was 2.03 Kshs per kg for the non-adopters. It may well
be that their strategy was to attract customers by reducing milling fees in the face of competition
with early adopters. As may be expected, in 2019, their average milling fee was slightly lower
than that of early adopters.
The non-adopters’ amount of rice milled for customers declined from 52 tons in 2011 to
26 tons in 2016 and 22 tons in 2019 (Table 3). By contrast, the early adopters’ amount of milled
rice increased from 109 tons in 2011 to 270 tons in 2016, when they adopted destoners, and
further to 422 tons in 2018 and 883 tons in 2019. The late adopters’ amount of milled rice also
7 In this paper, all the monetary values are deflated using the GDP deflator, and presented in the real
value of 2019. The average exchange rate in December 2019 was 101.5 Kshs to 1 USD. 8 Appendix Table presents the annual amount of rice sold in 2019. We believe that the monthly data we
use are more accurate than the annual data, because the recall period is shorter.

9
increased substantially from 56 tons in 2016 to 220 tons in 2018 and 255 tons in 2019, as they
increased destoner adoption. Figure 2 presents changes in the market share of the amount of
milled rice by these three groups. In 2011, the non-adopter group dominated the milling service
market with a market share of 80%, whereas the early adopter group rapidly increased its market
share to 62% in 2016. The late adopters had their market share at 8% and 5% in 2011 and 2016,
respectively, but their market share sharply increased to 27% in 2018 and 26% in 2019. The
non-adopters lost a significant market share to the improved technology adopters and had only
7% of the market share in 2019. The near demise of non-adopters strongly indicates that milling
machines with improved devices are profitable.
About 40 % of sample rice millers purchased paddy9 and sold milled rice to consumers,
supermarkets, and traders (Table 4). The proportion of millers that sold milled rice was similar
across the three groups, and it did not change over time. Although not reported in Table 4, a few
millers used brand names when they sold milled rice (e.g., four early adopters and three late
adopters in 2019). The non-adopters of destoners selling rice sold 5.2 tons in 2016, 7.0 tons in
2018, and 6.8 tons in 2019, whereas the early adopters selling rice sold 249 tons in 2016, 302
tons in 2018 and 217 tons in 2019. The amount of rice sold by the late adopters increased from
12 tons in 2016 to 54 tons in 2018 and 38 tons in 2019, which remain small compared to their
rice milled for customers. These observations suggest that some early adopters shifted their
business focus to selling rice, while the late adopters increased their share in the milling service.
The non-adopters’ price of sold rice declined from 124.4 Kshs per kg in 2016 to 120.5 Kshs per
kg in 2018 and 115.4 Kshs per kg in 2019, while the early adopters’ price of rice sold decreased
from 141.0 Kshs per kg in 2016 to 138.2 Kshs per kg in 2018 and 131.4 Kshs per kg in 2019. The
late adopters sold rice at 132.8 Kshs per kg in 2016. The price substantially increased to 140.6
9 There is no contract farming system for rice, and these millers do not provide farmers with credit.

10
Kshs per kg in 2018 and 130.4 Kshs per kg in 2019, which became comparable to the early
adopters’ rice price.10
We calculated the monthly capacity utilization rate to examine the milling productivity
per machine’s capacity operating for 200 hours per month (Table 5). 11 The non-adopters
reduced the capacity utilization rate over time from 0.60 in 2011 to 0.30 in 2016, 0.25 in 2018,
and 0.21 in 2019, which suggests the decreased demand for the non-adopters’ milling service.
The early adopters also reduced the capacity utilization rate from 1.33 in 2011 to 0.40 in 2016
when they initially adopted large-scale multi-stage milling machines but could not attract many
customers for milling service. However, the early adopters increased the capacity utilization rate
to 0.64 in 2018 and 1.36 in 2019 when they substantially increased the milling service, as
observed in Table 3. The late adopters initially had a high capacity utilization rate of 1.37 in 2011,
which dropped to 0.38 in 2016. Nevertheless, the late adopters maintained the capacity
utilization rate at 0.38 in 2018 and slightly increased it to 0.45 in 2019, unlike the declining
performance of the non-adopters. This monthly capacity utilization rate reflects the milling
performance in the main season. We also calculated the annual capacity utilization rate in 2019
(Appendix Table) and found that the non-adopters had 0.28 and the late adopters had 0.45,
comparable to their performance in the main season, whereas the early adopters had only 0.13.
This result suggests that the early adopters could not attract many customers and substantially
reduced their milling performance in the offseason, leaving their large-scale milling machines
idle.
10 Paddy quality is also important in determining the overall rice quality, and farm level agronomy
affects the quality of paddy, including levelling, fertilizer application, amount of water during crop
establishment and pest and disease control. Mechanical harvesting has also helped reduce the losses.
Traders determine the quality of paddy through observation and checking for moisture content. Many
traders have moisture meters and usually check for the moisture content at the time of purchasing. We
do not observe a significant difference in the minimum required moisture content across millers
(Appendix Table). They also observe the paddy grain to ensure that the pods are full, which is a sign of
good quality paddy. But there is no grading system or pricing differential on paddy quality. 11 The monthly capacity utilization rate is the total amount of milled rice and sold rice (tons per month)
divided by the milling capacity of machines for 200 hours of operation (tons per month).

11
The profit of the non-adopters was negative, -0.08 million Kshs in 2016, -0.05 million
Kshs in 2018, and -0.08 million Kshs in 2019 (Table 5).12 The early adopters' profit was far the
largest but declined from 11.5 million Kshs in 2016 to 10.3 million Kshs in 2018 and 2.84
million Kshs in 2019 (Table 5). By contrast, the late adopters' profit substantially increased from
0.03 million Kshs in 2016 to 1.04 million Kshs in 2018 and 2.64 million Kshs in 2019, as they
upgraded the milling machines. Since the absolute amount of profit depends on the amount of
investment, we also calculated the ratio of profit to milling capacity per month as an alternative
indicator of the milling business's profitability. The non-adopters had -0.04 in 2016, -0.01 in
both 2018 and 2019. The early adopters also had negative and declining ratios, -0.001 in 2016,
-0.02 in 2018, and -0.20 in 2019,13 suggesting overcapacity for early adopters, particularly after
the late adopters also adopted the improved milling machines. In contrast, although the late
adopters initially had a negative ratio of -0.03 in 2016, they increased the profit per capacity to
0.12 in both 2018 and 2019.
3. Hypotheses and Empirical strategy
3.1 Hypotheses
Because, in the early 2010s, the importance of the destoner component was not widely known
and the improved technologies were available primarily with the large-sized multi-stage milling
machines, which were expensive, the early adopters are expected to be knowledgeable about the
12 We calculated profit by subtracting labor cost, purchasing cost of paddy, electricity cost, and
maintenance cost and depreciation cost of milling machines from the revenue of milling service and
selling rice and bran. The depreciation cost is estimated by assuming the linear depreciation over the
usable lifetime, D = (V-S)/(12 x L), where D = monthly depreciation, V = the value of machine, S = the
salvage value of the machine after its useful use, assumed to be 10 % of the machine value, L = useful
life of the milling machine, assumed to be 10 years (Tokida et al., 2014; Norbu, 2018). The estimation
results below are essentially robust to parameter values in reasonable ranges. Because of the data
limitation, we did not consider other expenses such as rent of workspace and storage, marketing cost, or
tax payment. 13 The early adopters’ average profits are positive because of large positive profits of some millers
using large milling machines despite negative profits of other millers. But the average profit-capacity
ratios reduce the weight for those large millers and turned out to negative.
12
urban rice market and to have sufficient wealth to make a large initial investment. By the time
when the small- and medium-sized multi-stage milling machines became available in the late
2010s, the importance of special knowledge about the marketing of high-quality rice and wealth
would have reduced. Instead, the general human capital represented by education is expected to
play a larger role in making proper adoption decisions of milling machines. Moreover, because
the millers operating along the highway can attract more large urban traders keen on procuring
high-quality milled rice, they have a greater incentive to improve their milling quality. Based on
these considerations, we would like to hypothesize that:
Hypothesis 1: “Those who had acquired knowledge about urban rice market or
accumulated wealth through former occupations tended to adopt improved milling
technologies early, whereas those highly educated tended to adopt improved
technologies later. Moreover, the millers along the highway were more likely to adopt
improved technologies.”
As we have learned in the previous section, because the improved milling technologies
were available primarily for large-sized multi-stage milling machines in the early 2010s, these
early adopters are expected to provide a higher quality of milling service and market
performance in those years. In the late 2010s, small- and medium-sized multi-stage milling
machines were introduced in Mwea, which reduced the advantage in high-quality milling
service of the early adopters. Moreover, the descriptive analyses above suggest the overcapacity
for the early adopters, and, hence, the productivity and profitability of the early adopters'
business may have been lower than the late adopters. Based on these observations, we would like
to hypothesize that:

13
Hypothesis 2: “Both the early and the late adopters improved the milling quality with
improved milling technologies, but the late adopters outperformed the early adopters in
productivity and profitability because of the excess capacity of the early adopters’
milling machines.”
Furthermore, during the 2010s, millers who adopted improved machines are expected to
have improved their milling and overall business performance. In contrast, the other millers kept
using traditional milling machines and performed poorly or exited the market because they lost
the milling service business to the adopters. Thus, we also would like to test the following
hypothesis,
Hypothesis 3: “The non-adopters tended to exit the market because they lost milling
service business to the adopters of improved machines, who were more likely to survive
in the business.”
3.2 Doubly Robust and Endogenous Switching Regression
We consider an estimation strategy to explicitly control the selection on observables and match
millers with similar characteristics. The studies on agricultural technologies use such estimation
methods, including propensity score matching, inverse probability weighting, and the doubly
robust (DR) method, when no plausible instruments are available (Takahashi and Barrett, 2014;
Bellemare and Novak, 2016; Kahn, et al., 2019; Mano et al., 2020). We apply the DR method, or
more precisely, inverse-probability weighted regression adjustment, which combines the
regression and propensity score weighting. It is more robust than the propensity score matching
estimator and the inverse-probability-weighting estimator and can provide a consistent estimator
as long as either the propensity score for destoner use or the outcome regression in terms of
miller’s characteristics is correctly specified (Wooldridge 2007; Wooldridge 2010, Section
14
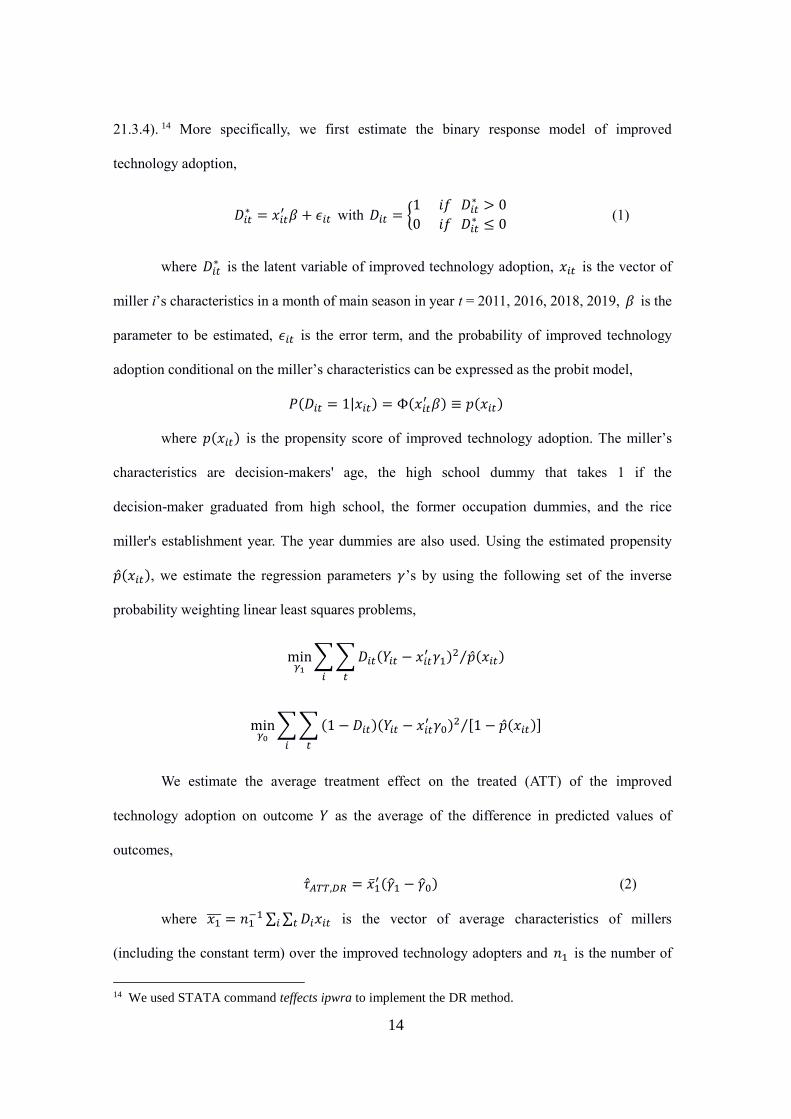
21.3.4). 14 More specifically, we first estimate the binary response model of improved
technology adoption,
𝐷𝑖𝑡∗ = 𝑥𝑖𝑡
′ 𝛽 + 𝜖𝑖𝑡 with 𝐷𝑖𝑡 = {1 𝑖𝑓 𝐷𝑖𝑡
∗ > 0
0 𝑖𝑓 𝐷𝑖𝑡∗ ≤ 0
(1)
where 𝐷𝑖𝑡∗ is the latent variable of improved technology adoption, 𝑥𝑖𝑡 is the vector of
miller i’s characteristics in a month of main season in year t = 2011, 2016, 2018, 2019, 𝛽 is the
parameter to be estimated, 𝜖𝑖𝑡 is the error term, and the probability of improved technology
adoption conditional on the miller’s characteristics can be expressed as the probit model,
𝑃(𝐷𝑖𝑡 = 1|𝑥𝑖𝑡) = Φ(𝑥𝑖𝑡′ 𝛽) ≡ 𝑝(𝑥𝑖𝑡)
where 𝑝(𝑥𝑖𝑡) is the propensity score of improved technology adoption. The miller’s
characteristics are decision-makers' age, the high school dummy that takes 1 if the
decision-maker graduated from high school, the former occupation dummies, and the rice
miller's establishment year. The year dummies are also used. Using the estimated propensity
�̂�(𝑥𝑖𝑡), we estimate the regression parameters 𝛾’s by using the following set of the inverse
probability weighting linear least squares problems,
min𝛾1
∑ ∑ 𝐷𝑖𝑡(𝑌𝑖𝑡 − 𝑥𝑖𝑡′ 𝛾1)2 �̂�(𝑥𝑖𝑡)⁄
𝑡𝑖
min𝛾0
∑ ∑ (1 − 𝐷𝑖𝑡)(𝑌𝑖𝑡 − 𝑥𝑖𝑡′ 𝛾0)2 [1 − �̂�(𝑥𝑖𝑡)]⁄
𝑡𝑖
We estimate the average treatment effect on the treated (ATT) of the improved
technology adoption on outcome 𝑌 as the average of the difference in predicted values of
outcomes,
�̂�𝐴𝑇𝑇,𝐷𝑅 = �̅�1′ (�̂�1 − 𝛾0) (2)
where 𝑥1̅̅ ̅ = 𝑛1−1 ∑ ∑ 𝐷𝑖𝑥𝑖𝑡𝑡𝑖 is the vector of average characteristics of millers
(including the constant term) over the improved technology adopters and 𝑛1 is the number of
14 We used STATA command teffects ipwra to implement the DR method.

15
improved technology adopters. Here, �̂�𝐴𝑇𝑇,𝐷𝑅 is the DR estimator of ATT. The outcome
variables are the milling fee, the amount of rice milled for customers, the rice purchasing and
selling dummy, which takes 1 if the miller purchased paddy and sold rice and 0 otherwise, the
price of sold rice, the amount of sold rice, the capacity utilization rate, the gross profit, the gross
profit per capacity, and the survival dummy, which takes 1 if the miller continued operation until
the next period of our observation and 0 otherwise.
The other empirical strategy that we use is the endogenous switching regression (ESR),
and this method is also often used in the studies of technology adoption in agriculture to address
the endogeneity bias due to unobserved characteristics, which is assumed away by the doubly
robust method (Di Falco, et al., 2011; Konje et al., 2018; Bairagi, et al., 2020). The first step is to
estimate the binary response model of improved technology adoption (1), and the second step
specifies the relationship between the outcome variable 𝑌𝑖𝑡 and a vector of miller’s
characteristics 𝑥𝑖𝑡 for improved technology adopters and non-adopters, separately,
Destoner adopters: 𝑌1𝑖𝑡 = 𝑥1𝑖𝑡′ 𝛿1 + 𝜇1𝑖𝑡 if 𝐷𝑖𝑡 = 1 (3)
Nonadopters: 𝑌0𝑖𝑡 = 𝑥0𝑖𝑡′ 𝛿0 + 𝜇0𝑖𝑡 if 𝐷𝑖𝑡 = 0 (4)
where subscripts 1 and 0 represent adopters and non-adopters, respectively, 𝛿’s are the
vectors of regression coefficients, and 𝜇’s are the random error terms. The error terms in
equations (1), (3), (4) are assumed to be jointly and normally distributed with mean vector zero
and the following covariance matrix:
Ω = 𝑐𝑜𝑣(𝜖𝑖𝑡 , 𝜇1𝑖𝑡 , 𝜇0𝑖𝑡) = [
𝜎𝜖2 𝜎𝜖1 𝜎𝜖0
𝜎𝜖1 𝜎12 ∙
𝜎𝜖0 ∙ 𝜎02
]
where 𝜎𝜖2 = 𝑣𝑎𝑟(𝜖𝑖𝑡) = 1 , 𝜎1
2 = 𝑣𝑎𝑟(𝜇1𝑖𝑡) , 𝜎02 = 𝑣𝑎𝑟(𝜇0𝑖𝑡) , 𝜎𝜖1 = 𝑐𝑜𝑣(𝜖𝑖𝑡 , 𝜇1𝑖𝑡) ,
𝜎𝜖0 = 𝑐𝑜𝑣(𝜖𝑖𝑡 , 𝜇0𝑖𝑡), and the covariance between 𝜇1𝑖𝑡 and 𝜇0𝑖𝑡 are not defined because they
are not observed simultaneously (Green, 2012). The conditional expectation of the outcome of
the destoner adopters in the actual case of adopting destoners can be expressed as
𝐸(𝑌1𝑖𝑡|𝐷𝑖𝑡 = 1, 𝑥1𝑖𝑡) = 𝑥1𝑖𝑡′ 𝛿1 + 𝐸(𝜇1𝑖𝑡|𝐷𝑖𝑡 = 1, 𝑥1𝑖𝑡) = 𝑥1𝑖𝑡
′ 𝛿1 + 𝜎𝜖1𝜆1𝑖𝑡 (5)

16
where 𝐸(𝜇1𝑖𝑡|𝐷𝑖𝑡 = 1, 𝑥1𝑖𝑡) = 𝜎𝜖1𝜙(𝑥1𝑖𝑡
′ 𝛽)
Φ(𝑥1𝑖𝑡′ 𝛽)
≡ 𝜎𝜖1𝜆1𝑖𝑡 . Analogously, the conditional
expectation of the outcome of the destoner adopters in the counterfactual case of not adopting
destoners can be expressed as
𝐸(𝑌0𝑖𝑡|𝐷𝑖𝑡 = 1, 𝑥1𝑖𝑡) = 𝑥1𝑖𝑡′ 𝛿0 + 𝐸(𝜇0𝑖𝑡|𝐷𝑖𝑡 = 1, 𝑥1𝑖𝑡) = 𝑥1𝑖𝑡
′ 𝛿0 + 𝜎𝜖0𝜆1𝑖𝑡 (6)
Following Heckman et al. (2001) and Di Falco et al., (2011), we calculate the
covariate-specific effect of the treatment on the treated as the difference between equations (5)
and (6),
𝐸(𝑌1𝑖𝑡|𝐷 = 1, 𝑥1𝑖𝑡) − 𝐸(𝑌0𝑖𝑡|𝐷 = 1, 𝑥1𝑖𝑡) = 𝑥1𝑖𝑡′ (𝛿1 − 𝛿0) + (𝜎𝜖1 − 𝜎𝜖0)𝜆1𝑖𝑡
Taking the average of this value over the destoner adopters, we obtain the ATT estimator
of the destoner adoption using the endogenous switching regression,
�̂�𝐴𝑇𝑇,𝐸𝑆𝑅 = �̅�1′ (𝛿1 − 𝛿0) + (�̂�𝜖1 − �̂�𝜖0)�̅�1
where 𝑥1̅̅ ̅ = 𝑛1−1 ∑ ∑ 𝐷𝑖𝑥𝑖𝑡𝑡𝑖 is the vector of average characteristics of millers
(including the constant term) over the destoner adopters, �̅�1 is the average inverse mill’s ratio
calculated using the regression parameter estimated in model (1), 𝛿’s and 𝜎’s are parameters of
regression (5) and (6) to be estimated.15 Because we do not have a decent instrument for
destoner adoption, we rely on the nonlinearity of the inverse mill’s ratio for the identification in
parameter estimation (Wooldridge, 2010). Analogously, we also estimate the average treatment
effect on the untreated (ATUT), the hypothetical effect of adopting improved technologies for
non-adopters,
�̂�𝐴𝑇𝑈𝑇,𝐸𝑆𝑅 = �̅�0′ (𝛿1 − 𝛿0) + (�̂�𝜖1 − �̂�𝜖0)�̅�0
where 𝑥0̅̅ ̅ = 𝑛0−1 ∑ ∑ (1 − 𝐷𝑖)𝑥𝑖𝑡𝑡𝑖 is the vector of average characteristics of millers
(including the constant term) over the non-adopters, �̅�0 is the average inverse mill’s ratio for
non-adopters. We use ATUT estimates to examine whether non-adopters had lower expected
profitability, which may be why they did not adopt improved technologies.
15 We used STATA command movestay to implement the ESR method.

17
4. Estimation Results
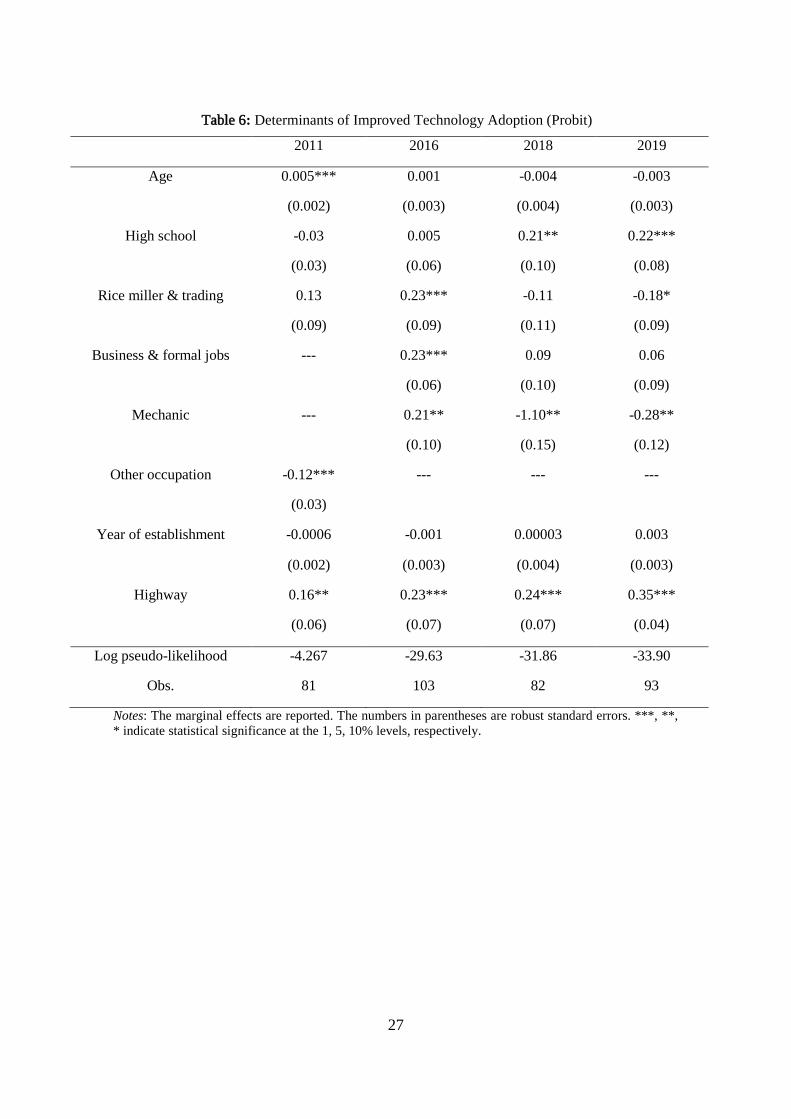
Table 6 presents the estimation results of the probit model of improved technology adoption,
represented by destoner adoption, in 2011, 2016, 2018, and 2019, respectively. We combine the
early adopters and the late adopters to create a destoner adopter category to enable the analyses
with the limited sample size. The estimated effect of the highway dummy was strictly significant,
and its magnitude increased gradually over time from 0.16 in 2011 to 0.35 in 2019. In 2016,
when the early adopters adopted destoners, the main decision-makers of the destoner adopters
were found to have former work experience in rice milling and trading or other business and
formal jobs. In 2018 and 2019, the main decision-makers of the destoner adopters were found to
have higher education but less previous work experience in the rice market. These results are
consistent with Hypothesis 1.
Table 7 presents the estimation results of the DR method and the ESR method, and the
ATT estimates of improved technology adoption are similar between the two methods. We also
estimated the ATT for early adopters and late adopters separately using the DR method and the
ATUT of improved technology adoption using the ESR method. The adoption of improved
milling technologies increased the milling fee by 0.77 Kshs per kg or 2.00 Kshs per kg for the
adopters in general, 0.84 Kshs per kg for the early adopters, and 0.73 Kshs per kg for the late
adopters, while it would have also increased the milling fee of the non-adopters by a smaller
magnitude of 0.47 Kshs per kg if they adopted the improved machines. These findings are
consistent with the first part of Hypothesis 2. The improved machine adoption also increased the
amount of rice milled for customers by 334.9 tons or 357.3 tons for the adopters in general, 431.4
tons for the early adopters, 163.3 tons for the late adopters, while it would have also increased
the amount of milled rice for the non-adopters by a greater magnitude of 730.7 tons.
The DR estimates of ATT of improved technology adoption on the probability of selling
rice were not statistically significant. Nevertheless, according to the corresponding ESR

18
estimate, the improved technology adoption increased the probability of selling rice by 0.21 for
the adopters, whereas it would have reduced the probability of selling rice for the non-adopters.
The adoption of improved machines increased the price of sold rice by 10.64 Kshs per kg or
16.92 Kshs per kg for the adopters in general, 4.40 Kshs per kg for the early adopters, which is
insignificant, 17.57 Kshs per kg for the late adopters, which is strictly significant, whereas it
would have reduced by 26.56 Kshs per kg for the non-adopters. We do not know why the
adoption of improved milling machines would decrease the non-adopters’ price of sold rice. We
suspect that because the decision-makers of the non-adopters lack former work experience in
rice marketing or general education, they were incapable of increasing the rice price simply by
adopting improved machines. These findings are consistent with the first part of Hypothesis 2.
The adoption of improved technologies increased the amount of sold rice by 143.5 tons or 107.4
tons for the adopters in general, 236.6 tons for the early adopters, 36.7 tons for the late adopters,
whereas it would have reduced by 8.1 tons for the non-adopters.
The adoption of improved machines increased the capacity utilization rate by 0.36 or
0.07 for the adopters in general, 0.46 for the early adopters, 0.20 for the late adopters, and it
would have also increased by 0.72 for the non-adopters. The DR estimates of the effect of
improved machine adoption on profit were not statistically significant. However, according to
the ESR estimates, the improved technology adoption increased the profit by 6.93 million Kshs
for the adopters and would have reduced the profit substantially 55.49 million Kshs for the
non-adopters. As was explained earlier, because the decision-makers of the non-adopters lack
former work experience in rice marketing or general education, we suspect that they were
incapable of increasing the profit simply by adopting improved machines. The estimated effect
of improved machine adoption on the early adopters’ profit-capacity ratio was insignificant but
-0.08, suggesting the early adopters' excess capacity. In contrast, the adoption of improved
machines significantly increased the late adopters' profit-capacity ratio by 0.14. According to the
ESR estimates, the adoption of improved technologies increased the profit per capacity by 0.17

19
for the adopters in general, but it would have reduced the profit-capacity ratio by 0.14 for the
non-adopters. These findings are consistent with Hypothesis 2.
We also estimated the ATT and ATUT of destoner adoption on the millers’ survival rate.
The adoption of improved technologies increased the probability of survival until the next period
of our observation by 0.34 or 0.40 for the early adopters, and it would have also increased the
survival probability substantially for the non-adopters. 16 This result is consistent with
Hypothesis 3.
5. Concluding remarks
SSA heavily relies on rice imported from Asia to meet the rapidly increasing rice consumption
due to population growth and urbanization, despite the governments’ effort to improve food
security by increasing rice farming productivity. Consumers, especially in urban markets,
generally prefer high-quality imported rice over domestic rice, and the price difference is often
substantial. Thus, it is commonly argued that African rice cannot compete with Asian rice.
Interestingly, however, this is not the case in the case of Mwea rice, which is higher quality than
imported Pakistani rice and, hence, more expensive. This study explored why this happened.
This study found that learning improved milling technologies from abroad triggered the
rice milling industry's transformational improvement in the largest rice production area, Mwea,
in Kenya. After the 2007-2008 food crisis, a few owners of rice millers with expertise in rice
marketing and accumulated wealth through other businesses visited China and learned the
importance of destoners and other improved rice milling machines in improving the quality of
milled rice. They adopted large-scale multi-stage rice milling machines with destoners and other
improved technologies in the first half of the 2010s and successfully enhanced the milling
quality of rice and business performance. In the late 2010s, small- and medium-scale multi-stage
16 Because we observed the late adopters’ complete technology adoption only in the 2019 survey, we
cannot estimate their effect on survival.
20
rice milling machines were introduced to Mwea by followers, and improved rice milling
technologies were more widely adopted in the cluster, contributing to Mwea rice's
competitiveness against imported rice in the market. These findings strongly indicate the critical
importance of learning new useful knowledge from abroad for improving the performance of
small enterprises in SSA.
These findings may have significant implications for other SSA countries struggling to
improve the quality of milled rice. The critical point is that the introduction of small- and
medium-scale multi-stage rice milling machines reduced the financial burden on potential
adopters and thereby assisted the wide-spread adoption of the new technology. In other words,
the choice of appropriate technology is likely to be of crucial importance for SSA because the
profitability of investment in improved machines varies and may not always be positive. To the
extent that knowledge of various improved milling machines is a local public good, there is
room for the government to provide appropriate information about the cost and benefit of
various rice milling machines. Furthermore, we must note that although the adoption of
improved milling machines significantly improved the quality of rice and the performance of
millers in Mwea, paddy produced in Mwea is a high-quality improved Basmati type which is
uncommon in SSA. Whether the adoption of milling machines with destoners will enhance the
quality of milled rice and millers' performance in areas where more popular rice varieties are
grown is a critical issue to be explored in future studies.

21
References
Bairagi, Subir, Mishra, Ashok, K., Durand-Morat, Alvaro, (2020) “Climate risk management
strategies and food security: Evidence from Cambodian rice farmers,” Food Security, 95.
https://doi.org/10.1016/j.foodpol.2020.101935
Bellemare M., and Novak, L. (2016) “Contract farming and food security,” American Journal of
Agricultural Economics, 99, 357-78.
CARD (2019) Coalition for African Rice Development (CARD), Rice for Africa. [WWW
Document]. URL. https://riceforafrica.net, Accessed date: 21 February 2021.
Demont, Matty, Fiamohe, Rose, Kinkpe, A. Thierry, (2017) “Comparative Advantage in Demand and
the Development of Rice Value Chains in West Africa,” World Development, 96: 578-90.
https://doi.org/10.1016/j.worlddev.2017.04.004
Demont, Matty, Ndour, M., (2015) Upgrading rice value chains: experimental evidence
from 11 African markets. Global Food Security. 5, 70-76.
https://doi.org/10.1016/j.gfs.2014.10.001
Di Falco, Salvatore, Veronesi, Marcella, Yesuf, Mahmud, (2011) “Does Adaptation to Climate
Change Provide Food Security? A Micro-Perspective from Ethiopia,” American Journal of
Agricultural Economics, 1-18; DOI: 10.1093/ajae/aar006
Diako, C., Sakyi-Dawson, E., Bediako-Amoa, B., Saalia, F.K., and Manful, J.T. (2010) Consumer
perceptions, knowledge, and preferences for aromatic rice types in Ghana. Nature and Science
8, 12-19.
FAO (2018) Food and Agriculture Organization (FAO) Regional Office for Africa, “As rice import
bills rise, African countries must sustain growth” [WWW Document]. URL.
http://www.fao.org/africa/news/detail-news/en/c/1154254/ (Last access: 21 February 2021),
Access date: 21 February 2021.
Fiamore, R., Demont, M., Saito, K., Roy-Macauley, H., & Tollens, E. (2017) How Can West African
Rice Compete in Urban Markets? A Demand Perspective for Policymakers, Euro Choices, 17
(2): 51-57.
Futakuchi, Koichi, Mnful, John, Sakurai, Takeshi. (2013) Improving Grain Quality of Locally
Produced Rice in Africa, in M. C. S. Wopereis et al. eds., Realizing Africa’s Rice Promise,
311-23.
Green, William H. (2012) Econometric Analysis (Seventh Edition), Pearson Education Limited.
Heckman, James J., Tobias, J.L., and Vytlacil, Edward, J., (2001) “Four parameters of interest in the
evaluation of social programs,” Southern Economic Journal, 68 (2), 210-33.
Ibrahim, Latif Apaasongo, Sakurai, Takeshi, Tachibana, Towa. (2020) “Local Rice Market
Development in Ghana: Experimental Sales of Standardized Premium Quality Rice to
Retailers,” Japanese Journal of Agricultural Economics, 22: pp.118-22.
Kapalata, Deogratius, and Sakurai, Takeshi (2020) “Adoption of Quality-Improving Rice Milling
Technologies and Its Impacts on Millers’ Performance in Morogoro Region, Tanzania,”
Japanese Journal of Agricultural Economics, 22, pp.101-05
Khan, M. F., Nakano, Y., and Kurosaki, T. (2019). “Impact of contract farming on land productivity
and income of maize and potato growers in Pakistan.” Food Policy, 85, 28-39.
Khonje, Makaiko G., Manda, Julius, Mkandwire, Petros, Tufa, Adane Hirpa, Alene, Arega D., (2018)
“Adoption and welfare impacts of multiple agricultural technologies: evidence from eastern
Zambia,” Agricultural Economics, 49: 599-609.
Kikuchi M., Mano, Y., Njagi, T. N., Merry, D., & Otsuka, K. (2021) "Economic Viability of
Large-scale Irrigation Construction in Sub-Saharan Africa: What if Mwea Irrigation Scheme

22
were Constructed as a Brand-new Scheme?” Journal of Development Studies.
https://doi.org/10.1080/00220388.2020.1826443
Mano, Yukichi, Takahashi, Kazushi, and Otsuka, Keijiro (2020) “Mechanization in land preparation
and agricultural intensification: The case of rice farming in Cote d’Ivoire,” Agricultural
Economics. DOI: 10.1111/agec.12599
Mendez del Villar, P., Lançon, F., 2015. West African rice development: beyond protectionism versus
liberalization? Global Food Security, 5: 56-61. https://doi.org/10.1016/j.gfs.2014.11.001.
Njeru, Timothy N., Mano, Yukichi, Otsuka, Keijiro (2016) “Role of Access to Credit in Rice
Production in Sub-Saharan Africa: The Case of Mwea Irrigation Scheme in Kenya,” Journal of
African Economies, 25 (2), pp. 300-21
Norbu, Kinga (2018) “Cost analysis of operating a medium-sized rice processing mill in Bhutan,”
Bhutanese Journal of Agriculture, 1 (1), pp. 70-76
Otsuka, K., and D. Larson, eds. 2013. An African Green Revolution: Finding Ways to Boost
Productivity on Small Farms. Dordrecht, Netherlands: Springer.
——. 2016. In Pursuit of an African Green Revolution: Views from Rice and Maize Farmers’ Fields.
Dordrecht, Netherlands: Springer.
Otsuka, Keijiro. (2019) “Evidence-Based Strategy for a Rice Green Revolution in Sub-Saharan
Africa” Japan International Cooperation Agency Research Institute Policy Note JICA-RI No.5.
Ragasa, C., Andam, K., Asante, S., and Amewu, S. (2020) Can Local Products Compete against
Imports in West Africa? Supply- and Demand-Side Perspectives on Chicken, Rice, and Tilapia
in Accra, Ghana, Global Food Security, 26.
Samejima, Hiroaki, Keisuke Katsura, Mayumi Kikuta, Symon Mugo Njinju, John Munji Kimani,
Akira Yamauchi & Daigo Makihara (2020) “Analysis of rice yield response to various cropping
seasons to develop optimal cropping calendars in Mwea, Kenya,” Plant Production Science,
23:3, 297-305, DOI: 10.1080/1343943X.2020.1727752
Soullier, Guillaume, Demont, Matty, Arouna, Aminou, Lançon, Frédéric, Mendez del Villar, Patricio,
(2020) “The state of rice value chain upgrading in West Africa,” Global Food Security, 25,
DOI: 10.1016/j.gfs.2020.100365
Takahashi, K., and Barrett, C. B. (2014) “The system of rice intensification and its impacts on
household income and child schooling: Evidence from rural Indonesia,” American Journal of
Agricultural Economics, 96, 269-89.
Tokida, Kunihiro, Haneishi, Yusuke, Tsuboi, Tatsushi, Asea, Godfrey, Kikuchi, Masao (2014)
“Evolution and prospects of the rice mill industry in Uganda,” African Journal of Agricultural
Research, 9 (33): 2560-73. DOI: 10.5879/AJAR2014.8837
Wooldridge, J. M. (2007). Inverse probability weighted estimation for general missing data
problems. Journal of Econometrics, 141, 1281–1301.
Wooldridge, J. M. (2010). Econometric Analysis of Cross Section and Panel Data (2nd ed.).
Cambridge, MA: MIT Press.

23
Table 1: Basic characteristics of sample millers in 2019 by destoner adoptiona
Total Nonadopters Early adoptersb Late adoptersc
No. of millers
(% destoner adoption)
2011 82
(3.7)
72
(0)
6
(50)
4
(0)
2016 103
(14.6)
82
(0)
15
(100)
6
(0)
2018 84
(26.1)
57
(0)
14
(100)
13
(61.5)
2019 95
(34.7)
62
(0)
14
(100)
19
(100)
Exit
2012-2016 41 40 1 0
2017-2019 53 52 1 0
Establishment year 2008.9 2008.9 2005.4 2011.4
(8.8) (6.3) (12.6) (11.6)
On the highway (=1) 0.52 0.33 0.92 0.84
Characteristics of decision-maker
Age 49.8 50.4 49.7 47.8
(10.4) (10.9) (10.8) (8.6)
Female (=1) 0.31 0.33 0.21 0.31
High school/above (=1) 0.61 0.45 1 0.84
Former occupation
Farmer (=1) 0.38 0.43 0.21 0.32
Rice milling & trading (=1) 0.17 0.22 0.14 0.05
Business & formal jobs (=1) 0.35 0.22 0.64 0.58
Mechanic (=1) 0.10 0.13 0 0.05
a. Standard deviations of continuous variables are in parentheses. The survey coverage was expanded
over time, and 62 and 45 millers were added in the 2016 and the 2019 surveys, respectively.
b. The early adopters are the millers that adopted destoners by 2016, and three of them did so in 2011.
c. The late adopters are the millers that adopted destoners only after the 2016 survey, and eight of them
did so in 2018.

24
Table 2: Total milling capacity, WTP of milling machines, the number of employees of millers
by destoner adoption
Total Nonadopter Early adopter Late adopter
Capacity (kg/hour)
2011 468.8 472.6 445.0 435.0
(227.9) (237.5) (89.1) (225.7)
2016 1139.0 538.0 4453.3 966.6
(3032.2) (385.3) (7175.7) (581.9)
2018 2088.8 819.8 6196.4 2838.4
(4377.6) (575.2) (8328.0) (4710.2)
2019 2076.7 815.9 6196.4 3478.9
(4298.7) (574.3) (8327.9) (5113.0)
WTP (million Kshs)
2016 2.15 0.27 13.0 0.44
(6.44) (0.15) (12.3) (0.27)
2018 3.19 0.19 13.5 4.4
(8.11) (0.09) (14.1) (7.1)
2019 3.02 0.19 13.0 4.9
(7.34) (0.10) (13.5) (6.2)
Employees
2011 1.5 1.4 3.0 1.0
(1.4) (1.1) (3.3) (0)
2016 1.6 0.90 5.4 1.3
(2.9) (0.63) (6.1) (0.5)
2018 2.6 0.61 10.4 3.1
(10.3) (1.19) (25.3) (5.3)
2019 2.6 0.54 10.0 3.8
(10.4) (0.73) (25.3) (5.7)
Notes: Standard deviations are in parentheses. The total capacity of and the willingness-to-pay for all the
milling machines at millers are reported.
25
Table 3: Monthly performance of milling service by destoner adoption
Total Nonadopter Early adopter Late adopter
Milling fee (Kshs/kg)
2011 1.90 1.89 2.10 1.87
(0.28) (0.27) (0.42) (0.19)
2016 2.12 2.03 2.83 1.61
(1.18) (1.27) (0.54) (0.42)
2018 2.06 1.81 2.78 2.29
(0.62) (0.52) (0.26) (0.59)
2019 2.01 1.76 2.64 2.37
(0.57) (0.46) (0.39) (0.42)
Rice milled for customers (tons)
2011 58.6 51.8 108.7 99.7
(50.2) (48.9) (30.7) (39.4)
2016 65.4 26.3 270.3 55.6
(163.3) (38.8) (351.0) (11.6)
2018 130.0 32.3 422.3 220.3
(293.5) (65.5) (539.7) (287.7)
2019 198.4 21.6 882.9 255.1
(791.2) (38.3) (1839.9) (507.2)
Note: Standard deviations are in parentheses. The milling fee is deflated with the GDP deflator (the 2019
value).
Table 4: Monthly performance of rice sales by destoner adoption
Total Nonadopter Early adopter Late adopter
Proportion of millers which sell
milled rice
2016 0.38 0.37 0.40 0.50
2018 0.41 0.44 0.36 0.37
2019 0.42 0.41 0.35 0.47
Sold rice (tons)
2016 16.4 5.2 248.6 12.1
(142.7) (6.6) (588.5) (9.5)
2018 21.9 7.0 301.8 54.1
(126.5) (7.6) (515.6) (35.9)
2019 16.8 6.8 216.8 38.0
(83.8) (8.8) (323.2) (49.4)
Price of sold rice (Kshs/kg)
2016 127.5 124.4 141.0 132.8
(22.9) (24.7) (6.9) (14.0)
2018 126.4 120.5 138.2 140.6
(16.3) (10.5) (17.7) (22.2)
2019 120.8 115.4 131.4 130.4
(15.4) (9.1) (18.3) (5.1)
Note: Standard deviations are in parentheses. The rice price is deflated with the GDP deflator (the 2019
value).

26
Table 5: Monthly capacity utilization rate, gross profit, gross profit per capacity by destoner
adoption
Total Nonadopter Early adopter Late adopter
Capacity utilization rate
2011 0.70 0.60 1.33 1.37
(0.57) (0.50) (0.67) (0.65)
2016 0.32 0.30 0.40 0.38
(0.35) (0.37) (0.26) (0.14)
2018 0.34 0.25 0.64 0.38
(0.45) (0.33) (0.73) (0.35)
2019 0.52 0.21 1.36 0.45
(1.65) (1.36) (3.03) (0.58)
Profit (million Kshs)
2016 1.71 -0.08 11.5 0.03
(18.9) (0.49) (48.3) (0.87)
2018 1.99 -0.05 10.3 1.04
(18.1) (0.23) (42.7) (2.90)
2019 0.92 -0.06 2.84 2.64
(11.3) (0.20) (27.6) (9.0)
Profit per Capacity (million
Kshs/kg)
2016 -0.03 -0.04 0.001 -0.03
(0.22) (0.20) (0.35) (0.17)
2018 0.01 -0.01 -0.02 0.12
(0.20) (0.08) (0.34) (0.31)
2019 -0.01 -0.01 -0.20 0.12
(0.36) (0.09) (0.75) (0.45)
Note: Standard deviations are in parentheses. The profit is deflated with the GDP deflator (the 2019
value). Capacity utilization rate is the ratio between the total amount of milled rice and sold rice (tons per
month) to the milling capacity of 200 hours of operation (tons per month). Profit per capacity is the ratio
between the profit (million Kshs per month) to the milling capacity of 200 hours of operation (kg per
month).
27
Table 6: Determinants of Improved Technology Adoption (Probit)
2011 2016 2018 2019
Age 0.005*** 0.001 -0.004 -0.003
(0.002) (0.003) (0.004) (0.003)
High school -0.03 0.005 0.21** 0.22***
(0.03) (0.06) (0.10) (0.08)
Rice miller & trading 0.13 0.23*** -0.11 -0.18*
(0.09) (0.09) (0.11) (0.09)
Business & formal jobs --- 0.23*** 0.09 0.06
(0.06) (0.10) (0.09)
Mechanic --- 0.21** -1.10** -0.28**
(0.10) (0.15) (0.12)
Other occupation -0.12*** --- --- ---
(0.03)
Year of establishment -0.0006 -0.001 0.00003 0.003
(0.002) (0.003) (0.004) (0.003)
Highway 0.16** 0.23*** 0.24*** 0.35***
(0.06) (0.07) (0.07) (0.04)
Log pseudo-likelihood -4.267 -29.63 -31.86 -33.90
Obs. 81 103 82 93
Notes: The marginal effects are reported. The numbers in parentheses are robust standard errors. ***, **,
* indicate statistical significance at the 1, 5, 10% levels, respectively.

28
Table 7: Effects of Improved Milling Technologies (Doubly Robust & Endogenous Switching Regression)
Milling Fee
(Kshs/kg)
Rice milled
(ton)
Sell milled
rice
(=1)
Price of rice
(Kshs/kg)
Rice sold
(ton)
Capacity
util. rate
Profit (mill.
Kshs)
Profit per
Capacity
(million
Kshs/kg)
Survival
(=1)
Doubly Robust
ATT 0.77*** 334.9*** -0.04 10.64** 143.5** 0.36** 5.93 0.01 0.34***
(0.09) (147.7) (0.10) (4.34) (62.4) (0.17) (3.76) (0.06) (0.12)
Early adopter’s ATT 0.84*** 431.4*** -0.12 4.40 236.6** 0.46* 8.03 -0.08 ---
(0.12) (160.4) (0.11) (5.95) (111.4) (0.26) (5.92) (0.08)
Late adopter’s ATT 0.73*** 163.3* -0.04 17.57*** 36.7*** 0.20** 2.20 0.14* ---
(0.12) (98.1) (0.10) (5.23) (9.9) (0.12) (1.46) (0.07)
Endogenous Switching
ATT 2.00*** 357.3*** 0.21*** 16.92*** 107.4*** 0.07* 6.93*** 0.22*** 0.40***
(0.03) (34.5) (0.02) (1.18) (18.9) (0.04) (2.33) (0.01) (0.03)
ATUT 0.47*** 730.7*** -1.41*** -26.56*** -8.1*** 0.72*** -55.49*** -0.10*** 1.32***
(0.02) (9.47) (0.02) (0.38) (4.4) (0.02) (1.04) (0.004) (0.02)
Notes: Robust standard errors are in parentheses. ***, **, * indicate statistical significance at the 1, 5, 10% levels, respectively. The miller’s
characteristics are also controlled in the analyses: the age of decision-makers; the high school dummy, which takes 1 if the decision-maker graduated
from high school; the former occupation dummies; the establishment year of the rice miller; and the year dummies.

29
Figure 1: Rice consumption, production, imports, and paddy price in Kenya
Source: Kenya National Bureau Statistics 2020.
Figure 2: Market Share of Rice Milled for Customers by Destoner Adoption
Note: The early adopters are the millers that adopted destoners by 2016, and three of them did so in
2011. The late adopters are the millers that adopted destoners only after the 2016 survey.
-
10
20
30
40
50
60
70
80
90
-
100,000
200,000
300,000
400,000
500,000
600,000
700,000
800,000
2010 2011 2012 2013 2014 2015 2016 2017 2018 2019
(Sh
/Kg)
To
ns
Consumption (tons) Production (tons) Imports (tons) Price (Ksh/kg)
0%
10%
20%
30%
40%
50%
60%
70%
80%
90%
2011 2016 2018 2019
Non-adopters Early adopters Late adopters

30
Appendix Table: Other characteristics of millers in 2019 by destoner adoption
Nonadopter Early adopter Late adopter
Functions of milling machines (=1)
Pre-cleaner 0 0.93 1
De-husker 1 1 1
Polisher 0.98 1 1
Grader 0.03 0.93 0.68
Color sorter 0 0.57 0.11
Area of workshop & storage (m2) 262.5 2595.2 949.4
(336.0) (2470.3) (898.6)
Area of yard (m2) 23.9 3801.5 553.6
(69.9) (6076.3) (1813.6)
Milled rice to paddy ratio (%) 62.0 65.7 64.1
(3.56) (3.8) (2.7)
The minimum moisture content (%) 12.6 12.0 12.9
(1.1) (1.2) (0.8)
Price of bran sold (Kshs/kg) 5.7 12.9 12.0
(3.1) (2.7) (3.3)
The annual amount of bran sold (tons) 37.1 196.9 280.2
(253.5) (521.9) (1097.2)
The annual amount of rice milled (tons) 136.2 3766.6 12353.2
(203.3) (5222.8) (46901.1)
The annual amount of rice sold (tons) 37.7 3355.4 156.2
(74.7) (7072.9) (214.3)
Capacity utilization rate (annual) 0.28 0.13 0.45
(0.28) (0.23) (0.50)
Notes: Standard deviations of continuous variables are in parentheses. The total capacity of and the
willingness-to-pay for all the milling machines at millers are reported.

31
Abstract (in Japanese)
要約
サハラ以南のアフリカ(SSA)の国々は、アジアからの輸入米に大きく依存している。
これは、コメの需要が急速に増加し、また消費者がアジアの高品質のコメを好むため
である。ケニアでは 2010年頃にいくつかの起業家精神に富む精米業者らが中国から新
しい精米技術を学び、石抜き装置付きの、改良された大型精米機を採用するようにな
った。その後、小型の改良精米機が導入され、より広く採用された。改良精米機を採
用したこれらの精米業者は、輸入米と競争できる高い品質の精米と業績の改善に成功
した。一方、改良精米機を採用しない他の多くの精米業者は、事業を縮小するか、業
界からの撤退を余儀なくされた。
キーワード: コメの品質、精米、石抜き機、ケニア、サハラ以南のアフリカ

32
Working Papers from the same research project
An Empirical Analysis of Expanding Rice Production in Sub-Sahara Africa
JICA-RI Working Paper No. 25
On the Possibility of a Lowland Rice Green Revolution in Sub-Saharan Africa:
Evidence from the Sustainable Irrigated Agricultural Development (SIAD) Project in
Eastern Uganda
Yoko Kijima, Yukinori Ito and Keijiro Otsuka
JICA-RI Working Paper No. 49
Expansion of Lowland Rice Production and Constraints on a Rice Green Revolution:
Evidence from Uganda
Yoko Kijima
JICA-RI Working Paper No. 58
The Determinants of Technology Adoption: The Case of the Rice Sector in Tanzania
Yuko Nakano and Kei Kajisa
JICA-RI Working Paper No. 61
Extensification and Intensification Process of Rainfed Lowland Rice Farming in
Mozambique
Kei Kajisa and Ellen Payongayong
JICA-RI Working Paper No. 71
To What Extent Does the Adoption of Modern Variety Increase Productivity and Income?
A Case Study of the Rice Sector in Tanzania
Yuko Nakano and Kei Kajisa
JICA-RI Working Paper No. 80
Enhancing Rice Production in Uganda: Impact Evaluation of a Training Program and
Guidebook Distribution in Uganda
Yoko Kijima
33
JICA-RI Working Paper No. 86
Constraints on Rice Sector Development in Mozambique
Kei Kajisa
JICA-RI Working Paper No. 90
The Impact of Training on Technology Adoption and Productivity of Rice Farming in
Tanzania: Is Farmer-to-Farmer Extension Effective?
Yuko Nakano, Takuji W. Tsusaka, Takeshi Aida and Valerien O. Pede
JICA-RI Working Paper No. 105
On the Determinants of High Productivity Rice Farming in Irrigated Areas in Senegal:
The Efficiency of Large Compared with Small-Scale Irrigation Schemes
Takeshi Sakurai
JICA-RI Working Paper No. 157
Contract Farming, Farm Mechanization, and Agricultural Intensification: The Case of
Rice Farming in Cote d’Ivoire
Yukichi Y. Mano, Kazushi Takahashi, and Keijiro Otsuka
JICA-RI Working Paper No. 161
Long-term and Spillover Effects of Rice Production Training in Uganda
Yoko Kijima
JICA-RI Working Paper No. 174
Spillovers as a Driver to Reduce Ex-post Inequality Generated by Randomized
Experiments: Evidence from an Agricultural Training Intervention
Kazushi Takahashi, Yukichi Mano, and Keijiro Otsuka
JICA-RI Working Paper No. 193
The Impact of Microcredit on Agricultural Technology Adoption and Productivity:
Evidence from Randomized Control Trial in Tanzania
Yuko Nakano and Eustadius F. Magezi
JICA-RI Working Paper No. 196
Technology Adoption, Impact, and Extension in Developing Countries’ Agriculture: A
Review of the Recent Literature
Kazushi Takahashi, Rie Muraoka and Keijiro Otsuka
34
JICA-RI Working Paper No. 200
Economic Viability of Large-scale Irrigation Construction in 21st Century Sub-Saharan
Africa:Centering around an Estimation of the Construction Costs of the Mwea Irrigation
Scheme in Kenya
Masao Kikuchi, Yukichi Mano, Timothy Njagi Njeru, Douglas J. Merrey and
Keijiro Otsuka