usda national agricultural statistics service
DESCRIPTION
USDA National Agricultural Statistics Service. James E. Ramey, Director Ohio Field Office Gary Keough, Director New England Field Office. Agriculture counts and NASS counts for U.S. agriculture. Ohio Agricultural Statistics. Mail Address:P.O. Box 686 Reynoldsburg OH 43068-0686 - PowerPoint PPT PresentationTRANSCRIPT

USDANational Agricultural Statistics Service
James E. Ramey, Director Ohio Field OfficeGary Keough, Director New England Field Office
Agriculture counts and NASS counts for U.S. agriculture.

Mail Address: P.O. Box 686 Reynoldsburg OH 43068-0686
Location: Bromfield Admin. Bldg. Room 1038995 East Main St.Reynoldsburg OH 43068-0686
Telephones: 614-728-2100800-858-8144 Toll Free614-728-2206 Fax
OhioAgricultural Statistics
Agriculture counts and NASS counts for U.S. agriculture.

Mail Address: 53 Pleasant St, Rm 2100Concord, NH 03301
Telephones: 603-224-9639800-642-9571 Toll Free603-225-1434 Fax
New EnglandAgricultural Statistics
Agriculture counts and NASS counts for U.S. agriculture.

4
Maple Syrup Contacts
New England Agricultural Statistics Field OfficeAngie Considine, Maple StatisticianDirect Line : 603-227-3124Phone: 1-800-642-9571, Ext 124E:Mail: [email protected]
Ohio Agricultural Statistics Field OfficeCharley Russel, Maple Statistician Phone: 1- 800-858-8144E:Mail: [email protected]
Washington DCLeslie ColburnPhone: 1-202-720-7235E:Mail: [email protected]
Agriculture counts and NASS counts for U.S. agriculture.

• www.nass.usda.gov/Statistics_by_State/Ohio/index.asp
Internet Address for Ohio Maple Reports
Agriculture counts and NASS counts for U.S. agriculture.
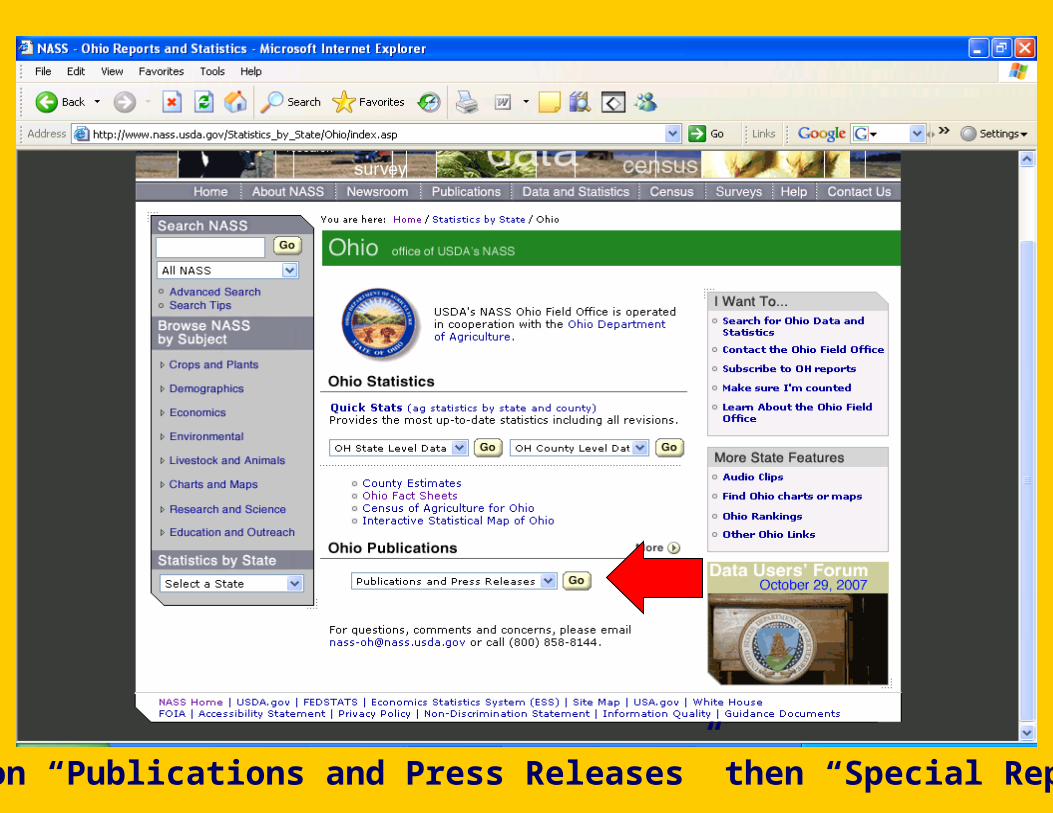
Click on “Publications and Press Releases” then “Special Reports”

Then Click on “Farm Report Releases”
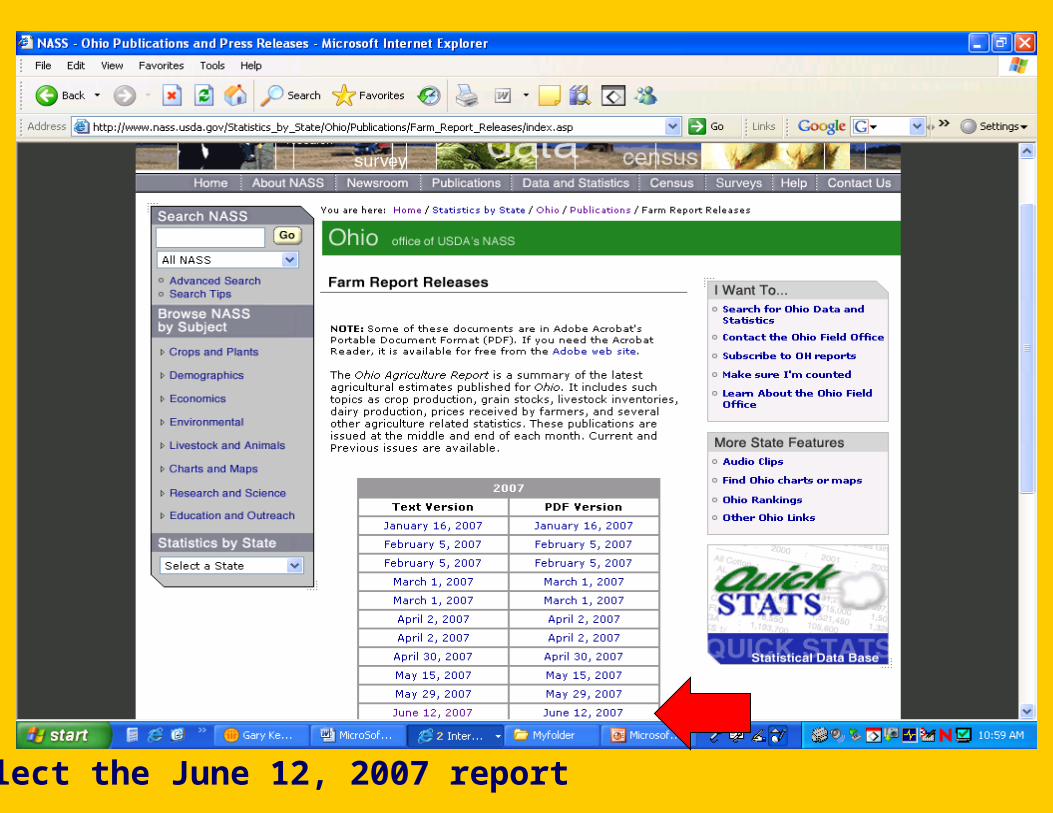
Select the June 12, 2007 report


• www.nass.usda.gov/Statistics_by_State/New_England/index.asp
• www.nass.usda.gov/Statistics_by_State/Connecticut/index.asp
• www.nass.usda.gov/Statistics_by_State/Maine/index.asp
• www.nass.usda.gov/Statistics_by_State/Massachusetts/index.asp
• www.nass.usda.gov/Statistics_by_State/New_Hampshire/index.asp
• www.nass.usda.gov/Statistics_by_State/Vermont/index.asp
Internet Address for Maple Reports, New England States
Agriculture counts and NASS counts for U.S. agriculture.

Click on “Publications and Press Releases”
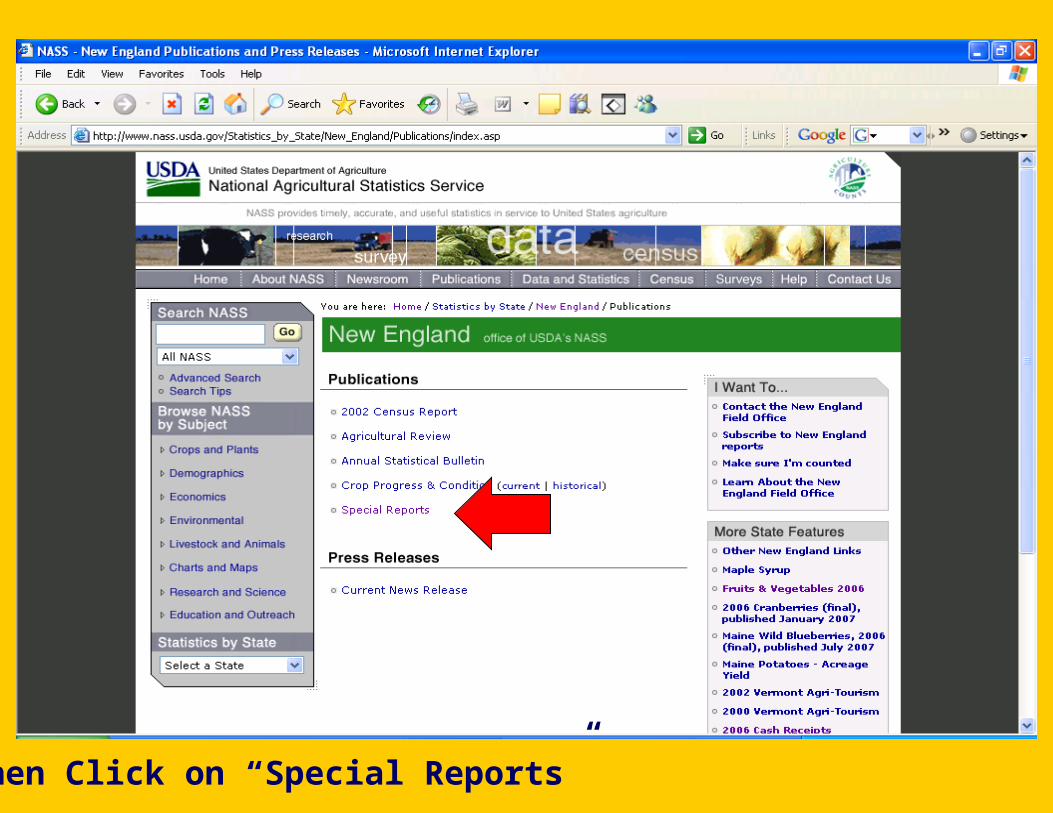
Then Click on “Special Reports”

Select either the English or French version

2003 – 2007 Maple Syrup Response Rates, U.S. by State
USDA-NASS 08/2006
State 2003 2004 2005 2006 2007
Percent
Connecticut 53.4 76.5 64.1 84.1 75.4
Maine 72.6 76.6 76.8 81.8 74.3
Massachusetts 61.4 70.5 75.8 76.6 75.1
New Hampshire 77.4 72.1 72.9 78.5 74.2
Vermont 79.6 70.7 68.3 68.4 57.3
Michigan 70.3 81.4 83.1 84.0 75.7
New York 78.2 87.1 82.1 52.5 72.3
Ohio 82.0 85.3 84.2 59.7 47.3
Pennsylvania 78.4 77.3 74.2 85.7 79.2
Wisconsin 92.2 90.2 90.8 93.4 92.8

2007 Maple Syrup Season, U.S. by State
State Earliest Latest Most Common
Start Close Start Close
CT Feb. 5 April 24 Feb 15
ME Feb. 20 May 7 Mar 15 Apr 10 & 14
MA Feb. 20 May 2 Mar 7
NH Feb. 15 April 24 Mar 10
VT Feb. 15 April 30 Mar 12 Apr 30
MI Feb. 19 April 23 -- --
NY Jan. 5 May 3 -- --
OH Jan. 31 April 20 -- --
PA Jan. 7 May 1 -- --
WI Feb. 15 Apr 29 -- --
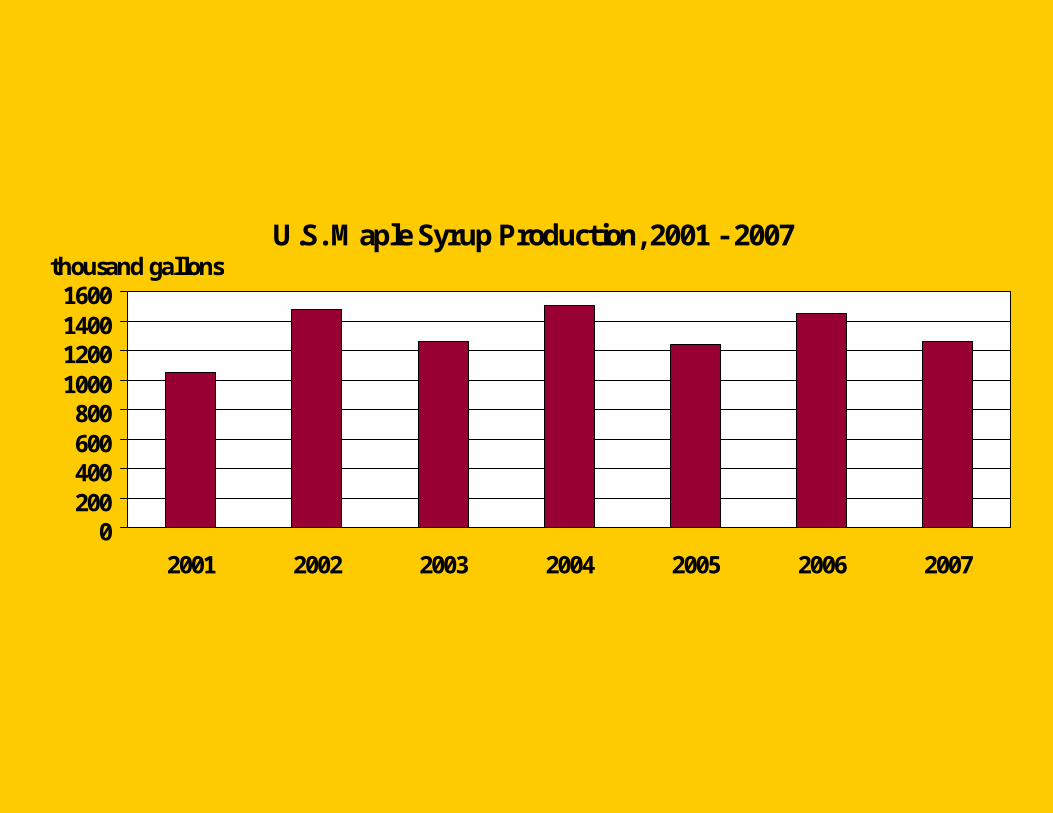
U.S. Maple Syrup Production, 2001 - 2007
0200400600800
1000120014001600
2001 2002 2003 2004 2005 2006 2007
thousand gallons

U.S. Maple Production, 2007Gallons and Percent by State
MA30,000
2%NH
60,0005%
WI75,000
6%
CT8,0001%
ME225,000
18%
VT450,000
35%
MI60,000
5%
NY224,000
18%
PA51,000
4%
OH75,000
6%
United States 2007 Maple Syrup Production: 1,258,000 Gallons

U.S. Maple Taps, 2001 - 2007
6,000
6,200
6,400
6,600
6,800
7,000
7,200
7,400
2001 2002 2003 2004 2005 2006 2007
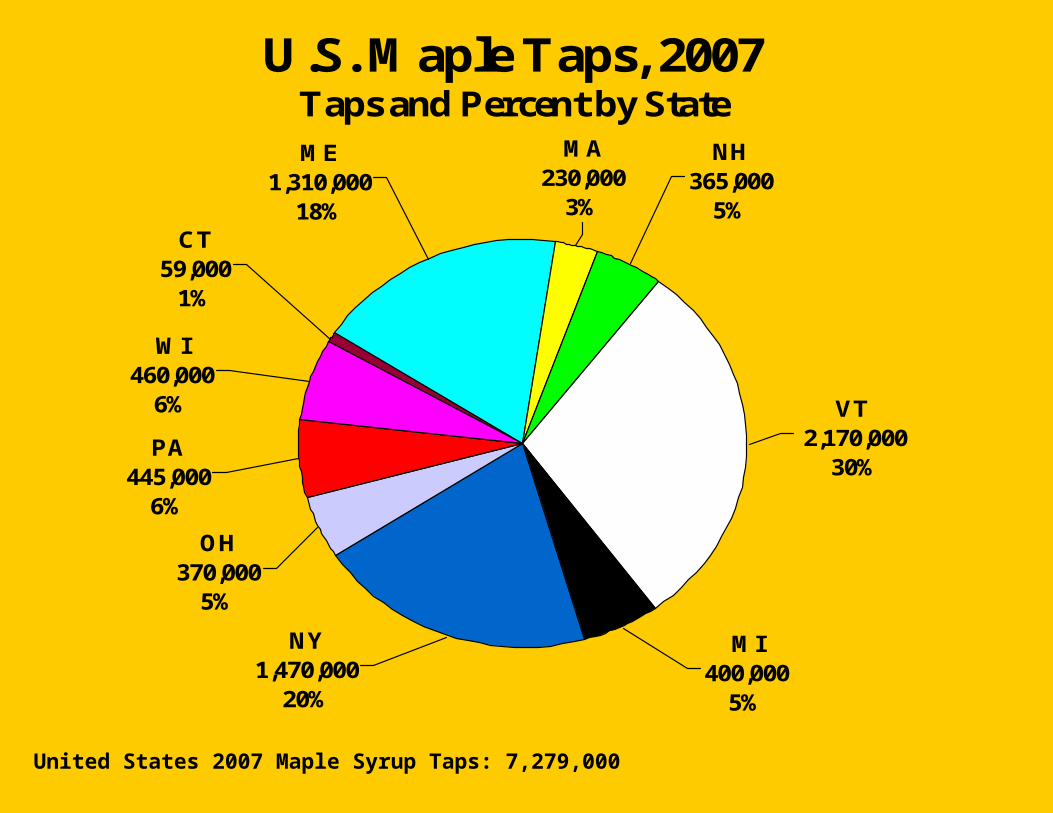
U.S. Maple Taps, 2007Taps and Percent by State
MA230,000
3%
NH365,000
5%CT
59,0001%
WI460,000
6%
ME1,310,000
18%
VT 2,170,000
30%
MI400,000
5%
NY1,470,000
20%
OH370,000
5%
PA445,000
6%
United States 2007 Maple Syrup Taps: 7,279,000

Taps, Yield & Production, 2005 - 2007, U.S. by StateState Taps Yield Per Tap Production
2005 2006 2007 2005 2006 2007 2005 2006 2007
1,000 Taps Gallons 1,000 Gallons
Connecticut 63 61 59 0.159 0.164 0.136 10 10 8
Maine 1,300 1,315 1,310 0.204 0.228 0.172 265 300 225
Massachusetts 240 245 230 0.167 0.163 0.130 40 40 30
New Hampshire 365 355 365 0.156 0.180 0.164 57 64 60
Vermont 2,140 2,170 2,170 0.192 0.212 0.207 410 460 450
NEW ENGLAND 1/ 4,108 4,146 4,134 0.190 0.211 0.187 782 874 773
Michigan 390 375 400 0.149 0.208 0.150 58 78 60
New York 1,420 1,530 1,470 0.156 0.165 0.152 222 253 224
Ohio 355 360 370 0.194 0.217 0.203 69 78 75
Pennsylvania 428 449 445 0.143 0.147 0.115 61 66 51
Wisconsin 400 400 460 0.125 0.250 0.163 50 100 75
UNITED STATES 7,101 7,260 7,279 0.175 0.200 0.173 1,242 1,449 1,258
1/ New England includes CT, ME, MA, NH and VT.
SOURCE: United States – Crop Production, NASS, USDA.

U.S. Maple Value of Production, 2000 - 2006
$0
$10
$20
$30
$40
$50
2000 2001 2002 2003 2004 2005 2006
$ millions

U.S. Maple Value of Production, 2006Value and Percent by State
NY$8,020,000
18%
MI$2,886,000
6%
VT$13,892,000
31%
OH$2,652,000
6%
PA$2,145,000
5%
CT$582,000
1%
WI$3,120,000
7%
NH$2,810,000
6%
MA$1,916,000
4%ME$7,290,000
16%
United States 2006 Value of Production: $45,313,000

U.S. Maple Syrup Average Gallon Equivalent Price, 2000 - 2006
$25.00
$26.00
$27.00
$28.00
$29.00
$30.00
$31.00
$32.00
2000 2001 2002 2003 2004 2005 2006
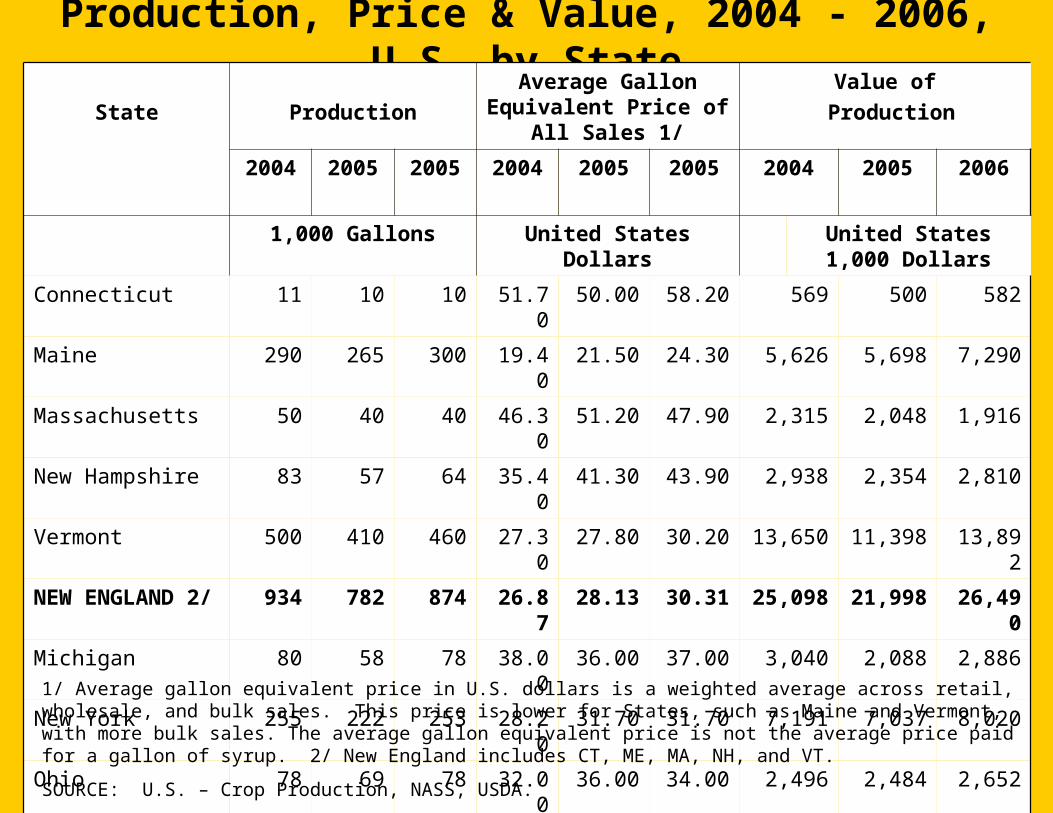
Production, Price & Value, 2004 - 2006, U.S. by State
State Production
Average Gallon Equivalent Price of All
Sales 1/
Value of
Production
2004 2005 2005 2004 2005 2005 2004 2005 2006
1,000 Gallons United States Dollars United States 1,000 Dollars
Connecticut 11 10 10 51.70 50.00 58.20 569 500 582
Maine 290 265 300 19.40 21.50 24.30 5,626 5,698 7,290
Massachusetts 50 40 40 46.30 51.20 47.90 2,315 2,048 1,916
New Hampshire 83 57 64 35.40 41.30 43.90 2,938 2,354 2,810
Vermont 500 410 460 27.30 27.80 30.20 13,650 11,398 13,892
NEW ENGLAND 2/ 934 782 874 26.87 28.13 30.31 25,098 21,998 26,490
Michigan 80 58 78 38.00 36.00 37.00 3,040 2,088 2,886
New York 255 222 253 28.20 31.70 31.70 7,191 7,037 8,020
Ohio 78 69 78 32.00 36.00 34.00 2,496 2,484 2,652
Pennsylvania 60 61 66 29.00 31.50 32.50 1,740 1,922 2,145
Wisconsin 100 50 100 32.30 32.40 31.20 3,230 1,620 3,120
UNITED STATES 1,507 1,242 1,449 28.40 29.90 31.30 42,795 37,149 45,3131/ Average gallon equivalent price in U.S. dollars is a weighted average across retail, wholesale, and bulk sales. This price is lower for States, such as Maine and Vermont, with more bulk sales. The average gallon equivalent price is not the average price paid for a gallon of syrup. 2/ New England includes CT, ME, MA, NH, and VT.
SOURCE: U.S. – Crop Production, NASS, USDA.
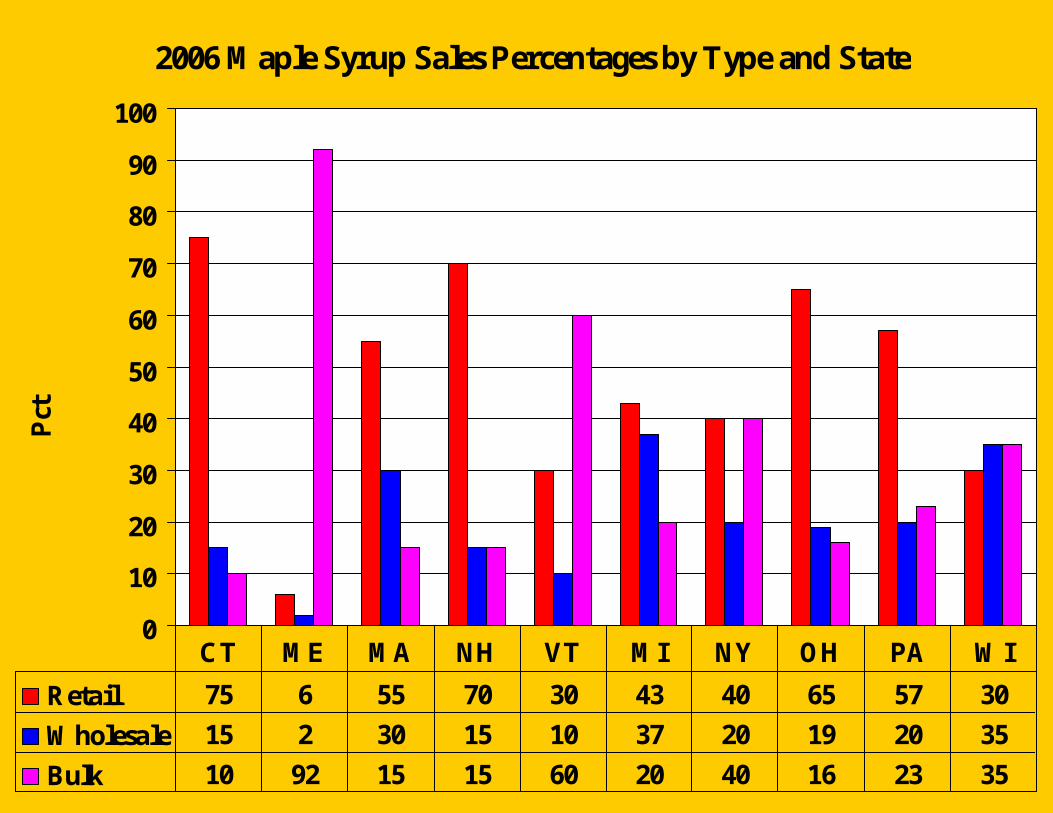
2006 Maple Syrup Sales Percentages by Type and State
0
10
20
30
40
50
60
70
80
90
100
Pct
Retail 75 6 55 70 30 43 40 65 57 30
Wholesale 15 2 30 15 10 37 20 19 20 35
Bulk 10 92 15 15 60 20 40 16 23 35
CT ME MA NH VT MI NY OH PA WI

U.S. Maple Syrup Sales Percentage by Type and State, 2004 – 2006
State Retail Wholesale Bulk
2004 2005 2006 2004 2005 2006 2004 2005 2006
Percent
CT 85 80 75 10 10 15 5 10 10
ME 3 2 6 2 1 2 95 97 92
MA 55 65 55 30 20 30 15 15 15
NH 50 65 70 25 20 15 25 15 15
VT 30 30 30 10 10 10 60 60 60
MI 60 48 43 23 28 37 17 24 20
NY 50 45 40 19 22 20 31 33 40
OH 61 63 65 14 17 19 25 20 16
PA 55 56 57 11 16 20 34 28 23
WI 42 42 30 16 23 35 42 35 35

Retail Price per Gallon, 2004 - 2006, U.S. by State
$20.00
$22.00
$24.00
$26.00
$28.00
$30.00
$32.00
$34.00
$36.00
$38.00
$40.00
$42.00
$44.00
U.S. $
2004 $39.10 $36.60 $34.80 $34.30 $31.70 $32.70 $32.20 $28.70 $29.50 $28.60
2005 $39.30 $35.00 $37.50 $36.60 $32.30 $34.20 $32.50 $31.20 $29.30 $30.60
2006 $44.00 $39.80 $38.10 $37.70 $34.40 $34.10 $32.90 $31.50 $30.80 $31.60
CT ME MA NH VT MI NY OH PA WI

2006 Retail Price by Container Size, U.S. by State
State Gal ½ Gal Qt Pt ½ Pt 3.4 Oz 8.5 Oz 12 Oz
U.S. Dollars Per Container
CT 44.00 25.30 14.60 9.10 5.60 3.40 7.90 1/
ME 39.80 20.20 11.00 6.40 4.50 2.80 6.20 8.70
MA 38.10 21.90 13.30 9.30 6.20 3.60 9.40 1/
NH 37.70 21.20 12.20 7.50 4.90 3.10 7.70 8.40
VT 34.40 20.80 13.00 8.20 5.20 3.50 8.00 8.80
MI 34.10 18.30 10.90 6.50 4.50 2/ 2/ 2/
NY 32.90 19.10 11.40 7.00 4.40 2/ 2/ 2/
OH 31.50 19.00 11.10 6.70 4.50 2/ 2/ 2/
PA 30.80 19.00 11.20 6.75 3.65 2/ 2/ 2/
WI 31.60 17.60 9.10 5.80 4.25 2/ 2/ 2/1/ Data not published to avoid disclosing individual operations.2/ Only available in New England states.

Wholesale Price Per Gallon, 2004 - 2006, U.S. by State
$22.00
$24.00
$26.00
$28.00
$30.00
$32.00
$34.00
$36.00U.S. $
2004 $33.30 $29.00 $29.20 $27.70 $28.40 $25.70 $25.60 $26.80 $26.00 $26.00
2005 $34.10 $30.00 $30.10 $30.00 $27.60 $29.00 $26.50 $26.20 $27.50 $33.00
2006 $35.00 $31.30 $28.40 $29.70 $27.80 $26.60 $27.70 $25.10 $29.00 $32.50
CT ME MA NH VT MI NY OH PA WI

2006 Wholesale Price by Container Size, U.S. by State
State Gal ½ Gal Qt Pt ½ Pt 3.4 Oz 8.5 Oz
U.S. Dollars Per Container
CT 35.00 18.10 12.80 8.30 4.60 3.90 1/
ME 31.30 15.90 8.60 4.90 3.10 2.70 5.80
MA 28.40 16.00 10.40 6.00 3.80 3.00 1/
NH 29.70 17.70 9.60 5.70 3.50 2.40 6.40
VT 27.80 17.20 9.90 5.80 3.60 1.80 5.30
MI 26.60 17.30 9.10 5.30 3.10 2/ 2/
NY 27.70 16.30 8.70 5.40 3.60 2/ 2/
OH 25.10 15.40 8.90 5.50 3.60 2/ 2/
PA 29.00 16.70 8.95 5.20 3.50 2/ 2/
WI 32.50 16.40 8.85 5.05 3.30 2/ 2/1/ Data not published to avoid disclosing individual operations.2/ Only available in New England states.

Bulk Price per pound, All Grades, 2004 - 2006, by State
$0.80
$1.00
$1.20
$1.40
$1.60
$1.80
$2.00
$2.20
U.S. $
2004 $1.10 $1.60 $1.50 $1.40 $1.60 $1.75 $1.40 $1.55 $1.35 $1.50
2005 - $1.90 $1.65 $1.60 $1.70 $1.80 $1.70 $2.00 $1.60 $1.70
2006 $1.85 $1.95 $1.80 $1.85 $1.85 $1.80 $1.80 $1.85 $1.60 $1.80
CT ME MA NH VT MI NY OH PA WI
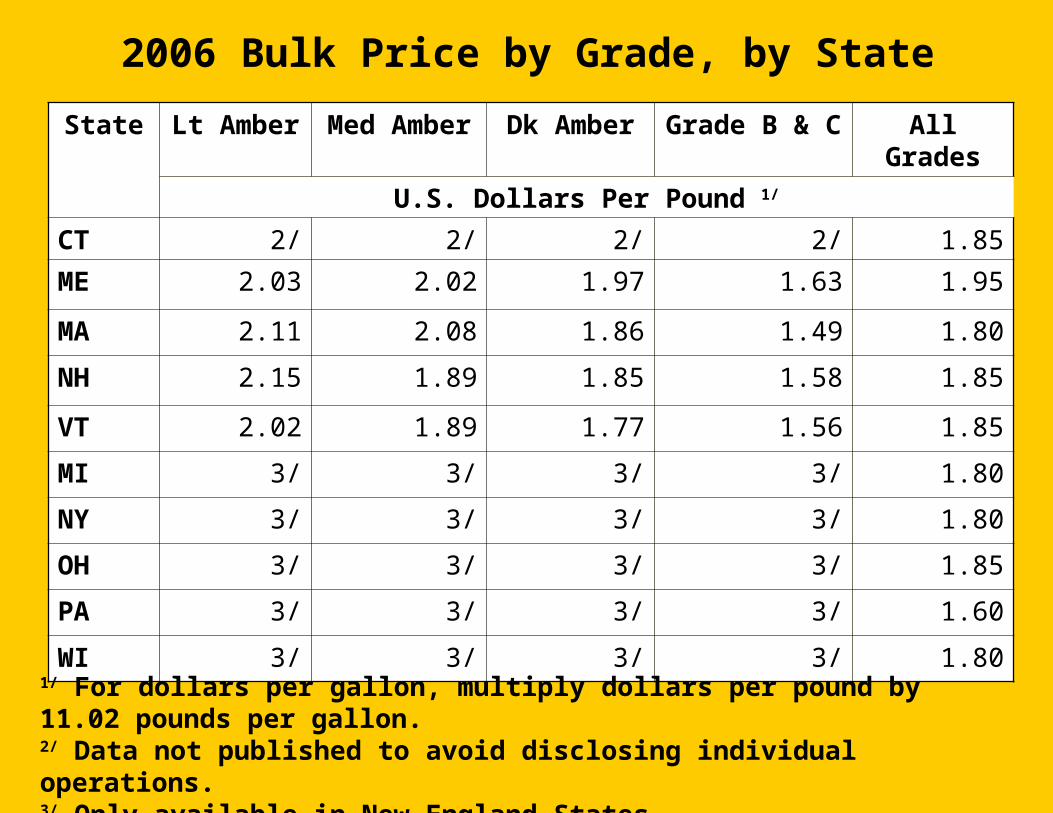
2006 Bulk Price by Grade, by State
State Lt Amber Med Amber Dk Amber Grade B & C All Grades
U.S. Dollars Per Pound 1/
CT 2/ 2/ 2/ 2/ 1.85
ME 2.03 2.02 1.97 1.63 1.95
MA 2.11 2.08 1.86 1.49 1.80
NH 2.15 1.89 1.85 1.58 1.85
VT 2.02 1.89 1.77 1.56 1.85
MI 3/ 3/ 3/ 3/ 1.80
NY 3/ 3/ 3/ 3/ 1.80
OH 3/ 3/ 3/ 3/ 1.85
PA 3/ 3/ 3/ 3/ 1.60
WI 3/ 3/ 3/ 3/ 1.80
1/ For dollars per gallon, multiply dollars per pound by 11.02 pounds per gallon.2/ Data not published to avoid disclosing individual operations.3/ Only available in New England States.
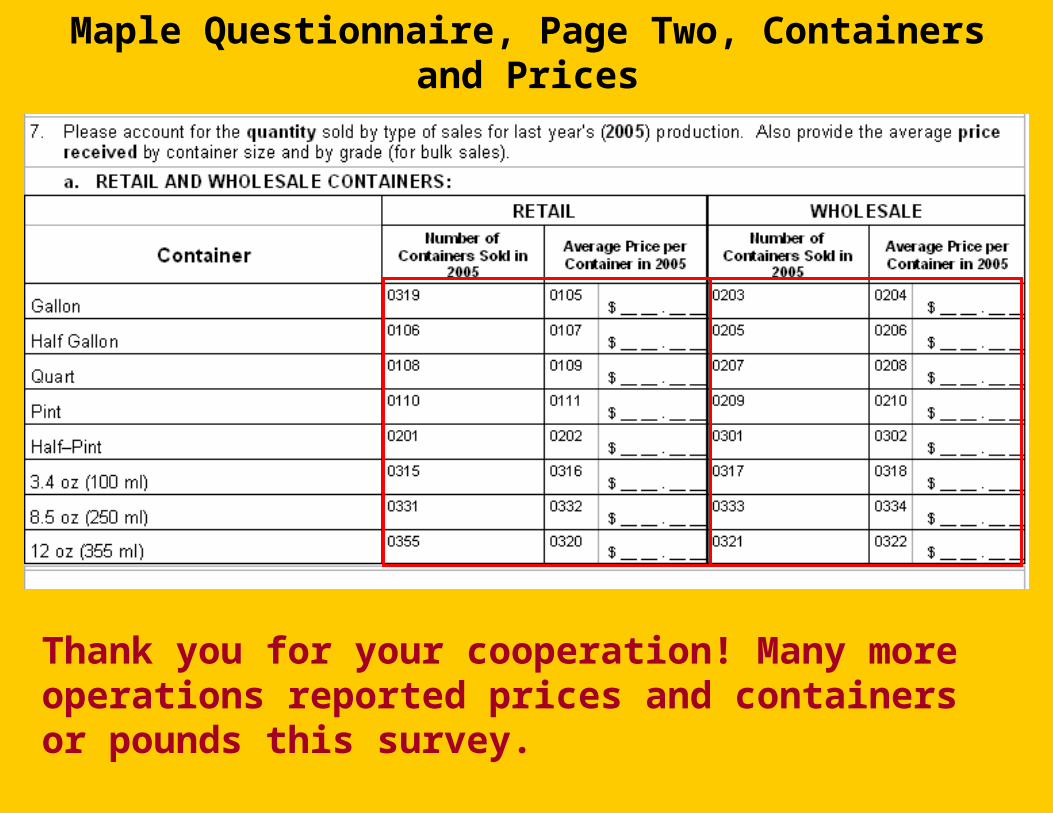
Maple Questionnaire, Page Two, Containers and Prices
Thank you for your cooperation! Many more operations reported prices and containers or pounds this survey.

Maple Questionnaire, Page Two, Containers and Prices
Price calculations only work when we have either the numbers of containers sold and the prices or the numbers of pounds sold and the prices. Otherwise, we are unable to use the price data.
So, please help us by tracking your container and/or pound sales. Remember, the better the data you report to us, the better the data we give back to you.

Canada, Maple Value of Production, 2006Value and Percent by State
New Brunswick$9,792,000
6%
Quebec$139,261,000
87% Ontario$10,078,000
6%
Nova Scotia$1,054,000
1%
Canada 2006 Value of Production: $160,185,000
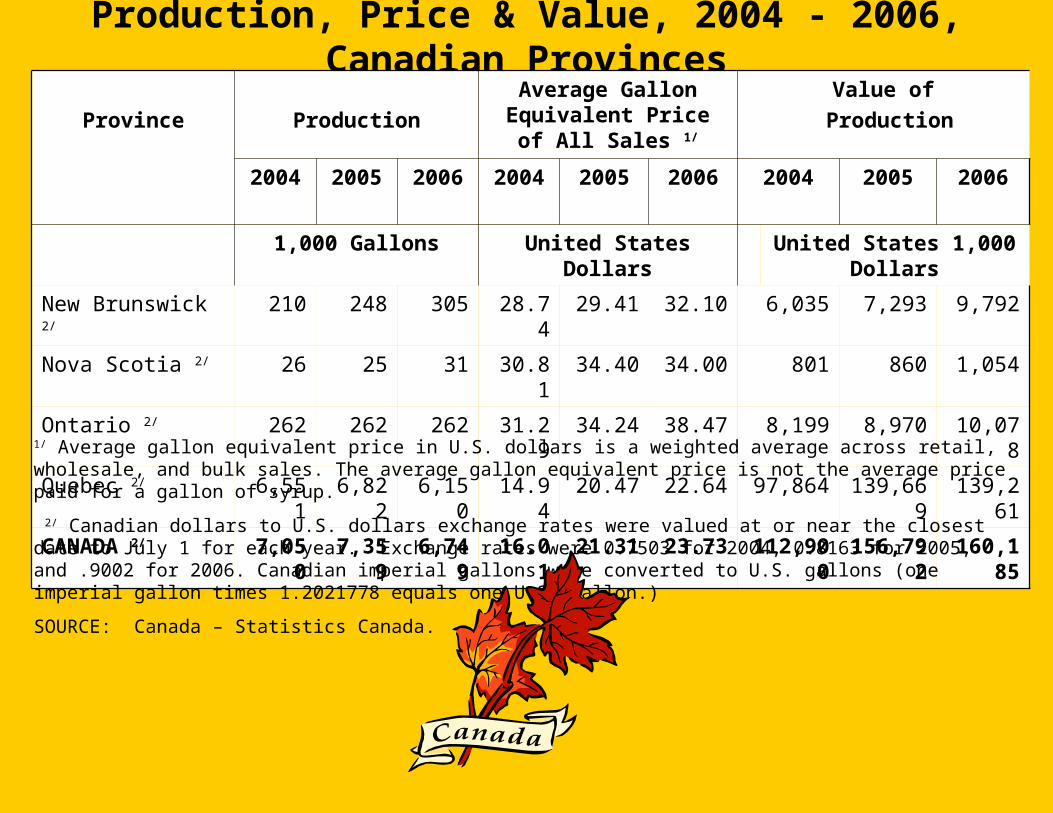
Production, Price & Value, 2004 - 2006, Canadian Provinces
Province Production
Average Gallon Equivalent Price of All
Sales 1/
Value of
Production
2004 2005 2006 2004 2005 2006 2004 2005 2006
1,000 Gallons United States Dollars United States 1,000 Dollars
New Brunswick 2/ 210 248 305 28.74 29.41 32.10 6,035 7,293 9,792
Nova Scotia 2/ 26 25 31 30.81 34.40 34.00 801 860 1,054
Ontario 2/ 262 262 262 31.29 34.24 38.47 8,199 8,970 10,078
Quebec 2/ 6,551 6,822 6,150 14.94 20.47 22.64 97,864 139,669 139,261
CANADA 2/ 7,050 7,359 6,749 16.01 21.31 23.73 112,900 156,792 160,1851/ Average gallon equivalent price in U.S. dollars is a weighted average across retail, wholesale, and bulk sales. The average gallon equivalent price is not the average price paid for a gallon of syrup.
2/ Canadian dollars to U.S. dollars exchange rates were valued at or near the closest date to July 1 for each year. Exchange rates were 0.7503 for 2004, 0.8163 for 2005, and .9002 for 2006. Canadian imperial gallons were converted to U.S. gallons (one imperial gallon times 1.2021778 equals one U.S. gallon.)
SOURCE: Canada – Statistics Canada.

Somerset County Maple Producers Association - June 14, 2003
Jackman, ME
The 2007 Census of Agriculture
Your voice, Your future,
Your responsibility

Somerset County Maple Producers Association - June 14, 2003
Jackman, ME
What is the Census of Agriculture?
• A survey of America’s farmers• Conducted every five years• Provides valuable information about
American agriculture • The most complete agricultural data
resource available• Used by your local community to plan for
its future

Anyone with a farm.Farm Definition
Any place from which $1,000 or more of agricultural products were produced and
sold, or normally would have been sold, during the census year.
Who should participate?

Somerset County Maple Producers Association - June 14, 2003
Jackman, ME
Why should they participate?
The Census of Agriculture provides best measure of the significant value agriculture contributes to America.
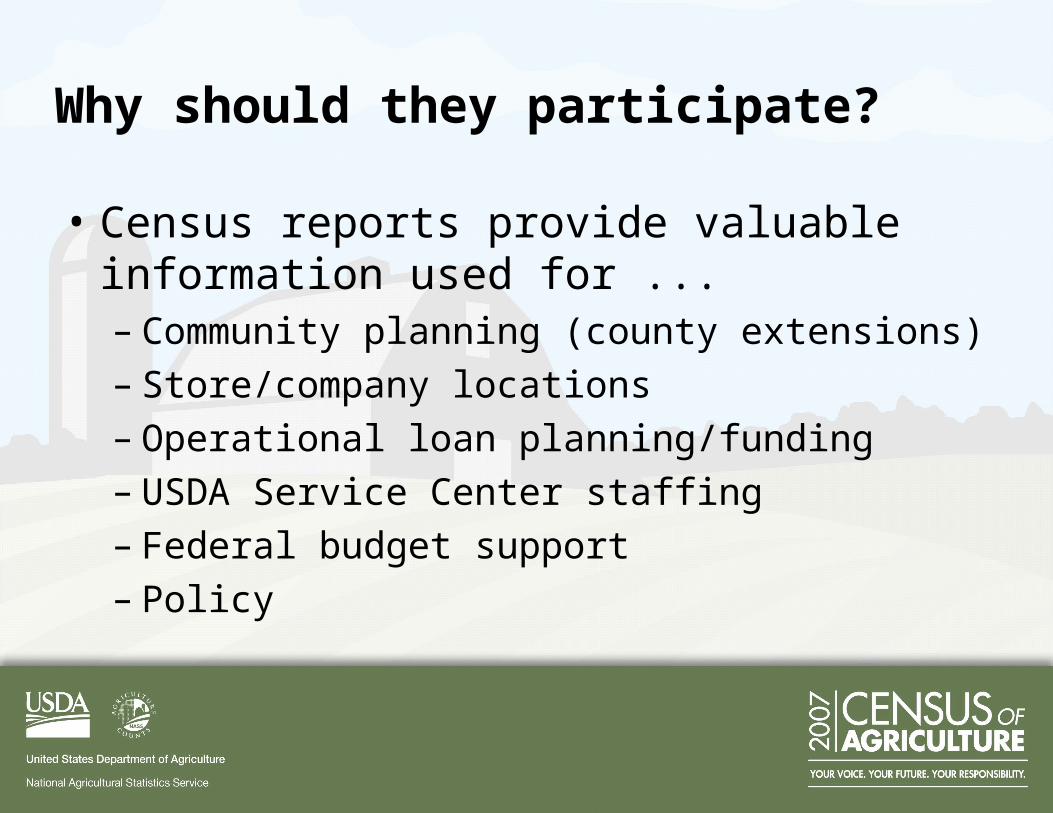
Why should they participate?
• Census reports provide valuable information used for ... – Community planning (county extensions)– Store/company locations– Operational loan planning/funding– USDA Service Center staffing– Federal budget support– Policy

Type of Information
• Land use
• Acreage, inventory, production, value of production
• Production Expenses
• Government payments
• Farm related income
• Demographics

Level of Information
• County
• Farm size
• Farm income
• Type of farm organization
• Type of farm

US map, number of tabs

US map, Gallons of Syrup

Timeline
• Late December 2007, mail questionnaires• Mid-January 2008, mail reminder cards• Early February 2008, begin telephone follow
up• February 2008-January 2009, edit, analyze,
and prepare publication and website data base
• February 2009, release to public

Timeline
• Late December 2007, mail questionnaires• Mid-January 2008, mail reminder cards• Early February 2008, begin telephone follow
up• February 2008-January 2009, edit, analyze,
and prepare publication and website data base
• February 2009, release to public

French Canadian Producers
• We will provide a special Maple Syrup Production Questionnaire in lieu of a Census Questionnaire
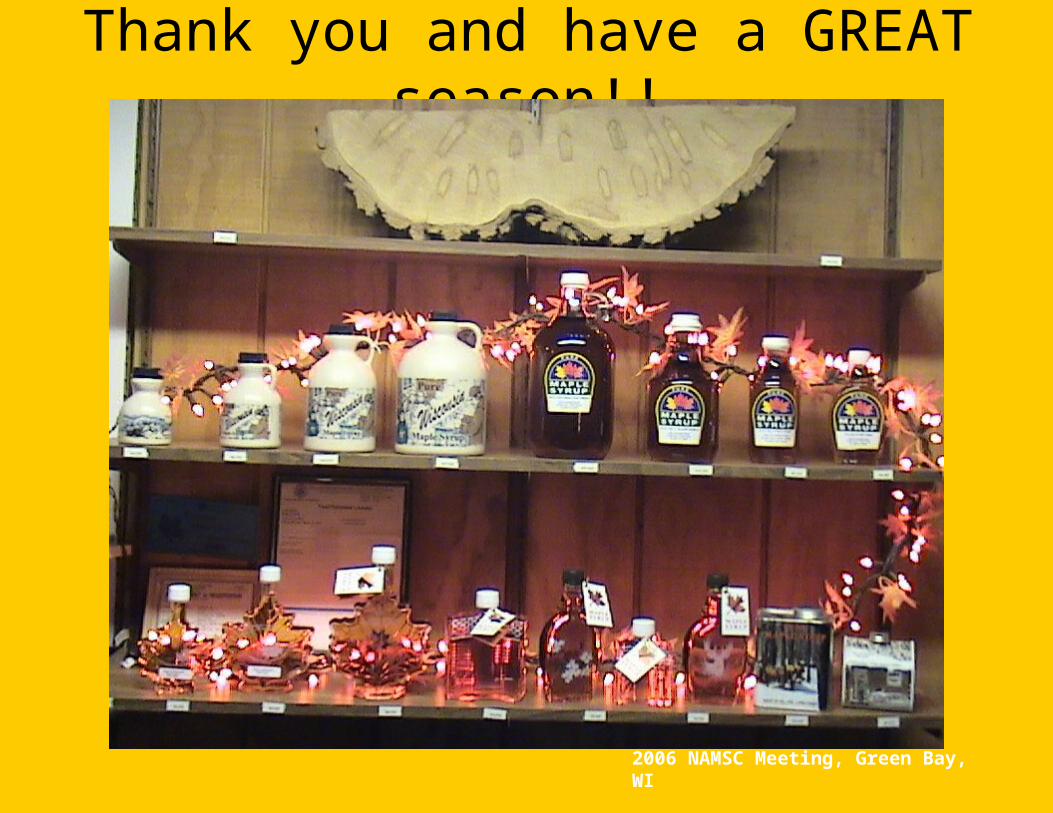
Thank you and have a GREAT season!!
2006 NAMSC Meeting, Green Bay, WI