usage of gbs - cornell...
TRANSCRIPT

Usage Cases of GBS
Jeff Glaubitz ([email protected])Senior Research Associate, Buckler Lab, Cornell University
Panzea Project Manager
Cornell CBSU WorkshopOct 31‐Nov 1, 2011

• Marker discovery• Linkage mapping of QTL in a biparental cross• Fine‐mapping QTL• Bulked segregant analysis• Genomic selection • Genome Wide Association Studies (GWAS)• NAM‐GWAS• Improving reference genome assembly• Phylogeny/Kinship
Some potential applications of GBS Data

< 450 bp
ApeKI site (GCWGC)( ) 64‐base sequence tag
Loss of cut site
B73
Mo17
Marker Discovery
• GBS markers can be converted to SNPs or PCR assays of indels• Develop SNP assays from polymorphic tags at same location• Develop PCR primers from adjacent tags & hope for large indels

Linkage mapping of QTL in a biparental cross
• In maize, we use the reference genome to order markers
• With ApeKI, too many markers for traditional software (MapMaker, JoinMap, R‐QTL etc.)
• Filter for a smaller set of markers with high coverage• Use PstI for fewer markers with higher coverage• JoinMap can handle at least 3,000 markers• Newer software? MSTMap claims 10,000 – 100,000 markers Others?
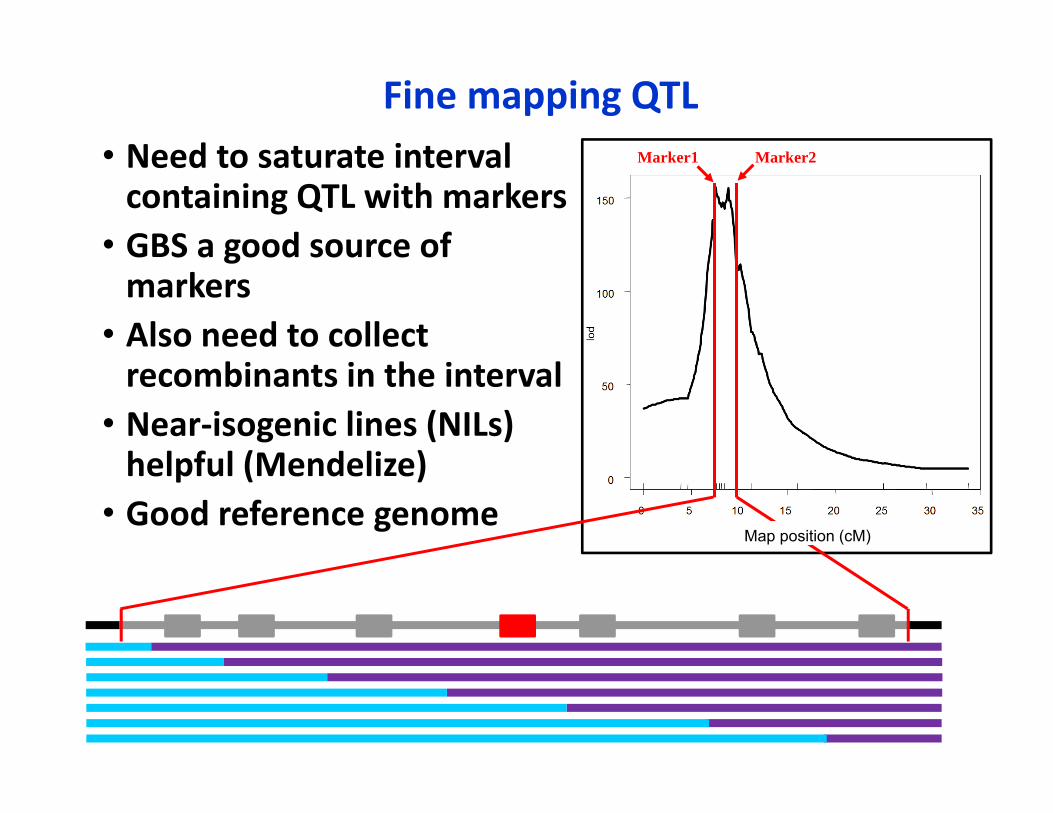
Fine mapping QTL• Need to saturate interval containing QTL with markers
• GBS a good source of markers
• Also need to collect recombinants in the interval
• Near‐isogenic lines (NILs) helpful (Mendelize)
• Good reference genome
Marker1 Marker2
Map position (cM)

Bulked Segregant Analysis
XP
F1
F2
DNA pool 1 DNA pool 2

Bulked Segregant Analysis
intermediatecolors
Color

• Complete data not required for genomic selection Closely linked markers in LD cover for each other
• In contrast, missing data are more problematic for GWAS imputation necessary, but might cause spurious results avoid false imputation of biologically missing regions area of active research
• In NAM‐GWAS, imputation is much less of an issue NAM = “Nested Association Mapping” population
Genomic Selection & GWAS

NAM
1
2
200
B73×
F1s
SSD
25 DL
B97
CM
L103
CM
L228
CM
L247
CM
L277
CM
L322
CM
L333
CM
L52
CM
L69
Hp3
01
Il14H Ki11 Ki3
Ky2
1
M16
2W
M37
W
Mo1
8W
MS
71
NC
350
NC
358
Oh4
3
Oh7
B
P39
Tx30
3
Tzi8
The maize NAM population was built for NAM-GWAS

We are using GBS to pinpoint the location of cross overs in the NAM RILs
• B73 is the reference genome: complete knowledge• Remaining NAM parents whole genome sequenced via Illumina at 4x coverage (paired end random sheared) 26 million high quality SNPs
• Precise knowledge of crossover locations in NAM RILs allows us to more accurately project sequences of parents onto RILs:
B73MS71
Z019E001
Z019E001

liguleless1 and liguleless2 explain the two “biggest” leaf angle QTL
0
0.1
0.2
0.3
0.4
0.5
0.6
0.7
0.8
0.9
BP
P
0
10
20
30
40
50
60
−log
(p)
Associations with positive effectAssociations with negative effectLinkage QTL peak
0
0.1
0.2
0.3
0.4
0.5
0.6
0.7
0.8
0.9
BP
P
0
10
20
30
40
50
60
−log
(p)
Associations with positive effectAssociations with negative effectLinkage QTL peak
0
0.1
0.2
0.3
0.4
0.5
0.6
0.7
0.8
0.9
BP
P
0
10
20
30
40
50
60
−log
(p)
Associations with positive effectAssociations with negative effectLinkage QTL peak
0
0.1
0.2
0.3
0.4
0.5
0.6
0.7
0.8
0.9
BP
P
0
10
20
30
40
50
60
−log
(p)
Associations with positive effectAssociations with negative effectLinkage QTL peak
0
0.1
0.2
0.3
0.4
0.5
0.6
0.7
0.8
0.9
BP
P
0
10
20
30
40
50
60
−log
(p)
Associations with positive effectAssociations with negative effectLinkage QTL peak
0
0.1
0.2
0.3
0.4
0.5
0.6
0.7
0.8
0.9
BP
P
0
10
20
30
40
50
60
−log
(p)
Associations with positive effectAssociations with negative effectLinkage QTL peak
0
0.1
0.2
0.3
0.4
0.5
0.6
0.7
0.8
0.9
BP
P
0
10
20
30
40
50
60
−log
(p)
Associations with positive effectAssociations with negative effectLinkage QTL peak
0
0.1
0.2
0.3
0.4
0.5
0.6
0.7
0.8
0.9
BP
P
0
10
20
30
40
50
60
−log
(p)
Associations with positive effectAssociations with negative effectLinkage QTL peak
0
0.1
0.2
0.3
0.4
0.5
0.6
0.7
0.8
0.9
BP
P
0
10
20
30
40
50
60
−log
(p)
Associations with positive effectAssociations with negative effectLinkage QTL peak
0
0.1
0.2
0.3
0.4
0.5
0.6
0.7
0.8
0.9
BP
P
0
10
20
30
40
50
60
−log
(p)
Associations with positive effectAssociations with negative effectLinkage QTL peak
lg1 lg3 lg2 lg4
Upper leaf angle
1020
1 2 3 4 5 6 7 8 9 10
cM/M
b
Chromosomes
Tian, Bradbury, et al 2011 Nature Genetics

Recombination Rates for NAM from GBS Data
Peter Bradbury – USDA Scientist, Buckler lab, Cornell (unpublished)
Improving the maize B73 reference genome
• The B73 reference genome accurate for B73 but less so for other maize lines (e.g., Mo17)
• Even for B73, some regions of the genome are in the wrong place
• Some large (multiple BAC) contigs could not be anchored assigned to “chromosome 0” 30 chr0 contigs in B73 RefGenV1 17 chr0 contigs in B73 RefGenV2
• Some regions of the genome are missing ≈5% of B73 sequence is not in the B73 reference genome

< 450 bp
ApeKI site (GCWGC)( ) 64‐base sequence tag
Loss of cut site
B73
Mo17
Most tags can be mapped as individual alleles• In a biparental cross such as maize IBM (B73 x Mo17)
• Provided that they are polymorphic between the parents

Genetically Mapping Individual GBS AllelesSNPs (e.g., from Illumina 55K chip)
RIL
s (e.
g., f
rom
IBM
)
B73 Mo17 Heterozygote

Genetically Mapping Individual GBS AllelesSNPs (e.g., from Illumina 55K chip)
RIL
s (e.
g., f
rom
IBM
)
B73 Mo17 Heterozygote

Genetically Mapping Individual GBS AllelesSNPs (e.g., from Illumina 55K chip)
RIL
s (e.
g., f
rom
IBM
)
SNP being testedB73 Mo17 Heterozygote

Genetically Mapping Individual GBS AllelesSNPs (e.g., from Illumina 55K chip)
( ) 64‐base sequence tag (GBS coverage ~0.4x)R
ILs (
e.g.
, fro
m IB
M)
SNP being testedB73 Mo17 Heterozygote

Genetically Mapping Individual GBS AllelesSNPs (e.g., from Illumina 55K chip)
( ) 64‐base sequence tag (GBS coverage ~0.4x)R
ILs (
e.g.
, fro
m IB
M)
SNP being testedB73 Mo17 Heterozygote
Binomial Test for linkageprob. success: segregation ratio of the SNP being tested (~0.5)
n trials: n RILs with GBS tag (10)
n successes: n co‐occurrences with presumed parental allele at SNP being tested (co‐segregation)
p‐value: 0.00098 (<10‐3)

Genetically Mapping Individual GBS AllelesSNPs (e.g., from Illumina 55K chip)
( ) 64‐base sequence tag (GBS coverage ~0.4x)R
ILs (
e.g.
, fro
m IB
M)
B73 Mo17 Heterozygote These 10 SNPs all tie

Genetically Mapping Individual GBS Alleles in IBM

B73 reference genome highly accurate for B73…
• 0.4% of B73 tags genetically map to different chromosome than they align to

B73 reference genome highly accurate for B73…
…but far less so for other maize lines
• 9.3% of Mo17 tags genetically map to different chromosome than they align to

Only 50% of the maize genome is shared between two varieties
Fu & Dooner 2002, Morgante et al. 2005, Brunner et al 2005Numerous PAVs and CNVs - Springer, Lai, Schnable in 2010
50%
Plant 1
Plant 2 Plant 3
99%
Person 1
Person 2 Person 3
Maize Humans

Some chunks of the B73 reference genome are in the wrong place
Physical Chr
Start(Mb)
End(Mb)
GeneticChr
Approx. GeneticLocation (Mb) # Tags
10 139.3 139.8 2 16.5–16.8 49
9 102.5 106.9 9 15–32 49
7 150.1 161.8 5 192–214 13
10 0.2 0.4 4 83–151 12
8 48.4 50 2 61–127 12
10 0.07 0.2 7 47–100 9
2 231.2 231.2 7 18–26 8
3 228.1 230.5 5 194–212 6

Improving the maize B73 reference genome
• The B73 reference genome accurate for B73 but less so for other maize lines (e.g., Mo17)
• Even for B73, some regions of the genome are in the wrong place
• Some large (multiple BAC) contigs could not be anchored assigned to “chromosome 0” 30 chr 0 contigs in B73 RefGenV1 17 chr 0 contigs in B73 RefGenV2
• Some regions of the genome are missing ≈5% of B73 sequence is not in the B73 reference genome

Some contigs are on “Chr0” & some chunks are missing from the B73 assembly• The sequence of Chr0 contigs is known
so we know which ApeKI GBS tags are there
• De novo contigs are being constructed from WGS*• Created a pipeline to genetically map novel contigs using linkage populations
• Used IBM GBS data for proof of concept Genetically anchored 20% of full length cDNAs (407 novel) 8 of 17 chromosome 0 contigs in B73 RefGenV2 Small proportion (>70,000) of the de novoWGS contigs of B73 & Mo17 (as most of these 5 million contigs are very small)
* B73 (454), FLcDNA: Shiran Pasternak, Josh Stein, Andrew Olson, Doreen Ware (CSHL)Mo17 (Illumina GAII): Hainan Zhao, Jinsheng Lai (Chinese Agricultural Univ.)

< 450 bp
ApeKI site (GCWGC)( ) 64‐base sequence tag
B73
Improving the reference genome
contig
de novo (e.g., from 454 or Illumina sequence)
Novel? (not included in B73 RefGen_v2)

SNPs (e.g., from Illumina 55K chip)( ) 64‐base sequence tag (GBS coverage ~0.4x)
RIL
s (e.
g., f
rom
IBM
)
B73 Mo17 Heterozygote These 3 SNPs tie
Improving the reference genome

Improving the reference genome
p < 10‐7

>70% contigs genetically map to within 1 Mb of true position
• This is just with the IBM population• Will vastly improve with NAM

Genetically Mapping Individual GBS Alleles in IBM

Some regions of reference genome are missing large chunks
Telomere of Chr4 is a prime target for futureimprovement

This coming year – Improving the genome
• Add in GBS data from NAM for much higher resolution Anchor as many novel genes & contigs as possible
• Reorder contigs within BACs by LD (HapMapV2) & using GBS data from linkage populations (NAM & IBM) Also check order and orientation of BACs themselves

Phylogeny/Kinship• Missing data not an issue for estimating pairwise genetic distance or kinship Each pair of individuals has large, “random” sample of markers in common
• Works really well even in non‐model organisms Fei Lu will speak next on his pipeline for switchgrass
• Principle Coordinates Analysis better than Principle Components Analysis Uses distance matrix rather than every genotype Missing data not an issue for Prin. Coord. Analysis
• SNPs can be strongly affected by ascertainment bias Panel used to discover the SNPs can severely distort estimates of population genetic parameters (e.g., kinship, diversity) Industry SNPs on the Maize 55K SNP chip an extreme example

Less Ascertainment Bias than SNPs?
Dr. Ram Sharma – Visiting Scientist, Buckler lab, Cornell (unpublished)

• Marker discovery• Linkage mapping of QTL in a biparental cross• Fine‐mapping QTL• Bulked segregant analysis• Genomic selection • Genome Wide Association Studies (GWAS)• NAM‐GWAS• Improving reference genome assembly• Phylogeny/Kinship
Fei Lu will speak next on his pipeline for switchgrass
Some potential applications of GBS Data