usability engineering: the surface becomes the (touch) screen€¦ · usability engineering: the...
TRANSCRIPT
Usability engineering: The surface becomes the (touch) screen
Erik Klaas, Co-Founder, 8tree, Germany
Arun Chhabra, Co-Founder, 8tree, USA
Pia Böttcher, Business Development, 8tree, UK
www.8-tree.com
Abstract
This paper is about how the use of augmented reality (AR) techniques can change the way we use
measurement equipment. Three applications are presented to demonstrate how much easier, faster
and more intuitive an inspection task gets through gesture control (GC) and presenting information
on the inspected surface. We demonstrate these principles with the example of a fastener flushness
measurement system for the aerospace industry and demonstrate with a Gage R&R test that results
are repeatable and reproducible, meaning there is only very little operator variation. This has been
and still is a big problem when using manual dial gages for the same purpose.
From usability engineering we know that there are 3 important limits to device response times: 0.1
second for immediate response, 1 second for uninterrupted user workflow and 10 seconds for
keeping a user’s attention. It will be explained what these limits mean when working with
measurement equipment and why we think it’s important to meet these criteria for an effective
workflow which results in better user experience and ultimately in better inspection results.
The examples are based on a very fast structured light scanner that integrates very application
specific inspection software to address chronic and well-defined application problems -- in this case
inspection flushness of fasteners, gap and flush of assembled parts and small dents in smooth
surfaces. The common approach of all three examples is that the inspection is based on a
combination of extracting 2d and 3d features and very rapidly presenting inspection results as a
colored projection overlay directly on the inspected part. The whole process of scan, analysis and
display of results is completed within a couple seconds. For an operator accustomed to long
evaluation and interpretation cycles, such AR techniques enable instant analysis. Also there is no
need to transfer results from a computer screen to the matching areas of a part as the results are
displayed right next to where the measured features are.
While AR obsoletes the traditional computer monitor display, GC techniques and touch-screens can
do the same for keyboards and mice. This allows for a more intuitive user-experience when
initializing and triggering the measurement process. As people get more and more familiar with
touchscreens, we think GC will mark the next natural evolution of how we interact with devices. We
will present how this idea is implemented on an AR-enabled dent inspection application to give
information about surface deformation right at your fingertips.
The third novelty of the examples we describe, is that they are, to our knowledge, the first
completely self-contained white-light scanners with integrated AR and GC. With seamlessly
integrated battery and CPU on board, these systems are ready to use out-of-the-box in seconds.
Usability Engineering: The surface becomes the (touch) screen
page 2/12
1 White Light Scanning White light scanning has become a well-established tool in the past decade for many different
applications such as 3d digitizing (turning real world objects into 3d models) and 3d inspection and
measuring (comparing scan data to CAD models). Fields of use are as versatile, including automotive,
aerospace, archaeology, cultural heritage, life-science and medical applications. This section outlines
the basic principle of operation, resulting output and associated limitations of white-light scanning.
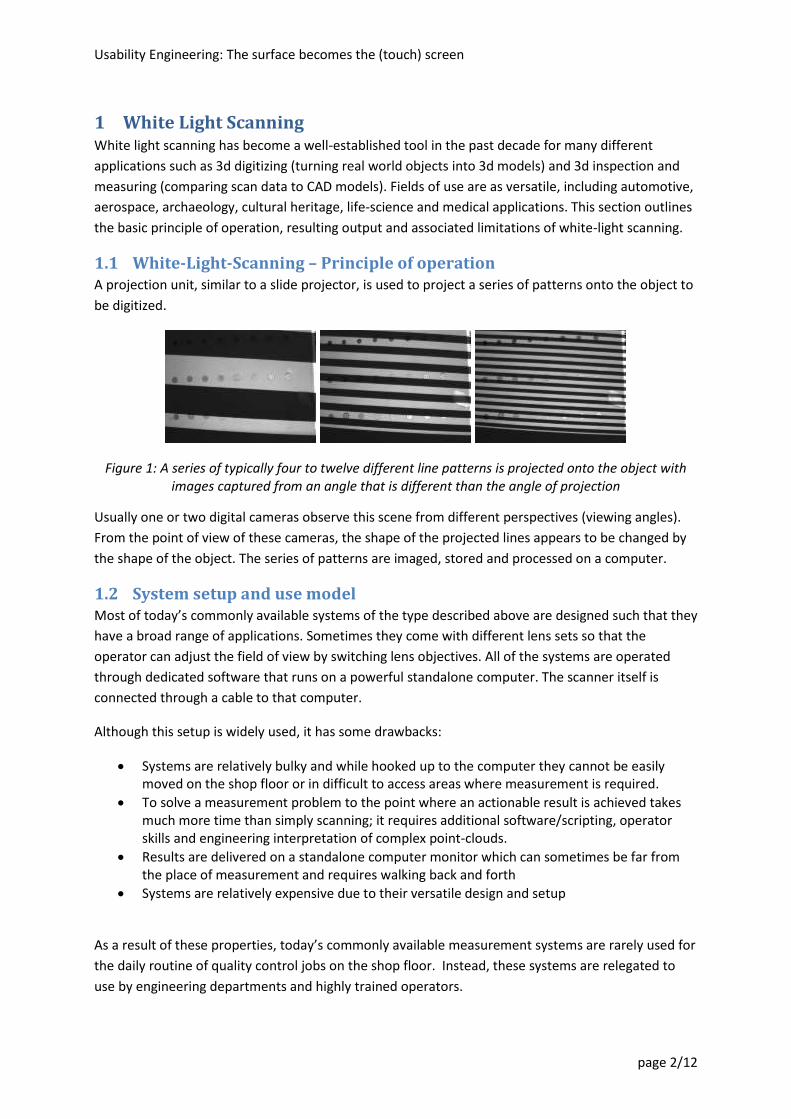
1.1 White-Light-Scanning – Principle of operation A projection unit, similar to a slide projector, is used to project a series of patterns onto the object to
be digitized.
Figure 1: A series of typically four to twelve different line patterns is projected onto the object with images captured from an angle that is different than the angle of projection
Usually one or two digital cameras observe this scene from different perspectives (viewing angles).
From the point of view of these cameras, the shape of the projected lines appears to be changed by
the shape of the object. The series of patterns are imaged, stored and processed on a computer.
1.2 System setup and use model Most of today’s commonly available systems of the type described above are designed such that they
have a broad range of applications. Sometimes they come with different lens sets so that the
operator can adjust the field of view by switching lens objectives. All of the systems are operated
through dedicated software that runs on a powerful standalone computer. The scanner itself is
connected through a cable to that computer.
Although this setup is widely used, it has some drawbacks:
Systems are relatively bulky and while hooked up to the computer they cannot be easily moved on the shop floor or in difficult to access areas where measurement is required.
To solve a measurement problem to the point where an actionable result is achieved takes much more time than simply scanning; it requires additional software/scripting, operator skills and engineering interpretation of complex point-clouds.
Results are delivered on a standalone computer monitor which can sometimes be far from the place of measurement and requires walking back and forth
Systems are relatively expensive due to their versatile design and setup
As a result of these properties, today’s commonly available measurement systems are rarely used for
the daily routine of quality control jobs on the shop floor. Instead, these systems are relegated to
use by engineering departments and highly trained operators.
Usability Engineering: The surface becomes the (touch) screen
page 3/12
Further below we suggest some changes to the design, setup and use model that overcome the
shortcomings mentioned above.
2 Usability Engineering At this point we want to introduce a few points that are important when assessing how “usable” a
measurement system is.
A great deal of attention is paid to the accuracy and repeatability of results delivered by a
measurement system. It is commonly agreed that this factor is of ultimate importance. However, in
giving it such over-arching priority, basic usability aspects are sorely overlooked. Further below, we
examine two prime usability examples. The first example addresses ease-of-use when operating a
system. The second example highlights the importance of producing results that are meaningful,
readily understood and immediately actionable in the form of a pass/fail or go/no-go decision. By
overlooking such usability factors, traditional systems deliver a negative operator-experience and
yield very poor inspection efficiency.
2.1 Speed: make it fast! From usability engineering we know that there are 3 important limits to device response times:
0.1 seconds: for immediate response If a response is 0.1 s or faster the user doesn´t perceive any delay and experiences immediate response. Common examples of this can be seen when adjusting the volume on a radio or changing a channel on TV
1 second: for uninterrupted user workflow For more involved operations, a user will typically allow up to 1 s of time, before shifting their thoughts away from the task at hand. In such cases, it is not necessary to inform the user about progress
10 seconds: for keeping users attention When response times approach 10 s, it becomes important that the user receives feedback on the progress of the process, in order to retain their attention. Displaying a progress bar serves this purpose adequately. Response time delays greater than 10s should be avoided if the goal is to deliver a continuous workflow experience. Exceeding this time increases the risk that the user is distracted with other things which would impact the quality of his work.
It’s important to keep these limits in mind when designing and using a measurement system, as well
as in any other computerized system.
When designing our new systems, we emphasized on maintaining immediate (0.1s) or uninterrupted
user workflow (1s), while still delivering high-measurement quality.
2.2 Simplicity: keep it simple! Everybody recognizes simple and easy systems very quickly, but making simple systems can be
complex. It’s about finding the right balance between functionality and ease of use. Many engineers
like to squeeze in too many features that eventually end up making the system complex, and thereby
limiting adoption.
A few factors that help drive simpler design include:
Usability Engineering: The surface becomes the (touch) screen
page 4/12
Fewer mouse clicks
Less parameter settings
No operation modes
No complex menus
Hard wired buttons instead of software keys
Immediate response, little latency
2.3 Control: put the user in the driver’s seat! It’s really important for a good experience that the user is in control all the time. So in order to
achieve this, processes have to be short and feedback of results needs to be quick. If this can´t be
accomplished because of complex and time consuming calculations, then the user needs to be kept
informed about what is going on and how long it is going to take. Progress bars are a typical way to
accomplish this. But if the user decides that he wants to terminate this time consuming process and
he wants to start over again, this should be possible at all times. Thus, to keep the user in control, it
is important to:
Keep processes short
Keep the user informed about the progress, if processes are long
Always allow the user to interrupt the process
3 Augmented Reality Augmented reality (AR), as defined by Wikipedia is “a live, direct or indirect, view of a physical, real-
world environment whose elements are augmented by computer-generated sensory input such as
sound, video, graphics or GPS data” (http://en.wikipedia.org/wiki/Augmented_reality)
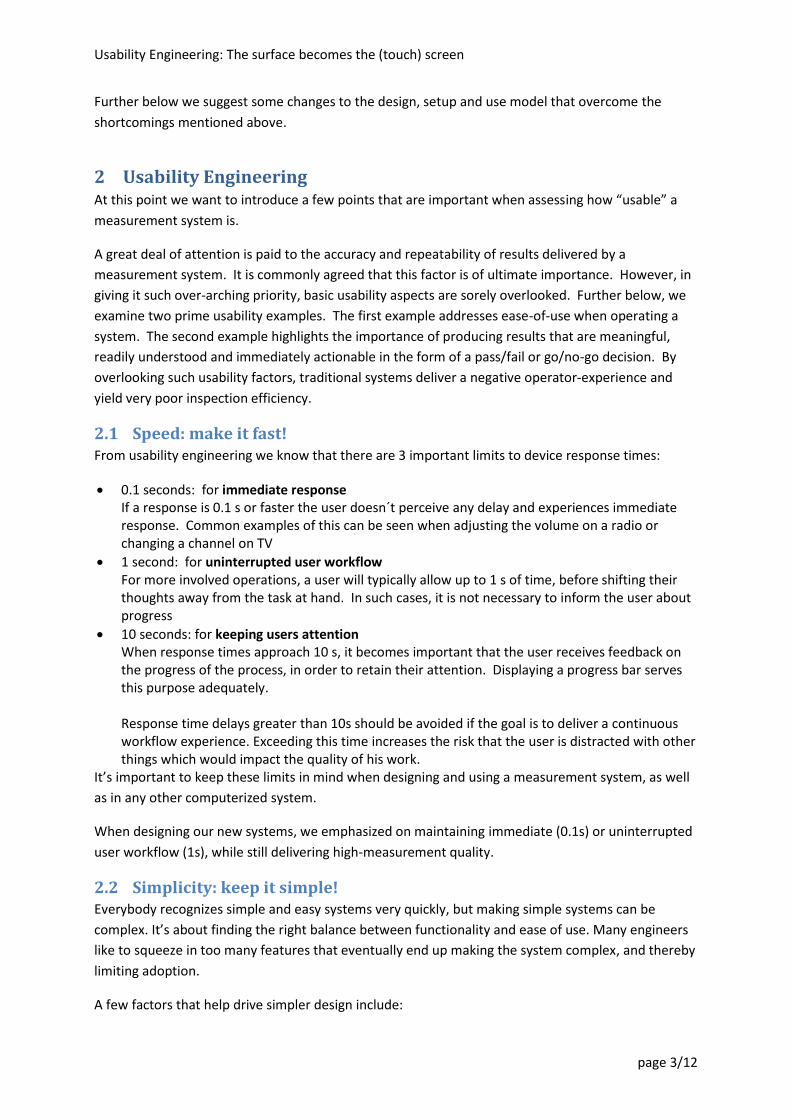
We know use cases of AR well (but maybe not the term AR so much) from today’s sports telecasting:
Examples including the yellow "first down" line seen in television broadcasts of American football
games showing the line that the offensive team must cross to receive a first down. AR is also used in
association with many other sporting events to show commercial advertisements overlaid onto the
view of the playing area.
Figure 2: AR overlay of commercials and the yellow line in sports broadcasting
Usability Engineering: The surface becomes the (touch) screen
page 5/12
We think it is a great concept for many applications, but to our knowledge one that is rarely used for
any measurement device.
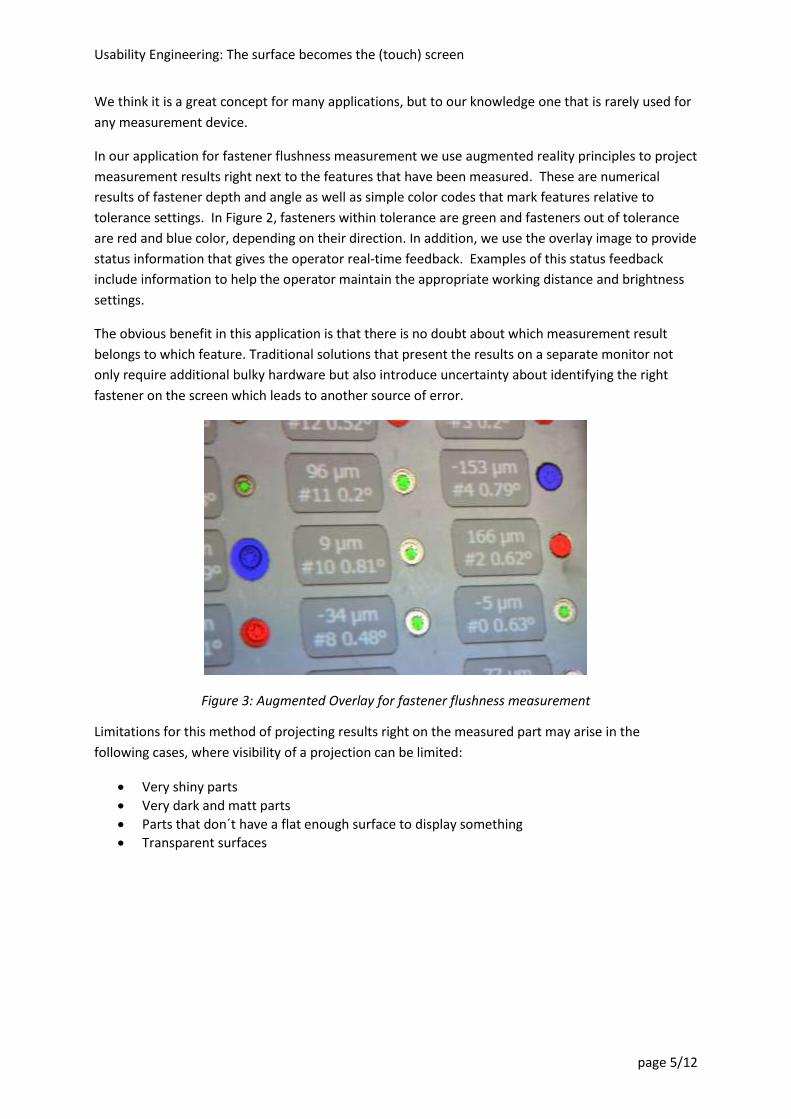
In our application for fastener flushness measurement we use augmented reality principles to project
measurement results right next to the features that have been measured. These are numerical
results of fastener depth and angle as well as simple color codes that mark features relative to
tolerance settings. In Figure 2, fasteners within tolerance are green and fasteners out of tolerance
are red and blue color, depending on their direction. In addition, we use the overlay image to provide
status information that gives the operator real-time feedback. Examples of this status feedback
include information to help the operator maintain the appropriate working distance and brightness
settings.
The obvious benefit in this application is that there is no doubt about which measurement result
belongs to which feature. Traditional solutions that present the results on a separate monitor not
only require additional bulky hardware but also introduce uncertainty about identifying the right
fastener on the screen which leads to another source of error.
Figure 3: Augmented Overlay for fastener flushness measurement
Limitations for this method of projecting results right on the measured part may arise in the
following cases, where visibility of a projection can be limited:
Very shiny parts
Very dark and matt parts
Parts that don´t have a flat enough surface to display something
Transparent surfaces

Usability Engineering: The surface becomes the (touch) screen
page 6/12
4 Hand gesture recognition Gesture recognition (GR1) is a topic in computer science and language technology with the goal of
interpreting human gestures via mathematical algorithms. It enables humans to communicate with
the machine and interact naturally without any mechanical devices like a keyboard or computer
mouse. It is now possible to trigger the measurement and change other necessary settings by using
only hand gestures.
Like Augmented Reality, Gesture Recognition technology is being widely adopted in other industry
domains like gaming, robotics or medical applications.
Figure 4: Example Applications using Gesture Recognition
The advantages of this technology can also be utilized for a measurement system
Intuitive operation
Natural and easy to learn hand gestures
No additional hardware (remotes, keyboards, batteries, etc.) necessary
5 Putting it all together Combining all of the above ideas and features in a system by following the principles of Usability
Engineering also in the system design, results in a completely self-contained measurement device:
The system can be operated without keyboard or display
All components including battery and PC are integrated in the sensor head
Measurement protocols can be pre-loaded or read via QR Barcode on route card
5.1 The fastCHECK system Based on a scalable hardware platform 8tree has developed a range of products that incorporate all
of the above features. The fastCHECK system for checking fastener flushness on aerospace parts will
be used to demonstrate the capabilities of such a system as well as to prove repeatability and
reproducibility of the measurement results.
1 http://en.wikipedia.org/wiki/Gesture_recognition
EU Project ERICA: Evaluating human-robot interaction
Microsoft Kinect Surgeon manipulates brain images during operation (Ben Gurion University)
Usability Engineering: The surface becomes the (touch) screen
page 7/12
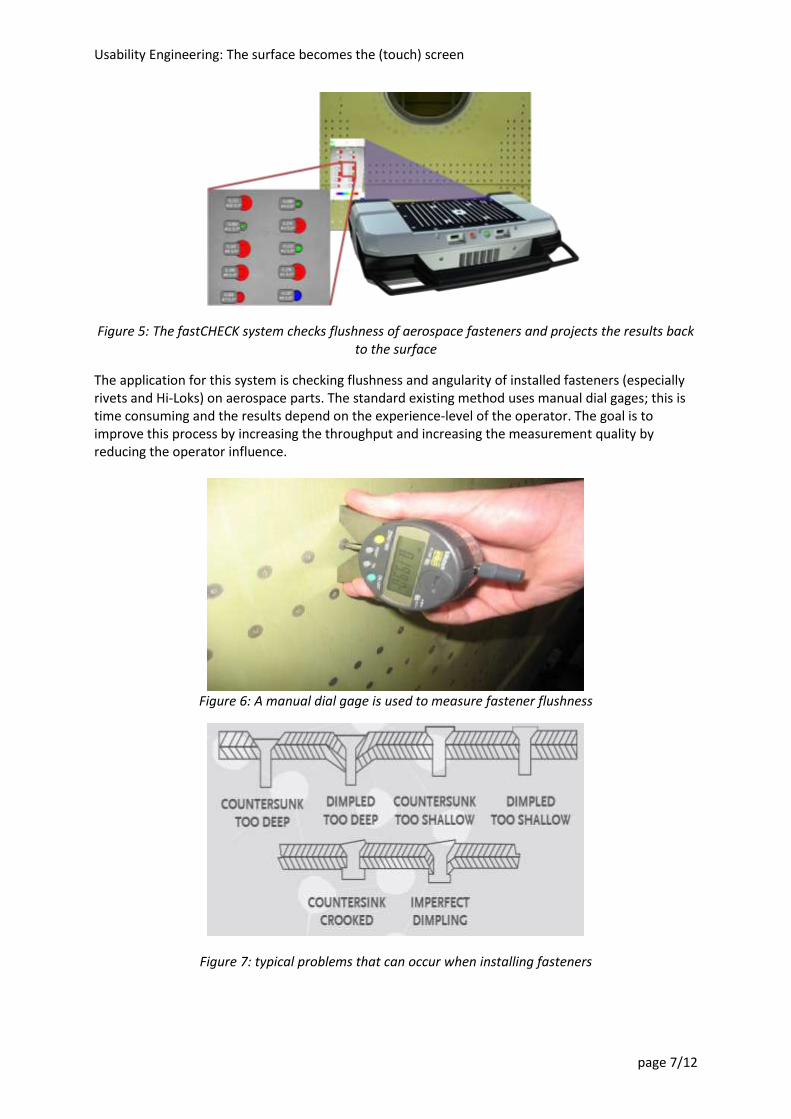
Figure 5: The fastCHECK system checks flushness of aerospace fasteners and projects the results back to the surface
The application for this system is checking flushness and angularity of installed fasteners (especially rivets and Hi-Loks) on aerospace parts. The standard existing method uses manual dial gages; this is time consuming and the results depend on the experience-level of the operator. The goal is to improve this process by increasing the throughput and increasing the measurement quality by reducing the operator influence.
Figure 6: A manual dial gage is used to measure fastener flushness
Figure 7: typical problems that can occur when installing fasteners
Usability Engineering: The surface becomes the (touch) screen
page 8/12
The system uses a structured light approach and projects a sequence of different patterns within 0.1
s. The light color can be adjusted to match the color of the measured surface2. Then, the system
identifies the fasteners from the 2d image and builds a reference plane around each fastener making
use of the 3d coordinates available at every camera pixel.
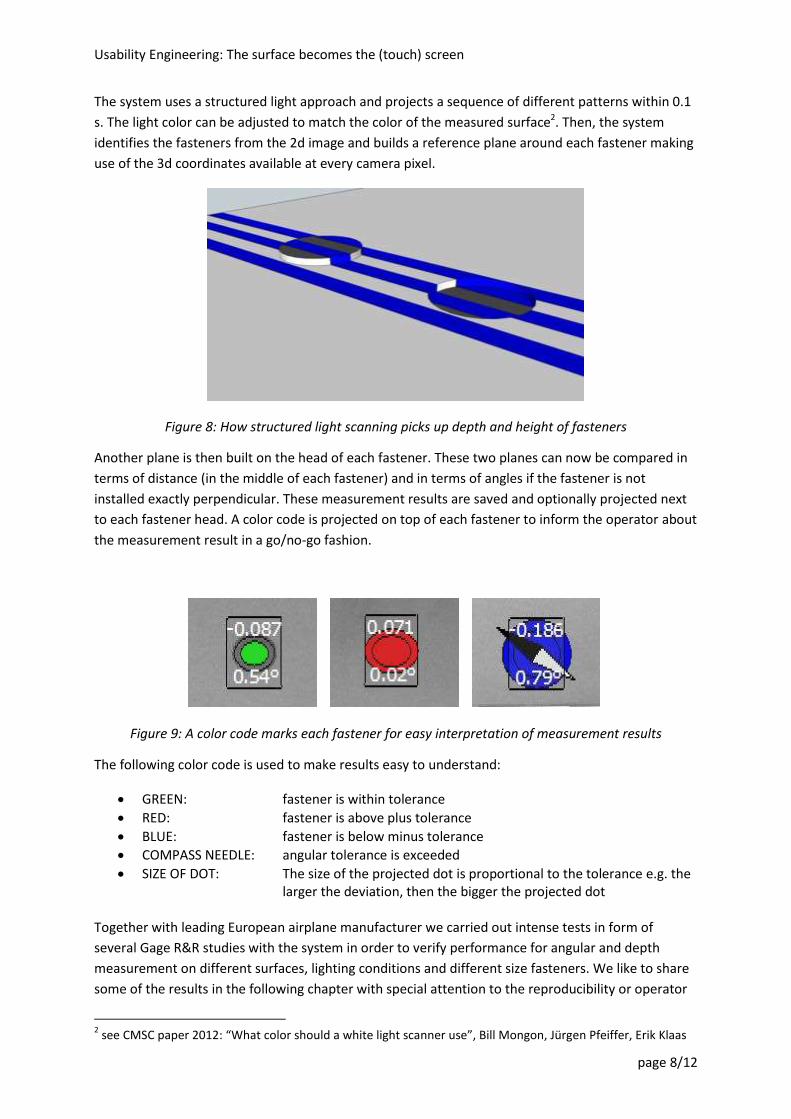
Figure 8: How structured light scanning picks up depth and height of fasteners
Another plane is then built on the head of each fastener. These two planes can now be compared in
terms of distance (in the middle of each fastener) and in terms of angles if the fastener is not
installed exactly perpendicular. These measurement results are saved and optionally projected next
to each fastener head. A color code is projected on top of each fastener to inform the operator about
the measurement result in a go/no-go fashion.
Figure 9: A color code marks each fastener for easy interpretation of measurement results
The following color code is used to make results easy to understand:
GREEN: fastener is within tolerance
RED: fastener is above plus tolerance
BLUE: fastener is below minus tolerance
COMPASS NEEDLE: angular tolerance is exceeded
SIZE OF DOT: The size of the projected dot is proportional to the tolerance e.g. the larger the deviation, then the bigger the projected dot
Together with leading European airplane manufacturer we carried out intense tests in form of
several Gage R&R studies with the system in order to verify performance for angular and depth
measurement on different surfaces, lighting conditions and different size fasteners. We like to share
some of the results in the following chapter with special attention to the reproducibility or operator
2 see CMSC paper 2012: “What color should a white light scanner use”, Bill Mongon, Jürgen Pfeiffer, Erik Klaas

Usability Engineering: The surface becomes the (touch) screen
page 9/12
variation. This is a chronic problem in the industry when using manual dial gages: those can be pretty
accurate but show a strong influence and dependency on the person that uses it.
5.2 Gage R&R test A commonly used method to analyze the performance of a measurement system is to perform a
Gage R&R study3. In this study, a gage or measurement system is used to obtain repeated
measurements on a set of selected test samples by several operators. The two main components
generated during the study are Repeatability and Reproducibility. Repeatability represents the
variability when the system is used to measure the same sample by the same operator.
Reproducibility refers to the variability from different operators measuring the same sample. The
main purpose of a gage study is to determine how much variation in the data is specifically due to
the measurement system and whether the system meets the required performance. A gage study
helps isolate and remove other factors such as operator variation and part variation.
Several methods are available to support a gage R&R study. For example using a simple EXCEL spread
sheet that models the guidelines from the AIAG4 or using statistical software packages like Minitab®5
that performs all relevant calculations.
Typically, a gage R&R study is performed using 10 parts, 2 or 3 operators and 2 or 3 replications
(AIAG Guidelines).
During the gage R&R study the following estimates are determined expressed as percentage values
Appraiser Variation - Repeatability
Equipment Variation - Reproducibility
Combined R&R
Part Variation – variation in the set of test samples
Total Variation To establish the Repeatability and Reproducibility of a system, the variation of the measurement is
compared with the variation in the set of selected test samples.
The relations between these measures are explained in the following figure 6:
Figure 10: Combination of AV and EV to R&R in form of right angle triangle
The contribution of Equipment and Appraiser to the total variation can be expressed in terms of
statistical Variance or Standard Deviation. Additionally to the overall estimates, the distribution and
variation of the measurement data is analyzed and can be visualized.
3 E Dietrich, A Schulze, “Measurement Process Qualification”, 2011.
4 Automotive Industry Action Group
5 Minitab® is a statistics package with registered trademark of Minitab, Inc.
6 Donald J. Wheeler Blog, http://www.qualitydigest.com/inside/twitter-ed/problems-gauge-rr-studies.html
Usability Engineering: The surface becomes the (touch) screen
page 10/12
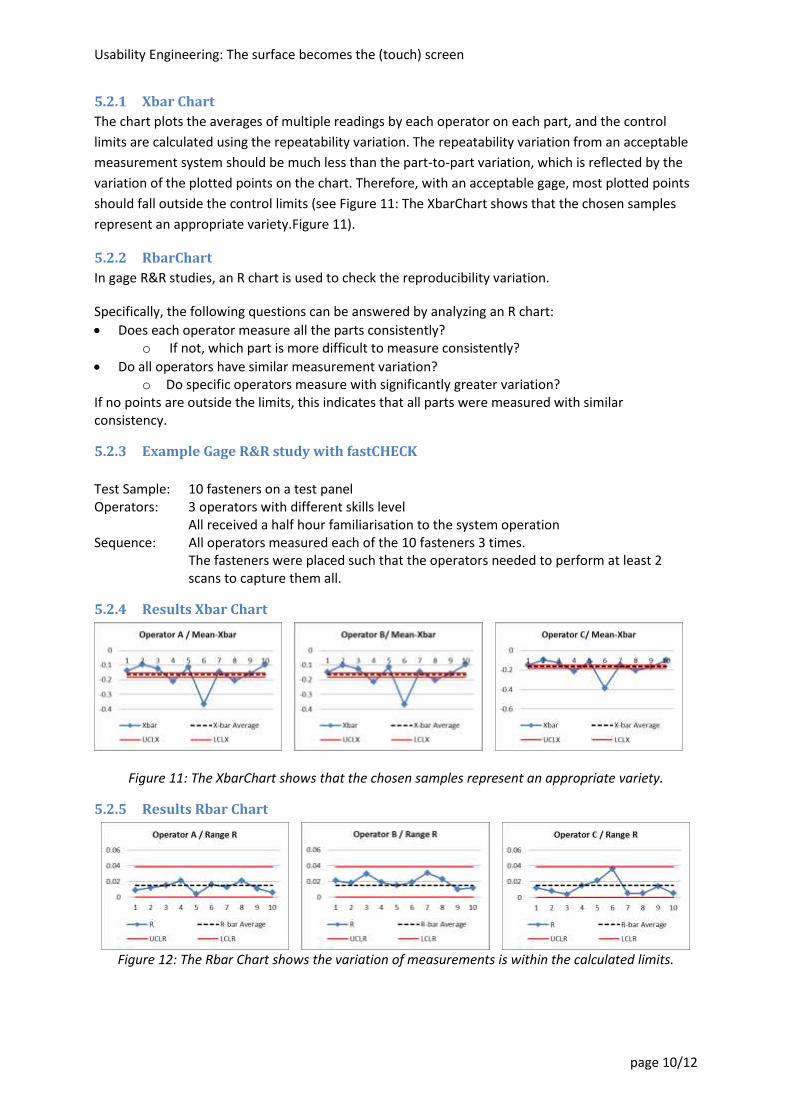
5.2.1 Xbar Chart
The chart plots the averages of multiple readings by each operator on each part, and the control
limits are calculated using the repeatability variation. The repeatability variation from an acceptable
measurement system should be much less than the part-to-part variation, which is reflected by the
variation of the plotted points on the chart. Therefore, with an acceptable gage, most plotted points
should fall outside the control limits (see Figure 11: The XbarChart shows that the chosen samples
represent an appropriate variety.Figure 11).
5.2.2 RbarChart
In gage R&R studies, an R chart is used to check the reproducibility variation.
Specifically, the following questions can be answered by analyzing an R chart:
Does each operator measure all the parts consistently? o If not, which part is more difficult to measure consistently?
Do all operators have similar measurement variation? o Do specific operators measure with significantly greater variation?
If no points are outside the limits, this indicates that all parts were measured with similar consistency.
5.2.3 Example Gage R&R study with fastCHECK
Test Sample: 10 fasteners on a test panel Operators: 3 operators with different skills level All received a half hour familiarisation to the system operation Sequence: All operators measured each of the 10 fasteners 3 times. The fasteners were placed such that the operators needed to perform at least 2
scans to capture them all.
5.2.4 Results Xbar Chart
Figure 11: The XbarChart shows that the chosen samples represent an appropriate variety.
5.2.5 Results Rbar Chart
Figure 12: The Rbar Chart shows the variation of measurements is within the calculated limits.

Usability Engineering: The surface becomes the (touch) screen
page 11/12
5.2.6 The influence of the operator
The purpose of this study is to analyse the influence of the operator in the overall measurement variation. For this we use a calculation following the Minitab® analysis. The results show the detail components of the total variation.
Source VarComp % Contribution StdDev StdDev *6 % Study Var
EV - Repeatability 0.0000664 1.07 0.00814665 0.048879898 10.41
AV – Reproducibility 0.0000135 0.22 0.003677425 0.022064552 4.70
Total Gage R&R 0.0000799 1.29 0.011824075 0.07094445 15.11
PV - Part-to-part 0.0061229 98.71 0.078249087 0.469494523 99.35
TV - Total Variation 0.0062028 100.00 0.078757927 0.472547559 100.01
Figure 13: Result table of the gage R&R study
Results:
1.07% of the total variation can be attributed to the measurement system
0.22% of the total variation can be attributed to the operator
Combined R&R is 15.11% The influence of the operator can be kept small even for a complex metrology instrument, all
thanks to applying the principles of Usability Engineering
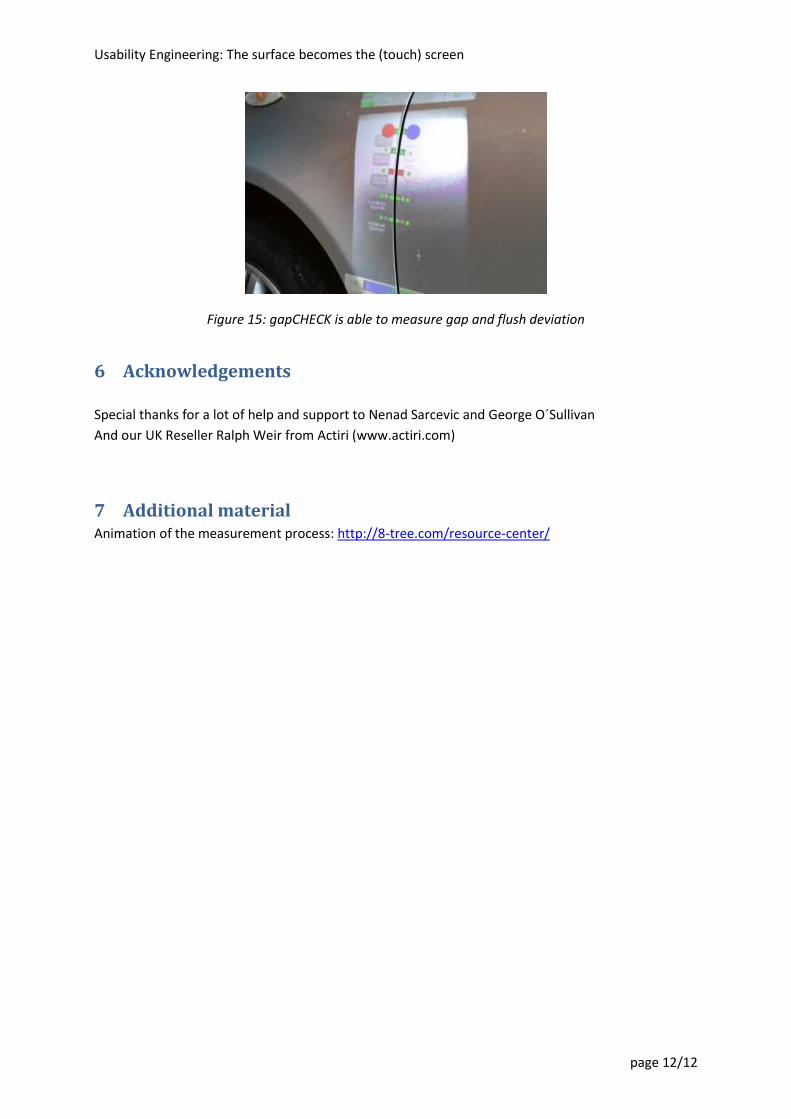
5.3 Further applications: dentCHECK and gapCHECK Currently additional products are being developed to address other measurement tasks in a similarly
intuitive and effective manner. Among these new products, two examples are highlighted below – (1)
for checking size and depth of dents in automotive or aerospace parts, and (2) measuring gap and
flush.
Figure 14: dentCHECK measures dents and project color deviation plots on the part
Usability Engineering: The surface becomes the (touch) screen
page 12/12
Figure 15: gapCHECK is able to measure gap and flush deviation
6 Acknowledgements
Special thanks for a lot of help and support to Nenad Sarcevic and George O´Sullivan
And our UK Reseller Ralph Weir from Actiri (www.actiri.com)
7 Additional material Animation of the measurement process: http://8-tree.com/resource-center/