us trailer overview - commercial vehicle industry data ... · pdf fileus trailer market...
TRANSCRIPT
US Trailer Market OverviewOrders Continue, Backlogs Solid, Production Stable…but is There Any Speculation Beginning to Occur?
Frank MalyACT RESEARCH Co., LLC
ACT Research Fall SeminarSeptember 24, 2014
Agenda• Economy and freight review
• U. S. Trailer market update
• Trailers and Fracking (Natural Gas and Oil)
• Intermodal factors
• Upcoming Outlook enhancement
• Trailer forecast 2014 ‐ 2019
2 ACT Research Co., LLC, Copyright 2014

Outlook… Slow start for 2014, better pace ahead
3 ACT Research Co., LLC, Copyright 2014
Real Gross Domestic ProductQ/Q at SAAR Q1'10 - Q4'15
Source: BEA, ACT Research Co., LLC: Copyright 2014
1 2 3 4 1 2 3 4 1 2 3 4 1 2 3 4 1 2 3 4 1 2 3 410 11 12 13 14 15
0
2
4
6
8
-2
Percent Change
+2.2% +2.1%ANNUAL
+3.2%
4 ACT Research Co., LLC, Copyright 2014
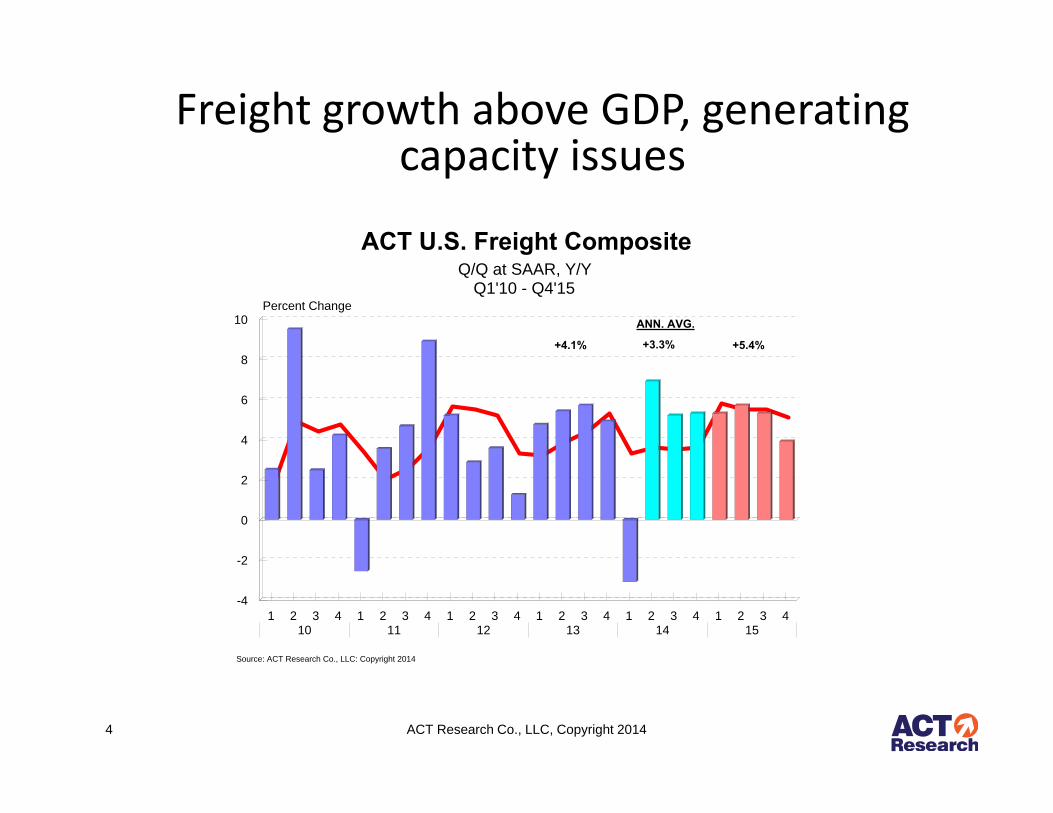
Freight growth above GDP, generating capacity issues
ACT U.S. Freight Composite Q/Q at SAAR, Y/Y
Q1'10 - Q4'15
Source: ACT Research Co., LLC: Copyright 2014
1 2 3 4 1 2 3 4 1 2 3 4 1 2 3 4 1 2 3 4 1 2 3 410 11 12 13 14 15
0
2
4
6
8
10
-2
-4
Percent Change
+4.1%
ANN. AVG.
+3.3% +5.4%

Trailer freight – positive, but slower growth until 2015
5 ACT Research Co., LLC, Copyright 2014
Dry Van Freight Composite2008 - 2015
ACT Research Co., LLC: Copyright 2014
'08 '09 '10 '11 '12 '13 '14 '1540
50
60
70
80
90
100
110
120
130Index (2004=100)
0
2
4
6
8
10
12
-2
-4
-6
Y/Y % Chg.
Y/Y % Chg.
Dry Freight Index
Reefer Van Freight Composite2008 - 2015
ACT Research Co., LLC: Copyright 2014
'08 '09 '10 '11 '12 '13 '14 '1560
70
80
90
100
110
120
130Index (2004=100)
0
2
4
6
8
10
-2
-4
Y/Y % Chg.
Y/Y % Chg.
Reefer Freight Index
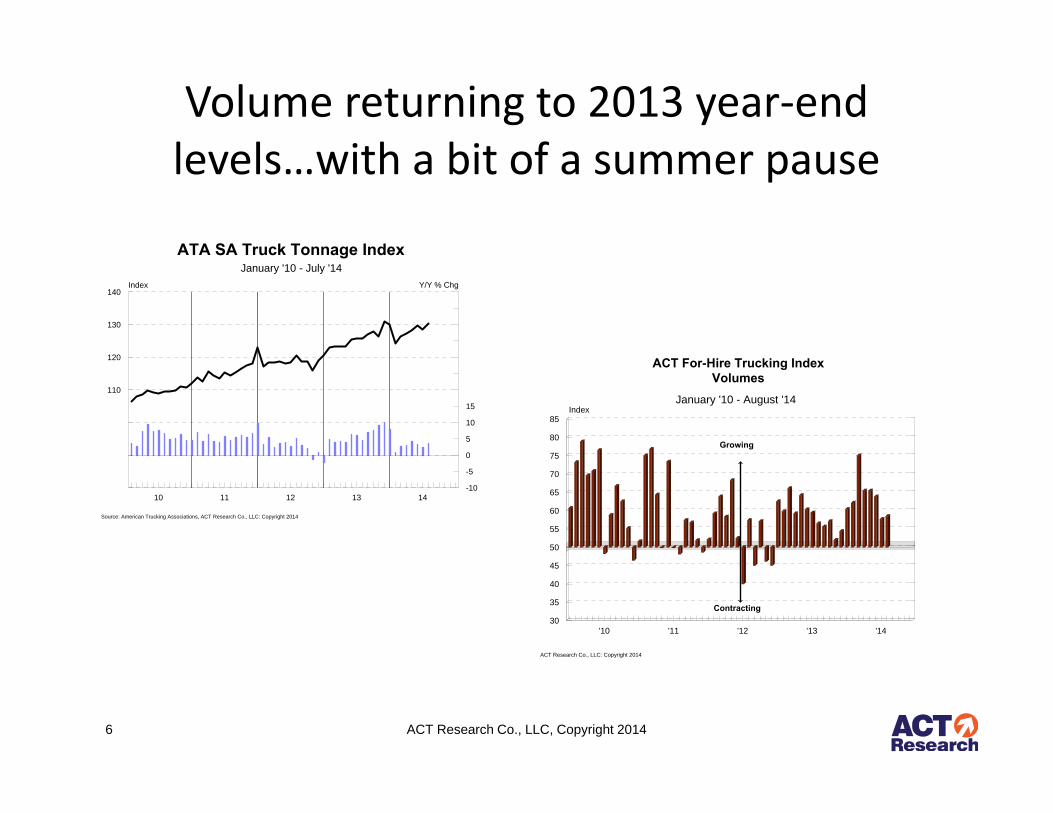
Volume returning to 2013 year‐end levels…with a bit of a summer pause
6 ACT Research Co., LLC, Copyright 2014
ATA SA Truck Tonnage IndexJanuary '10 - July '14
Source: American Trucking Associations, ACT Research Co., LLC: Copyright 2014
10 11 12 13 1480
90
100
110
120
130
140Index
0
5
10
15
20
25
30
35
40
45
50
-5
-10
Y/Y % Chg
ACT For-Hire Trucking IndexVolumes
January '10 - August '14
ACT Research Co., LLC: Copyright 2014
'10 '11 '12 '13 '1430
35
40
45
50
55
60
65
70
75
80
85Index
0
5
10
15
20
25
30
35
-5
-10
-15
-20
Growing
Contracting

ACT For‐Hire Trucking IndexCapacity adds limited by
driver availability
7 ACT Research Co., LLC, Copyright 2014
ACT For-Hire Trucking IndexFleet Capacity
January '10 - August '14
ACT Research Co., LLC: Copyright 2014
'10 '11 '12 '13 '1435
40
45
50
55
60
65Index
0
5
10
15
-5
-10
-15
Growing
Contracting
ACT For-Hire Trucking Index% Respondents Buying Equipment in Next 3 Months
January '10 - August '14
ACT Research Co., LLC: Copyright 2014
'10 '11 '12 '13 '140
10
20
30
40
50
60
70
80
90
100% of Respondents
Fleet purchase intentions remain strong

U.S. Trailer Market Update• Shipments up 7% ytd over 2014
– Van vs. Specialty Trailers continues to be a theme
– Total Vans +9%, Flats 6%, Dumps 29%, Tanks flat, Bulk 92%
• Cancellations lower y/y– Every category has a lower cancelation rate versus last year
– Fleet commitments and a long lead‐time queue
8 ACT Research Co., LLC, Copyright 2014

U.S. Trailer Market Update• 2013/2014 order season continues…
– “Seasonal slowing” has not really occurred
– YTD orders are up 40%
– Large fleets strength now moving into medium and small fleets, specialty segment
• Tight freight capacity
– Resulting upward rate pressure
– Generates better short to medium term profitability
– Ability, and need, to buy
• Productivity improvements – difficult to come by
• Component comments
– Tires/stainless/lumber availability versus pricing as the year closes
9 ACT Research Co., LLC, Copyright 2014

Total Trailers Seasonals• Orders have run stronger than the
patterns would predict• Backlogs are likely to remain
stronger through Q3/Q4
10 ACT Research Co., LLC, Copyright 2014
‐0.25‐0.20‐0.15‐0.10‐0.050.000.050.100.150.200.25 NetOrds
‐0.25‐0.20‐0.15‐0.10‐0.050.000.050.100.150.200.25 Backlog
‐0.25‐0.20‐0.15‐0.10‐0.050.000.050.100.150.200.25
Build

ACT Research Co., LLC, Copyright 201411
TRAILER INDUSTRY FACTORY SHIPMENTSJanuary '10 - July '14
ACT Research Co., LLC: Copyright 2014
10 11 12 13 140
5
10
15
20
25
30Units (000s)
CONTAINERS & CHASSIS:Monthly & 6 Mo. Avg.
TRAILERS ONLY:
Monthly &6 Mo. Avg.
• Best shipment levels since September 2006
• +1% m/m, +26% y/y, +7% ytd
• Normally, we are consuming down backlog mid-year through mid-fall
• Build season vs Order season
• Less change in backlog than anticipated – order driven

12 ACT Research Co., LLC, Copyright 2014
TOTAL TRAILERS: Past 12 Months NET ORDERS & Actual BUILD
January '10 - July '14
ACT Research Co., LLC: Copyright 2014
10 11 12 13 140
5
10
15
20
25
30Units (000s)
12MMA NO BUILD
• Order season has extended
• After remaining in a narrow band, build has broken out
• YTD new orders +41% and net orders +44%
• Build catching up with the orderboard
• Some issues with trailers on the ground

• Not an order peak as much as an extended order “hill”
• Cancellations remain low, but on a gradually upward path
• Fleets getting in the queue driven by lead times and future pricing concerns
• Extreme extended lead times could be counterproductive
13 ACT Research Co., LLC, Copyright 2014
TOTAL TRAILERS: NET ORDERS & CANCELLATION RATEJanuary '10 - July '14
ACT Research Co., LLC: Copyright 2014
10 11 12 13 14
0
5
10
15
20
25
30
35
-5
Orders (000s)
0
10
20
30
40
50
60
70
80% Cancel
NET ORDERS
CANCELLATION RATE
DRY VAN NET ORDERS & CANCELLATION RATEJanuary '10 - July '14
ACT Research Co., LLC: Copyright 2014
10 11 12 13 14
0
5
10
15
20
25
30
-5
-10
-15
Units (000s)
0
10
20
30
40
50
60
70
80
90% Cancel
% CANCEL(Right Axis)
NET ORDERS
REEFER VAN NET ORDERS & CANCELLATION RATEJanuary '10 - July '14
ACT Research Co., LLC: Copyright 2014
10 11 12 13 14
0
1
2
3
4
5
6
7
-1
Units (000s)
0
10
20
30
40
50
60
70
80
90
100
110
120
130
140
150
160% Cancel
% CANCEL(Right Axis)
NET ORDERS(Actual & SA)

• Flatbed orders continue on a gradual upward path, but adjustments to BL occurring
• Bulk tanks on a break-out…almost 50% above the average volume track
• Liquid tanks slow growth path, but well above on y/y basis
14 ACT Research Co., LLC, Copyright 2014
PLATFORM TRAILER NET ORDERS & CANCELLATION RATEJanuary '10 - July '14
ACT Research Co., LLC: Copyright 2014
10 11 12 13 14
0
1
2
3
4
5
-1
-2
-3
Units (000s)
0
10
20
30
40
50
60
70
80% Cancel
% CANCEL(Right Axis)
NET ORDERS
LIQUID TANK TRAILER NET ORDERSJanuary '10 - July '14
ACT Research Co., LLC: Copyright 2014
10 11 12 13 14
0
500
1000
1500
2000
-500
Net Orders
BULK TANK TRAILER NET ORDERSJanuary '10 - July '14
ACT Research Co., LLC: Copyright 2014
10 11 12 13 14
0
250
500
750
1000
-250
-500
Net Orders
Net Orders& 6 Mo. Avg.

15 ACT Research Co., LLC, Copyright 2014
TOTAL TRAILERS BACKLOG & BACKLOG/BUILD RATIOJanuary '10 - July '14
ACT Research Co., LLC: Copyright 2014
10 11 12 13 14
0
25
50
75
100
125
150
175
-25
-50
-75
Units (000s)
123456789101112131415161718192021
BL/BU Ratio (Months)
BACKLOG: Actual & SA
BL/BU RATIO(Right Axis)
DRY VAN BACKLOG & BACKLOG/BUILD RATIOJanuary '10 - July '14
ACT Research Co., LLC: Copyright 2014
10 11 12 13 14
0
25
50
75
100
-25
-50
Units (000s)
0
1
2
3
4
5
6
7
8
9
10
11
12
13
14
15
16
17
18BL/BU Ratio (Months)
BL/BU RATIO(Right Axis)
BACKLOG
REEFER VAN BACKLOG & BL/BU RATIOJanuary '10 - July '14
ACT Research Co., LLC: Copyright 2014
10 11 12 13 14
0
5
10
15
20
25
-5
Units (000s)
0
2
4
6
8
10
12
14
16
18
20
22
24BL/BU Ratio (Months)
BL/BU RATIO(Right Axis)
BACKLOG
PLATFORM TRAILER BACKLOG & BL/BU RATIOJanuary '10 - July '14
ACT Research Co., LLC: Copyright 2014
10 11 12 13 14
0
2
4
6
8
10
12
-2
-4
Units (000s)
1
2
3
4
5
6
7
8
9
10
11
12
13
14
15
16
17BL/BU Ratio (Months)
BL/BU RATIO(Right Axis)
BACKLOG

The Liquid and Bulk Trailers Tale…• Surge in natural gas and petroleum production• Huge surge in drilling…until late 2011• Explora on → Produc on• Cap‐ex fell on lower NG and oil prices• Shift from vertical/directional to horizontal• Speculation was flushed from orderboards• Bulk orders are now breaking out• NG prices have declined• NG stocks need to be rebuilt• Bulk tank demand more regional• No. Dakota flare gas opportunity?
– “Non‐marketed natural gas”– Roughly 30% is flared
16 ACT Research Co., LLC, Copyright 2014

• Horizontal and vertical wells• Equal in mid-09• Over 3x in ’14
• Directional…no change• Horizontal → Fracking →Freight• Evolving technology
• Deeper wells• Longer runs• Higher density
17 ACT Research Co., LLC, Copyright 2014
0
500
1,000
1,500
2,000
2,500US Rotary Rig Counts
Oil Gas Misc Total
0200400600800
1,0001,2001,4001,600
Rig Count by Trajectory
Dir. Horz Vert
• Total rig counts approaching previous peaks
• Primary oil wells have been surging
• Natural gas well counts down• Efficiency/Production versus
count

• Slow recovery from severe ‘13/’14 winter • Gap is narrowing• Added production
• Existing wells• Additional wells
• Foreign demand over and above….
18 ACT Research Co., LLC, Copyright 2014
Natural Gas stockpiles still recovering

LIQUID TANK TRAILER BACKLOG & BL/BU RATIOJanuary '10 - July '14
ACT Research Co., LLC: Copyright 2014
10 11 12 13 14
0
1
2
3
4
5
6
7
8
-1
-2
-3
Units (000s)
0
3
6
9
12
15
18
21
24
27
30
33BL/BU Ratio (Months)
BACKLOG
BL/BU RATIO(Right Axis)
Liquid and Bulk segments now have different challenges
19 ACT Research Co., LLC, Copyright 2014
BULK TANK TRAILER BACKLOG & BL/BU RATIOJanuary '10 - July '14
ACT Research Co., LLC: Copyright 2014
10 11 12 13 14
0
1
2
3
4
5
-1
-2
-3
Units (000s)
0
3
6
9
12
15
18
21
24BL/BU Ratio (Months)
BACKLOG
BL/BU RATIO(Right Axis)
• 15 Months of tight market conditions• Early year break-out on orders• Initially driven by NG price surge• Now NG production rushing to fill
storage for upcoming heating season• Oil production growth as well
• Liquid tank BL has stabilized• Production continues to be well
balanced to BL

Trailer market factors continue positive• Freight growing, capacity challenged, and “low hanging” productivity gains waning
• Improved fleet profitability and attitudes– Ability and willingness
• Fleet age has improved noticeably, and that will continue– Long‐term deferred replacement…finally making gains– Old equipment impacts customer service and productivity
• Replacement now joined by additions to the fleet• The trailer/tractor balance
– Catch up for lack of trailer investment– Order ratio high for 12 months– Build ratio reacting to that orderboard
20 ACT Research Co., LLC, Copyright 2014
10 11 12 13 14
0
5
10
15
20
25
30
-5
-10
-15
Units (000s)
0.00.51.01.52.02.53.03.54.04.55.05.56.06.57.07.58.08.59.0
Trailer:Tractor Ratio
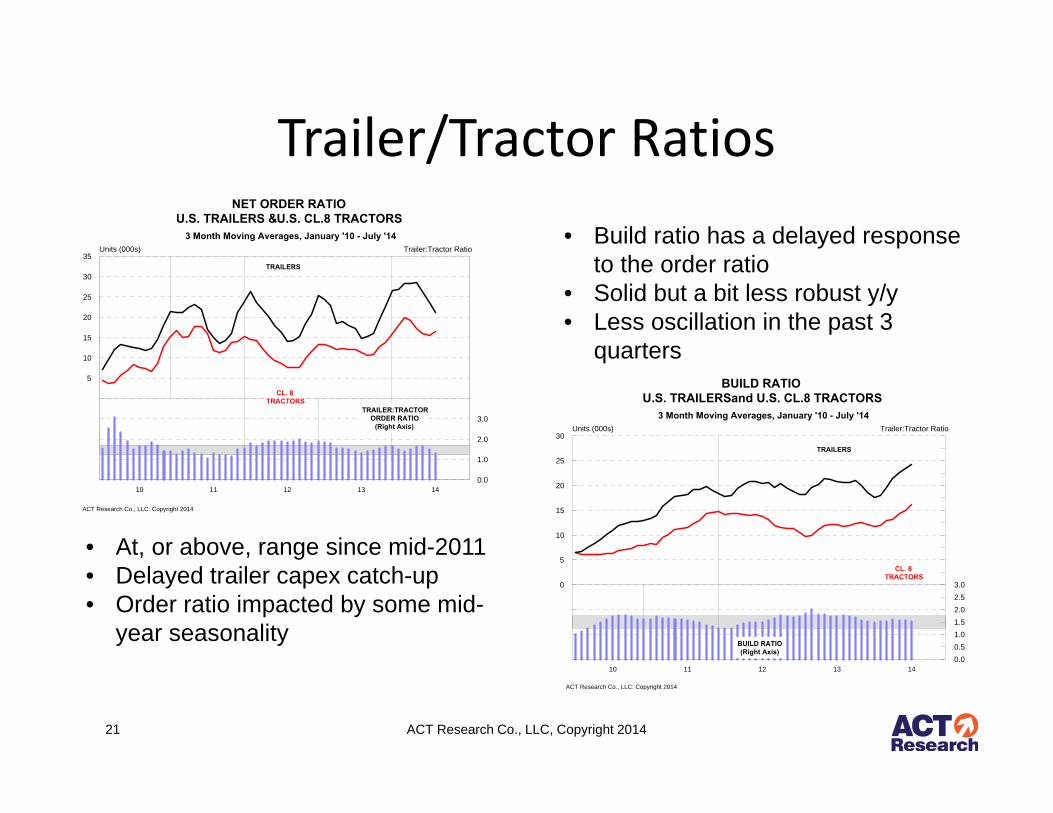
BUILD RATIOU.S. TRAILERS and U.S. CL.8 TRACTORS
3 Month Moving Averages, January '10 - July '14
ACT Research Co., LLC: Copyright 2014
CL. 8TRACTORS
TRAILERS
BUILD RATIO(Right Axis)
21 ACT Research Co., LLC, Copyright 2014
• At, or above, range since mid-2011 • Delayed trailer capex catch-up• Order ratio impacted by some mid-
year seasonality
• Build ratio has a delayed response to the order ratio
• Solid but a bit less robust y/y• Less oscillation in the past 3
quarters
Trailer/Tractor Ratios
10 11 12 13 14
0
5
10
15
20
25
30
35
-5
-10
-15
-20
Units (000s)
0.0
1.0
2.0
3.0
4.0
5.0
6.0
7.0
8.0
9.0
10.0
11.0Trailer:Tractor Ratio
NET ORDER RATIOU.S. TRAILERS & U.S. CL.8 TRACTORS
3 Month Moving Averages, January '10 - July '14
ACT Research Co., LLC: Copyright 2014
CL. 8TRACTORS
TRAILERS
TRAILER:TRACTORORDER RATIO
(Right Axis)

TOTAL TRAILERS: Factory Shipments Less Scrappage
1990 - 2020
ACT Research Co., LLC: Copyright 2014
90 92 94 96 98 00 02 04 06 08 10 12 14 16 18 20
0
25
50
75
100
125
150
-25
-50
-75
-100
-125
-150
Thousands
NET POPULATION GROWTH
NET POPULATION SHRINKAGE
TOTAL TRAILERS: Population & Average Age
1979 - 2020
ACT Research Co., LLC: Copyright 2014
80 82 84 86 88 90 92 94 96 98 00 02 04 06 08 10 12 14 16 18 201000
1200
1400
1600
1800
2000
2200
2400
2600
2800
3000
3200
3400Population (000s)
5.5
6.0
6.5
7.0
7.5
8.0
8.5
9.0
9.5
10.0
10.5
11.0
11.5Age (in Years)
AVERAGE AGE
POPULATION
Fleet growing and getting younger through the forecast From 2007 to
2011, the U.S. trailer fleet shrank by 9%, dry vans 12%
Still below pre-recession peaks
Now in third year of fleet growth
Growth impacted by driver issues and productivity gains
22ACT Research Co., LLC, Copyright 2014

23 ACT Research Co., LLC, Copyright 2014
DRY VANS: Population & Average Age
1979 - 2020
ACT Research Co., LLC: Copyright 2014
80 82 84 86 88 90 92 94 96 98 00 02 04 06 08 10 12 14 16 18 200
200
400
600
800
1000
1200
1400
1600
1800
2000Population (000s)
5.5
6.0
6.5
7.0
7.5
8.0
8.5
9.0
9.5
10.0
10.5Age (in Years)
POPULATION
AVERAGE AGE
REEFER VANS: Population & Average Age
1979 - 2020
ACT Research Co., LLC: Copyright 2014
80 82 84 86 88 90 92 94 96 98 00 02 04 06 08 10 12 14 16 18 2050
75
100
125
150
175
200
225
250
275
300
325
350
375
400Population (000s)
3.5
4.0
4.5
5.0
5.5
6.0
6.5
7.0
7.5
8.0
8.5
9.0
9.5
10.0
10.5Age (in Years)
POPULATION
AVERAGE AGE
FLATBED TRAILERS: Population & Average Age
1979 - 2020
ACT Research Co., LLC: Copyright 2014
80 82 84 86 88 90 92 94 96 98 00 02 04 06 08 10 12 14 16 18 200
25
50
75
100
125
150
175
200
225
250
275
300
325
350Population (000s)
5.0
5.5
6.0
6.5
7.0
7.5
8.0
8.5
9.0
9.5
10.0
10.5
11.0
11.5
12.0Age (in Years)
POPULATION
AVERAGE AGE

24 ACT Research Co., LLC, Copyright 2014
90 92 94 96 98 00 02 04 06 08 10 12 14 16 18 20100
120
140
160
180
200
220
240Units (000s)
TOTAL TRAILERS:Underlying Replacement Demand
1990 - 2020
ACT Research Co., LLC: Copyright 2014
90 92 94 96 98 00 02 04 06 08 10 12 14 16 18 2060
70
80
90
100
110
120
130
140Units (000s)
DRY VANS:Underlying Replacement Demand
1990 - 2020
ACT Research Co., LLC: Copyright 2014
90 92 94 96 98 00 02 04 06 08 10 12 14 16 18 2010
15
20
25
30
35Units (000s)
REEFER VANS:Underlying Replacement Demand
1990 - 2020
ACT Research Co., LLC: Copyright 2014
Fleet ProductivityThe positives and the negatives…
• Logistics/routing/tracking• Regulatory issues
– HOS/Equipment regulations– Weight/length
• Driver availability• Emissions/mileage• Intermodal All have an impact on the amount of equipment
needed
25 ACT Research Co., LLC, Copyright 2014

Intermodal• Service levels have become a major issue
– Train speed and dwell times
• Coal, petroleum, and chemical volumes consuming capacity
• Inconsistent service has negatively impacted temperature‐controlled offerings
• Recent moves toward bulk chemical transport– Addressing “driver availability issues”
26 ACT Research Co., LLC, Copyright 2014

Estimated Intermodal ImpactDomestic Container volume doubled in 10 years, but still a small part of total freight movement
TOFC was the only category down y/y in 2013
Estimate: Population impact for every 1M shift in domestic IM loads:
• Reduces need for C8 tractors by ~10k units
• Reduces the need for trailers by ~20k
• Comparable math for TOFC conversion
27 ACT Research Co., LLC, Copyright 2014
Intermodal Loads by Type1999 - 2013
Source: IANA, ACT Research Co., LLC: Copyright 2014
2.2 2.4 2.5 2.7 3.0 3.1 3.1 3.3 3.6 3.8 4.0 4.5 4.9 5.6 6.12.9 2.6 2.4 2.3 2.4 2.6 2.6 2.4 2.1 2.1 1.6
1.7 1.71.6
1.64.8 5.3 5.4 5.9
6.57.1 7.9 8.5 8.3 7.7
6.17.2
7.57.6
7.8
1999 2000 2001 2002 2003 2004 2005 2006 2007 2008 2009 2010 2011 2012 20130.0
2.0
4.0
6.0
8.0
10.0
12.0
14.0
16.0Intermodal Loads (millions)
Dom Cont Dom Trlrs Internatl Cont

Trailer Forecast Update• Outlook continues to improve, edging higher• Concerns beginning to be expressed on components
– “Shared” components, such as tires• Solid quote activity and continued order flow• Supported by
– Freight, both amount and pricing– Tight capacity – Resulting fleet profitability
• Outlook:– 2014 +10.3% / 2015 +0.6% / 2016 +3.0%
28 ACT Research Co., LLC, Copyright 2014

Longer Pups still in the cards…• 28ft vs 33ft – 18% capacity increase
– LTL / Expedited…cube out vs. weigh out
• Projected timing of new bill is mid‐15– Likely to include 33 foot pups
• Estimated 325k pup population• Timing and opportunity…
– Delay of 15k in 2014/15– Pull‐forward 15k/12k/10k in 2016‐18– “Extending” 28 foot trailers another alternative
• “Dimensional Weight” pricing – (L x H x W) / “Factor”
• Factor: FedEx – 139 UPS – 166
29 ACT Research Co., LLC, Copyright 2014

An OUTLOOK enhancement…• North America Total Trailer reporting
• Including Canada and Mexico trailer totals
• Built off our knowledge gained from Global Trailer Project
• Projected October Outlook release
30 ACT Research Co., LLC, Copyright 2014

31 ACT Research Co., LLC, Copyright 2014
U.S. TRAILER FACTORY SHIPMENTS2010 - 2019
ACT Research Co., LLC: Copyright 2014
'10 '11 '12 '13 '14 '15 '16 '17 '18 '190
50
100
150
200
250
300
350
Orders (000s)
Dry Vans Reefer Vans Flatbeds All Other Trailers
Dry Vans 60 117 130 135 153 157 170 163 160 154Reefer Vans 27 33 34 36 38 37 35 36 38 40
Flatbeds 8 16 25 22 25 25 24 23 23 23All Other Trailers 30 43 49 47 50 49 46 47 48 47
Total Trailers 126 210 237 240 266 267 275 269 269 264

32
ACT Research Company, LLC4400 Ray Boll BoulevardColumbus, IN 47203
Phone: (812) 379‐2085Fax: (812) 378‐5997
Email: [email protected]