u.s. trade policy toward china: discrimination … · u.s. trade policy toward china:...
TRANSCRIPT

U.S. TRADE POLICY TOWARD CHINA:
DISCRIMINATION AND ITS IMPLICATIONS
Chad P. Bown†
The Brookings Institution & Brandeis University
Rachel McCulloch‡ Brandeis University
Please do not quote, cite, or circulate without permission of the authors.
4 February 2005
Abstract
The bilateral relationship with China has become a major focus of U.S. trade policy. This paper examines recent U.S. policy toward imports from China, highlighting important explicitly and implicitly discriminatory elements. Discriminatory restrictions on U.S. trade with China protect competing domestic industries as well as non-Chinese foreign suppliers with an established presence in the U.S. market. Unlike discriminatory U.S. treatment of Japan in the 1980s, in which “gray-area” measures like voluntary export restraints were prominent, most U.S. actions toward China are fully consistent with current WTO rules, including the special terms of China’s 2001 WTO accession. However, as with earlier discriminatory actions directed primarily at Japan, U.S. trade policy toward China is likely to have complex effects on global trade flows and may produce outcomes far different from those intended.
JEL No. F13 Keywords: U.S. Trade Policy, China ________________
† Bown: Okun-Model Fellow in Economic Studies (The Brookings Institution) and Department of Economics and International Business School (Brandeis University). Correspondence: The Brookings Institution, 1775 Massachusetts Avenue, NW, Washington, DC 20036 USA tel: 202-797-6304, fax: 202-797-2478, email: [email protected], web: http://www.brandeis.edu/~cbown/. ‡ McCulloch: Department of Economics and International Business School (Brandeis University). Correspondence: Department of Economics, MS021, Brandeis University, Waltham, MA 02454-9110, USA tel: 781-736-2245, fax: 781-736-2269, email: [email protected] All remaining errors are our own.

1. Introduction
In a surprisingly short time, the bilateral relationship with China has come to dominate
American public and official views on globalization. The list of American grievances is
familiar: a burgeoning bilateral trade deficit, currency misalignment, accumulation of U.S.
financial assets, and various “unfair” trade practices. These were also staples of the U.S.
demonization of Japan in the 1980s, before the seemingly invincible “Japan Incorporated” began
to falter. Now China has replaced Japan as the country with the largest bilateral trade surplus
with the United States, and also as the main (though by no means only) object of American
dissatisfaction with its trading partners. Just as U.S. bilateral relations with Japan were
characterized by a wide range of discriminatory policy initiatives, China is now the object of
unprecedented discriminatory treatment in its bilateral relationship with the United States and
also as a less-than-equal member of the World Trade Organization since its accession in 2001.
This paper explores several dimensions of U.S. trade policy toward China. Section 2
examines the historical context of U.S. discriminatory trade practices, both as permitted under
GATT/WTO rules and through bilateral measures taken outside this framework. Section 3 takes
a closer look at specific U.S. policy actions toward China: antidumping, WTO accession, and
free-trade areas negotiated with China’s competitors. Section 4 compares recent U.S. treatment
of China with other major instances of U.S. trade policy discrimination, particularly toward
Japan. Section 5 considers the economic implications of the discriminatory trade policy actions,
including their impact on other trading partners. Section 6 concludes.
2

2. U.S. Trade Policy Discrimination in Historical Perspective
The United States has played a paradoxical role in the development of the post-World
War II trading system, championing the principle of nondiscrimination in world trade yet opting
for a range of discriminatory policies in its own trade regime. While promoting the most-
favored-nation (MFN) principle in the General Agreement on Tariffs and Trade (GATT), U.S.
trade officials also pioneered the use of bilateral trade measures, including voluntary export
restraints (VERs) and orderly marketing agreements (OMAs), to protect important domestic
industries adversely affected by rapidly growing imports.
These explicitly discriminatory measures, first applied to Japan and later to other newer
exporters—mostly in East Asia—to U.S. markets, clearly violated the GATT’s MFN principle.
Moreover, U.S. officials chose these measures over the non-discriminatory safeguard action
permitted under Article XIX of the GATT. Trade discrimination was also fostered through
negotiated voluntary import expansions (VIEs) with Japan and other trading partners. Although
U.S. trade officials are no longer negotiating targets for Japanese imports, quantitative trade
commitments are not entirely a thing of the past—the USTR website reports a December 2004
agreement with Korea that will guarantee a minimum volume of Korean rice exports from the
United States over a ten-year period.1
U.S. trade policy discrimination against Japan actually began even before World War II
with the negotiation in the 1930s of “voluntary” restrictions on Japanese exports to the United
States of several types of cotton textiles (Metzger 1971, 170-1). Although the imports from 1 In the Uruguay Round, Korea designated rice as a sensitive product. This allowed Korea to postpone liberalizing its restrictions on rice imports and instead commit to importing a specified quantity of rice annually through 2004. The exceptional treatment could be continued for some additional period after 2004, but Korea was required to give individual WTO Members the opportunity to negotiate concessions, i.e., specified shares in total Korean imports. In 2004 Korea held such negotiations with the United States and eight other WTO members (USTR 2005). This market-sharing arrangement appears to exclude Vietnam, an internationally competitive rice exporter but not yet a WTO member, from Korea’s rice market.
3

Japan were small relative to the U.S. market, they were nonetheless deemed a threat because of
rapidly rising volumes concentrated in a few product categories. As with later VERs, these
voluntary agreements were stimulated by U.S. threats of unilateral action. But in the early
postwar period, with its economy in tatters, Japan hardly appeared to pose a competitive threat to
U.S. industries. The United States assisted in the reconstruction Japan’s textile industry and also
championed Japan’s entry into the GATT in 1955. However, other GATT members had strong
reservations, mainly on account of Japan’s much lower wages. Fourteen countries accounting
for 40 percent of GATT trade therefore exercised their privilege under Article XXXV to refuse
to extend MFN treatment to Japan (Dam 1970, 347-8). Although the United States was not
among the GATT members who denied Japan MFN treatment, the grudging acceptance into the
GATT of Japan, a too-competitive rival in manufactured goods, foreshadowed the harsh
conditions of China’s WTO accession half a century later. By 1956, bilateral negotiations
leading to the postwar VERs on Japanese textile exports to the United States had already begun;
Canada, the United Kingdom, and the European Economic Community likewise negotiated
arrangements intended to discourage “market disruption” due to imports from Japan (Metzger
1971, 174-5).
Of course, discriminatory trade measures, whether export-restricting or import-
increasing, have important external effects on other sectors and countries. What began as
Japan’s voluntary limits on cotton textile exports to the United States and other importing
countries eventually culminated in the global Multifibre Arrangement, as unrestricted products
and later unrestricted exporting countries filled the import gap.2 The quantitative form of
2 Supporters of the GATT-sanctioned Long Term Arrangement in Cotton Textiles included pragmatic non-protectionists who believed that a gradual and “orderly” increase in the market share of new suppliers among the less-developed countries would likely be beneficial to those suppliers; the argument was that uncontrolled large
4

Japan’s VERs also promoted product upgrading and may thus have accelerated Japan’s transition
to more sophisticated manufacturing exports. We discuss these and other externalities associated
with discriminatory protection in greater detail in Section 5.
Discrimination against Japan and later China has also been implicit in U.S. application of
GATT-consistent laws on unfair trade such as antidumping, as we document in Sections 3 and 4.
Elastic criteria have made the dumping laws the most popular policy instrument for U.S.
industries seeking protection from competing imports, especially imports from transition
economies categorized as non-market economies. In recent years, China has become a major
target for antidumping action by the United States and worldwide, accounting for nearly a fifth
of all cases in 2002 (Messerlin 2004, Table 3). Because dumping margins for China are
calculated on a different basis than for most other countries and resulting antidumping duties are
usually much larger, this statistic may understate the impact of antidumping action on China’s
exports to the United States.
Other types of GATT-sanctioned practices offer preferred market access to some
countries. The original GATT agreement “grandfathered” preferential arrangements already in
place, most notably British imperial preferences favoring Commonwealth countries (Dam 1970,
14). In response to pressure from potential beneficiaries and the United Nations Conference on
Trade and Development (UNCTAD), a GATT waiver in 1971 initiated the Generalized System
of Preferences (GSP). Under the GSP, manufactured exports from less-developed countries
(LDCs) gained limited preferential access to the markets of the industrialized nations (Pearson
2004, 105). The United States initially opposed the GSP, partly on grounds that it weakened the
MFN principle but also from a more practical concern that cheap imports from LDCs would
increases concentrated in a few products were likely to trigger new trade restrictions in the major importing nations (Dam 1970, 300-1).
5

flood U.S. markets. The U.S. version of the system, finally implemented in 1976, excluded
“sensitive” sectors, notably textiles and apparel but also footwear and steel, where competition
from LDC exporters was already biting into domestic sales.3
Perhaps most important for today’s trade environment is the worldwide proliferation of
preferential, i.e., discriminatory, trade agreements. Beginning in the mid-1980s, the United
States has aggressively promoted “free trade” agreements (FTAs) with a variety of partners,
mostly but not exclusively in the western hemisphere.4 Although this drive for preferential
liberalization arose initially from U.S. frustration with the slow pace of multilateral efforts in the
GATT, efforts continued unabated during and even after the Uruguay Round of multilateral
negotiations. Such trade agreements were authorized under GATT Article XXIV, originally
intended to facilitate economic union in Europe but which has emerged as the major loophole in
the MFN principle in the World Trade Organization.5 As of 2002, 250 agreements authorized
under Article XXIV had been notified to the GATT or WTO. Of these 170 remain in force; the
WTO estimates that an additional 70 are operational but have not yet been notified.6 The United
States alone has negotiated about a dozen FTAs in addition to NAFTA and also participates in a
wide variety of looser agreements with specific trading partners (USTR web site).
3 The European Community system, implemented in 1971, did include sensitive products but limited the size of covered imports. 4 The Office of the U.S. Trade Representative uses FTA in referring to its bilateral agreements—no doubt adding to public confusion. Elsewhere such agreements are also called preferential trade agreements (PTAs) or—in WTO documents—regional trade agreements (RTAs). The latter terminology seems especially bizarre given such examples as the bilateral U.S. agreements with Israel, Singapore, and most recently Australia. So far no one has opted for a most accurate label: discriminatory trade agreement (DTA). 5 The GATT was drawn up prior to pioneering work by Viner (1950) clarifying that such arrangements were not necessarily beneficial in strictly economic terms even for the participants themselves. For those drafting the GATT articles, regional trade liberalization was seen “as a step toward free trade, partial to be sure but laudable nonetheless” (Dam 1970, 274). 6 See WTO website www.wto.org/english/tratop_e/region_e/region_e.htm, accessed 14 January 2005.
6
Any country excluded from preferential access is at an obvious disadvantage. Indeed,
preferential agreements have become so important a determinant of export success in major
markets that mere “MFN treatment” might now be more accurately described as least-favored-
nation status. U.S. trading partners including ASEAN members are contemplating FTAs with
the United States less to expand market access than to retain their current access (Naya and
Plummer, 2005).7 Some view to pressure on excluded countries to negotiated their own FTAs as
giving rise to a desirable “competitive liberalization” process, while others are less optimistic,
noting the complex and trade-distorting rules of origin such agreements typically entail as well as
the possible inhibiting effect on future multilateral liberalization (Limão 2003). Srinivasan
(2004) in fact suggests that China and India, each excluded from most of the important FTAs,
should propose repealing GATT Article XXIV and replacing this giant loophole with rules that
convert any preferential liberalization among WTO members to MFN liberalization within a
stipulated period, such as five years. But since its WTO accession China has lost no time in
negotiating its own FTAs with trading partners in the Pacific region (Antkiewicz and Whalley
2004). Talks are even underway with India, among others.
3. U.S. Trade Policy toward China: Implicit and Explicit Discrimination
In this section of the paper we present data on specific U.S. trade policies that
discriminate against China. We split our discussion into two parts. Sections 3.1 and 3.2 focus on
explicitly discriminatory trade policy, where the result of the U.S. trade policy is to raise barriers
against Chinese exporters, thus allowing exporters from other countries preferential access to the 7 Singapore has already concluded an FTA with the United States. Despite the name, “modern” FTAs address many non-border issues and thus facilitate foreign direct investment as well as trade (Naya and Plummer, 2005). Most U.S. agreements include provisions on enhanced intellectual property protection, labor standards, and environmental protection.
7

U.S. market. Section 3.3 focuses on implicitly discriminatory trade policy, which lowers U.S.
barriers facing non-Chinese exporters to the detriment of their Chinese competitors.
3.1 U.S. use of antidumping against China
Over the last 25 years, the administered protection of antidumping has been the most
attractive trade policy instrument for domestic industries seeking insulation from foreign
competition. The aggressive use of antidumping was “pioneered” by the United States but
increasingly emulated by many other developed and developing countries. 8 From the
perspective of the issues raised in this paper, antidumping is an interesting policy to examine
because of the discretionary way it is applied. This discretion, when combined with the political-
economy features of administered protection, mean that antidumping can be a highly
discriminatory trade policy action, yet it also has also has the potential to be imposed on a
relatively nondiscriminatory basis as well. With this perspective in mind, we examine some of
the stylized facts on U.S. use of antidumping against Chinese exporters.
Table 1 provides a breakdown of U.S. antidumping activity against its ten most
frequently targeted trading partners for two separate periods: 1980-1989 and 1990-2003. Not
surprisingly, in the more recent period Chinese exporters i) are the most frequently investigated
producers, being named in 91 different antidumping investigations, ii) face a higher likelihood
(67 percent) of having investigations result in duties than other producers, which together leads
them to iii) face more antidumping duty actions (61) than producers from any other country,
where they finally iv) face the highest level of duties imposed (an average ad valorem rate of 8 Zanardi (2004) presents data indicating that U.S. exporters have also become the target of antidumping as its use has spread beyond the “traditional” users—United States, Canada, EU, Australia. In particular, U.S. exporters are now the third most targeted exporters hit by foreign antidumping actions, trailing only China and Korea. In addition to the traditional users, Brazil, Argentina, and Mexico started their intensive use in the 1980s, followed more recently by South Africa and India.
8

127.02 percent) of all targeted countries—more than twice as high as the average facing all other
countries. 9 These facts suggest that China is “public enemy number one” in the U.S.
antidumping process, even though at the midpoint of the 1990-2003 period China was still only
the eighth largest U.S. trading partner—the source of just 3.5 percent of total U.S. imports in
1996.10
Another important finding is the high count and unusually high frequency with which
China has been the only country named in a particular U.S. antidumping investigation. Over the
1990-2003 period, China was the only country targeted in 45 percent of the cases in which it was
under investigation.11 Most U.S. antidumping investigations in recent years have investigated
unfairly traded products from multiple foreign countries simultaneously, a trend that has
increased since the mid-1980s when a change in the U.S. antidumping law and investigative
process allowed the injury determination to be based on “cumulated” imports from all countries
named in an antidumping investigation. 12 Using cumulated imports from more countries
increases the likelihood of an affirmative injury determination. Ceteris paribus, this change
should bias the decision of a U.S. petitioning industry toward naming more foreign countries in
9 The U.S. Department of Commerce is able to use more discretion in calculating Chinese firms’ dumping margin in investigations because China is classified as a non-market economy. For non-market economies, the U.S. Department of Commerce estimates firm costs using data from a market economy that is judged comparable—for China, this surrogate is typically India. Chinese firms may also be less responsive to administrative requests for information during an investigation, resulting in Commerce also relying on the “Best Information Available” (usually data provided by the petitioners) to calculate a dumping margin. For a discussion of the effect of these factors on the dumping determination in the United States, see Blonigen (2003). 10 As we suggest above, the relevant characteristic of Chinese exports to the United States is rapid growth. Historically U.S. protection has discriminated against new and rapidly growing competitors, most notably Japan but also the “newly industrializing” economies of Asia. By 2003, China’s share in U.S. merchandise imports had risen to 9.4%, and China was the third largest source of U.S. imports, after Canada and Mexico but ahead of Japan. 11 The only country with a rate comparable to Chinese exporters is Canada, and this is also likely due to some of the peculiarities of bilateral trade between the U.S. and Canada, largely due to CUSFTA and NAFTA. 12 For a discussion of the cumulation rule and its economic effects on the U.S. antidumping process, see Hansen and Prusa (1996).
9

an antidumping investigation, possibly including some for which there is no evidence of
dumping, so as to use the cumulated imports from all named countries to increase the likelihood
of an affirmative injury determination. Thus, the frequency with which China alone is named
suggests that there may be something distinctive about imports from China, when compared to
U.S. imports from other trading partners.
Given that so many AD cases involving China seem “different” from cases involving
other countries, the distinctive features of these cases could perhaps also provide a reason for the
higher duties that its firms typically face. To examine this potential explanation, in Table 2 we
provide summary data on the characteristics of the antidumping investigations that involved
China as one of multiple countries being investigated for alleged dumping of the same set of
products in the U.S. market. By examining the outcome facing Chinese firms relative to the
outcome facing other investigated foreign firms in these multi-country cases, we are able to
control for differences in industry characteristics across cases that may also generate differences
in the level of AD duty imposed across countries. The data for the 1990-2003 period show that
the average duty that Chinese firms faced after an affirmative determination was over 80
percentage points higher than the average duty facing all of the other firms from other countries
in the multi-country investigations. In the table, we refer to this differential as the “China
premium.”
Returning to Table 1, it is also informative to compare the U.S. antidumping policy
facing China over the 1990-2003 period with the U.S. antidumping situation facing Japan over
the 1980-1989 period, during the height of “Japan-bashing.” Similar to the recent circumstances
facing China, in the 1980s Japan was the most targeted exporter in U.S. antidumping actions,
targeted nearly twice as often West Germany, the next most frequently targeted exporting
10

country. And not only were Japanese exporters more frequently investigated than other
exporters, but they also were more likely to face affirmative decisions and thus to have
investigations result in antidumping duties (63 percent, compared to the average of 39 percent
for other exporters).
However, Table 1 also reveals a notable difference between Japan in the 1980s and China
in 1990-2003: Japan was a far more important trading partner in the 1980s than China in the
1990s. Looking at the midpoint of each period, Japan accounted for 20.1 percent of total U.S.
imports in 1985, compared with China’s share of just 3.5 percent in 1996. As a more important
trading partner with faster-growing exports (see Table 7), we might have expected Japan in the
1980s to have been an even more potent source of trade frictions and potential antidumping
investigations than China in the 1990s. Other things equal, China in the 1990s should have been
less frequently targeted by U.S. antidumping, compared to Japan in the 1980s.
There are a number of potential explanations for the phenomenon of differential
treatment toward China in the antidumping process. One possibility is that Chinese exports are
disproportionately concentrated in politically sensitive and/or politically organized sectors in the
United States, thus making China more likely to be subject to U.S. antidumping investigations
due to the sectoral composition of its exports. However, given the proclivity toward
antidumping activity in the steel sector, which alone accounts for nearly 40% of all antidumping
cases, when combined with Japan’s (net exporter) and China’s (net importer) global trading
position in steel, the sectoral explanation seems highly improbable. Rather, the U.S.
antidumping focus on China despite its relatively small import share and the sectoral
composition of its exports may reflect the greater perceived threat that China posed in the 1990s.
11

As with Japan in the 1980s, China’s rapid export growth was a threat not only to U.S.
import-competing industries, but also to suppliers in other countries with an established presence
in the U.S. market and thus a concern about losing market share to Chinese competitors. A
rational response for these exporters is to use the U.S. trade policy process (in this case,
antidumping) to attain preferential access to the U.S. market if they can no longer compete with
Chinese firms under conditions of MFN. In the case of antidumping, the preferential access can
be attained either by ensuring that Chinese firms face U.S. antidumping duties that other foreign
suppliers do not, or that Chinese firms face much higher antidumping duties than the ones
imposed on other foreign suppliers in multi-country cases. Prusa (1997, 2001) and Bown (2004)
provide empirical evidence that U.S. trade policy has had the effect of protecting not only
domestic producers but also non-targeted foreign suppliers. Prusa and Bown establish that
discriminatory application of antidumping duties in the United States has led to substantial trade
diversion, i.e., increases in U.S. imports in targeted product categories from non-targeted foreign
suppliers—who thus gained from the U.S. trade policy along with domestic producers. These
gains have come at the expense of exporters first in Japan and later in China who face higher
U.S. AD duties than other foreign suppliers.
A second major difference documented in Table 1 between U.S. antidumping versus
Japan in the 1980s and versus China in the 1990s is that, while duties facing Japan in the 1980s
were also higher than the average facing firms in other countries, the duties facing China in the
1990s were more than twice as high as the average duty facing all other exporters.13 This is true
even after taking into account the upward trend in duties levied in affirmative cases.
13 Blonigen (2003) attributes the upward trend in duties levied in affirmative cases largely to the increased discretion available to the U.S. Commerce Department in dumping determinations.
12

3.2 China’s WTO accession and China-specific “safeguard” laws
A second area of trade policy where China currently faces discriminatory treatment stems
from its 2001 WTO accession. The terms of the accession agreement give WTO members the
authority to enact “China safeguards” in the case of surges of imports of products from China. In
the GATT/WTO system, safeguards have traditionally been distinct from the “unfair” trade laws
such as antidumping in that users of safeguards do not need to establish that the foreign country
or exporting firms have done anything unfair (such as “dump”). All that is necessary is for the
domestic industry to show that it has been injured or that there is a reasonable threat of injury,
and that this injury is associated with an increase in imports.14 However, at least in principle,
safeguard protection is applied to all sources of imports, in keeping with its use when injury to
the domestic industry is not due to any unfair act of specific foreign suppliers. Yet there are at
least two new safeguards facing China alone. The first, authorized by Section 421 of the U.S.
trade law, is applicable to all imported products from China. It is administered in much the same
way as the standard, WTO-authorized safeguard law of Section 201. Under either law, the U.S.
International Trade Commission (ITC) is charged with investigating injury, and in the case of an
affirmative finding, making a remedy recommendation, which the U.S. President has the
discretion to modify, accept, or reject. The second new safeguard facing imports from China,
which is administered by the Office of Textiles and Apparel (OTEXA) in the U.S. Department of
Commerce, is applicable to all U.S. imports of textile and apparel products from China.
14 There are other notable differences between antidumping and safeguards use. In addition to issue of “fair” versus “unfair” trade, the antidumping process is bureaucratic while safeguards in the United States allow for Presidential discretion; the injury threshold is higher for safeguard cases; the duration of an imposed safeguard measure is explicitly limited and typically shorter than antidumping; and the use of safeguards can also sometimes require compensation to affected countries, while antidumping does not. See Bown (2002).
13

3.2.1 Section 421 China safeguard
The primary way in which the new Section 421 “China safeguard” differs from
traditional use of safeguards is the discriminatory nature of the policy. The WTO Agreement on
Safeguards requires that U.S. trade restrictions authorized under the standard safeguards law
(Section 201) must be applied on a most-favored-nation (MFN) basis, so as not to discriminate
among foreign suppliers. The new China safeguards, which are discriminatory both in their
consideration and in the potential application of U.S. trade restrictions against exporters from
one country only, are thus entirely antithetical to the MFN treatment the WTO requires for other
safeguard protection.
Another important discriminatory element of this safeguard, relative to the standard U.S.
Section 201 safeguard requirement for a U.S. industry to receive import protection, is the need to
show evidence of injury. Under the China safeguard, if any other WTO member uses its China
safeguard, the United States can respond to the threat of Chinese exports being “deflected” to the
U.S. market by imposing its own China safeguard without conducting an investigation to
establish injury to the U.S. industry.15
Table 3 describes the five ITC investigations of Chinese exporters conducted since 2002
under the China safeguard law. In three of the five cases, the ITC voted that the petitioning U.S.
industry was either injured or threatened with injury from Chinese exports and recommended
that the U.S. President use a trade remedy such as a tariff or quota to protect the domestic
industry. In each case, the U.S. President exercised discretion and declined to implement the
15 See §19 USC 2451a of the U.S. law, “Action in response to trade diversion.” See also the discussion in Messerlin (2004). Note that we do not refer to this phenomenon as trade diversion here, instead calling it “trade deflection.” Trade diversion has well-established meaning in the international trade literature that is distinct from this phenomenon. See Bown and Crowley (2004a).
14

ITC’s trade remedy recommendations, instead stating, for example, in the Pedestal Actuator case
that
“After considering all relevant aspects of the investigation, I have determined that providing import relief for the U.S. pedestal actuator industry is not in the national economic interest of the United States. In particular, I find that the import relief would have an adverse impact on the United States economy clearly greater than the benefits of such action” (United States, 2003). The pattern of discriminatory restrictions targeting China (relative to other exporters) is
likely to evolve further in response to changes in the global trade environment. For example,
what would be the U.S. policy response if the Doha Round imposes additional constraints on the
antidumping process? Given the substitutability of policy instruments available to U.S. industries
seeking protection from Chinese competition, there is the real possibility that any reduction in
frequency of AD-targeting against China would be accompanied by an increased incidence of
China-specific safeguard actions triggered under the new Section 421 of the U.S. trade law,
especially if accompanied by increased willingness on the part of the President to impose
remedies recommended by the ITC.
3.2.2 OTEXA’s China safeguard
While the United States has yet to use the Section 421 “China Safeguard” law to impose
new trade restrictions on Chinese imports,16 this has not been the case with respect to the second
China-specific safeguard, the “China Textile and Apparel Safeguard.” This trade policy is
administered through OTEXA’s Committee for the Implementation of Textile Agreements
16 Of course, there is also evidence from other laws of administered protection that merely initiating a case can have a dampening effect on trade flows. For the case of antidumping, which has been studied extensively because of relatively good data, see Prusa (1992), Staiger and Wolak (1994), and Bown (2004).
15

(CITA).17 While the investigative process and the ultimate outcome of the OTEXA’s China
safeguard investigation are much less transparent than for other U.S. trade policies, what appears
typically to happen at the conclusion of these investigations is that OTEXA engages in bilateral
consultations with the Chinese government with the aim of establishing an import limit,
frequently through a voluntary restraint of Chinese exports. For example, in bilateral
consultations held in response to an earlier Knit Fabric (product 222) China textile safeguard
investigation, in December 2003 the Chinese government reportedly “agreed to hold its
shipments to a level no greater than 7.5 percent (6 percent for wool product categories) above the
amount entered during the first 12 months of the most recent 14 months preceding the request for
consultations” (OTEXA, 2003). But this particular application of the safeguard was not
sufficient to appease the U.S. industry, as it requested an additional OTEXA safeguard
investigation of Knit Fabric from China in November 2004 as well (Table 4).
The most worrisome element of the OTEXA safeguard is the implied U.S. reversion to
the “worst-practice” behavior of the 1980s that was supposed to be eliminated with the
conclusion of the Uruguay Round negotiations and establishment of the WTO in 1995. This
“safeguard” is discriminatory, the investigative process for injury is either non-existent at worst
or non-transparent at best, and the outcome often seems to be in the form of “voluntary”
arrangements, such as VERs.
3.3 U.S. PTAs with countries that compete with China in the U.S. market
A final example of U.S. trade policy that may have been motivated at least partially by
the desire of current suppliers—domestic producers but also established foreign suppliers of U.S.
17 For details on the Department of Commerce’s use of the China Textile and Apparel Safeguard, see the OTEXA website (www.otexa.ita.doc.gov/Safeguard_intro.htm), last accessed 11 January 2005.
16

imports—for preferential treatment relative to China is the recent increased willingness of other
U.S. trading partners to pursue free trade agreements with the United States. Table 5 lists some
of the preferential agreements negotiated by the United States since China’s WTO accession in
2001. On the part of the United States, most of these agreements entail social or political
objectives as much as gains from trade. These include the offer of preferential access to the
U.S. market, frequently for products that compete with Chinese exports, in exchange for
commitments to enforce labor standards (Cambodia), to combat narcotics trade (ATDPEA), to
promote democracy and environmental protection (CAFTA), and to establish better relations in
the Middle East post-9/11 (Morocco, Bahrain).18
The partner countries in these preferential trade agreements often stand to gain by
maintaining existing preference margins or increasing preferential access in the U.S. market in
important product categories that also compete with Chinese exports. One such example is
presented in Table 6, which lists each of these countries’ textile and apparel exports to the United
States measured both in value terms and as a share of the country’s total exports to the U.S.
market. For a number of these countries, a substantial share of their total exports to the U.S.
market is in textiles and apparel, sectors where China is the largest single U.S. supplier with
exports of nearly $15 billion in 2003.
4. China as a Target
Why has China become the target of discriminatory treatment under U.S. trade policy?
To answer this question, it is useful to take a look at the broader political economy of U.S. trade
protection. As Krueger (1990) observes, “Examination of the prevailing pattern of protection in
18 Limão (2003) provides evidence that such agreements typically hinder future multilateral liberalization by showing the impact of earlier US PTAs on tariff-binding-reduction negotiations in the Uruguay Round.
17

the United States yields the easy conclusion that, whatever is used as a basis for deciding upon
the pattern of protection, it is certainly not the criterion of Pareto optimality.” In the case of
China, we can identify some “business as usual” elements, i.e., a U.S. pattern of discriminatory
protection that typically targets newer, faster-growing suppliers. But there are also some China-
specific considerations that help to foster a political environment in which China-bashing, like
the earlier Japan-bashing, becomes acceptable or even desirable.
4.1 U.S. protection against new entrants that rock the trade boat
U.S. protection is often structured to protect not only domestic producers but also
established suppliers of U.S. imports. If protection is motivated by a “conservative welfare
function” (Corden 1974) that slows down economic change and thus maintains the status quo, it
seems that for the United States this welfare function includes the welfare of important
established trading partners and allies as well as domestic producers. U.S. multinational firms
quite naturally will lobby to maintain the market shares of their off-shore subsidiaries as well as
their domestic production facilities. Likewise, established foreign suppliers who “know the
ropes” in Washington can be effective in gaining preferential access to the U.S. market and thus
maintaining their shares as new and highly competitive entrants emerge. A U.S. trade policy
goal of protecting established trading partners and the subsidiaries of U.S. multinationals as well
as domestic producers can help to explain demonstrated U.S. preference for VERs and
antidumping, as well as the use of FTAs that allow preferred partners to maintain or even
increase market share.
An inclusive social welfare function is consistent with U.S. protection that targets fast-
growing exporters whose growth will otherwise have “too large” an impact on established
18

market shares—of both domestic producers and traditional suppliers abroad. China’s recent
export growth has indeed been dramatic. Yet Japan’s export growth in the early postwar period
was even more dramatic, with an increase of more than 600 percent between 1949 and 1959
(Dam 1970, 297). And as Table 7 shows, China’s sustained high rate of export growth is not very
different from that of several other successful Asian exporters. These countries have also faced
trade policy discrimination from the United States during their periods of rapid export growth.
Growth rates do not tell the whole story, especially when growth is, as in the case of
China and early postwar Japan, from a very low level. However, the same picture emerges if
penetration of the U.S. market is used as a measure of impact and thus potential pressure for
protection. China’s share of total U.S. merchandise imports was about 11 percent in 2003,
compared with 10 percent for Japan and 3 percent for Korea. But both Japan and Korea had
larger shares at their peak. Japan’s share of U.S. imports reached 22 percent in 1986, while even
Korea, a much smaller economy, accounted for 4.5 percent of U.S. imports in the late 1980s
(Prasad and Rumbaugh 2003, 48). Yet while the total impact of Chinese exports to the U.S.
market has not yet reached the level of Japanese exports at the peak of U.S.-Japan trade conflict,
protection is a sectoral phenomenon. As with Japan, Chinese exports to the United States are
concentrated in a relatively few sectors and thus account for a much larger share of imports for
these sectors.
4.2 Round up the usual suspects
A few industries stand out as perennial beneficiaries of U.S. protectionism: agriculture,
steel, and textiles and apparel. Much of the incidence of U.S. protection across trading partners,
i.e., which countries’ exports are restricted, can thus be explained in terms of export mix. As
19

noted in Section 2, discriminatory protection against Japanese exports began even before World
War II with voluntary restrictions on textiles in the 1930s. China, with its large and fast-growing
apparel exports, would thus have been targeted specifically for this reason. The scheduled
dismantling of the MFA increased policy pressure to limit China’s incursion into established
markets.
Moreover, “non-market” economies are treated differently from market economies in the
administration of U.S. trade policy, particularly antidumping policy. The justification in the case
of China lies partly in the important role of state-owned enterprises in export activities, a
domestic capital market that is guided by government priorities rather than market forces, and a
policy-determined exchange rate maintained at a rate generally viewed as low relative to
purchasing power parity. Yet the decision as to whether a particular country should be treated as
a market economy is partly political. Under the terms of the 1999 U.S.-China bilateral
agreement, key to China’s WTO accession, the Commerce Department will continue to use the
unfavorable non-market-economy designation to evaluate Chinese dumping until 2014—
notwithstanding China’s actual speed of transition. In contrast, Russia obtained a market
economy designation in 2002 (Pearson 2004, 35).
4.3 Trade performance and macroeconomic imbalance
In the 1980s, many U.S. policy makers interpreted the huge bilateral trade deficit with
Japan as the “smoking gun”—conclusive proof of Japan’s unfair trade practices. The bilateral
deficit thus provided an attractive justification for proposed measures to limit Japanese exports to
the United States or to expand Japanese imports from the United States. Economists argued,
mostly in vain, that the U.S. current account imbalance reflected a domestic macroeconomic
20

imbalance, specifically a large excess of U.S. domestic investment over domestic saving
(McCulloch 1988, 312-3). Likewise, the Japanese current-account surplus reflected the large
excess of domestic saving over domestic investment. Changes in sectoral trade policies might
affect the composition of U.S.-Japan trade flows or even the size of this specific bilateral
imbalance, but only macroeconomic changes could reduce the overall current-account
imbalances of the two nations.
The recent emergence of a huge bilateral trade deficit with China, as well as the response
in the policy community, thus have a somewhat familiar ring. Again, the root of the problem lies
in U.S. macroeconomic imbalance, as U.S. domestic saving has plummeted thanks to record
fiscal deficits.19 Again, trade with one country dominates the red ink. But this time around there
is also an important difference. Japan in the 1980s had a huge overall current account surplus
and bilateral surpluses with many other trading partners. In contrast, China is a major importer
not only of raw materials but also of sophisticated manufactured goods. It has already passed
Japan to become the world’s third largest importer; its bilateral trade balances with most of its
East Asian neighbors are negative. Even in trade with the United States, China is now a major
importer. Between 2000 and 2003, U.S. exports to China increased 76 percent while exports to
the rest of the world fell 9 percent (USTR 2004).
One Chinese policy does contribute to a large bilateral trade imbalance with the United
States. While the U.S. dollar has fallen against other currencies by as much as a third, China has
prevented a similar revaluation vis-à-vis the yuan. As a consequence, the Chinese yuan is now
significantly undervalued relative to the dollar, making Chinese goods cheaper in U.S. markets
and U.S. goods more expense in Chinese markets. This undervaluation means that a larger share
19 Domestic saving is equal to private saving plus the government’s budget surplus. Thus, the large fiscal deficit represents a major downward pull on overall U.S. saving.
21

of the global U.S. current account deficit shows up in bilateral trade with China. By the same
logic, the yuan revaluation that Washington is demanding would reduce the bilateral trade deficit
but would likely have little impact on the global deficit unless the United States at the same time
moves to raise domestic saving by cutting the budget deficit.
4.4 Intellectual property rights and technology transfer
By the 1980s, Japan was no longer exporting low-end textiles and apparel but had
become a major U.S. competitor in some high-technology products. Notwithstanding occasional
accusations of industrial espionage, Japanese firms acquired advanced U.S. technologies mainly
through licensing agreements with U.S. patent holders. But Japanese direct investments in U.S.
high-technology firms were subjected to scrutiny by a special federal agency, and at least one
proposed Japanese acquisition of a U.S. semiconductor producer failed to gain approval.
The different types of conflicts seen over decades of trade with Japan are present
simultaneously in the case of China. While China remains a highly competitive supplier of low-
end simple manufactured goods, it has also made surprisingly rapid progress in more
sophisticated production activities. For China, the main intellectual property issues are out-and-
out counterfeiting and piracy.20 As part of its WTO accession agreement, China committed to
improve protection of intellectual rights along the lines required by the Uruguay Round
agreement on Trade Related Intellectual Property Rights (TRIPs). But while legal arrangements
have indeed been improved, enforcement remains lackluster. In one recent high-profile case,
General Motors claims that the Chinese Chery QQ is a knockoff of its own Chevrolet Spark.
20 Counterfeiting refers to unauthorized production of trademarked products such as fake designer-label clothing. Piracy refers to unauthorized reproduction of copyrighted material such as CDs or videos as well as unauthorized use of patented technologies.
22

And in an echo of policy toward Japan in the 1980s, the Committee on Foreign Investment in the
United States will review the proposed IBM sale of its personal computer business to the
Chinese Lenovo Group.
4.5 Trade policies in aid of social objectives
U.S. unions, environmental organizations, and other non-governmental organizations
have increased their advocacy of trade restrictions intended to prevent newer trading partners,
mostly less-developed or transition economies, from benefiting from lower costs that are due to
lower labor and environmental standards. In April 2004, the AFL-CIO asked President Bush to
punish China under Section 301 of the Trade Act of 1974 for gaining unfair advantage in U.S.
markets through repression of workers’ rights. Under Section 301, violation of internationally
recognized labor rights is an unfair trade practice. According to the complaint, China’s labor
practices resulted in the loss of as many as 727,000 U.S. factory jobs (Greenhouse and Becker
2004). Although the Bush administration rejected the complaint, the administration has
continued to press China on labor issues such as occupational safety and pension rights
(Hufbauer and Wong 2004, 12).
China’s relatively weak environmental policies and even weaker enforcement of current
policies are another source of public pressure on U.S. trade officials to “do something” about
Chinese exports. Like many other developing countries, China has experienced a marked
deterioration in environmental quality but at the same time has begun to address the situation
through new policies to limit air and water pollution. Yet as with intellectual property,
enforcement effort has lagged behind. Although the costs are borne primarily by China’s own
residents, some pollutants, such as gaseous mercury from Chinese coal-fired power plants, are
23

already finding their way into the oceans and even into the air breathed by residents of distant
countries (Pottinger 2004).
5 Economic Consequences of Discriminatory Treatment
In previous sections, we have documented discriminatory policies applied by the United
States and other nations to trade with China. In this section we review some likely implications
for trade flows, U.S. economic welfare, and trade policy developments abroad. Some are
familiar from the U.S. experience with discriminatory trade barriers to imports from Japan and
other highly competitive Asian exporters.
5.1 Trade diversion
Discriminatory U.S. trade policies that limit imports only from China may protect
domestic producers, but more often the main effect is to divert import sourcing to the next most
competitive supplier, usually another Asian country or a trading partner such as Mexico or Costa
Rica with preferred access to the U.S. market. For goods in which China has the world’s lowest
opportunity cost, trade diversion reduces overall economic welfare both in China and in the
United States, though it does generate some gains for the “beneficiaries” of diverted trade, i.e.,
the countries whose exports to U.S. markets rise as a consequence. Global welfare is reduced to
the extent that the affected good is now produced at higher cost.21
21 The relevant cost is opportunity cost, i.e., the value of the output foregone in order to produce a particular good. The gains from trade arise mainly from shifting production of any particular good to the place where it can produced at the lowest opportunity cost, i.e., the country with comparative advantage. Trade flows are, however, based on comparative money costs (competitiveness), which may diverge from opportunity costs for a variety of reasons. For example, a significantly undervalued currency may enable China to export some goods in which it does not have the lowest opportunity cost. The effects of currency undervaluation are similar to those of an across-the-board export subsidy—beneficial overall to the importing country but welfare-reducing for China and the rest of the world.
24

An additional complication arises when Chinese export restrictions are substituted for
U.S. import barriers. Whether exports are controlled through “voluntary” export restraints or
explicit export taxes, this type of trade restriction allows China to appropriate the difference
between the good’s price in the U.S. market and its cost to Chinese suppliers. This raises the
cost to the United States and reduces the loss to Chinese suppliers of the restricted product.
Implementation of quantitative export restraints also tends to reduce active competition among
suppliers, thus creating additional welfare losses through exercise of market power.
Whatever the specific trade policy, one sure effect is higher cost to U.S. buyers. For
goods such as clothing and consumer electronics, Chinese products are often those appealing to
lower income “Wal-Mart shoppers”—and thus the impact is likely to be regressive. Induced
upgrading, discussed below, will also have a regressive impact as the mix of U.S. imports from
China shifts toward higher-price goods. But many imports are intermediate goods, purchased by
American businesses as inputs for use in their own production activity. Here higher prices harm
the competitiveness of U.S. producers and may even speed their exit from U.S. production. As
an example, in 1991 U.S. antidumping duties on imported flat-panel displays used in laptop
computers raised the costs of U.S. producers relative to their competitors abroad; laptop
production accordingly shifted from California and Texas to Japan, Canada, Ireland, and
Singapore (Irwin 2002, 80).
5.2 Quality upgrading
Quantitative limits on Chinese exports are likely to accelerate product upgrading, i.e., a
move toward the more sophisticated and higher-priced varieties within a product category.
Upgrading is also encouraged by use of a flat-rate (i.e., specific or per-unit) export or import tax
25

but not a trade tax that is levied as a percentage of the good’s price. Although product upgrading
is part of the normal process of industrial development, trade restrictions tend to raise the speed
with which this occurs. Thus, Japan’s voluntary restriction of auto exports to the United States
accelerated its manufacturers’ shift from the small economy cars that had previously constituted
the bulk of Japan’s sales in the U.S. market to high-end luxury models competing more directly
with the products of the U.S. “big three” auto makers. European producers of smaller cars, who
had been losing their share in the U.S. market to Japanese competitors, benefited from trade
diversion as they filled the low-end gap in U.S. auto imports left as Japanese firms upgraded
their exports. In December 2004, China announced a flat-rate export tax on apparel exports with
the explicit objective of promoting the quality upgrading of its export-oriented production. The
plan is evidently to cede the low end of the apparel market to low-wage countries like
Bangladesh.
To the extent that the goal of U.S. trade policy is to preserve the market share of its own
producers and to prevent domestic job losses, induced product upgrading may mean that
protection can backfire. As Chinese firms climb the “quality ladder” at an increased pace or
even discontinuously (leapfrogging), their products become more directly competitive with the
output of firms located in the United States. The case of Japanese autos provides an instructive
example. In the auto case, U.S. protection also accelerated Japanese foreign direct investment in
the United States. Although this outcome was desired by supporters of the voluntary restraint
agreement with Japan, including the United Auto Workers, most of the Japanese “transplants”
are located far from Detroit and are not unionized. Industry employment has been maintained
overall, but the VER prevented neither losses to domestic producers nor displacement of their
workers.
26
5.3 Effects on global trade flows
U.S. trade policy toward China can have important spillover effects on other trade flows,
thus creating new trade tensions and the global spread of protectionist pressures. U.S.
antidumping duties on exports from China are likely to induce both trade deflection and trade
depression. Trade deflection is the tendency of Chinese exporters to react to a new U.S. trade
restriction by shifting sales to other, as-yet unrestricted markets, thereby producing import surges
in those markets. Trade depression is the reduction in China’s own imports from the United
States as well as other countries, as U.S. trade barriers cause more of China’s export-oriented
production to be retained domestically.
The deflection of Chinese exports has two noteworthy effects. For countries that actively
compete with China in the same markets, the resulting surge in deflected Chinese exports is
likely to fuel increased protectionist (anti-China) sentiment, and thus increasing resort to
antidumping, safeguards, or China safeguards. Exporters from other countries—including U.S.
firms, which are currently the third most targeted globally in antidumping actions—are also
likely to get caught up in the protectionist web. But some may benefit from the deflection of
Chinese exports. For countries importing intermediate inputs from China, trade deflection means
downward pressure on the price of these inputs and a resulting further advantage relative to their
U.S. competition (who must already pay a higher price for the same inputs due to the direct
effects of U.S. protection).
Trade depression means more Chinese output retained at home and thus more domestic
pressure in China for import protection. This may lead to an increase in China’s own use of
antidumping. This type of protection can be structured in a discriminatory manner, again
perhaps targeting firms in the United States.
27

5.4 Increased pressure for China to enter preferential trade agreements
China’s expanding trade with the rest of the world, partly the result of trade deflection,
together with its frustration with lack of access to the U.S. market, has increased the pressure to
negotiate trade agreements with other countries (Antkiewicz and Whalley 2004). As the terms of
China’s WTO accession have required it to take on more liberalization commitments than many
other countries, potential partners will likely have to make significant market-access
commitments of their own with respect to China. This could produce an Asian regional trade
agreement that excludes the United States, thereby leaving U.S. exporters with “least favored
nation” status not only in the Chinese market but, perhaps more important, in other Asian
markets as well.
6 Conclusion
This paper examines recent U.S. policy toward imports from China, highlighting
important explicitly and implicitly discriminatory elements. These include the explicitly
discriminatory terms of China’s 2001 WTO accession as well as the implicitly discriminatory
administration of antidumping. We compare the recent trade policy treatment of China with
earlier trade policy discrimination directed toward Japan. One important difference is that unlike
discriminatory U.S. treatment of Japan in the 1980s, in which “gray-area” measures like
voluntary export restraints were prominent, most U.S. actions toward China are fully consistent
with current WTO rules, including the special terms of China’s 2001 WTO accession. In
examining the underlying reasons for targeting of China (and, earlier, Japan), we identify some
characteristics of China and Chinese trade that make it more likely to receive special attention.
In particular, China’s highly competitive garment industry is likely to be targeted simply because
28

this has long been a politically sensitive sector in the United States and also in most other
industrialized countries.
Discriminatory restrictions on U.S. trade with China protect competing domestic
industries but also non-Chinese foreign suppliers with an established presence in the U.S.
market. For the United States, this means other Asian trading partners, but especially countries
that have negotiated free trade agreements with the United States. China’s rapid development of
highly competitive exports industries and its WTO accession in 2001 have increased the payoff
to having preferred access to the U.S. market. As with earlier discriminatory actions directed
primarily at Japan, and with the MultiFibre Arrangement that began with discriminatory action
directed at Japan and ended with a global network of managed trade, U.S. trade policy toward
China is likely to have complex effects on global trade flows and may produce outcomes far
different from those intended. Not surprisingly, discriminatory trade restrictions are costly in
terms of overall national and global welfare. Perhaps more surprisingly, they may be ineffective
or even counterproductive in protecting production and workers in the affected domestic
industries.
29

References
Antkiewicz, Agata, and John Whalley (2004). “China’s New Regional Trade Agreements,” NBER Working Paper 10992, December.
Blonigen, Bruce A. (2003). "Evolving Discretionary Practices of U.S Antidumping Activity,"
NBER Working Paper No. 9625, April. Bown, Chad P. (2002). "Why are Safeguards under the WTO so Unpopular?" World Trade
Review, 1(1): 47-62. Bown, Chad P. (2004). "How Different Are Safeguards from Antidumping? Evidence from U.S.
Trade Policies toward Steel" Brandeis University manuscript, July. Bown, Chad P. and Meredith A. Crowley (2004a). "Trade Deflection and Trade Depression,"
Federal Reserve Bank of Chicago Working paper No. 2003-26, February. Bown, Chad P. and Meredith A. Crowley (2004b). "China's Export Growth and U.S. Trade
Policy," Federal Reserve Bank of Chicago Working paper No. 2004-28, November. Corden, W. Max (1974). Trade Policy and Economic Welfare. Oxford: Oxford University
Press. Dam, Kenneth W. (1970). The GATT: Law and International Economic Organization. Chicago:
University of Chicago. Feenstra, Robert (2000). “World Trade Flows, 1980-1997, with Production and Tariff Data.”
UC-Davis manuscript (and accompanying CD-Rom). Greenhouse, Steven, and Elizabeth Becker (2004). “A.F.L.-C.I.O To Press Bush For Penalties
Against China,” The New York Times, March 16, 2004. Hansen, Wendy L. and Thomas J. Prusa (1996). "Cumulation and ITC Decision-Making: The
Sum of the Parts is Greater than the Whole," Economic Inquiry, 34: 746-769. Hufbauer, Gary Clyde, and Yee Wong (2004). “China Bashing 2004,” International Economics
Policy Brief No. PB04-5, Institute for International Economics, September 2004. Irwin, Douglas A. (2002). Free Trade under Fire. Princeton: Princeton University Press. Krueger, Anne O. (1993). “The Political Economy of American Protection in Theory and
Practice,” in Horst Herberg and Ngo Van Long, eds., Trade, Welfare, and Economic Policies. Ann Arbor, MI: University of Michigan Press, 215-236.
Limão, Nuno (2003). “Preferential Trade Agreements as Stumbling Blocks for Multilateral
Trade Liberalization: Evidence for the U.S.,” University of Maryland manuscript, June.
30

McCulloch, Rachel (1988). “United States-Japan Economic Relations,” in Robert E. Baldwin, ed., Trade Policy Issues and Empirical Analysis. Chicago, University of Chicago Press, 305-330.
Messerlin, Patrick A. (2004). "China in the World Trade Organization: Antidumping and
Safeguards," World Bank Economic Review 18: 105-130. Metzger, Stanley D. (1971). “Injury and Market Disruption from Imports,” in United States
International Economic Policy in an Interdependent World, Commission on International Trade and Investment Policy, U.S. Government Printing Office, Volume 1, 167-191.
Naya, Seiji, and Michael G. Plummer (2005). “Economics of the Enterprise for Asian
Initiative,” paper prepared for presentation at the American Economics Association Meeting, Philadelphia, January 7-9.
OTEXA (2003). “Committee for the Implementation Of Textile Agreements - Announcement of
Request for Bilateral Textile Consultations with the Government of the People’s Republic of China and the Establishment of an Import Limit for Knit Fabric, Category 222, Produced or Manufactured in the People’s Republic of China,” 68 Federal Register 248, December 23.
Pearson, Charles (2004). United States Trade Policy: A Work in Progress. Hoboken, NJ: John
Wiley and Sons. Pottinger, Matt (2004). “A Hidden Cost of China’s Growth: Mercury Migration,” The Wall
Street Journal, December 17, A1. Prasad, Eswar, and Thomas Rumbaugh (2003). “Beyond the Great Wall,” Finance and
Development, December, 46-49. Prusa, Thomas J. (1992). “Why are so many Antidumping Petitions Withdrawn?” Journal of
International Economics, 33(1/2): 1-20. Prusa, Thomas J. (1997). “The Trade Effects of US Antidumping Actions,” in Robert C.
Feenstra, ed. The Effects of US Trade Protection and Promotion Policies, Chicago: University of Chicago Press.
Prusa, Thomas J. (2001). “On the Spread and Impact of Anti-Dumping,” Canadian Journal of
Economics 34(3), 591-611. Srinivasan, T.N. (2004). “China and India: Economic Performance, Competition and
Cooperation: An Update,” Yale University, February. Staiger, Robert W. and Frank A. Wolak (1994). “Measuring Industry Specific Protection:
Antidumping in the United States,” Brookings Papers on Economic Activity: Microeconomics, 1: 51-103.
31

Trezise, Philip H. (1971). “U.S.-Japan Economic Relations,” in United States International
Economic Policy in an Interdependent World, Commission on International Trade and Investment Policy, U.S. Government Printing Office, Volume II, 183-194.
United States (2003) “Presidential Determination on Pedestal Actuator Imports from the People's
Republic of China: Memorandum for the United States Trade Representative,” 68 Federal Register 3157, January 17.
United States Trade Representative (2004). “America’s Trade with China.”
www.ustr.gov/Document_Library/Fact_Sheets/2004/America’s_Trade_with_China. Accessed 12/21/2004.
Zanaradi, Maurizio (2004). “Antidumping: What are the Numbers to Discuss at Doha?” The
World Economy 27(3): 403-433.
32

Table 1. U.S. Antidumping Actions against Its Ten Most Frequently Investigated Trading Partners, 1980-2003
a. 1990-2003
Country Antidumping Investigations
Investigations Resulting in Duties
(share of investigations)
Only Country Named in
Investigation (share of
investigations)
Mean Duty,
conditional on duties imposed
Share of U.S. total import market in
1996 (rank) 1. China 91 61 (67%) 41 (45%) 127.02% 3.5% (8) 2. Japan 53 33 (62%) 18 (34%) 68.44% 14.0% (2) 3. Korea 39 20 (51%) 3 (8%) 16.65% 2.7% (10)4. Taiwan 30 15 (50%) 3 (10%) 20.46% 3.7% (7) 5. Mexico 26 11 (42%) 4 (15%) 41.18% 10.0% (3) 6. Germany 26 10 (38%) 0 (0%) 37.60% 4.9% (4) 7. India 25 11 (44%) 5 (20%) 52.89% 0.8% (24)8. Canada 25 6 (24%) 11 (44%) 25.35% 21.0% (1) 9. Brazil 24 12 (50%) 2 (8%) 76.47% 1.2% (16)10. Italy 19 10 (53%) 2 (11%) 22.75% 2.3% (11) Other 272 105 (39%) 31 (11%) 54.55% 35.9% Total 630 294 (47%) 120 (19%) 64.15% 100.0%
b. 1980-1989
Country Antidumping Investigations
Investigations Resulting in Duties
(share of investigations)
Only Country Named in
Investigation (share of
investigations)
Mean Duty,
conditional on duties imposed
Share of U.S. total import market in
1985 (rank) 1. Japan 65 41 (63%) 28 (43%) 50.40% 20.1% (2) 2. West Germany 34 11 (32%) 6 (18%) 34.56% 5.7% (3) 3. Italy 30 10 (33%) 4 (13%) 67.90% 2.9% (8) 4. Taiwan 29 12 (41%) 12 (42%) 29.42% 4.6% (6) 5. France 28 10 (36%) 4 (13%) 23.05% 2.6% (10)6. Korea 27 14 (52%) 9 (33%) 15.71% 3.3% (7) 7. Brazil 25 11 (44%) 12 (48%) 37.35% 2.2% (11)8. Canada 25 10 (40%) 18 (72%) 14.78% 21.0% (1) 9. United Kingdom 23 4 (17%) 3 (13%) 30.86% 4.6% (5) 10. China 17 12 (71%) 9 (53%) 44.39% 0.7% (22) Other 181 52 (29%) 32 (18%) 35.06% 32.3% Total 484 187 (39%) 137 (28%) 36.81% 100.0%
Note: data compiled by the authors from the Federal Register. U.S. import data from Feenstra (2000).
33

Table 2. China’s Relative Performance in Multi-Country U.S. AD Investigations that End in Duties against at Least One Country
Time Period
Mean (Median) Duty Facing China
Mean (Median) Duty Facing All other
Investigated Countries
Mean (Median) China Premium
1990-2003 (23 multi-country cases involving China)
117.38% (118.41%)
36.41% (32.23%)
80.97% (84.20%)
1980-1989 (6 multi-country cases involving China)
33.94% (25.65%)
18.01% (10.81%)
15.93% (20.24%)
Note: data compiled by the authors from the Federal Register. The duty rate used is the final “all other firm” rate in a
U.S. antidumping investigation, which is typically calculated as the trade weighted-average of the firm-specific rates of duty applied in the investigation.
34
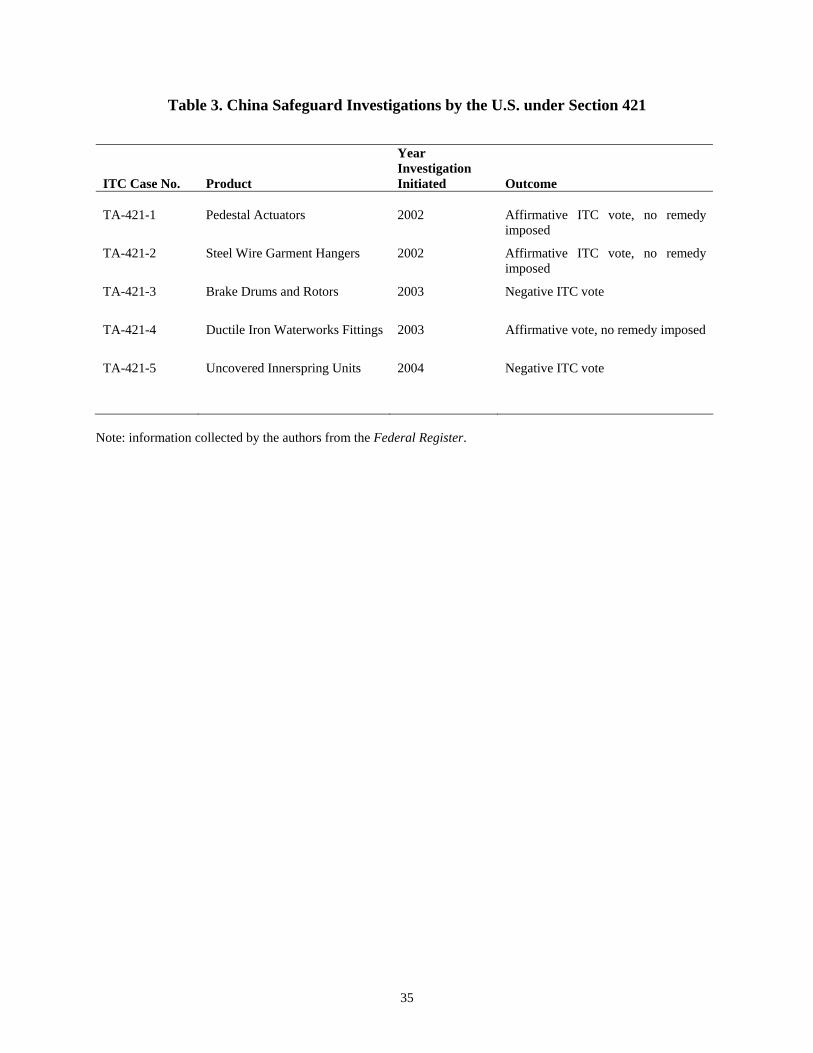
Table 3. China Safeguard Investigations by the U.S. under Section 421
ITC Case No. Product
Year Investigation Initiated Outcome
TA-421-1 Pedestal Actuators 2002 Affirmative ITC vote, no remedy
imposed
TA-421-2 Steel Wire Garment Hangers 2002 Affirmative ITC vote, no remedy imposed
TA-421-3 Brake Drums and Rotors 2003 Negative ITC vote
TA-421-4 Ductile Iron Waterworks Fittings 2003 Affirmative vote, no remedy imposed
TA-421-5 Uncovered Innerspring Units 2004 Negative ITC vote
Note: information collected by the authors from the Federal Register.
35

Table 4. Examples of China Textile Safeguard Investigations by the U.S. in 2004 OTEXA Category Product under Investigation 349/649 Brassieres and other body supporting garments
350/650 Dressing gowns and robes
222 Knit fabric
447 Wool trousers
620 Other synthetic filament fabric
301 Combed cotton yarn
352/652 Cotton and man-made fiber underwear
338/339 Men’s & boys’ and women’s & girls’ cotton knit shirts and blouses
340/640 Men’s & boys’ cotton and man-made fiber shirts, not knit
638/639 Men’s & boys’ and women’s & girls’ man-made fiber knit shirts and blouses
647/648 Men’s & boys’ and women’s & girls’ man-made fiber trousers
347/348 Men’s & boys’ and women’s & girls’ cotton trousers
Note: Requests for China Textile Safeguard Action between October 8 and December 1, 2004, downloaded from the Office of Textile and Apparel’s website, http://otexa.ita.doc.gov/chinare1dec1.pdf .
36

Table 5. Recent Examples of U.S. Preferential Trade Agreements
U.S. Agreements since 2001 Description from U.S. Trade Representative
Cambodian Textile Agreement “increases Cambodia's quota for textile imports by nine percent…[in
exchange for]… Cambodia's progress towards ensuring that working conditions in its garment sector are in "substantial compliance" with internationally recognized labor standards and provisions of Cambodia's labor law.”1
Andean Trade Promotion and Drug Eradication Act (ATPDEA) – Colombia, Bolivia, and Peru (and Ecuador)
“…provides the four Andean countries with duty-free access to U.S. markets for approximately 5,600 products. The program expired in December of 2001 and was renewed as part of the Trade Act of 2002… providing incentives for these four Andean countries to diversify their economies away from narcotics production.” 2
Dominican Republic – Central American Free Trade Agreement (DR-CAFTA) – Dominican Republic, El Salvador, Honduras, Nicaragua, Guatemala, Costa Rica
“will contribute to the transformation of a region that was consumed in internal strife and border disputes just a decade ago but is now a successful regional economy with flourishing democracies…. U.S. is also strengthening ties with the DR-CAFTA countries by entering into an Environmental Cooperation Agreement.” 3
Morocco Free Trade Agreement “…this FTA sends a powerful signal that the United States is firmly committed to supporting tolerant, open and more prosperous Muslim societies. I hope other nations in the Middle East and North Africa will closely study the terms of this agreement, and will view it as a model to advance their economic relationships with the United States.” 4
Bahrain Free Trade Agreement “Muslim countries can become full participants in the rules-based global
trading system, as the United States considers lowering the trade barriers with the poorest Arab nations…. Recommendation: A comprehensive U.S. strategy to counter terrorism should include economic policies that encourage development, more open societies, and opportunities for people to improve the lives of their families and to enhance prospects for their children’s future. (The 9/11 Commission Report, Pages 378-379” 5
Sources: USTR’s website, http://www.ustr.gov/Trade_Agreements/Bilateral/Section_Index.html , last accessed
on 13 January 2005. 1USTR press release, “U.S.-Cambodian Textile Agreement Links Increasing Trade with Improving Workers' Rights,” 01/07/2002. 2ATPA fact sheet from the USTR, “New Andean Trade Benefits,” 09/25/2002.
3 USTR press release, “Dominican Republic Joins Five Central American Countries in Historic FTA with U.S.,” 08/05/2004
4 USTR press release, “U.S. and Morocco Conclude Free Trade Agreement,” 03/02/2004 5 USTR press release, “United States and Bahrain Sign Free Trade Agreement,” 09/14/2004
37
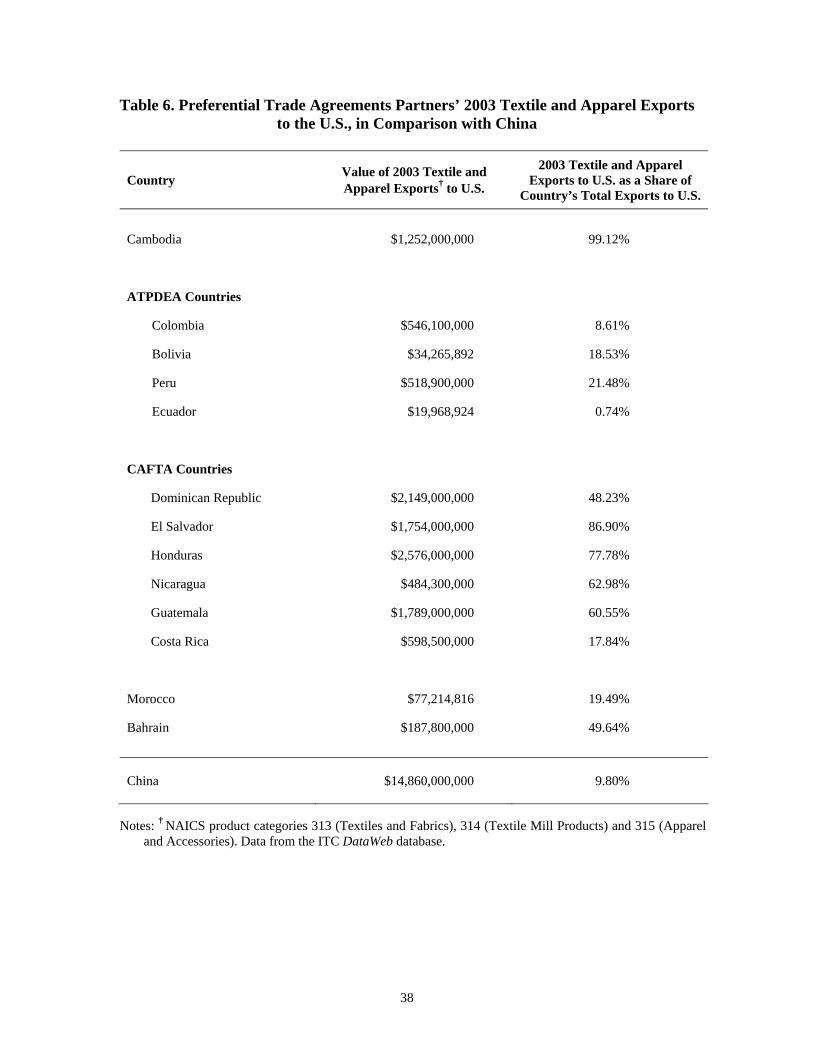
Table 6. Preferential Trade Agreements Partners’ 2003 Textile and Apparel Exports to the U.S., in Comparison with China
Country Value of 2003 Textile and Apparel Exports† to U.S.
2003 Textile and Apparel Exports to U.S. as a Share of
Country’s Total Exports to U.S.
Cambodia $1,252,000,000 99.12%
ATPDEA Countries
Colombia $546,100,000 8.61%
Bolivia $34,265,892 18.53%
Peru $518,900,000 21.48%
Ecuador $19,968,924 0.74%
CAFTA Countries
Dominican Republic $2,149,000,000 48.23%
El Salvador $1,754,000,000 86.90%
Honduras $2,576,000,000 77.78%
Nicaragua $484,300,000 62.98%
Guatemala $1,789,000,000 60.55%
Costa Rica $598,500,000 17.84%
Morocco $77,214,816 19.49%
Bahrain $187,800,000 49.64%
China $14,860,000,000 9.80%
Notes: † NAICS product categories 313 (Textiles and Fabrics), 314 (Textile Mill Products) and 315 (Apparel
and Accessories). Data from the ITC DataWeb database.
38

Table 7. Percentage Change in Export Values in Constant U.S. Dollars
Country
Period
No. of years
Average annual growth
rate Japan 1954-81 27 14.2 Korea 1960-95 35 21.5 Malaysia 1968-96 28 10.2 China 1978-02 24 11.9 NIEs* 1966 31 13.1
Source: Prasad and Rumbaugh 2003, 48. *Newly industrialized economies of Hong Kong SAR, Korea,
Singapore, and Taiwan (Province of China).
39