us social media trends final october_2011_slideshare_short
TRANSCRIPT

W A V E 5 U S S O C I A L M E D I A R E P O R T
S L I D E S H A R E E X T R A C T
O c t o b e r 2 0 1 1
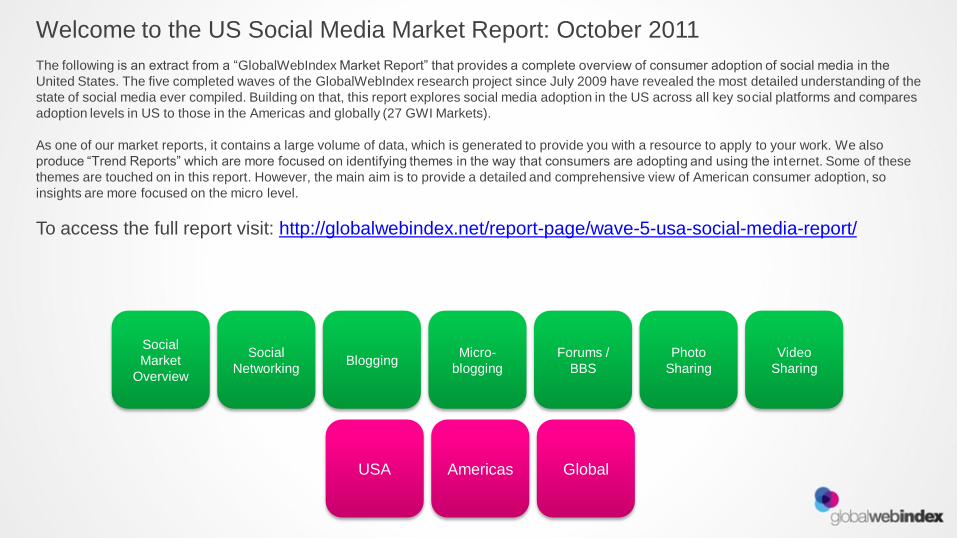
Welcome to the US Social Media Market Report: October 2011
The following is an extract from a “GlobalWebIndex Market Report” that provides a complete overview of consumer adoption of social media in the
United States. The five completed waves of the GlobalWebIndex research project since July 2009 have revealed the most detailed understanding of the
state of social media ever compiled. Building on that, this report explores social media adoption in the US across all key social platforms and compares
adoption levels in US to those in the Americas and globally (27 GWI Markets).
As one of our market reports, it contains a large volume of data, which is generated to provide you with a resource to apply to your work. We also
produce “Trend Reports” which are more focused on identifying themes in the way that consumers are adopting and using the internet. Some of these
themes are touched on in this report. However, the main aim is to provide a detailed and comprehensive view of American consumer adoption, so
insights are more focused on the micro level.
To access the full report visit: http://globalwebindex.net/report-page/wave-5-usa-social-media-report/
Social
Market
Overview
Social
Networking Blogging
Micro-
blogging
Forums /
BBS
Photo
Sharing
USA Americas Global
Video
Sharing

R E P O R T H I - L I G H T S

Key Insights
• Social media is a core part of how consumers use the internet in the US
and usage has reached an incredible level of maturity. Usage is growing
in older and laggard consumer segments, catching the younger groups
who pioneered adoption.
• Social networking and photo sharing are the leading online social
channels in the US.
• Social networking and video sharing are the fastest growing platforms.
• Product reviews, Q&A services and forums have the smallest differences
between young and old consumers.
• Despite the rise of Twitter, there are still 50% more bloggers in the US.
• There is massive diversity in behaviour between demographics. For
example, Hispanics are more active on social networks, higher income
groups on blogs, and urban segments (as opposed to suburban or rural
internet users) are more active across all platforms. This emphasises the
need to develop specific insights into how your target audience and
customers use social media.
• High income and education segments are more likely to drive adoption of
social media through mobile and tablets.
• There is shift to more passive usage of social networks with users
consuming content and interacting with brands but less likely to contribute
themselves. This is good news for marketers who want to develop a
content programme.

Online Actions / Behaviour (PC) Done In The Past Month US:
0%
10%
20%
30%
40%
50%
60%
70%
80%
90%
100% USA Wave1 - Jul 2009 USA Wave2 - Feb 2010 USA Wave3 - Sep 2010 USA Wave4 - Feb 2011 USA Wave5 - Jun 2011
Base: Wave 1 (Sep 2009)-5 June 2011
Question: Which of the following have you done online in the past month? – Have done.
We can see from the last five waves of data
on consumer internet behaviour that there
has been a very consistent access profile.
Crucially for social media, it is clear that it
is an integral part of how US internet users
engage online.
•Social networking is the lead point of
behaviour for contribution. It has been
growing, but seems to have peaked in
February 2011 (Wave 4);
•Instant Messenger has been the major looser
as internet users shift to networked
environments and mobile over peer to peer
devices. We also see a rise in people
messaging via VOIP;
•Microblogging in the US is stagnant in terms
of consumer adoption. This proves that most
of Twitter’s recent growth can be attributed to
international adoption;
•Webmail usage is still increasing despite the
hype about social networking messaging
replacing email;
•Blogs are declining, a pattern seen on a
global scale

Social Media – Core Demographic Overview
Asked
/an
sw
ere
d a
qu
estion
on
a Q
/A
serv
ice
Com
men
ted
on
a
sto
ry
Man
ag
ed
socia
l
ne
twork
pro
file
Po
ste
d o
n a
foru
m/B
BS
Revie
wed
a p
rod
uct
or
bra
nd o
nlin
e
Uplo
ad
ed
ph
oto
s
on
line
Used
a m
icro
blo
gg
ing
serv
ice
Used
a s
ocia
l
bo
okm
ark
serv
ice
Wri
tten
you
r ow
n b
log
Gender Male 21% 29% 47% 28% 41% 34% 8% 13% 12%
Female 22% 26% 55% 26% 42% 49% 5% 10% 12%
Age Groups
16 to 24 33% 35% 73% 37% 46% 63% 15% 25% 23%
25 to 34 23% 37% 67% 35% 45% 54% 11% 16% 16%
35 to 44 18% 28% 56% 25% 40% 41% 5% 11% 11%
45 to 54 20% 19% 36% 20% 40% 29% 2% 8% 8%
55 to 64 15% 19% 27% 19% 39% 27% 1% 2% 4%
Ethnicity
Asian/Pacific Islander 23% 35% 55% 38% 49% 50% 15% 23% 24%
Black/African American 32% 30% 50% 23% 48% 46% 6% 16% 16%
Hispanic 30% 34% 61% 30% 52% 56% 8% 23% 19%
White/Caucasian non Hispanic 20% 26% 50% 26% 40% 40% 6% 10% 10%
Marital Status
Single 26% 32% 59% 34% 44% 46% 11% 17% 16%
In a relationship 26% 30% 65% 31% 42% 51% 7% 16% 13%
Married 19% 25% 47% 23% 41% 40% 5% 9% 10%
Divorced/widowed 18% 22% 39% 24% 38% 27% 3% 8% 8%
Final Education Level
Schooling until age 16 30% 28% 49% 30% 46% 45% 10% 18% 14%
Schooling until age 18 21% 19% 48% 23% 46% 45% 3% 9% 8%
Trade/technical school or college 21% 25% 43% 25% 46% 37% 4% 9% 9%
University 22% 31% 58% 28% 43% 43% 9% 13% 14%
Post graduate 17% 34% 55% 32% 41% 44% 9% 14% 16%
Living Context
Rural context 18% 20% 47% 20% 41% 35% 4% 7% 10%
Suburban context 20% 27% 52% 27% 40% 43% 6% 12% 11%
Urban context 28% 34% 55% 34% 46% 47% 12% 17% 15%
Question: Question: Which of the following have you done online in the past month? – Have done, but not in the past month
Base: All Internet Users Wave 5 June 2011

Which Of The Following Sites Have You Visited In The Past Month?
0%
10%
20%
30%
40%
50%
60%
70%
80%
90%
100%
Chatroom/forum A photo sharing website
Consumer review site
A blog/weblog A video sharing site A social networking website
Wave1 - Jul 2009 USA Wave2 - Feb 2010 USA Wave3 - Sep 2010 USA Wave4 - Feb 2011 USA Wave5 - Jun 2011 USA
Base: Wave 1 (Sep 2009)-5 June 2011
We can see from the last five waves of data
clear growth of social networking
Chatroom and forum visitation has declined
demonstrating the shift from old static social
into more networked real time platforms
Social video is still showing growth as an
access point
All platforms, with the exception of social
networking, demonstrate some seasonality in
access
Question: Which of the following sites have you visited in the past month? – Have done.

“Social Networking is saturated in the US and
behaviour is shifting into a more passive usage.
Visitation remains high, but users are doing less”
“Three platforms dominated, Facebook, MySpace and
LinkedIn. LinkedIn is showing significant growth and
Facebook has reached absolute market saturation”
“Mobile platforms are the key growth points and starting
to erode PC access”
“Sharing video content is growing, despite a fall in most
active activities”
Key Insights

A C C E S S T H E R E P O R T

What do you get?
• Access to the most detailed study ever conducted on how consumers use
social media
• A 104 page PPT report, containing a mix of data, graphs and insights into
market trends
• Overview of the US social media market, context in global mega trends,
deepdive into social networking, blogging, micro-blogging, forums and
photo sharing
• Comparisons to global markets, trends over time and splits by key
demographics, such as age, gender, education status, ethnicity, living
status, income, US state, children in household and urban status
• Includes one request for custom output from the GlobalWebIndex Analyst
team. This covers one question and one specific analysis (it could be any
of the 160 questions in the survey, not just what is covered in this report);
for example “I want to know what applications high income US consumers
are downloading” or “who writes blogs about music in the US”. This is
provided inside 24 hours, on proof of purchase, in PPT and excel format
• The option to utilise our analyst team on request, which enables you to
source any possible further insight as explored in this report. For a full list
of questions, visit: http://globalwebindex.net/explore-the-data/introduction/

Detailed Report Coverage
Question Variable Data Period Trend Audience
US Americas (
US + Canada + Mexico + Brazil + Argentina) Global
AGE GROUPS (US ONLY)
EDUCATION (US ONLY)
ETHNICITY (US ONLY)
INCOME (US ONLY)
REGION (US ONLY)
Social Web Behaviour/Actions Have Done All
Social Web Behaviour/Actions Have Done Wave 5
Social Web Behaviour/Actions Have done but not in
the last month Wave 5
Social Web Behaviour/Actions Never Done Wave 5
Social Web Behaviour/Actions Not Heard Of Wave 5
Access Points Wave 5
Blog Platforms Wave 5
Blog Platforms All
Blog Types of Content Post Wave 5
Blog Topics of Content Post Wave 5
Blog Frequency of Update All Wave 5
Blog Motivations Wave 5
Photo Sharing Motivations Wave 5

Detailed Report Coverage Continued
Question Variable Data
Period Trend Audience
US Americas
(US + Canada + Mexico + Brazil + Argentina) Global
AGE GROUPS (US ONLY)
EDUCATION (US ONLY)
ETHNICITY (US ONLY)
INCOME (US ONLY)
REGION (US ONLY)
Microblog Platforms All
Microblog Actions Wave 5
Microblog Frequency of Update All Wave 5
Microblog Motivations Wave 5
Social Network Platforms All
Social Network Platforms Wave 5
Social Network Activities All
Social Network Frequency of Update All Wave 5
Social Network Motivations Wave 5
Social Network Group Motivations Wave 4
Chat-rooms, Forums, Message Boards Platforms Wave 5
Chat-rooms, Forums, Message Boards Types Wave 5
Chat-rooms, Forums, Message Boards Types All
Chat-room, Forum, Msg Board Motivations Wave 5
Photo Sharing Platforms All
Photo Sharing Platforms Wave 5
Photo Sharing Motivations Wave 5

Who Is This Report For?
• Typical User:
– Social Media Marketer
– Communications planner
– Agency planner or research
– Researcher
– Business Owner
– Analysts
• Purpose:
– Developing US social media strategy
– Structuring your social media business
– Developing effective social media campaigns
– Making the case for social media investment
– Understanding the reality of US trends
• Types of questions it answers:
– What are the most popular social platforms in the US?
– What consumers are most active in certain platforms?
– How many US consumers are involved in social media?
– What states are most engaged?
– Should I be focusing on PC, or mobile channels?
– Do people still use MySpace?
– Should my brand really be on Twitter?
– How do people use social networks?

Customising the data set
• We understand the need for custom view of all data, so all purchasers of
this report can request a custom analysis of a specific question in this
report for no additional charge
• For example you may want to analyse which social network platforms are
used by people with a appetite for “high risk”, or people in “senior job
roles” or “buyers of haircare products”. It does not include specific brand
data, this can be supplied at a additional fee
• As the survey is extremely detailed, we can normally create any audience
or customer segment you can define
• This will be supplied to the purchaser within 24 hours in PPT and excel
format
• To make your data request contact the insight team on
Demographics
Attitudes
Employment
Purchasing
Any
Question

A B O U T T H E R E S E A R C H
“The most detailed research study
ever instigated into the consumer
adoption of the internet”

Delivered In All Key Internet Markets
Waves 1 - 4
Wave 5
Wave 6
Wave 7
Wave 8
Future Waves

Filling A Critical Knowledge Gap
100K+
surveys a
year
3 Waves of
Research
a Year
27 markets
in Wave 5
1000+
variables
to build an
audience
160
questions
on internet
and social
+ + +
Insight Creativity Strategy Planning R O I
+

• Self completion online Surveys
• Identical global survey – localised by language,
brands and examples
• 3 fieldwork periods a year
• Online representative sample that covers all access
points
• Fieldwork is executed by Lightspeed Research
(WPP)
• This data can only be sourced through surveys
PC Browser
Access
Mobile Access
TV Access
Tablet Access
Console Access
Research Universe: Methodology

Timeline: 3 Waves Per Year. USA Core Market From Wave 1 (Sep 2009)
Wave 1
(Sep
2009)
July
2009
Wave 2
Jan
2010
Wave 3
Sep
2010
Wave 4
Feb
2011
Wave 5
June
2011
Wave 6
Oct
2011
Wave 7
Feb
2011
16 Markets
16K Internet
Users
US: 2K
Internet
Users
16 Markets
16K Internet
Users
US: 2K
Internet
Users
18 Markets
18K Internet
Users
US: 2K
Internet
Users
22 Markets
21K Internet
Users
US: 2K
Internet
Users
27 Markets
23K Internet
Users
US: 2K
Internet
Users
30 Markets
27K Internet
Users
US: 2K
Internet
Users
33 Markets
31K Internet
Users
US: 4K
Internet
Users
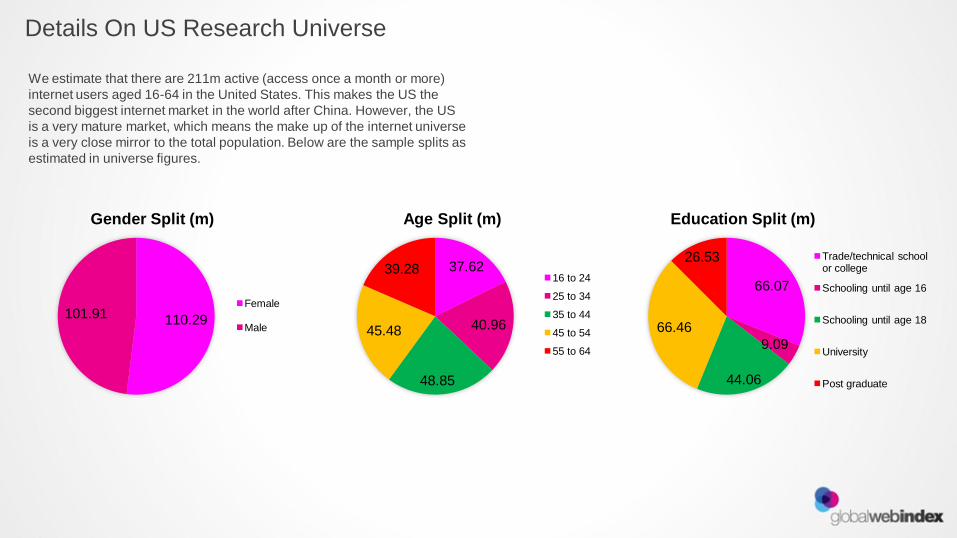
Details On US Research Universe
110.29 101.91
Gender Split (m)
Female
Male
We estimate that there are 211m active (access once a month or more)
internet users aged 16-64 in the United States. This makes the US the
second biggest internet market in the world after China. However, the US
is a very mature market, which means the make up of the internet universe
is a very close mirror to the total population. Below are the sample splits as
estimated in universe figures.
37.62
40.96
48.85
45.48
39.28
Age Split (m)
16 to 24
25 to 34
35 to 44
45 to 54
55 to 64
66.07
9.09
44.06
66.46
26.53
Education Split (m)
Trade/technical school or college
Schooling until age 16
Schooling until age 18
University
Post graduate