us lithium-ion cell manufacturing supply chain
TRANSCRIPT

BREAKING DOWN THE LITHIUM-ION CELL MANUFACTURING SUPPLY CHAIN IN THE U.S. TO
IDENTIFY KEY BARRIERS TO GROWTH
Chris Dougher
Timothy L. Johnson, Ph.D., Advisor
Support from Sue Babinec (Senior Commercialization Advisor, ARPA-E)
April 23rd, 2018
Masters project proposal submitted in partial fulfillment of the requirements for the Master of Environmental Management degree in the Nicholas School of the Environment of Duke University

Table of Contents
Executive Summary ............................................................................................................................ 3
Introduction ........................................................................................................................................ 4
Objective ............................................................................................................................................ 7
Background ......................................................................................................................................... 7 Global Cell Capacity ..................................................................................................................................... 13 Breakdown of Current U.S cell Manufactures .............................................................................................. 14
Methods and Findings ...................................................................................................................... 15 Cost of Labor ............................................................................................................................................... 16 Raw Material Supply Chain Considerations ................................................................................................. 18 Cost of Capital ............................................................................................................................................. 21 Expertise in Storage Technology Labor ........................................................................................................ 22
Discussion ......................................................................................................................................... 23
Conclusion ........................................................................................................................................ 26 Key Findings ................................................................................................................................................ 27 Recommendations ....................................................................................................................................... 28
Literary Citations .............................................................................................................................. 29

Executive Summary
For over 100 years, the world has relied on energy pulled from fossil fuels in the form of coal, gas, and
oil. These sources have powered homes, businesses, industry, and transportation. For the first time in
our lifetimes there appears to be a shift underway. The majority of the countries in the world are
considering a change to other forms of energy in solar, wind, and hydro. This switch triggered the need
to create storage solutions as these sources do not always produce on demand. Many believe that
storage will be the key to the energy transition, both on the grid and in transportation. The go-to
technology for storage has been lithium-ion based batteries, first used in the consumer market, and now
in the transportation and large-scale storage markets. This technology is based on the transfer of
lithium-ions between an alloy and graphite-based electrode forming a lithium-ion cell. The cells are
grouped together to form a battery pack which can then be used to power cell phones, laptops, vehicles,
and grid storage. The technology was first researched and invented in the United States, but it is
currently manufactured globally, with the majority of cells produced in Asia.
This report investigates lithium-ion cell manufacturing in the United States, identifying potential barriers
to growth. Current and future production is expected to be in China, South Korea, and Japan with the
U.S. lagging behind. It is critical for the U.S. to house domestic manufacturing of this key technology due
to the significant investment in the research and development. The U.S. has seen a similar situation play
out with solar photovoltaic production moving to China after intellectual property was developed and
established in America. If these trends continue, it could threaten the government’s appetite to
continue to fund the research needed to advance the transition to renewables.
A closer look at the history of lithium-ion is taken in order to understand what is holding manufacturing
back in the U.S. A breakdown of current cell manufacturing by country is revealed as well as a
breakdown by manufacturer domestically. Trends and predictions are shown for where the growth will
occur over the next 5 to 10 years to better understand the impact of today’s decisions and efforts. It is
important to understand the demand from each of the three sectors that end up using lithium-ion cells:
automotive, consumer, and grid. As of 2017 the automotive sector, producing electric vehicles (EV), has
become the largest user. Explosive growth in this industry will make it the dominate user of energy
storage technologies into the future and will be the reason for growth in the cell manufacturing
industry. This will form findings and recommendations in the report.

Five key characteristics are presented in an effort to understand where barriers may exist. These include
labor costs, cost of capital, labor expertise, raw material supply chains, and policy. Each one is examined
individually to uncover its importance in key production decisions. While differences between the U.S.
and Asian countries are found in labor costs and the cost of capital, they do not appear to be key drivers
of cell manufacturing investment decisions. The U.S. also appears to have companies that were early
movers in cell manufacturing, that have since spawned a labor pool for the industry. Interesting
strategic plays by Japan, South Korea, and China are found across the supply chain. These strategic
approaches have given these countries an edge and appear to create a barrier to growth in the U.S.
Finally, policy decisions in China have significantly tilted the scales in their favor with respect to
manufacturing investment. Research done by ARPA-E depicts how China has approached the problem
with a full scope, from raw materials to the end user, and driven demand to pre-load their new
factories.
Suggestions and recommendations conclude the report with a focus on a more holistic and a big picture
approach to the issue. If the U.S. does not invest in the electrification of its transportation fleet, it will
not have the demand to drive large scale cell production investment. Without scale, these factories will
not be able to compete. The supply chain must be considered from material sourcing to intermediate
steps.
In order to collect a long-term return on the R&D investments made domestically, the U.S. government
must continue to invest throughout the scale-up and commercialization process. More importantly, it
needs to help drive the demand by supporting and promoting EV production domestically. The U.S. not
only stands the chance of missing out on an entirely new industry, but also failing to collect on its
original investment. Without this return, future investment is threatened, creating a lack of
development for everyone.
Introduction
The energy storage industry is experiencing drastic changes on many fronts. From increased demand to
huge growth projections, the need for transportation-related, consumer device-related, and stationary
storage is significant. Policy around complements such as wind, solar, and electric vehicles (EV) can help
drive or stagnate growth in the storage industry. This storage currently takes the form of lithium-ion
batteries which use mined metals and other materials to store ions that provide electricity on demand.
While the U.S. has been a leader in innovation and technology development in this space, it has suffered

a serious disadvantage when it comes to manufacturing, seeing much of the intellectual property and
research and development move to Asia for full scale production. Current and future lithium-ion cell
manufacturing capabilities appear to be shifting away from the U.S. Without this manufacturing the U.S
fails to capture significant economic gain from the R&D investment already made. The country will miss
the opportunity to increase jobs, earn taxes, and be energy independent with the next source of fuel for
transportation. This could cause the U.S. government to reduce funding for research which will stagnate
needed growth in the industry. This would not only hurt the U.S. but could have long term global effects.
It is critical that lithium-ion cell manufacturing occurs domestically.
The leading technology for
energy storage has become
lithium-ion, for mobile
applications such as EV and
portable device batteries.
Stationary storage is also
moving to lithium-ion with
large scale pumped hydro
running out of favorable
geographical locations. The
National Renewable Energy
Laboratory estimates that
88 percent of all lithium-ion
batteries (LIB) are made in
China, South Korea, and
Japan. (Farris, March 27,
2017 ) The U.S. has been
slow to respond, even with the
aggressive growth of
Panasonic/Tesla’s production, Johnson Control’s Li-Ion production, and LG Chem’s expansion of their MI
plant. (Ayre, February 21, 2017) Trade flows, as can be seen in Figure 1 from the Clean Energy
Manufacturing Analysis Center (CEMAC), show that the U.S. is importing over $1.7 billion worth of
lithium-ion cells, while Japan, Korea, and China are net exporters. The situation is worse than depicted in
the chart, as the $754 million in U.S. exports are actual shipments of end use electric vehicles (which
Figure 1. Import / Export of Lithium Ion Cells, 2014 (Debra Sandor, January 2017)

house the cells). There is a small amount of cell exports due to shipments for Chinese bus
manufacturers, but this is expected to vanish within the year. With a stationary storage market worth
around $400 million in 2016 and projected to reach over $2 billion by 2020 and an automotive battery
market worth an additional $2 billion today with an expected compounded annual growth rate of 30%+,
this is a serious opportunity for manufacturing growth. (Debra Sandor, January 2017)
Lithium-ion battery demand from EV alone will grow from 21 GWh in 2016 to over 1.3 TWh in 2030,
with 270 GWh online by 2021. (BNEF, July 2017) On a positive note for the U.S., the industry is still
young and growing quickly. There are many efforts, funding, and support for new advancements to
existing base chemistry and cutting edge new technologies that could impact the market. This work is
being done domestically and is supported on multiple fronts by the Advanced Research Projects Agency
– Energy (ARPA-E), the National Renewable Energy Lab (NREL), and the U.S. Department of Energy
(DOE).
Since 2009, ARPA-E has been funding cutting edge research in energy with $300 - $400 million a year,
and part of this is going to energy storage. (ARPA-E, n.d.) This has resulted in many successful storage
companies from A123 (high energy lithium-ion cells) to 24M (semi solid-state lithium-ion packs).
Funding also helped develop more energy dense materials research and cell performance research at
the university level. The DOE has also supported commercialization efforts with loan guarantees. Much
of this effort has helped advance the world to current lithium-ion technologies as well as the next round
of technologies. There is concern that without growth in the manufacturing sector for these existing
technologies funding could dry up. As a country we will also be poorly positioned to benefit from the
pipeline of advancements being worked on now.
The focus of this report is to create a learned document that lays the foundation to understand the U.S.
supply chain for existing and new technologies for energy storage cell manufacturing, with a strong
focus on lithium-ion. It will analyze important factors that drive growth and how they can be applied in
the U.S. The overall hypothesis is centered on five key barriers that may be holding back this growth. A
conclusion of the research is presented with recommendations on how the U.S. can improve conditions
for cell manufacturing domestically. The recommendations apply to future technologies as well. Without
a foundation for growth in existing technologies, new ones will follow the same path to Asia.

Objective
The purpose of this project is to identify what drives energy storage cell manufacturing and where the
weaknesses and gaps exist for the U.S. This includes manufacturing for new and existing technologies.
For new technologies, how is the U.S. positioned to allow growth from concept to commercialization?
For existing technologies, where will the growth come from and will it occur in the U.S. or elsewhere in
the world?
Hypothesis: New and existing lithium-ion cell manufacturing in the U.S. has been limited due to one or
more of the following barriers:
• Cost of Labor
• Raw Material Supply Chain Considerations
• Cost of Capital
• Expertise in Storage Technology Labor
• Policy
Policy considerations and research performed by ARPA-E will be outlined at the end of the report, but a
better understanding of the economics, knowledge, and the supply chain will be sought out first. This
project will analyze each of the listed metrics in detail and examine which, if any, carry more weight
when driving manufacturing growth in this industry.
Background
Lithium-ion cells are comprised of four main components and a case. They come in multiple form factors
but the most popular are cylindrical, prismatic, and pouch cells. Figure 2. shows an example of a
cylindrical and prismatic cell. Two of the key components are known as electrodes: one anode (holds the
lithium ions while charged) and one cathode (holds the lithium ions when discharged). Traditionally the
anode is made of graphite while the cathode can be an alloy of multiple metals (nickel, cobalt, lithium,
others). When charging, the lithium ions are “pushed” from the cathode through a solution called an
electrolyte to the anode. When ready for discharge a circuit is completed and when the ions flow back
to the cathode a current is generated along the circuit. A thin film of material called a separator sits
between the electrodes and prevents them from making contact and shorting.

These components are wrapped tightly in the casing and tabs are exposed for a positive and negative
terminal. The cells are then arranged and connected to build a battery pack. Packs can be found in
everything from a cell phone, to a laptop, drill, or electric vehicles.
Lithium-ion cells were first commercialized by Sony in 1991. Much of the research and development
prior to commercialization was done in U.S. universities but was not produced on a commercial scale
until the early 90s. The cells were initially used in camcorders and were quickly adopted in many mobile
applications including phones. As the energy density and power improved over the years, lithium-ion
became the chemistry of choice for electric vehicles in the early 2000’s.
How much energy and power the battery can store is critical to its application. Lithium-ion currently
provides the best option for both of these characteristics for mobile applications. Figure 3. shows how
technology has moved up this scale and future advancements will drive this even further.
Figure 2. General Construction of a Cylindrical and Prismatic Lithium-ion Cell (Anderson, 2010)

A lithium-ion cell is part of a long supply chain that takes mined raw materials and converts them into
energy storage devices used in a wide variety of applications. A brief overview of this supply chain can
be seen below in Figure 4.
Figure 4. Lithium-ion Supply Chain
Spec
ific
Pow
erW
/kg
500
Specific EnergyW-hr/kg
300
Lead Acid
NiCd
NiMH
CurrentLi-Ion
Technologies
Future TechnologiesSolid State
Silicon AnodeLi-SLi-Air
Figure 3. Graph of Power vs. Energy in Existing and New Storage Technologies (University, n.d.)

This supply chain includes all major materials needed to form the battery pack. There are key strategic
measures taken by processed material manufacturers, cell manufacturers, pack manufacturers, and end
users related to location (more detail below).
The manufacturing process discussed in this paper is related to the “Lithium-ion Cell” box in the “Pack
Inputs” shown in Figure 4. Cell production is a critical step in this supply chain as it requires a sizeable
workforce, significant capital to build and operate, and technical manufacturing knowledge. It is the key
cost driver going into the pack and is responsible for integrating the majority of the processed materials
and sub-components upstream.
As discussed above, the history for commercial lithium-ion energy storage technologies started in the
early 1990’s with Sony launching Li-ion batteries for consumer electronics. While this market grew
during the 2000’s and has dominated the demand for lithium-ion in the past, it is already being
surpassed by automotive demands. Initially the electric vehicle demand spawned from the automotive
electric bus demand in China, and other areas of the world, but this is growing to include significant
demand from light duty and passenger vehicles.
Figure 5. Lithium-ion cell sales worldwide ($M) (Pillot, October 2017)
As can be seen in Figure 5., the consumer electronics market demand for cells has leveled off since 2011
and growth has been taken up by power tools, electric buses, and industrial energy storage (stationary

storage). While the electronic device market is expected to grow at a CAGR of 6% over the next 10 years,
the electric vehicle market is expected to grow at a 14% rate during that same time period. (Pillot,
October 2017) BNEF further projects out to 2030, expecting serious growth from EV while consumer
goods and stationary storage remain fairly flat, see Figure 6. below.
Figure 6. Electric Vehicle demand on lithium-ion batteries (Wilson, 2018)
China appears to be driving this growth with over 55% of EV units sold in 2016, thanks to aggressive
policy and government driven incentives. (Pillot, October 2017) It is clear that electric vehicle demand
will drive growth in cell manufacturing and much of this demand is coming from outside of the U.S.
0
200
400
600
800
1000
1200
1400
2016 2018 2020 2022 2024 2026 2028 2030
Li-Ion Cells Demand (GWh)
Stationary Consumer Vehicle

Figure 7. Electric Vehicles (PHEV and HEV) by Region (Pillot, October 2017)
This growth of electric vehicles is expected to continue at an explosive rate. Depending on the source, by
2025 either China or Europe as a whole will be leading the charge in EV units sold per year. The U.S. is
expected to trail significantly. Figure 8. shows one of these predictions with Europe selling over 6 million
units a year and China not far behind.
Figure 8. Electric Vehicles (PHEV and HEV) by Region (Statista, 2018)
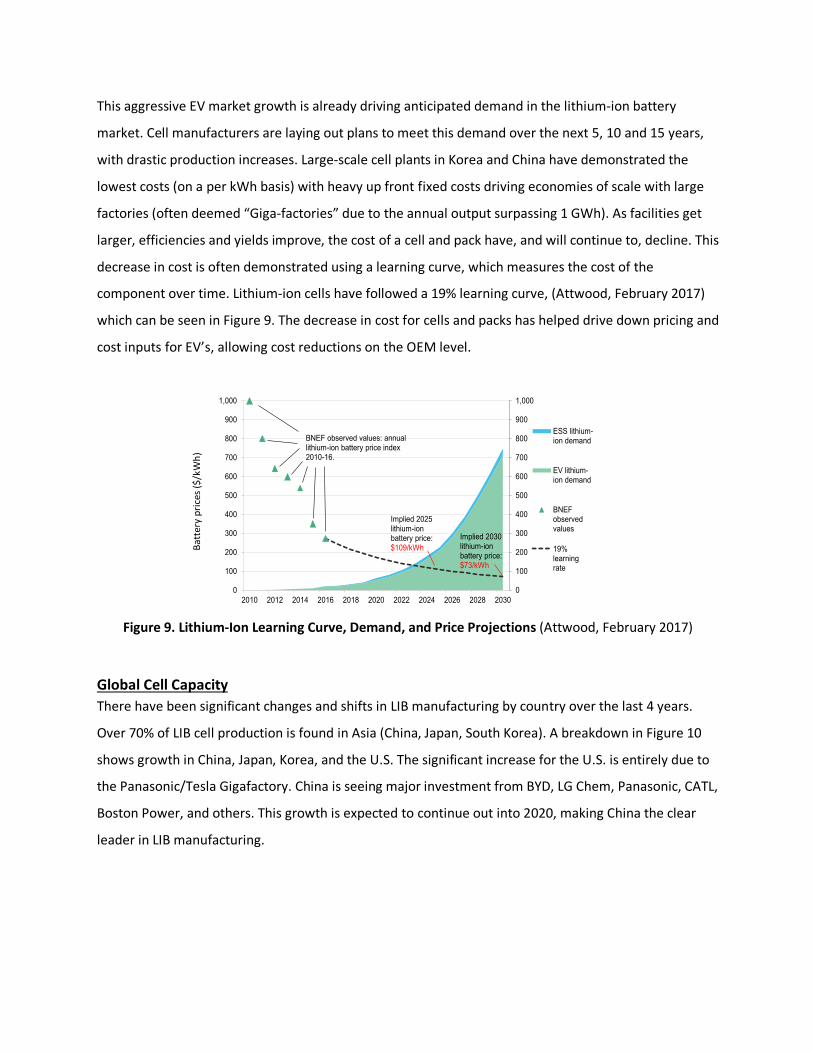
This aggressive EV market growth is already driving anticipated demand in the lithium-ion battery
market. Cell manufacturers are laying out plans to meet this demand over the next 5, 10 and 15 years,
with drastic production increases. Large-scale cell plants in Korea and China have demonstrated the
lowest costs (on a per kWh basis) with heavy up front fixed costs driving economies of scale with large
factories (often deemed “Giga-factories” due to the annual output surpassing 1 GWh). As facilities get
larger, efficiencies and yields improve, the cost of a cell and pack have, and will continue to, decline. This
decrease in cost is often demonstrated using a learning curve, which measures the cost of the
component over time. Lithium-ion cells have followed a 19% learning curve, (Attwood, February 2017)
which can be seen in Figure 9. The decrease in cost for cells and packs has helped drive down pricing and
cost inputs for EV’s, allowing cost reductions on the OEM level.
Figure 9. Lithium-Ion Learning Curve, Demand, and Price Projections (Attwood, February 2017)
Global Cell Capacity There have been significant changes and shifts in LIB manufacturing by country over the last 4 years.
Over 70% of LIB cell production is found in Asia (China, Japan, South Korea). A breakdown in Figure 10
shows growth in China, Japan, Korea, and the U.S. The significant increase for the U.S. is entirely due to
the Panasonic/Tesla Gigafactory. China is seeing major investment from BYD, LG Chem, Panasonic, CATL,
Boston Power, and others. This growth is expected to continue out into 2020, making China the clear
leader in LIB manufacturing.
0
100
200
300
400
500
600
700
800
900
1,000
0
100
200
300
400
500
600
700
800
900
1,000
2010 2012 2014 2016 2018 2020 2022 2024 2026 2028 2030
ESS lithium-ion demand
EV lithium-ion demand
BNEFobservedvalues
19%learningrate
BNEF observed values: annual lithium-ion battery price index2010-16.
Implied 2030 lithium-ionbattery price:$73/kWh
Implied 2025 lithium-ionbattery price:$109/kWhBa
tter
y pr
ices
($/k
Wh)

2014 2016
Announced / Under
Construction 2020 Prediction
China 11,240 50,670 38,528 103,152
Japan 5,750 19,414 0 20,000
Korea 4,600 17,874 0 19,070
U.S. 4,600 22,016 22,000 46,075
EU 1,300 2,400 0 6,293
Figure 10. Automotive Lithium-Ion Cell Manufacturing Capacity in MWh Updates from CEMAC on (Donald Chung E. E., April 2016)
and Predictions (Desjardins, February 2017) for all but Japan
The Gigafactory will produce cells directly used in their own electric vehicles. The electrification of
transportation is driving the growth for LIB. The same is true in China as BYD produces for their own EVs
and cell makers such as LG Chem and Panasonic produce for the automotive market. From discussions
with industry experts, cell manufacturing in the U.S. will be stagnant or decline with the exception of
Tesla. LG Chem’s factory in Michigan appears to be held up by demand from GM, Ford, and Proterra
(electric bus maker). A123 has announced it will shutter it’s Michigan plant by 2019. (Walsh, April 2017)
The company is expected to expand operations in China and may look to Europe in the future. General
sentiment is that production will expand in China and Europe to meet EV demand.
Breakdown of Current U.S cell Manufactures A breakdown of current U.S. LIB cell manufacturing capacities by company is provided below to give
context to the discussion. There are now five major companies in the U.S. with A123 exiting before
2020. The only significant growth is seen by Tesla. Johnson Controls (JCI), LG Chem, and A123 have all
announced plans to expand capacity in Europe and China, not the U.S. The growth from Tesla is due to
the expectation of Model 3 sales over the next few years. This manufacturing investment strategy
follows the prediction above. Tesla is supporting EV locally while the others chase EV demand to Europe
and China. There is a slight difference in data between CEMAC 2016 numbers and the below for the U.S.
This is due to estimates of where the Tesla/Panasonic factory capacity is currently.

2016 2020 Prediction
XALT 7001 ?
LG Chem 2,6002 3,000
JCI 2,0003 ?
A123 8604 0
Tesla 5,0005 35,000
Figure 11. U.S Automotive Lithium-Ion Cell Manufacturing Capacities (MW)
1 - (XALT, 2018), 2 – CEMAC, 3 – Estimates from (Report, 2010), 4 - (Walsh, Battery maker A123 Systems reducing manufacturing, adding engineering, April 2017),
5- (Attwood, February 2017)
An understanding of the supply chain components, history of lithium-ion cells, and current trends is
critical to understanding the opportunities for future manufacturing and how the U.S. can prepare and
invest properly.
Methods and Findings
Much of the findings below are a synthesis of prior work research and discussions with industry experts.
Significant work has been done to understand critical raw material streams for the lithium-ion supply
chain, cost structures on the cell and pack level, and analysis around labor and capital costs at different
locations around the world. Sources include, but are not limited to, the Clean Energy Manufacturing
Analysis Center, Bloomberg New Energy Finance, Avicenne, and other published works. Discussions and
interviews with industry experts include individuals from (or previously for) A123, Oak Ridge National
Lab, ARPA-E, and multiple start-ups in the energy storage space. This includes experts that are working
with the development of next generation battery chemistries (solid state, silicon anodes, flow batteries)
as well as those working on cell manufacturing from a pilot level to full scale facilities. Multiple battery
manufacturing CEO/founders were consulted, ones that have run operations domestically. A supply
chain expert for lithium-ion cells provided extensive background on how and why purchasing decisions
are made. Finally, experts from different U.S. DOE branches weighed in on the lithium-ion cell supply

chain and U.S. market. Around a dozen industry interviews were conducted over a six-month time
period. We will now dive into each key barrier identified above in the hypothesis to understand its
impact in limiting cell manufacturing growth in the U.S.
Cost of Labor From a high level we begin by looking at labor rates across the world. Figure 12. shows some of the
countries discussed in this report and their corresponding cost of labor (for manufacturing). While Korea
and Japan have much lower costs than the U.S., Germany actually leads the group. Germany has seen
some investment in cell manufacturing with BMW and Varta. While the growth has not matched that in
Asia, it has seen investment. Although Chinese labor rates are not transparent, they are expected to be
similar to Mexico. Chinese labor rates are estimated to have grown by 64% since 2011. (Yan, 2017)
Figure 12. Global Manufacturing Compensation Costs (Board, 2018)
Two important studies have been performed in the past three years that included labor costs relative to
overall cell & pack cost/pricing. The first was done by BNEF in 2017: Bottom up cost scenarios for
lithium-ion batteries. (Attwood, February 2017) Using a cost structure breakdown that included
materials, cost of capital, and labor BNEF demonstrated different scenarios based on company, location,
and BHEV vs. PEV. In all scenarios, including two U.S. owned and operated plants, labor is less than 1%
of overall pack cost. (Attwood, February 2017) This number is inflated by pack labor, but even taking the
conservative assumption that this cost is entirely tied to the cell build, labor would still only represent
2% of the overall cost structure. This would suggest that labor is not a significant cost driver when
evaluating where to build a production facility.
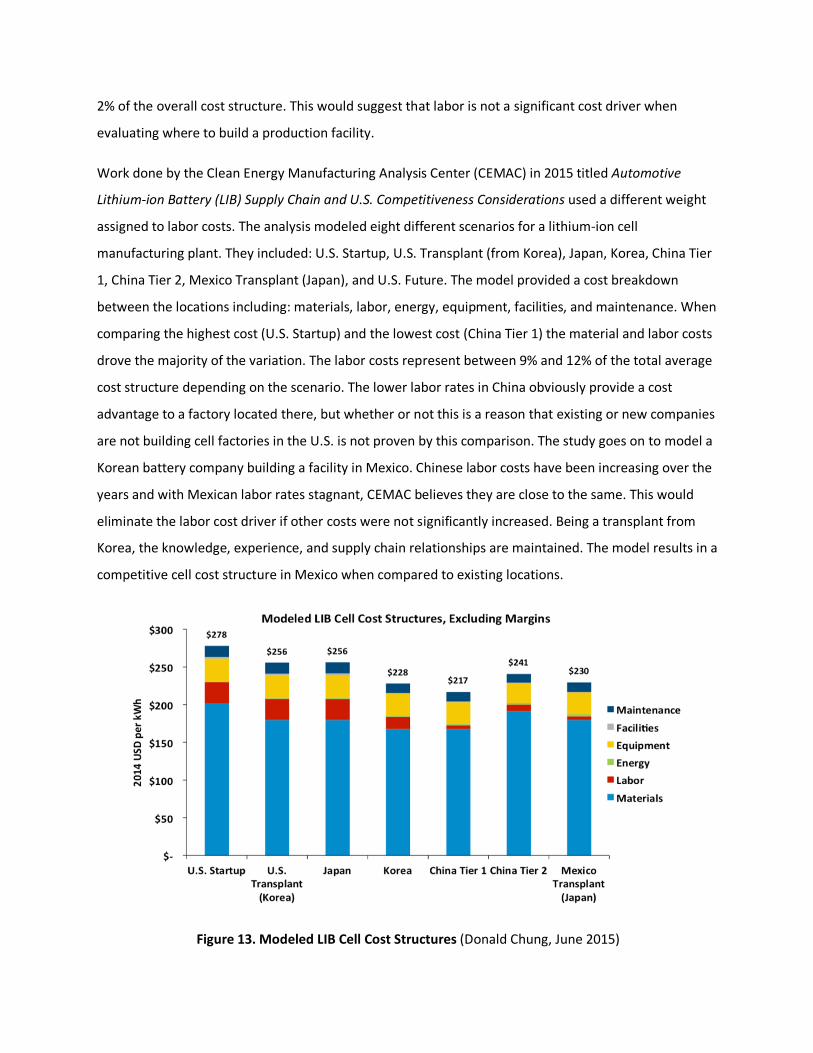
Work done by the Clean Energy Manufacturing Analysis Center (CEMAC) in 2015 titled Automotive
Lithium-ion Battery (LIB) Supply Chain and U.S. Competitiveness Considerations used a different weight
assigned to labor costs. The analysis modeled eight different scenarios for a lithium-ion cell
manufacturing plant. They included: U.S. Startup, U.S. Transplant (from Korea), Japan, Korea, China Tier
1, China Tier 2, Mexico Transplant (Japan), and U.S. Future. The model provided a cost breakdown
between the locations including: materials, labor, energy, equipment, facilities, and maintenance. When
comparing the highest cost (U.S. Startup) and the lowest cost (China Tier 1) the material and labor costs
drove the majority of the variation. The labor costs represent between 9% and 12% of the total average
cost structure depending on the scenario. The lower labor rates in China obviously provide a cost
advantage to a factory located there, but whether or not this is a reason that existing or new companies
are not building cell factories in the U.S. is not proven by this comparison. The study goes on to model a
Korean battery company building a facility in Mexico. Chinese labor costs have been increasing over the
years and with Mexican labor rates stagnant, CEMAC believes they are close to the same. This would
eliminate the labor cost driver if other costs were not significantly increased. Being a transplant from
Korea, the knowledge, experience, and supply chain relationships are maintained. The model results in a
competitive cell cost structure in Mexico when compared to existing locations.
Figure 13. Modeled LIB Cell Cost Structures (Donald Chung, June 2015)

At the time of publishing the report there was little lithium-ion production in Mexico. Furthermore,
there has been little investment since, and Mexico is a small player in the global market (see Figure 1
above). This would suggest that removing the higher labor costs (experienced in the U.S. model) does
not solve the issue since there has been little movement on LIB cell production in Mexico with the lower
labor costs. In fact, Mexico is currently an importer of lithium-ion cells from the U.S. The CEMAC report
goes on to show the minimum pricing that each location would need to charge to break even. Due to
higher material costs and margin requirements, new investment in the U.S. would require significantly
higher margins to break even vs. China or Korea. This brings us to our second barrier: raw material
supply chain.
Raw Material Supply Chain Considerations As shown in Figure 4. there are many minerals and materials that are important inputs into the lithium-
ion cell build. Of those listed the following apply to cell manufacturing: Cobalt, Lithium, Graphite,
Manganese, Copper, Aluminum, Nickel, and common electrolyte solutions. Cost and ability to access are
important to a cell plant as one can see from Figure 13., materials constitute the majority of the cost
associated with the final product.
Cobalt
Studies in the material supply chain space for LIB deem the largest supply chain risk for current
technologies to be with cobalt. Cobalt is also the most expensive raw material in current lithium-ion
battery cells and pricing has doubled in the last year. (Jaffe, October 2017) Recycling does not appear to
be an option at this point with limited supply due to 10-year lifetime of batteries and different form
factors, which make the process difficult.
There are two forms of risk associated with this material: The first risk is the metal’s by-product nature.
Only 6% of the world’s total cobalt production is primary production, or mining done specifically to
extract cobalt. The other 94% of cobalt production is as a by-product or co-product. (Elsa Ollivetti,
October 2017) This means that cobalt production is very dependent on nickel or copper demand, and
prices and availability will fluctuate with those metals. The second risk is Geo-political stability. The
largest production of cobalt comes from the Democratic Republic of Congo (DRC), which has a highly
unstable government and political conditions. (Elsa Ollivetti, October 2017)

While neither of these risks provide an advantage or disadvantage to any country looking to produce
cells, China has created a hedge through refinement (conversion of mined metal to a usable form for
cathode production). The country has invested in the refinement of cobalt and now the majority of
refining is concentrated in China, which is the leading supplier of the metal to the U.S. (Elsa Ollivetti,
October 2017)
Lithium
Lithium can be sourced from spodumene, brine, and pegmatites with brine and spodumene being the
most common. More than 80% of lithium is expected to be supplied from: Australia, Chile, and
Argentina.
Figure 14. Lithium Mine Production (Survey, 2018)
China is fourth on the list of lithium mining countries, but still requires large imports to satisfy demand
for cathode producers (processed material using lithium). The location of mining brine does not appear
to drive manufacturing investment and most sources believe that with current reserves and future
exploration, lithium will not be an issue for the supply chain. Jaffe found that with the expansion of
lithium supplies, the market will have enough geographical distribution and new resources to meet
battery demand for the next 10 years. (Jaffe, October 2017)

Graphite
Graphite can make up as much as 15% of a lithium-ion cell and is the majority of the anode (processed
material). It can be naturally found in the earth’s crust and has many end-uses. Batteries have grown
from 2% to upwards of 10% of the market for graphite over the last five years. China currently supplies
over 65% of the world supply of graphite, but crustal abundance of the material is high. There is
potential for increased production in Brazil, Africa, and the U.S. (Elsa Ollivetti, October 2017) Natural
graphite is fairly easy to mine and synthetic graphite (although more expensive) is a viable substitute.
Due to these conditions there is little risk to graphite supply. China does hold an advantage over the U.S.
at this time with the majority of supply coming internally, but if prices were to become a significant
concern, future mining would surface in North and South America.
Copper, Aluminum, Manganese, LiPF6, Polypropylene, Polyethylene
Research done on copper (current collector), aluminum (current collector), manganese (cathode), LiPF6
(electrolyte), polypropylene/polyethylene (separators) has shown that there is little concern or impact
to battery production from these materials. They are often commodities and use in batteries is a small
portion of their end market. An industry expert in the cell supply chain noted that if there is a shortage,
price increase, or supply concern, new suppliers will either enter the market or existing suppliers will
ramp up production to meet the demand within a few years. There appears to be little impact to
manufacturing decisions based off of these materials.
Processed Materials
The above raw materials are then processed to form cathodes, anodes, separators, and electrolytes. The
majority of this production is occurring in China, Japan, and South Korea. Figure 15. shows the
companies and locations of the processed material manufacturers.
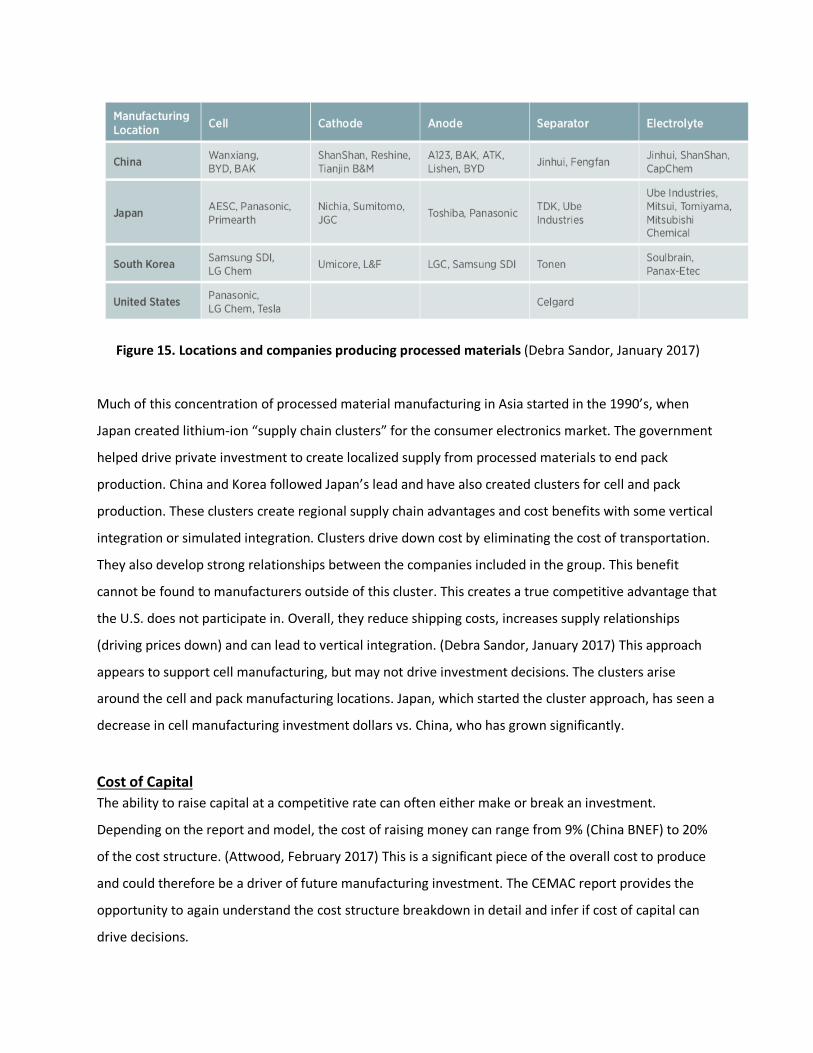
Figure 15. Locations and companies producing processed materials (Debra Sandor, January 2017)
Much of this concentration of processed material manufacturing in Asia started in the 1990’s, when
Japan created lithium-ion “supply chain clusters” for the consumer electronics market. The government
helped drive private investment to create localized supply from processed materials to end pack
production. China and Korea followed Japan’s lead and have also created clusters for cell and pack
production. These clusters create regional supply chain advantages and cost benefits with some vertical
integration or simulated integration. Clusters drive down cost by eliminating the cost of transportation.
They also develop strong relationships between the companies included in the group. This benefit
cannot be found to manufacturers outside of this cluster. This creates a true competitive advantage that
the U.S. does not participate in. Overall, they reduce shipping costs, increases supply relationships
(driving prices down) and can lead to vertical integration. (Debra Sandor, January 2017) This approach
appears to support cell manufacturing, but may not drive investment decisions. The clusters arise
around the cell and pack manufacturing locations. Japan, which started the cluster approach, has seen a
decrease in cell manufacturing investment dollars vs. China, who has grown significantly.
Cost of Capital The ability to raise capital at a competitive rate can often either make or break an investment.
Depending on the report and model, the cost of raising money can range from 9% (China BNEF) to 20%
of the cost structure. (Attwood, February 2017) This is a significant piece of the overall cost to produce
and could therefore be a driver of future manufacturing investment. The CEMAC report provides the
opportunity to again understand the cost structure breakdown in detail and infer if cost of capital can
drive decisions.

As mentioned above, CEMAC creates a “minimum sustainable cell pricing” model that includes a margin
to break even. This margin includes the cost of capital. The model shows that the most competitive
locations to build a cell manufacturing plant, including this margin requirement, are Mexico and then
China. The U.S. startup would require over 18% higher pricing to meet the increased labor, materials,
and now margin when compared to the simulated Mexican plant. (Donald Chung E. E., June 2015) This is
due to a weighted average cost of capital of approximately 14% used by the model. The report
concludes that in order for the U.S. to be competitive, a plant would need to obtain a cost of capital
around 8%. We can expect that this metric may not be driving investment decisions as there has been
little activity in regard to cell production in Mexico, with a lower cost of capital. Also, three established
companies in the U.S.: Energizer, LG Chem and Johnson Controls have existing battery plants located
domestically, all with lower costs of capital. JCI’s weighted average cost of capital is about 8.3%. (Donald
Chung E. E., June 2015) Tesla is another example that many will point to, and with its recent debt
offering one can estimate its cost of capital to be between 8% and 10%. (Trainer, 2016) Tesla is a unique
example, using vertical integration from cell to final EV production (allowing the elimination of margin
stacking). They produce and use the cells and packs at cost, which they build with their partnership with
Panasonic. Either way, lower costs of capital have been realized in the U.S. with little continued growth
in the manufacturing sector of LIB cells.
Expertise in Storage Technology Labor Another topic to investigate is if the U.S. is lacking in expertise and knowledge in its labor pool to be
successful at cell manufacturing. This would include engineering talent, supply chain expertise, and
operators that run the lines. The U.S. has long had a strong work force for industrial and manual labor,
from steel to automotive, and there is little question that the operations talent is available. The question
revolves more around high technology manufacturing. Industries such as semiconductor manufacturing
have found a home in the U.S., but lithium-ion production is a new technology that few from the U.S.
are familiar with.
In 2001 A123 Systems was founded out of MIT in Massachusetts. Over the next ten years it grew to over
3,000 employees and had received near $250 million in grants from the government to build a 550MW
lithium-ion cell plant in Michigan. Speaking with current and past employees (A123 filed for bankruptcy
in 2012 and was bought out by the Chinese Wanxiang Group), the company struggled at first to find
talent and expertise in the industry. Eventually it was able to train and create a strong team of
engineers, managers, and operators that has since served as the talent pool for the industry. While this

pool may be drying up with opportunities in Michigan and Nevada, there has been interest at the
university level with new programs such as Engineering, Battery Technologies at San Jose State. A supply
chain manager working in the industry domestically believes the core labor pool formed from A123 and
Dow/Kokam has supported cell manufacturing. Another industry expert commented that the U.S. does
not have the same level of expertise as its Asian counterparts, but this is not limiting investment.
Discussion
Cost of labor, raw material supply, cost of capital, and technology expertise were selected as the key
metrics that were expected to drive or inhibit manufacturing investment in the U.S. Outside of policy,
these are key factors that typically drive industry growth. Policy was not discussed above as a topic for
research in this project but will be discussed here. It is important to note that policy for the U.S.,
specifically around clean energy and separately around manufacturing, is drastically changing in 2018. It
is difficult to produce an output that could be useful in the future, not knowing the outcome of key
policy areas that are currently up for debate. This being said, there has been ongoing work done by
ARPA-E to understand the political environment around storage technologies and cell manufacturing
both in the U.S. and in China. Research conducted for this report was focused on business and economic
conditions surrounding the market environment in the U.S. and Asia. Policy considerations will be
discussed at the end of this section as ARPA-E has found significant differences between countries and
drivers that do impact investment decisions.
After reviewing literature research and industry interviews, we are able to pull some takeaway’s out of
each topic listed above. To start, the cost of labor in the U.S. does not appear to be limiting
manufacturing in LIBs. Although labor is cheaper in most of Asia, there are countries, such as Mexico,
with lower labor rates and lower cost of capital, that are also closer to key raw material supply, that do
not see an influx of LIB manufacturing. In general, as any manufacturing sector continues to move
towards automation (global trend in most industries), labor costs decrease as a percentage of overall
cost structure. While labor costs can be an advantage for other countries over the U.S. we believe that
they are not restricting investment in the sector domestically.
The raw material supply chain for LIB is complicated and includes mining minerals and metals from all
over the world. These materials are refined and shipped out to be processed into anodes, cathodes,
electrolytes, and separators. Cobalt appears to be an issue for all countries interested in producing

lithium-ion cells, with the majority of supply coming from the unstable country the Democratic Republic
of Congo. China has taken a strategic approach to Cobalt, increasing refining capabilities and therefore
controlling much of the supply. Lithium is primarily produced in three countries that are not significant
players in the LIB manufacturing industry. China does mine lithium but with over 50% of the world
lithium consumption and only 7% of the production, they are very dependent on imports. (Elsa Ollivetti,
October 2017). The other materials used in LIB manufacturing are either commodities with dispersed
production or used in minimal quantities with little restrictions on supply. The one exception to briefly
discuss could be Graphite, as although abundant, China does have an advantage since it produces most
of its consumption within the country. This is a low risk and if there was a supply chain concern,
production in other areas of the world is easy to turn on. Still, China appears to have a distinct
advantage with regards to the raw material supply chain.
Cost of capital is important when investing in capital heavy industries such as cell manufacturing. With
significant square feet required for high tech, automated tooling, CAPEX is a significant portion of a cell
manufacturing facility. BNEF showed us that it can be a significant piece of the cost structure, but we
have found examples where investment has not gone to countries with low costs of capital (such as
Mexico). We also pointed out examples of cell manufacturing through mature U.S. companies,
transplant companies, and even early stage companies, that have been able to obtain capital at
competitive rates. This appears to be an area of focus for new companies but not an inhibitor.
Finally, we covered the availability of expertise and knowledge in the labor pool in the U.S. While most
of the information came through industry interviews with individuals that have worked, and still work in,
cell manufacturing, we found a consistent pattern. As with any industry there is a constant need for
smart, knowledgeable people. This did not appear to differ drastically for the LIB industry. A123
demonstrated that it could scale up and train people in their technology for a 550MW facility. There also
appears to be new interest in the area from universities.
It is important to discuss in more detail the processed materials (intermediates between raw materials
and cell manufacturing) used in cell production. Companies in this sub-group of the industry include
cathode producers, graphite suppliers, separator manufacturers and chemical producers that supply
electrolyte. While CEMAC believes the U.S. could be competitive in processed material production, at
this point almost all suppliers are located in Asia. (Debra Sandor, January 2017) The U.S does have a
separator company in Celgard and multiple startups looking to commercialize new technology, but they
have yet to make a serious impact. The reason for the heavy investment in processed materials could be

tied to the “cluster” strategy many of the cell manufacturers, and pack manufactures, deploy. The
supply chain cluster approach used first in Japan and now heavily in China is providing a strategic
advantage for companies when tied with secured demand supplied from EV production. This is a critical
finding in the research: China drives demand for cell manufacturers through EV growth on one end of
the supply chain while supply chain clusters support it on the processed materials end.
In other words, it can be as simple as supply following demand tied to favorable environments in China
with supply clusters already in place, favorable labor rates, and available capital. But what is more
interesting is where that demand is coming from in China. It appears that the Chinese government is
pre-loading the demand for cell manufacturing companies by driving EV demand through policy. China is
either strategically focusing on EV manufacturing and cell manufacturing has been a bi-product or they
are focusing on the entire supply chain, leveraging the clusters model. ARPA-E found that China used a
variety of policy levers to create this demand and support the manufacturing sector. (ARPA-E, ARPA-E
Sources) They include:
• Dual Credit Program – This government program sets up a credit (mandate) for Chinese
Automotive OEMs. It requires their fleet to consist of 10% EV by 2019.
• Tariffs on Imports – Tariffs or outright bans on imports of EVs and cells create a favorable
environment for Chinese manufacturing companies. It can also drive international companies to
create a joint venture with a Chinese owned company that would then own 51% share of the
new venture. This can have obvious implications on intellectual property.
• Charging Mandates
• Emissions & Registration Restrictions – China has significantly increased the cost to register an
internal combustion engine while reducing the cost to register an electric vehicle.
• Subsidies on Cell Plants – The Chinese government will provide significant subsidies for
companies building cell plants with a capacity greater than 8 GW.
Now more than 90% of EV’s produced in China use Chinese produced cells. (Perkowski, August 2017)
Also, to note is that last year China removed EV battery cells and cathodes from their list (Section 1) of
favored foreign investments. Sectors called out on this list experience favorable customs, tax, and land
cost treatment. Battery separators remain on the list as China continues to try and close a small
technology gap they have with other countries. (I-Chung Hsiao, August 2017)

Meanwhile we have seen little commitment from the U.S. government on EV or cell manufacturing.
There are state-by-state programs that are varied but provide little impact, and the IRS Tax Credit for
EVs. The tax credit provides a credit of $7,500 on EVs purchased but is capped at 200,000 units sold by
manufacturer. This is for both domestic and foreign suppliers and is often argued that it will hurt U.S. EV
production as it encourages foreign supply.
What we believe we are seeing is that the LIB production (and current overcapacity) chase the expected
EV demand, directly to the location/country of EV manufacture. The significant growth shown in Figure
10. for China is tied directly to the expected growth of EV production in China. This has proven true for
the U.S. growth that will be occurring over the next few years. It is directly tied to the expectation of
Tesla EV sales, and the company has created their own cluster with Panasonic. EV growth predictions
appear to be strongest in China and Europe. The theory that cell manufacturing follows EV
manufacturing holds true for the predictions for China and the U.S., but Europe appears to have been
left off or is lagging.
One explanation for the difference with Europe could be the lag in data. BNEF reports from 2016 are
prior to major announcements of expected and already under construction LIB cell factories in Europe.
Daimler subsidiary Accumotive announced plans for a $550 million facility in Germany. (Hirtenstein,
May 2017) BMW opened its first phase of manufacturing in Germany in May of 2016. LG Chem has
announced plans of a factory in Poland to open in 2018. Samsung SDI has unveiled plans to build a 2.5
GWh plant in Hungary. Tesla has announced both a factory in Europe and China. (Deign, June 2017)
Conclusion
The U.S. is not being held back by the four barriers listed in the hypothesis on their own. Strategic
initiatives and favorable conditions in China have contributed to an advantage for companies producing
there when compared to the U.S. The EV market in the U.S. cannot support growth outside of the
homegrown Tesla EV demand. Companies with a current manufacturing footprint in the U.S. are not
growing because GM, Chrysler, and Ford are not aggressively pursuing electric cars, trucks, or buses.
Until there is a change in EV demand domestically, cell manufacturing will continue to move to China. If
the U.S. doesn’t look for ways to support and grow EV production, it may be too late, with significant
supply chains forming in other areas of the world. This would be another example of U.S innovation
leaking out of the country to markets that value investment in the end product more. Whether it be
global warming concerns, performance, or eventually cost to own, it appears that electric vehicles will

be the future of transportation. Predictions are as high as one in six new vehicles sold in 2025 will be
electric. (Sachgau, 2017) As cell manufacturing expands and plant utilization increases, the cost of
lithium-ion cells will decline. This will only support the EV market further, driving down costs, and
helping create new demand.
Investment continues in the U.S. around new technologies for batteries. From solid-state storage to
improved materials for electrodes, there are many new projects on the academic level and within
startups that will only improve the market. The issue will be that when these technologies are ready for
commercialization they will focus on where the end users are located. They will look to join or partner
with those in existing supply chain clusters located in Europe or Asia. This trend started in solar and
continues through energy storage, only now China appears to be even more strategic with its approach
to dominating the manufacturing sector. Until the U.S. realizes that it will need to support the entire
supply chain from processed intermediates through to the end product, little investment growth can be
expected in lithium-ion cell manufacturing.
Key Findings Figure 16 summarizes the key findings from the research in this report.
Figure 16. Report Key Findings

Recommendations The recommendations resulting from the work and findings above can be broken down into two main
categories. The first revolves around what the U.S. can do now to help drive growth domestically in
current technology lithium-ion cell manufacturing. Recommendations and discussion points include:
1. The U.S. should focus on an integrated manufacturing strategy for lithium-ion cells. Whether
China has done this intentionally or not, it appears they have learned from prior efforts
(photovoltaic). Instead of waiting for the demand to appear, they are creating it themselves. The
U.S. should support and drive the conversion to electric vehicles for many reasons outside of the
scope of this report. What would make these efforts even more effective is to integrate them
throughout the entire supply chain. And where the U.S. has an advantage over China is in the
R&D sector. With a strong research culture in American universities, key DOE agencies
supporting and driving it, and historical success on development, the U.S. could go one step
farther. From research to demand, the U.S. could integrate the entire supply chain from start to
finish by properly supporting each group along the way. This may require more effort and
spending focused on one type of technology, once proven, rather than spreading the funding
around, which could result in a more effective use of resources.
2. The U.S. should become more strategic and involved in key material supply. Subsidies or
support should be provided to companies that will mine, refine, or process key materials along
the supply chain. This will also create a more responsible and environmentally responsible
supply chain with rigid U.S. environmental regulations. This will position cell manufacturers with
a stronger local supply chain and will naturally encourage clusters.
The second area of focus is on how the U.S. can prepare for the next generation of technologies in
energy storage. This recommendation is straightforward but based on history. Without a robust and
existing supply chain in place for current technologies, future technologies will not thrive. They will
follow the previous path unless there is a drastic shift in demand for EVs in the U.S. due to a cost
advantage from the new options. In order to be more prepared for the future of energy storage, the
current supply chain must be fixed. If the U.S. fails to drive EV demand domestically it will not only miss
out on the current historical shift and growth but will be left behind for many years to come.

Literary Citations
Anna Hirtenstein, “Move Over Tesla, Europe's Building Its Own Battery Gigafactories”, Bloomberg, May 2017
ARPA-E Website, www.arpa-e.energy.gov, 2018
Battery University, http://batteryuniversity.com
BNEF, “Electric Vehicle Outlook 2017”, Bloomberg, July 2017
Christophe Pillot, “The Rechargeable Battery Market and Main Trends”, Avicenne Energy, October 2017
David Anderson, “Lowering costs of lithium-ion batteries for EV powertrains”, FMA, 2010
David Farris, “Is Energy Storage the Next Job Creator?”, E&E News Reporter, March 27, 2017
David Trainer, “Bailing Out SolarCity Costs Tesla Investors $7.4 Billion”, https://www.forbes.com/sites/greatspeculations/2016/07/12/bailing-out-solarcity-costs-tesla-investors-7-4-billion/#3b94c0d16878, Forbes, 2016
Debra Sandor, Donald Chung, David Keyser, Margaret Mann, Jill Engel-Cox, “Benchmarks of Global Clean Energy Manufacturing”, Clean Energy Manufacturing Analysis Center, http://www.nrel.gov/docs/fy17osti/65619.pdf, January 2017
Donald Chung, Emma Elgqvist, Shriram Santhanagopalan, “Automotive Lithium-ion Battery (LIB) Supply Chain and U.S. Competitiveness Considerations”, Clean Energy Manufacturing Analysis Center, June 2015
Donald Chung, Emma Elgqvist, Shriram Santhanagopalan , “Automotive Lithium-ion Cell Manufacturing: Regional Cost Structures and Supply Chain Considerations”, Clean Energy Manufacturing Analysis Center, April 2017
Dustin Walsh, “Battery maker A123 Systems reducing manufacturing, adding engineering”, Crains, April 2017
Elsa Ollivetti, Gerbrand Ceder, Gabrielle Gaustad, Xinkai Fu, “Lithium-Ion Battery Supply Chain Considerations: Analysis of Potential Bottlenecks in Critical Metals”, Elsevier Inc., October 2017
GTM, “U.S. Energy Storage Monitor: Q4 2016 Full Report”, GTMResearch, December 2016
Hsiao I-Chung, Nannan Kou, “China Withdrawls Support for Foreign Investment in Battery Cells and Cathodes”, Bloomberg, August 2017
Iain Wilson, “Electric Vehicles Set to Dominate Demand for Batteries: BNEF”, Bloomberg, 2018
Jack Perkowski, “EV Batteries: A $240 Billion Industry In The Making That China Wants To Take Charge Of”, August 2017
James Ayre, “LG Chem To Expand Battery Cell Manufacturing in the U.S. & China”, Clean Technica, February 21, 2017

Jason Deign, “10 Battery Gigafactories Are Now in the Works. And Elon Musk May Add 4 More”, GTM, June 2017
Jeff Desjardins, “China Leading the Charge for Lithium-Ion Megafactories”, Visual Capitalist, February 2017
Johnson Controls Business Report Inc., MarkLines Automotive Industry Portal, 2010
Julia Attwood, “Bottom Up Cost Analysis for Lithium-Ion Batteries, Bloomberg”, February 2017
Oliver Sachgau, “One in Six New Cars In the World Will Be Electric By 2025”, https://www.bloomberg.com/news/articles/2017-11-28/rise-of-electric-cars-quickens-pace-to-tesla-s-benefit, Bloomberg, 2017
Sam Jaffe, “Vulnerable Links in the Lithium-Ion Battery Supply Chain”, Elsevier Inc., October 2017
Sophia Yan, “Made in China isn't So Cheap Anymore, and That Could Spell Headache For Beijing”, CNBC, 2017
Statista
The Conference Board Website, www. conference-board.org, 2018
U.S. Geological Survey, “U.S.GS - Mineral Commodity Summaries”, 2018
XALT Website, https://www.linkedin.com/company/xalt-energy, 2018
ARPA-E References / Sources
Made in China 2025: Global Ambitions Built on Local Protections, U.S. Chamber of Commerce, 2017
Electric cars: China’s battle for the battery market, FT, November 2016
In Trump’s China, Industrial Subsidies Loom Large, WSJ, November 2016
Senate Testimony Examining CFIUS, James Lewis, September 2017
Venture Capital and Cleantech: The Wrong Model for Clean Energy Innovation, MITEI, July 2016
Can Venture Capital Fuel Cleantech?, Clean Energy Finance Forum, November 2016