us labour market monitor - danske bank · (us labour market monitor: slower job growth not an...
TRANSCRIPT

Important disclosures and certifications are contained from page 8 of this report. www.danskeresearch.com
Investment Research — General Market Conditions
Job report preview
Our models suggest job growth in October of 170,000 – below the mid-year pace
but still enough to put additional downward pressure on the unemployment rate.
We estimate that the manufacturing sector shed 11,000 jobs in September, as the
sector remains under pressure from a strong US dollar and the employment index in
the ISM manufacturing survey dipped to a six-year low in October. We look for
government employment to increase by 10,000 and construction employment to
pick up pace again and add 30,000 jobs.
In terms of the unemployment rate, we estimate the rate stayed unchanged at 5.1%
in October but forecast it will head below 5% by year-end.
The Q3 15 employment cost index showed a rebound in wage growth, which put the
pace of wage gains in line with that of last year. So far, wage growth is not showing
any clear signs of acceleration despite the substantial decline in labour market slack.
The same is true for the employment reports’ measure of wages, the average hourly
earnings index. A pick-up in wage inflation is important as it would help to reassure
the doves of the FOMC that the labour market is indeed running tight.
General condition of the US labour market
The August and September employment reports showed a slowdown in job growth,
with the three-month average pace of job growth at 167,000 in September down from
201,000 in August. As we highlighted in the labour market monitor for September
(US labour market monitor: Slower job growth not an obstacle for the Fed, 28
September 2015), we do not think that a slowdown of this magnitude is an
obstacle for a coming Fed hike. Currently, potential labour force growth, under a
positive assumption about a rebound in the labour participation rate, is around
150,000 per month and even lower if the participation rate fails to increase.
This means that with job growth at an average of 170,000 per month in the
coming six months, the unemployment rate will reach the low end of the Fed’s
projected NAIRU range (4.9%) early next year and continue lower thereafter. This
is on the assumption that the labour force participation rate will show a temporary
rebound next year. If an increase in the labour force participation rate fails to
materialise, the unemployment rate would significantly undershoot the Fed’s
NAIRU range by the spring.
The October FOMC statement was a reminder that a December Fed funds rate hike
should not be dismissed. We continue to expect the first rate hike in January next
year, primarily because of the weakness in the US manufacturing sector, which we
think will keep the Fed in wait-and-see mode at the December FOMC meeting. We
believe that the fast reduction in labour market slack next year will prompt the
Fed to tighten monetary policy faster than currently priced in by markets.
03 November 2015
Danske Bank forecasts (October)
Source: Macrobond Financial, Danske Bank
Markets calculations
Unemployment rate to undershoot FOMC
projections
Source: Macrobond Financial, BLS, Danske Bank
Markets
Wage growth lagging
Source: Macrobond Financial, BLS, BEA, Danske
Bank Markets, NFIB
Senior Analyst Signe Roed-Frederiksen +45 45 12 82 29 [email protected]
US labour market monitor
October job growth to keep December hike in play
DB Consensus Prior
Non-farm Payrolls 170 184 142
-Private 160 168 118
-Manufacturing -11 -5 -9
-Service 141 - 131
-Construction 30 - 8
-Mining and logging - - -12
-Government 10 16 24
Unemployment rate 5.1% 5.0% 5.1%

2 | 03 November 2015 www.danskeresearch.com
US
lab
ou
r ma
rket m
on
itor
US labour market monitor
US labour market in one chart
Strong labour market growth but slack remains – (outward moves indicate stronger labour market)
Note: The diagram shows the level of tightness of different US labour market key figures at different times, compared with the level of the same figures in December
2007 (index=100) and December 2009 (index = 0). Counter cyclical figures (unemployment rate, jobless claims, marginally attached and work part time for economic
reasons) are inverted; thus, the higher index (the further from the middle) the better (tighter) is the state of the labour market
JOLTS data for December is an average of October and November data. Source: BLS (JOLTS), Macrobond Financial
Wage inflation has lagged improvement of unemployment
rate ... ... but relationship more normal in sectors with flexible wages
Source: Macrobond Financial, Danske Bank Markets calculations Source: Macrobond Financial, Danske Bank Markets calculations
Payroll employment
Job openings
Hires
Hiring plans
Job availability
Quits
UnemploymentMarginally attached
Part time for economic reason
Job finding
Initial claims
Unable to fill job openings
Temporary help wanted
December 2007 December 2009 August 2015
Leading indicatorsEmployer behavior
Utilization (slack)Confidence
The index compares the labour market conditions in recent months with the pre-recession peak in employment in December 2007 (Index 100) and the post recession trough in employment in December 2009 (Index 0)
3 | 03 November 2015 www.danskeresearch.com
US
lab
ou
r ma
rket m
on
itor
US labour market monitor
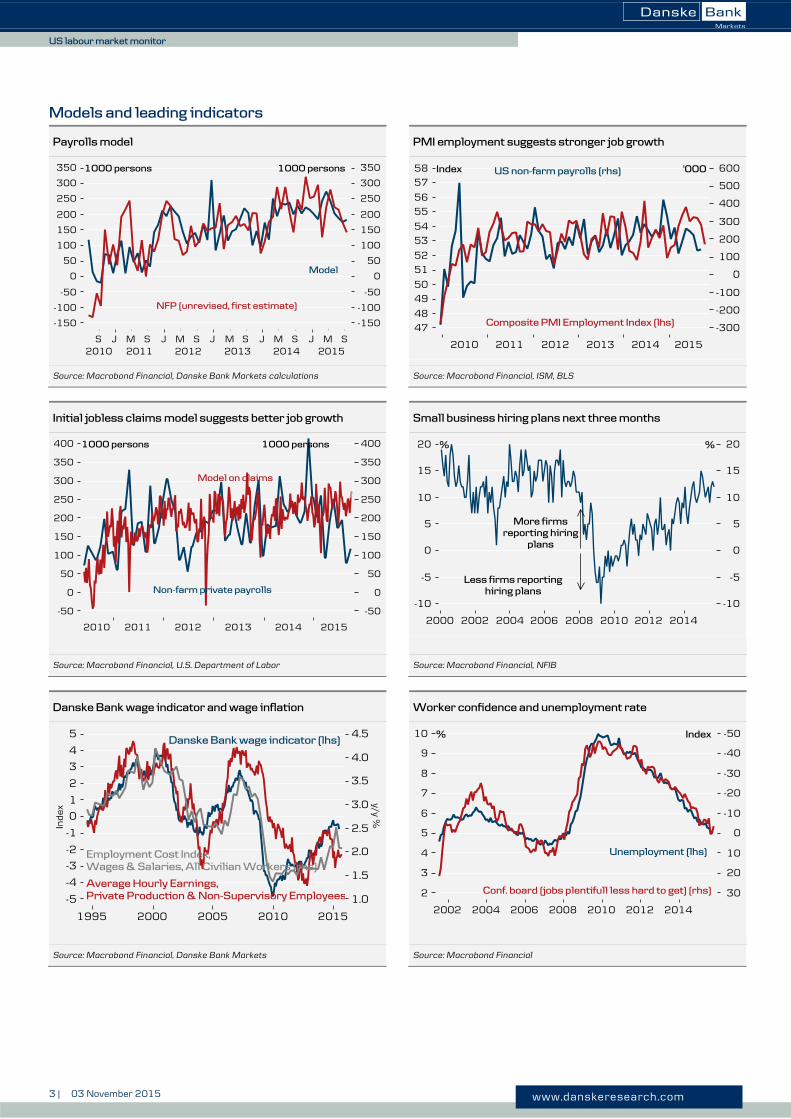
Models and leading indicators
Payrolls model PMI employment suggests stronger job growth
Source: Macrobond Financial, Danske Bank Markets calculations Source: Macrobond Financial, ISM, BLS
Initial jobless claims model suggests better job growth Small business hiring plans next three months
Source: Macrobond Financial, U.S. Department of Labor Source: Macrobond Financial, NFIB
Danske Bank wage indicator and wage inflation Worker confidence and unemployment rate
Source: Macrobond Financial, Danske Bank Markets Source: Macrobond Financial

4 | 03 November 2015 www.danskeresearch.com
US
lab
ou
r ma
rket m
on
itor
US labour market monitor
Unemployment measures
Unemployment rate Unemployment broken down by duration
Source: Macrobond Financial, FOMC, BLS Source: Macrobond Financial, BLS
Long-term unemployment rate Short-term unemployment rate
Source: Macrobond Financial, BLS Source: Macrobond Financial, BLS
Long-term unemployment as % of total unemployed Marginally attached workers
Source: Macrobond Financial, BLS Source: Macrobond Financial, BLS

5 | 03 November 2015 www.danskeresearch.com
US
lab
ou
r ma
rket m
on
itor
US labour market monitor
Participation
Participation rate, all Participation rate, 25-34, men
Source: Macrobond Financial, BLS Source: Macrobond Financial, BLS
Participation rate, 35-44, men Participation rate, 45-54 and 55+, men
Source: Macrobond Financial, BLS Source: Macrobond Financial, BLS
Employment measures
Non-farm payroll ADP private payrolls
Source: Macrobond Financial, BLS Source: Macrobond Financial, ADP
6 | 03 November 2015 www.danskeresearch.com
US
lab
ou
r ma
rket m
on
itor
US labour market monitor
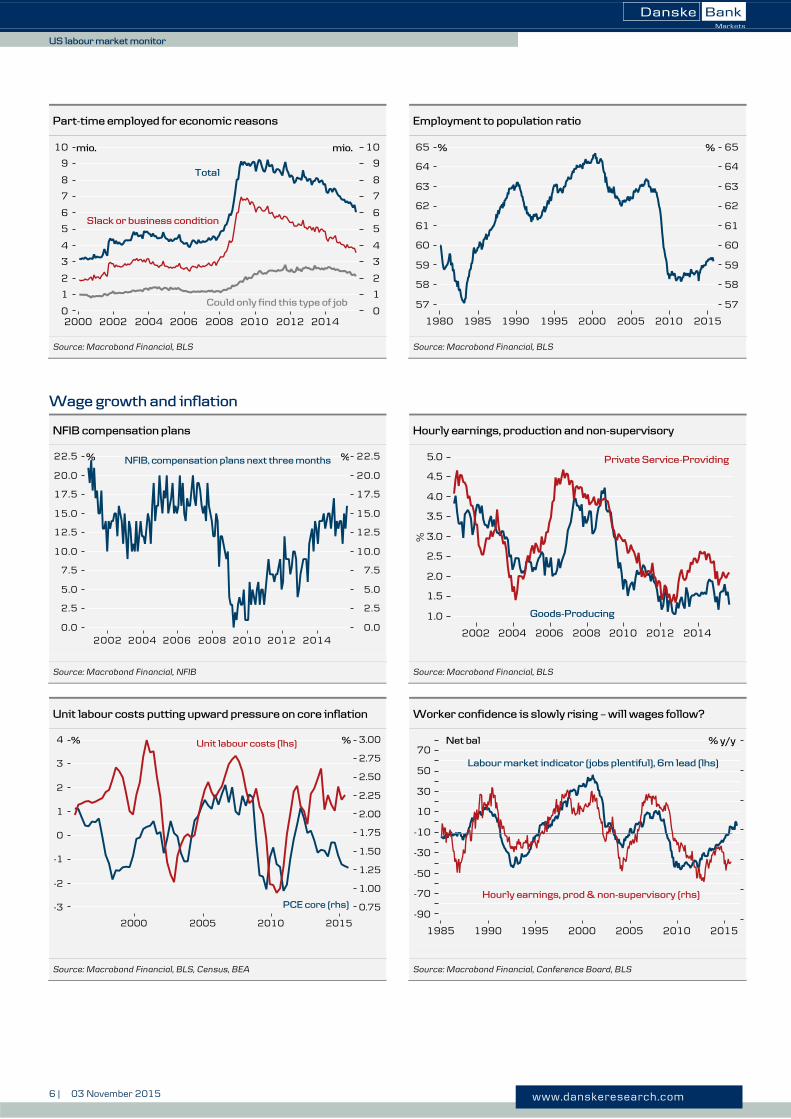
Part-time employed for economic reasons Employment to population ratio
Source: Macrobond Financial, BLS Source: Macrobond Financial, BLS
Wage growth and inflation
NFIB compensation plans Hourly earnings, production and non-supervisory
Source: Macrobond Financial, NFIB Source: Macrobond Financial, BLS
Unit labour costs putting upward pressure on core inflation Worker confidence is slowly rising – will wages follow?
Source: Macrobond Financial, BLS, Census, BEA Source: Macrobond Financial, Conference Board, BLS
7 | 03 November 2015 www.danskeresearch.com
US
lab
ou
r ma
rket m
on
itor
US labour market monitor
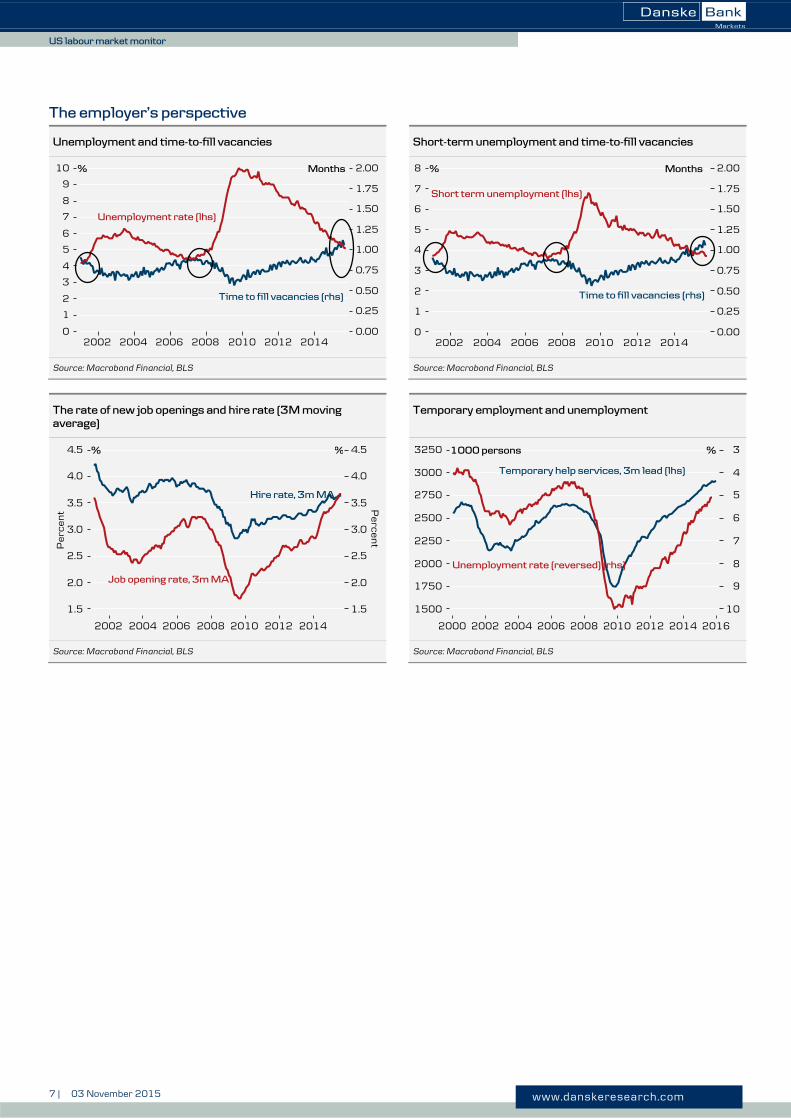
The employer’s perspective
Unemployment and time-to-fill vacancies Short-term unemployment and time-to-fill vacancies
Source: Macrobond Financial, BLS Source: Macrobond Financial, BLS
The rate of new job openings and hire rate (3M moving
average)
Temporary employment and unemployment
Source: Macrobond Financial, BLS Source: Macrobond Financial, BLS

8 | 03 November 2015 www.danskeresearch.com
US
lab
ou
r ma
rket m
on
itor
US labour market monitor
Disclosures
This research report has been prepared by Danske Bank Markets, a division of Danske Bank A/S (‘Danske
Bank’). The author of this research report is Signe Roed-Frederiksen, Senior Analyst
Analyst certification
Each research analyst responsible for the content of this research report certifies that the views expressed in this
research report accurately reflect the research analyst’s personal view about the financial instruments and issuers
covered by the research report. Each responsible research analyst further certifies that no part of the compensation
of the research analyst was, is or will be, directly or indirectly, related to the specific recommendations expressed
in the research report.
Regulation
Danske Bank is authorised and subject to regulation by the Danish Financial Supervisory Authority and is subject
to the rules and regulation of the relevant regulators in all other jurisdictions where it conducts business. Danske
Bank is subject to limited regulation by the Financial Conduct Authority and the Prudential Regulation Authority
(UK). Details on the extent of the regulation by the Financial Conduct Authority and the Prudential Regulation
Authority are available from Danske Bank on request.
The research reports of Danske Bank are prepared in accordance with the Danish Society of Financial Analysts’
rules of ethics and the recommendations of the Danish Securities Dealers Association.
Conflicts of interest
Danske Bank has established procedures to prevent conflicts of interest and to ensure the provision of high-
quality research based on research objectivity and independence. These procedures are documented in Danske
Bank’s research policies. Employees within Danske Bank’s Research Departments have been instructed that any
request that might impair the objectivity and independence of research shall be referred to Research Management
and the Compliance Department. Danske Bank’s Research Departments are organised independently from and do
not report to other business areas within Danske Bank.
Research analysts are remunerated in part based on the overall profitability of Danske Bank, which includes
investment banking revenues, but do not receive bonuses or other remuneration linked to specific corporate
finance or debt capital transactions.
Financial models and/or methodology used in this research report
Calculations and presentations in this research report are based on standard econometric tools and methodology
as well as publicly available statistics for each individual security, issuer and/or country. Documentation can be
obtained from the authors on request.
Risk warning
Major risks connected with recommendations or opinions in this research report, including a sensitivity analysis
of relevant assumptions, are stated throughout the text.
Date of first publication
See the front page of this research report for the date of first publication.
General disclaimer This research has been prepared by Danske Bank Markets (a division of Danske Bank A/S). It is provided for
informational purposes only. It does not constitute or form part of, and shall under no circumstances be
considered as, an offer to sell or a solicitation of an offer to purchase or sell any relevant financial instruments
(i.e. financial instruments mentioned herein or other financial instruments of any issuer mentioned herein and/or
options, warrants, rights or other interests with respect to any such financial instruments) (‘Relevant Financial
Instruments’).
The research report has been prepared independently and solely on the basis of publicly available information that
Danske Bank considers to be reliable. While reasonable care has been taken to ensure that its contents are not
untrue or misleading, no representation is made as to its accuracy or completeness and Danske Bank, its affiliates
and subsidiaries accept no liability whatsoever for any direct or consequential loss, including without limitation
any loss of profits, arising from reliance on this research report.
The opinions expressed herein are the opinions of the research analysts responsible for the research report and
reflect their judgement as of the date hereof. These opinions are subject to change, and Danske Bank does not
undertake to notify any recipient of this research report of any such change nor of any other changes related to the
information provided in this research report.

9 | 03 November 2015 www.danskeresearch.com
US
lab
ou
r ma
rket m
on
itor
US labour market monitor
This research report is not intended for retail customers in the United Kingdom or the United States.
This research report is protected by copyright and is intended solely for the designated addressee. It may not be
reproduced or distributed, in whole or in part, by any recipient for any purpose without Danske Bank’s prior
written consent.
Disclaimer related to distribution in the United States This research report is distributed in the United States by Danske Markets Inc., a U.S. registered broker-dealer
and subsidiary of Danske Bank, pursuant to SEC Rule 15a-6 and related interpretations issued by the U.S.
Securities and Exchange Commission. The research report is intended for distribution in the United States solely
to ‘U.S. institutional investors’ as defined in SEC Rule 15a-6. Danske Markets Inc. accepts responsibility for this
research report in connection with distribution in the United States solely to ‘U.S. institutional investors’.
Danske Bank is not subject to U.S. rules with regard to the preparation of research reports and the independence
of research analysts. In addition, the research analysts of Danske Bank who have prepared this research report are
not registered or qualified as research analysts with the NYSE or FINRA but satisfy the applicable requirements
of a non-U.S. jurisdiction.
Any U.S. investor recipient of this research report who wishes to purchase or sell any Relevant Financial
Instrument may do so only by contacting Danske Markets Inc. directly and should be aware that investing in non-
U.S. financial instruments may entail certain risks. Financial instruments of non-U.S. issuers may not be
registered with the U.S. Securities and Exchange Commission and may not be subject to the reporting and
auditing standards of the U.S. Securities and Exchange Commission.