us-japan collaborative study on seismic damage of
TRANSCRIPT

US-Japan Collaborative Study on Seismic Damage of Buildings and their Mechanism
Japanese PI: Hitoshi Shiohara, The University of Tokyo Counterpart PI: John W. Wallace, UCLA
Objective: To collect and recording of the the data on structural damage of engineered buildings as well as to investigate the factor which caused each structural damage, carried out as a joint effort of Japan (AIJ) and US (EERI).
Major Outcomes 1) Joint reconnaissance efforts of building damage by
Japanese and US researchers 2) Jointly participated and presented at International
Symposium of JAEE in March 2012, Tokyo 3) Presentation at special session of 11WCEE 4) Contribution to the publication of reconnaissance
report from AIJ in 2013

Preliminary Reconnaissance Report of the 2011 Tohoku-Chiho Taiheiyo-Oki Earthquake
Edited by the Architectural Institute of Japan
Geotechnical, Geological and Earthquake Engineering series
7 The only official reconnaissance report of the Architectural Institute of Japan
7 Full of concrete information on building damages in the Tohoku and Kanto regions
7 Mainly consists of field information in the damaged areas without detailed analysis
DUESEPTEMBER
2012
springer.comPREFACE Devastating damage in the Tohoku region of Japan occurred during and after the earthquake off the Pacific coast of Tohoku earthquake on March 11, 2011. The report summarizes damage associated with ground failures including landslide and liquefaction as well as non-structural damages such as to equipment and facilities, partitioning walls and ceilings, and functional failures in skyscrapers. Also brief description of the Japanese Seismic Design Code will be provided in the Appendix. A proposed scheme of anti-tsunami design for buildings is also included.
Publication: Reconnaissance Report (by AIJ)


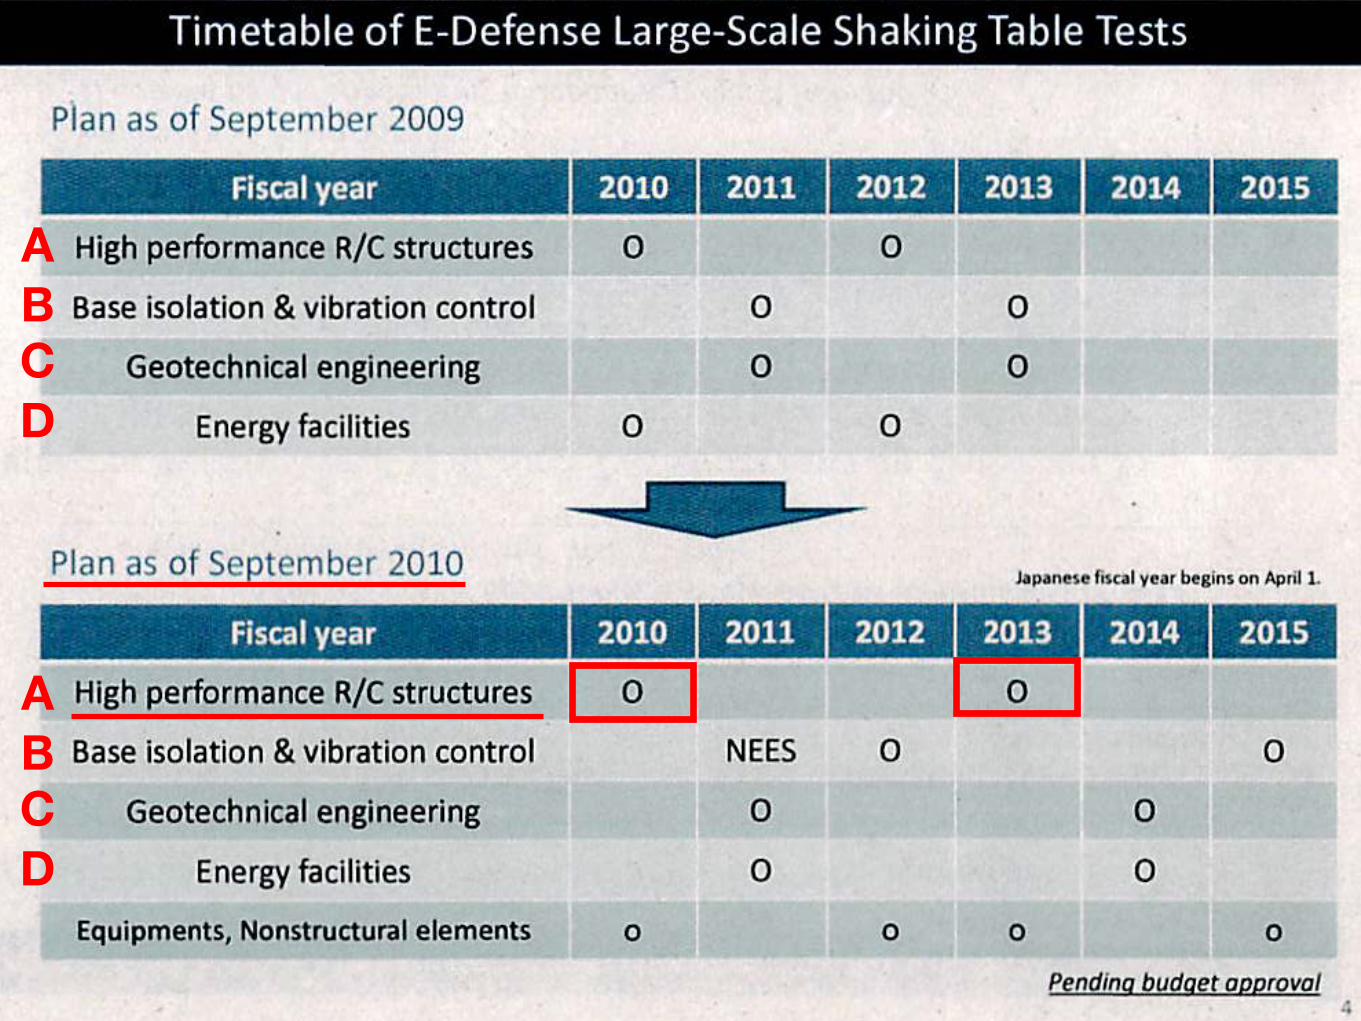
Second Phase: 2010~
A
B
C
D

A
B
C
D
BA
CD
BA
CD

Beam-column joint:Full Scale Shaking Table Test at E-Defense in 2010

E-Defense test on RC Building in December 2010
93
22
15 m
20 m
X
Y
F igure 2.1 E-Defense shaking table
F igure 2.2 Overview of test setup on the shaking table
E-Defense 3D Shaking Table
Four Storied Wall-FrameRC Structure

76
Table A .1 L ist of steel reinforcement
H bar Hoop35d
400
250
400
List of Wall
10-D22 10-D22500 x 500 500 x 500
3,4-D10@100 3,4-D10@1002,2-D10@140 2,2-D10@140
B x DRebarHoopJoint
RFl.4Fl.
TopBottom
Stirrup
Section
B x D
Web
Location
3Fl.Top
Bottom
Stirrup
Section
B x D
Web
2Fl.Top
Bottom
Stirrup
Section
B x D
Web
BottomSection
8-D22500 x 500
2,3-D10@1002,2-D10@140
B x D
HoopRebar
Joint
TopSection
8-D22 10-D22500 x 500500 x 500
2,3-D10@100 2,4-D10@1002,2-D10@140 2,2-D10@140
2Fl.
Hoop
B x DRebar
Joint
Section
8-D22500 x 500
2,2-D10@100 2,2-D10@10010-D22
500 x 500
2,2-D10@140 2,2-D10@140
4Fl.3Fl.
Hoop
B x DRebar
Joint
Section
C2C1
AC
2,3-D10@802,3-D10@100
2 x 6-D19
2 x 6-D19
2,2-D10@100 AC
D13@300 (W)D10@125 (W)D10@200 (W)
AC
D13@300 (W)D10@125 (W)D10@200 (W)
Vertical2,500 x 250
Wall
2,500 x 250
2,2-D10@150
Vertical
2,2-D10@150
2Fl.3Fl.4Fl.
Section
Hoop
B x DRebar
Hoop
Section
B x DRebar
Joint
Joint
S1
CS1
CS2
CS3
Top
Top
Top
Top
Bottom
Bottom
Bottom
Bottom D10@200
D10@250D10@250D10@250D10@250
D10,D13@200
D10@250D10@250
Longer directionD10@200
D10@200
D10@200
D10@200D10@200
D10@200D10,D13@200
D10,D13@200
Shorter direction
G1
4-D22 3-D22 4-D223-D22 3-D22 3-D22
4-D10
300 x 600
2-D10@200
CenterEnd End
5-D22 3-D22 5-D223-D22 3-D22 3-D22
4-D10
300 x 600
2-D10@200
6-D22 3-D22 6-D223-D22 3-D22 3-D22
4-D10
300 x 600
2-D10@200
RFl.Top
Bottom
Stirrup
Section
B x D
Web
Location
4Fl.3Fl.2Fl. Top
Bottom
Stirrup
Section
B x D
Web
All
Location
Top
Section
B x D
Bottom
StirrupWeb
G2Center
3-D19 3-D192-D19 3-D19
300 x 300
End
-
3-D19 4-D193-D19 3-D19
300 x 300
-
B1
3-D194-D19 7-D19
3-D19
CenterEnd
2-D102-D10@200
300 x 400
4Fl.3Fl.2Fl.
Section
TopBottom
Stirrup
B x D
Web
Location
TopBottom
Stirrup
Section
B x D
Web
G3Center
3-D195-D193-D19 4-D19
2-D10
300 x 400
2-D10@200
End
4-D19 3-D193-D19 4-D19
2-D10
300 x 400
2-D10@200
List of Column
List of Girder List of GirderList of Girder
List of Slab
List of beam
Depth: 130mm
2-D10@100(KSS785)
2-D10@100(KSS785)
Horizontal
Horizontal
1Fl.
1Fl.
1Fl.

Joint shear / Nominal joint shear capacity
Margin of joint shear capacity

Column-to-beam strength ratios
Column-to-beam strength ratio

JMA Kobe 50%

JMA Kobe 50%

JMA Kobe 100%
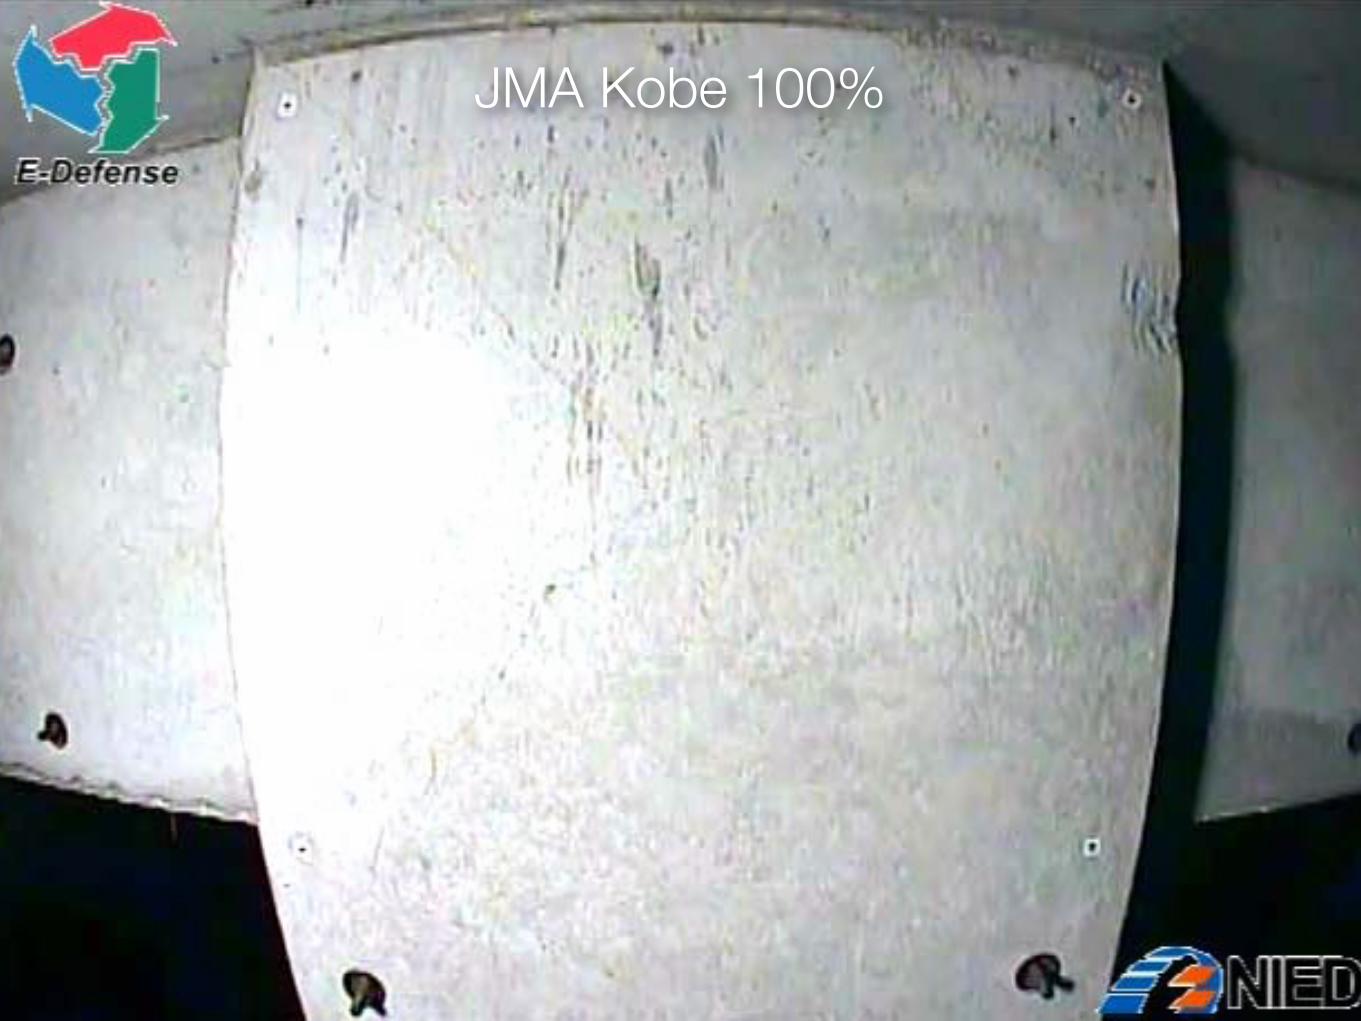
JMA Kobe 100%

3D Full Scale RC Frame Structure Shaking Table Test at E-Defense in 2010
• Four-story full scale RC frame structures were tested,- The building structure was designed and constructed such that it conforms to
current seismic provisions in Japan and the US.
• Shear failure of lightly reinforced beam-column joints were confirmed,- BC joints with column-to-beam strength ratio between 1.0 showed joint shear
failure.
- Vulnerabilities of frame structure with lightly BC joint has been demonstrated.
17

SEISMIC DAMAGE OF A NINE-STORY RC RESIDENTIAL BUILDING IN SENDAI DESIGNED BY OLD SEISMIC CODES

Nagamachi - Dwelling Complex

1968
1971
1978
1981
1995
2000 20
11
1968 Tokachi-oki EarthquakeAmendment of BSL Enforcement Order
1978 Miyagiken-oki Earthquake Amendment of BSL Enforcement Order
Brief History of RC buildings and Seismic Codes in Japan
1995 Hyogo-ken Nambu Earthquake
Act on Promotion of Seismic Retrofitting of Existing Buildings
Amendment of BSL Enforcement Order
2011 Tohoku-chiho Taiheiyo-oki Earthqukae
I ~ 1971
II~ 1981
III1981 ~
*BSL : Building Standard Law
( Prevention of column shear failure )
( The “shin-taishin”, new standard )
( Effectiveness of the 1981 revision was confirmed )
( Performance based criteria introduced )
( To urge building owners to retrofit existing vulnerable buildings )

Nagamachi - Dwelling Complex
• RC/SRC 9 floors.
• Completed in 1969
• No seismic retrofit
• Survived major earthquakes in 1978, 2003 and 2005.
• Fc 210 & 180
• Grade SD35 rebars

Taihaku ward, Sendai City
Izumi ward
Miyaginoward
Wakabayashiward
Taihaku ward
Aoba ward
JR Sendai Station
Port of Sendai
Pacific Ocean
Site of the building
City of Sendai
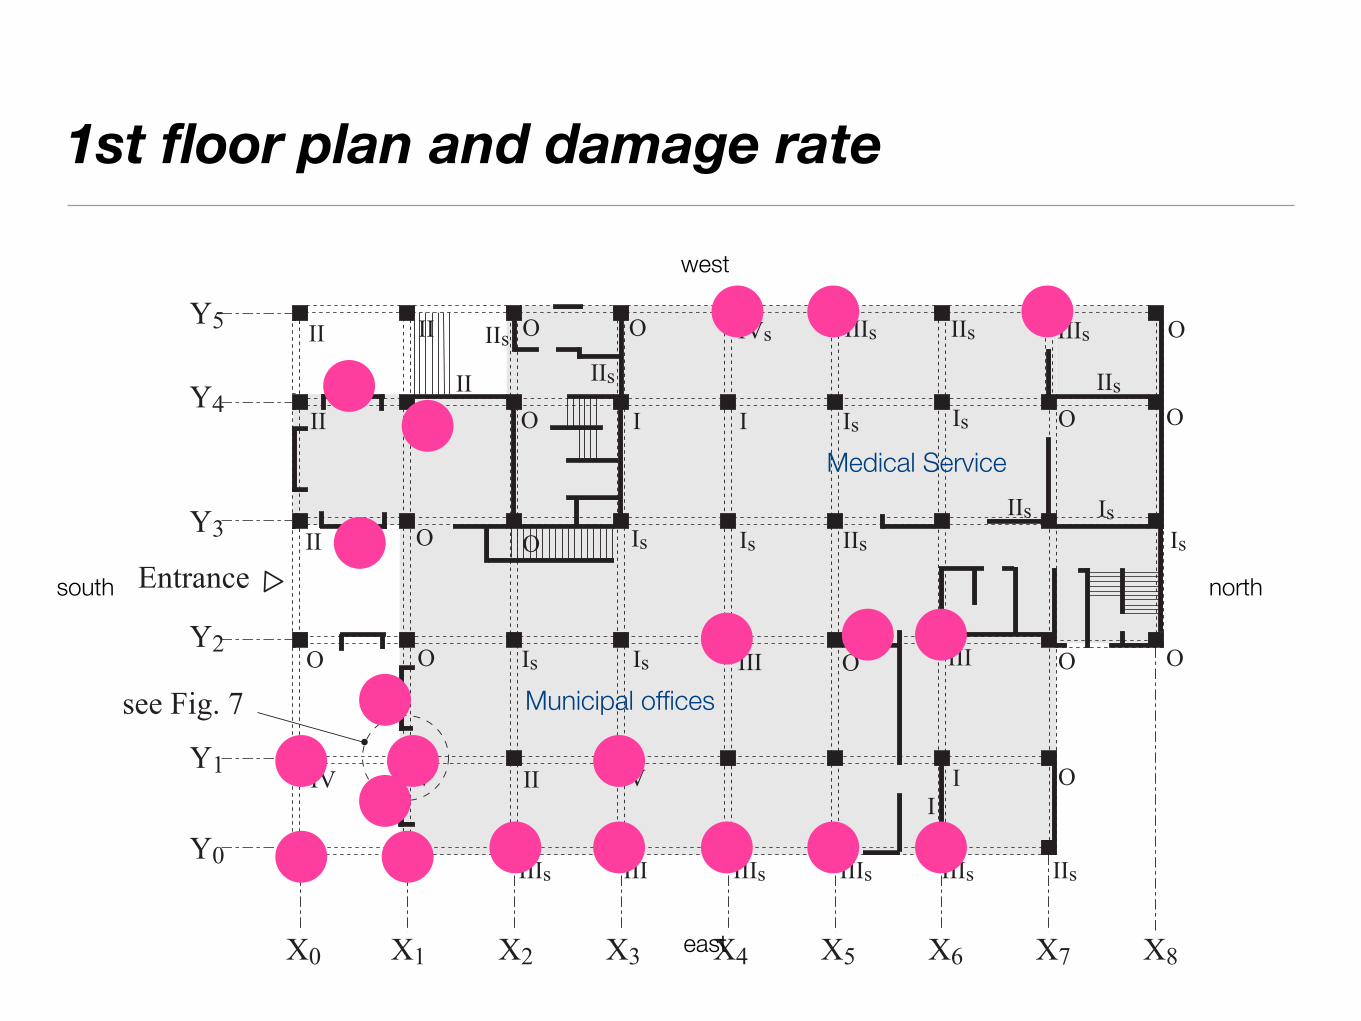
1st floor plan and damage rate
X1 X2 X3 X4 X5 X6 X7 X8X0
Y1
Y2
Y3
Y4
Y0
Y5
V
V VIV
IV
IVs
III
III
IVs
V
Vs
IIIs
III
IIIs IIIs
III
III IIIs IIIs IIIs
III
IIs
II
IIs
IIs IIs
IIs
II
II
II II
IIs
IIs
II
Is Is
IsIs
I I Is
IsIs
Is
II
O O O
O
OO
O
O
O
O O
OO
O
see Fig. 7
Entrance
west
east
south north
Municipal offices
Medical Service

2nd floor plan and damage rate
Y1
Y2
Y3
Y4
Y0
Y5
X1 X2 X3 X4 X5 X6 X7 X8X0
III
III IIIs III
II
II
IIIIs IIs
IIs
I
I IIs
Is
Vs
I
I
Is I
IIs
I
I
Is
II
I Is Is Is Is
IsIs
Is I I
II
IO O O O
O
O
O O O
OOO
OO
OO
O
OO
O
OO
west
east
south northMunicipal offices

3rd floor plan and damage rate
Y1
Y2
Y3
Y4
Y0
Y5
X1 X2 X3 X4 X5 X6 X7 X8X0
III
III IIIs III
II
II
IIIIs IIs
IIs
I
I IIs
Is
Vs
I
I
Is I
IIs
I
I
Is
II
I Is Is Is Is
IsIs
Is I I
II
IO O O O
O
O
O O O
OOO
OO
OO
O
OO
O
OO
Y1
X1 X2 X3 X4 X5 X6 X7 X8
Y2
Y3
Y4
Is Is
IIs IIs
IIIs
IVs
IVsIVs
IVs
Is Is Is Is Is
west
east
south north
Apartment units
Corridor
RC non-structural partition

Damage Grading Criteria of RC Members
Damage gradeDamage grade Criteria
0 No damage No damage
I Slight Structural concrete cracking of width less than 0.2mm
II Minor Structural concrete cracking of width larger than 0.2mm and less than 1.0mm.
III Moderate Structural concrete cracking of width larger than 1.0mm and less than 2.0mm.
IV MajorStructural concrete cracking of width larger than 2.0mm, with cover concrete spalling and visible reinforcement
V Severe Cover concrete spalling off, with some concrete crushes and longitudinal reinforcement buckling

Residual Lateral Capacity of RC Structural Member
L
oad
Car
ryin
g C
apac
ity
Loa
d C
arry
ing
Cap
acity
Remained
Remained
Deteriorated
Damage Class
Lateral Load
! " # $ % Vertical Load
Deflection
Remained Lost
Remained Lost
(a) Ductile member
Lateral Load
! " # $ % Vertical Load
Damage class
(b) Brittle member
Yielding of
tensile rebars
Cracking Buckling of rebars and
falling of covering concrete
Compression failure
of concrete starts
Cracking
Falling of covering concrete
Expansion of shear cracks
Buckling and/or
fracture of
Deflection
Deteriorated
Deteriorated
Lost
Lost
Figure 1: Idealized lateral force-displacement relationships and damage class
In the Seismic Evaluation Standard, most fundamental component for Is-index is E0-index, which is basic structural seismic capacity index calculated from the product of strength index (C), and ductility index (F). Accordingly, deterioration of seismic capacity was estimated by energy dissipation capacity in lateral force- displacement curve of each member, as shown in Figure 2. Seismic capacity reduction factor η is defined by Eq.(2).
t
r
E
E=η (2)
where, dE : dissipated energy, rE : residual absorbable energy,
tE : entire absorbable energy ( rdt EEE += ).
Loa
d
! " # $ Damage class
Dissipated energy Ed
Residual Deflection Ultimate Deflection
%
Absorbable Energy Er
Reduction factor
rd
r
EEE+
=η Max. Deflection
Figure 2: Seismic capacity reduction factor η

Elevation of Y4 frame in longitudinal direction
X8 X7 X6 X5 X4 X3 X0X2 X1
1FL
GL
2FL
3FL
4FL
5FL
6FL
7FL
8FL
9FL
RFL
PHRFL 36,150
4,100
7,400
10,150
12,850
15,550
18,150
20,750
23,350
26,150
500
5 400 8 = 43 200
IVs
IVs
IVs
IVs
IVsIVs
shear crack on beam-column joint
IsO
O O O O
O OIIs Is
Is
I
II
I IIs II IIIII
Is II
Unit in mm
see Fig. 10
Shear failure of columns
Latice steel

Failure of Beam-column Joints

Failure of Beam-column Joints

Elevation of X1 frame in longitudinal direction
steel shape in concrete
O
IIIs
Y0 Y1 Y2 Y3 Y4 Y5
4 500 4 5006 0006 0006 000
O
III II
OI Is
Is
Is
IIs
III
III
III
OIII IVV V
unit in mm
see Fig. 7
shear cracks on coupling beams

Elevation of X1 frame in longitudinal direction
steel shape in concrete
O
IIIs
Y0 Y1 Y2 Y3 Y4 Y5
4 500 4 5006 0006 0006 000
O
III II
OI Is
Is
Is
IIs
III
III
III
OIII IVV V
unit in mm
see Fig. 7
flexural failure and buckling of rebars at the bottom of column

Values of Seismic Index Is
Story Longitudinaldirection
Transversedirection
9 0.37 1.498 0.27 1.047 0.23 0.826 0.20 0.705 0.21 0.624 0.19 0.513 0.20 0.712 0.44 0.441 0.62 0.39
Seismic Evaluation Standards by JBDPA
no good correlation
good correlation

Beam-column Joints in Y4 frame
(a) Beam-column joint at 7F (X5-Y4)
10-D19hoop φ9@250
750
450
450
220
220
1150
horizontal sectionof column
vertical sectionof beam
4-D19
3-D19
(b) Beam-column joint at 5F (X5-Y4)
4-D22+6-D19hoop φ9@250
750
600
600
220
220
1250
unit in mm
horizontal sectionof column
vertical section of beam
4-D22
4-D22

Shear failurein kN
Shear failurein kN
Shear failurein kN
Flexural hingein kN
Flexural hingein kN
Flexural hingein kN
Column-to-beam strength ratio
Column-to-beam strength ratio
Joint shear
strength margin*
column beam joint columncase 1*
columncase 2* beam case 1 case 2
Joint shear
strength margin*
9FL 544.4 858.7 863.4 522.5 396.7 231.7 2.25 1.71 3.73
8FL 555.0 929.1 984.0 650.8 454.0 320.2 2.03 1.42 3.07
7FL 589.2 1043.2 1112.3 751.5 496.7 335.0 2.24 1.48 3.32
6FL 799.7 1148.5 1150.1 906.6 574.8 432.2 2.10 1.33 2.66
5FL 907.8 1162.5 1624.0 1082.9 664.0 528.3 2.05 1.26 3.07
Tributary area of gravity load
Column
Wall
floor plan
Calculated story shear

Concluding Remarks
• Nagamachi Dwelling Complex Building
• Flexural failure of the first story SRC column
• deficiency of steel lattice not embedded into the foundation which just ends at the first floor level.
• abrupt change of section caused the damage.
• Shear failure of lightly reinforced beam-column joints.
• calculated margin of joint shear strength is 2.0 or more.
• column-to-beam strength ratio is in the range of 1.26 to 1.48.
• vulnerablity of column-to-beam strength ratio between 1.0 and 1.5 are to joint shear failure.
• problem in failure mode prediction

New beam-column joint macro element and nonlinear dynamic analysis on 4 story frame RC structure
37

• Members; beams or columns framing into the joints- Full flexural capacity of the members to be achieved
Life Safety Requirements to Beam-Column Joint
Not easy to meet in practice
Δ
P
V
Collapse mechanism by Joint hinging
Subsequent repetition due toCyclic loading
The 14th
World Conference on Earthquake Engineering
October 12-17, 2008, Beijing, China
Figure 14 Total collapse of school building. Figure 15 Severe diagonal shear cracks on the
gravity wall between window openings.
Figure 16 Severe damage of school building. Figure 17 Pancake type of failure due to weak
columns.
Figure 18 Collapse of school buildings. Figure 19 Building collapse due to joint failure.
Figure 20 Column failure due to insufficient
transverse reinforcement. Figure 21 Soft story collapse.
Collapsed Structure : Wencheuan Earthquake (2008)
PSkeleton
curveP-delta Effect
Slip
• Control Joint hinging in seismic Design- Performance to prevent collapse and instability of lateral resisting frame due to
subsequent repetitions of earthquake loading needs to be evaluated.
ᅗ 1 ᰕᱱ᥋ྜ㒊ࡢᦆയᯫᵓࡢኚᙧJoint hinging
38• No suitable model has been developed before.

New Macro Element for Interior BC Joint
39
rigid panel
rigid panel
steel elementbond link
bond link
steelelement
concrete springconcrete element
concrete element
steel element
steel element axial stiffness is factored consideringpull-out of bars from member end
diagonal concrete
horizontal reinforcing bars vertical reinforcing bars
vertical & horizontal concrete
A A' {bA'}={bA}
macro element ofbeam-column joint
force-based beam-column element
node
superimpose
Frame StructureP-Delta effect is incorporated
to stiffness matrix

Uniaxial Constitutive Models for Elements
-Kfc
-KfcZm
-0.2Kfc
ft
-ft
0.25ft ¡¡t2¡t1
-K¡c-¡u
m
concrete
Tension
Compression
Modified Kent & Park
¡
m
my
1.5my
¡y
-my
-¡y Es Es
Es/4
steel
Tension
Compression
Modified Bi-linear
ss1 s2s3 s4 s5
o
o1
o2o3
bond-slip
Modified Eligehausen
40

Validation of the Macro Element by the Tests
-100
-50
0
50
100
-4 -2 0 2 4 -4 -2 0 2 4
Db/Dc=1ʫMcu/ʫMbu=1.0V ju/Vu=1.03
B02
-100
-50
0
50
100
-4 -2 0 2 4 -4 -2 0 2 4
Db/Dc=1ʫMcu/ʫMbu=1.35V ju/Vu=1.03
B05
Db/Dc=0.5ʫMcu/ʫMbu=1.03V ju/Vu=1.06
D05
Db/Dc=1ʫMcu/ʫMbu=2.06V ju/Vu=1.63
H01
stor
y sh
ear i
n kN
story drift in kN
TestAnalysis
• The new model is suitable to simulates strength and hysteresis behavior of sub structure with BC joints
41

Input Ground Acceleration Record
0 1 2 3 4 50
500
1000
1500
2000
2500
3000
S a (cm
/sec
2 )
JMA Kobe 1995JR Takatori 1995SCT1 1985
T1 =0.46 secT2 =0.15 sec
Period in second
Spectra of Max. Response Acc. Damping = 5%
(Y[PÄJPHS��9LX\PYLK�I`�*VKL�
•Four input ground motions are selected for dynamic analysis42

Four Story Building Collapse Simulationwith non-linear BC Joint model with elastic BC Joint model
43

Unstable Limit ; beyond Ultimate Limit
Mcu/Mbu=1.0
Mcu/Mbu=1.5
Mcu/Mbu=1.5
Mcu/Mbu=1.0
0 0.05 0.10
0.1
0.2
0.3
0.4
0 0.05 0.10 0.05 0.10
0.5
1.0
1.5
2.0
2.5
3.0
Sa(T
1=0.
46s,5
%),
g
EQ 1.0
0 0.05 0.10
1.0
2.0
3.0
4.0
5.0
6.0
Sa(T
1=0.
46s,5
%),
g
0 0.05 0.10
0.1
0.2
0.3
0.4
0.5
0.6
0.7
Sa(T
1=0.
46s,5
%),
g
0
0.5
1.0
1.5
2.0
2.5
Sa(T
1=0.
46s,5
%),
g
EQ 1.0EQ 1.0
EQ 1.0
JMA Kobe JR Takatori SCT1
story drift in rad
(Y[PÄJPHS
UVU�SPULHY�QVPU[
UVU�SPULHY�QVPU[LSHZ[PJ�QVPU[
LSHZ[PJ�QVPU[
\UZ[HISL�SPTP[
H[[HPULK�TH_PT\T�Z[VY`�KYPM[�PU�YHK
:[H[PJ�W\ZOV]LY�HUHS`ZPZ
+`UHTPJ�W\ZOV]LY�HUHS`ZPZ��0+(�
IHZL�ZO
LHY�J
VLMÄJPL
U[
44
= collapse limit

Column-to-beam Strength Ratio and Unstable Limit
0 0.05 0.1 0.150
0.5
1.0
1.5
2.0
2.5
3.0
Sa(T
1=0.
46s,5
%),
g
EQ 1.0
0 0.05 0.1 0.15
Mcu/Mbu=1.0Mcu/Mbu=1.1Mcu/Mbu=1.2Mcu/Mbu=1.3Mcu/Mbu=1.4Mcu/Mbu=1.5
Mcu/Mbu=1.0Mcu/Mbu=1.1Mcu/Mbu=1.2Mcu/Mbu=1.3Mcu/Mbu=1.4Mcu/Mbu=1.5
Mcu/Mbu=1.0Mcu/Mbu=1.1Mcu/Mbu=1.2Mcu/Mbu=1.3Mcu/Mbu=1.4Mcu/Mbu=1.5
0 0.05 0.1 0.150
1.0
2.0
3.0
4.0
5.0
6.0
Sa(T
1=0.
46s,5
%),
g
0 0.05 0.1 0.15
0 0.05 0.1 0.150
0.1
0.2
0.3
0.4
0.5
0.6
0.7
Sa(T
1=0.
46s,5
%),
g
0 0.05 0.1 0.15
0 0.05 0.1 0.150
0.5
1.0
1.5
2.0
2.5
Sa(T
1=0.
46s,5
%),
g
EQ 1.0
EQ 1.0 EQ 1.0
Mcu/Mbu=1.0Mcu/Mbu=1.1Mcu/Mbu=1.2Mcu/Mbu=1.3Mcu/Mbu=1.4Mcu/Mbu=1.5
(Y[PÄJPHS (Y[PÄJPHSUVU�SPULHY�QVPU[
UVU�SPULHY�QVPU[ UVU�SPULHY�QVPU[
LSHZ[PJ�QVPU[
LSHZ[PJ�QVPU[
LSHZ[PJ�QVPU[19�;HRH[VYP 19�;HRH[VYP
14(�2VIL
([[HPULK�TH_PT\T�Z[VY`�KYPM[�PU�YHK��
14(�2VIL :*;�LSHZ[PJ�QVPU[:*;�
• Frame with beam-column joint of C-to-B ratio of 1.0 become unstable at smaller ground motion amplification factor
• The difference is due to concentration of story drift at particular story 45

New beam-column joint macro model and nonlinear dynamic analysis on RC frames
• Instability of moment resisting frame occurs at extremely large excitation- Inappropriateness of non-linear frame model without consideration of non-linear
beam-column joint is demonstrated,
- Performance of beam-column joint is essential to attain stable seismic response at large displacement response level of ductility factor of 5 or more,
- Joint hinging causes local concentration of story drift at particular story,
- Then the frame becomes vulnerable to collapse due to P-Delta effect.
- Large column-to-beam strength ratio is necessary to to avoid collapse due to instability
- Safety margin for extremely large earthquake is smaller if small column-to-beam strength ratio is used for seismic design
46