u.s. health insurance exchanges — moving forward
TRANSCRIPT
Global Views is available on: www.scotiabank.com, Bloomberg at SCOE and Reuters at SM1C
Global Views
Weekly commentary on economic and financial market developments July 6, 2012
Economics > Corporate Bond Research
Emerging Markets Strategy >
Foreign Exchange Strategy
Economic Statistics > Financial Statistics >
Forecasts >
Portfolio Strategy > Fixed Income Strategy
Fixed Income Research
Contact Us >
Global Forecast Update: Not So Happy Anniversary........................................................................... Aron Gampel
The FX Outlook From A Global Perspective.................................................................. Pablo Bréard & Camilla Sutton
U.S. Health Insurance Exchanges — Moving Forward ...................................................... Mary Webb & Emily Jackson
Vehicle Sales Accelerate In North America ......................................................................................Carlos Gomes
Belize Budget Provides Little Clarity ...................................................................................................Joe Kogan
Beat The Street — Q2/12 Earnings Preview .................................................................................. Hugo Ste-Marie
Strategic Edge Quarterly — 2012 Summer Outlook.......................................................................... Vincent Delisle
2-8 Economics
Key Data Preview................................................................................................................................... A1-A2
Key Indicators......................................................................................................................................... A3-A4
Global Auctions Calendar.............................................................................................................................A5
Events Calendar ...........................................................................................................................................A6
Global Central Bank Watch ..........................................................................................................................A7
Forecasts......................................................................................................................................................A8
Latest Economic Statistics............................................................................................................................A9
Latest Financial Statistics ...........................................................................................................................A10
A1-A10 Forecasts & Data
2-3
4-5
6-7
8
9 Emerging Markets Strategy
10-13 Portfolio Strategy

Global Views
Economics
2 July 6, 2012
GLOBAL FORECAST UPDATE
The global recovery that has followed the worst economic and financial crisis since the Depression is three years old. However, the celebration will be muted. Not only has the recovery been historically moderate, but the pace of economic activity around the world has been steadily losing momentum, highlighted by the renewed slump in the purchasing managers’ reports for June. The primary culprit remains the significant debt strains and balance sheet adjustments affecting many governments, households and financial institutions throughout much of the developed economies, though many of the high-growth emerging nations have also moved to a slower growth trajectory. A subdued expansion had been expected for most of the developed world, since balance sheet recessions force stakeholders to redress their debt problems through spending restraint, increased saving, and the rebuilding of capital. However, the economic underperformance internationally is increasing, notwithstanding the unprecedented low level of borrowing costs, repeated doses of central bank asset purchases, as well as the considerable pent-up demand and excess capacity that had quickly built up during the relatively short but severe recession and subdued recovery. Scotia Economics has modestly lowered its global real GDP estimate again, reflecting the intensifying debt strains in Europe, and the spillover effects internationally that have reduced industrial activity in more countries. Global growth is forecast to expand 3.1% this year and 3.6% in 2013, down fractionally from last month’s assessment and still below consensus. While a number of countries are continuing to outperform in this increasingly uncertain and highly volatile economic and financial market environment — Poland and Turkey in Eastern Europe, Colombia, Peru and Chile in South America, and South Korea, Singapore, Indonesia and Malaysia in Asia-Pacific, for example — the important regional economic locomotives of Germany, the United States, China and Brazil, have all lost some momentum to varying degrees. The sharp increase in financial market volatility and slide in equity valuations in recent months have further dampened consumer confidence already weakened by a slower pace of job and income gains. The deepening recession in the euro zone remains the focal point of the global slowdown. Despite the imposition of significant spending cuts and tax hikes, the budget deficits in many countries, primarily in the more heavily-indebted nations in the south, are continuing to expand. Additional austerity measures are aggravating joblessness and further undermining the economies’ already weakened performances. Unlike the balance sheet adjustments that affected other countries in the post-war era, the single-currency euro zone nations do not have the exchange rate flexibility to effect the much needed and quicker competitive realignment. Structural wage and productivity adjustments take much longer to implement and produce results, leaving these economies increasingly vulnerable to recurring debt-related strains and recessionary conditions. Building upon prior bailout packages, the June 28-29th EU Summit produced an important agreement in principle to backstop and supervise beleaguered euro zone financial institutions. It will also provide reserves to support sovereign bond markets, and beef up infrastructure-related investments to support growth. Financial and currency markets have rebounded positively, as they did temporarily at the turn-of-the-year when the ECB provided the region’s banks with massive low-cost funding to avert a growing squeeze on banking sector liquidity. Sentiment received a further boost after the ECB reduced its main refinancing and deposit rates this week to bolster its accommodative stance. Nevertheless, there is no guarantee that the improving tone in financial markets can be sustained. The implementation period for many of the reforms may take months to finalize, and require broader EU-member
Aron Gampel (416) 866-6259 [email protected]
Not So Happy Anniversary
50
52
54
56
58
60
10 11 12
0
5
10
15Index 6-month
annualized % change
Global New Orders (LHS)
Global Industrial
Production (RHS)
Global Slowdown
Source: JP Morgan, CPB, Scotia Economics.

Global Views
Economics
3 July 6, 2012
GLOBAL FORECAST UPDATE
… continued from previous page
approval notwithstanding Germany’s support. Moreover, the funds earmarked for emergency assistance may not be sufficient to cover the broader liabilities. There is an urgency to resolve these issues, since the debt dynamics in many of the higher-risk countries are inherently unstable — debt burdens continue to rise as growth contracts and borrowing costs move even higher relative to modest inflation. Increasing uncertainty surrounding the viability of the monetary union has witnessed an accelerating shift of deposits to ‘safe-haven’ countries — as evidenced by Swiss and German 10-year bond yields declining to around 0.5% and 1.3% respectively, while long-term rates in Italy, Spain and Portugal have jumped to 6.0%, 6.9% and 9.8% respectively. The distortions triggered by the recurring debt strains on the Continent have already helped to moderate the economic performances in North America and Asia-Pacific, a reflection of the close interdependency of global trade and financial markets. Reduced exports to Europe have contributed to slower domestic activity, and to a softening in commodity prices. This negative feedback loop, in China and other large emerging economies such as India and Brazil, has been reinforced by prior domestic efforts to curb inflation and excesses in housing and consumer markets. While the slowdowns underway have the potential to reduce future growth performances somewhat more, most of these countries have the financial capabilities to promote stronger growth. China, India and Brazil are reversing prior interest rate hikes, with China cutting rates for the second time over the past month. Both China and Brazil have already announced new fiscal initiatives aimed at kick-starting growth. Among the developed economies outside of Japan whose growth is being boosted temporarily by rebuilding efforts, the United States has the potential to remain a relative outperformer. American consumers have made considerable strides in paying down debt and, more recently, have taken advantage of low prices, low interest rates and lower unemployment to unlock their considerable pent-up demand, especially for autos but increasingly for housing as well. A competitive realignment has increased the attractiveness of the United States as a manufacturing venue. But the pace of U.S. activity and job creation has slowed, highlighting the extent to which household and business confidence also has been undermined by the renewed political wrangling surrounding the year-end raising of the debt ceiling limit, and the urgency to amend legislation to prevent significant tax hikes and spending cuts from being implemented. Like Germany and Switzerland, U.S. bond yields have benefitted from the global capital flight to ‘safe-havens’ (the 10-year treasury bond yields around 1.5%), though this downward bias and the strong greenback could be tested later in the year if Congress is unable to reach a political compromise. Canada’s economic prospects are also being challenged by both international and domestic factors. The softening in the demand and prices for key commodities is restraining export earnings and, if sustained, would have a more discernible impact on longer-term investments, though the pipeline for resource-related infrastructure projects remains quite full. Until there is a greater diversification in exports to the developing regions of the world, the country’s growth potential remains constrained by the tepid U.S. performance and recession in Europe. Domestic fortunes are still relatively good, bolstered by continuing job gains. Looking ahead, however, the combination of ongoing federal and provincial fiscal restraint alongside Ottawa’s additional measures to regulate mortgage lending and slow the pace of household indebtedness will gradually constrain residential activity and consumer spending. Despite the latest policy responses by regions and countries to the renewed slowdown, redressing the chronic fiscal problems should keep the global economy in the slow lane of growth. Even so, the risks to the outlook are still on the downside. Borrowing costs should remain historically low, with the U.S. dollar retaining its ‘safe-haven’ status for the time being. Governments will continue to struggle to balance the short-term need to reduce deficits and debt burdens and promote growth, while dealing with the long-term requirements to address long-standing competitive, demographic, pension and environmental issues. Financial institutions must deal with tighter capital and regulatory guidelines. Nations with surplus savings must continue to rebalance toward domestic activity to promote stronger growth internationally. And businesses, whose earning capabilities and balance sheets are generally in much better shape than households and governments, must continue to support activity through strategic investments aimed at boosting productivity and accessing new markets.
Aron Gampel (416) 866-6259 [email protected]

Global Views
Economics
4 July 6, 2012
FOREIGN EXCHANGE
A welcomed partial easing in financial market stress is the core theme driving foreign exchange markets into the summer. This has come on the back of three important themes: the first is progress in Europe that has dissipated the immediate threat of a partial currency union break-up. The second is the completion of the re-pricing of a lower global growth trajectory. Finally, and potentially most important, has been the ongoing central bank commitment to collectively ease strains and protect financial market stability. Risk appetite has improved, opening the door for a partial retracement of the spring US dollar (USD) rally. The most significant risk to the FX outlook is also embedded in the above noted themes: an escalation in the European crisis, a downward revision to global growth and inadequate central bank policy responses. As foreign exchange markets move away from European induced risk aversion, fundamental analyses are proving the most valuable tool for valuation. The US recovery is moderate and fragile, with economic data somewhat uneven. From the viewpoint of the US Federal Reserve, the labour market and the housing sector remain weak and inflationary pressures have eased. Combined with developments on the global front, the door has been left open to another round of asset purchases (QE3). On the fiscal side, uncertainties as to the magnitude of the post-election ‘fiscal cliff’, combined with the lack of a credible long-term deficit resolution plan remain a significant concern. Accordingly, the combined monetary and fiscal dynamics in the US will limit the ability of the USD to sustain a rally, absent another spike in risk aversion. However, the path of the USD is far from uniform and the currency is likely to rally against some, including the euro (EUR) and Japanese yen (JPY), but weaken against others. The non-USD NAFTA zone currencies have retraced more than 50% of their spring losses, which for USDMXN has meant a drop from 14.60 to 13.35, an impressive 9% move. The impact on the Canadian dollar (CAD) has been less dramatic. With subsiding risk aversion, both CAD and MXN will be driven by macroeconomic fundamentals, including US economic developments, global growth deceleration, central bank policy and risk appetite. These measures suggest the road ahead for both CAD and MXN will prove bumpy but should extend recent gains into year-end. For CAD, its triple-A sovereign rating status should prove an added benefit that drives the currency back through parity, though its longer-term prospects should be affected by the softer outlook for commodity prices and export earnings. Within Latin America, the Brazilian real (BRL) appears to have stabilized close to 2.0 per USD. However, with a weakened growth outlook and an ongoing central bank easing cycle, its outlook pales in comparison to the other regional options like the Chilean peso (CLP) and the Peruvian sol (PEN). The euro (EUR) failed to rally in June, instead trading within a relatively tight range, as authorities continued to make progress. However, hurdles on both the European growth and structural fronts remain and repeated bouts of market uncertainty are likely to recur into 2013. This will drive EUR towards 1.23 by end-2012, closing 2013 at 1.21. For the Swiss franc (CHF), the EURCHF 1.20 floor is viewed as credible and we do not expect markets to test it. The EURSEK has been pushed to multi year lows (and through our year-end 8.80 forecast) as the relative economic, monetary and fiscal valuations have shifted against EUR. The fundamentals for the United Kingdom are typically associated with a weakening currency; however, the combination of the country’s triple-A status, well-defined fiscal plan and its role as an inter-European diversification investment compensate for some of the negatives, thus improving the GBP outlook. The largest threat to the European complex of currencies is further disappointment on global growth, particularly European. The Asian currencies offer a mixed outlook. As risk aversion has (at least for now) faded, the Japanese yen (JPY) has returned to a more stable trading pattern. We maintain our view that deterioration in sovereign debt and fiscal conditions, combined with loose monetary policy and a fragile economic backdrop, will weigh on the currency in the medium term. The Indian rupee (INR) will continue to underperform the rest of the emerging-Asian block on the back of weak economic and monetary conditions. The Chinese Yuan (CNY), as USD strength has abated, has retraced some of its recent losses, a trend we expect to continue into year-end.
The FX Outlook From A Global Perspective
Camilla Sutton (416) 866-5470 [email protected]
Pablo Bréard (416) 862-3876 [email protected]

Global Views
Economics
5 July 6, 2012
FOREIGN EXCHANGE
… continued from previous page
The appetite for aggressive CNY strength has faded in tandem with a more moderate growth profile. We hold a year-end USDCNY forecast of 6.25. A downshift in China’s expected 2012 growth is likely to dampen the appreciating trend of many of the other Asian currencies; however, with relatively stronger fundamentals, the South Korean won (KRW), Taiwanese dollar (TWD) and Thai baht (THB) are all expected to move higher over the quarter. For Australia, with some evidence of stabilization in growth and a less aggressive RBA stance, the outlook for AUDUSD has brightened; however, it remains vulnerable to periods of weakness driven by risk aversion or further pressure on global growth.
Camilla Sutton (416) 866-5470 [email protected]
Pablo Bréard (416) 862-3876 [email protected]

Global Views
Economics
6 July 6, 2012
FISCAL
Timeline for exchange implementation supports planning and investment.
With the U.S. Supreme Court decision to uphold the ‘individual mandate’ of the President’s signature health reform that requires all individuals to purchase health insurance or pay a penalty, investment will continue on State health insurance exchanges. Yet political uncertainty persists given the Republicans’ commitment to overturn the health reform legislation. Of the numerous changes proceeding under the Affordable Care Act (ACA), the health insurance exchanges stand out for their central role in the Administration’s health reform and the extensive planning and investment necessary for the exchanges to be fully functional by January 1, 2014 (see timeline below). The web-based exchanges are expected to provide one-stop shopping for small business or Americans without an employer-based health plan, presenting, on a more transparent, comparable basis, a range of health insurance plans vetted to meet minimum federal standards. For individuals and families with incomes up to 400% of the federal poverty level, the exchange will determine for each family member eligibility for programs such as Medicaid or the Children’s Health Insurance Program or premium assistance, with greater assistance for the elderly or individuals with pre-existing health conditions. The objective of seamless delivery will include streamlined enrolment through the exchange for any subsidy. To better meet each State’s specific needs, the ACA permits considerable flexibility on exchange design. The three options for exchange organization, including federal governance, are detailed on the following page, and the States’ takedown of federal grants to help finance the research, planning and implementation for their exchanges is summarized in the side charts. Planning decisions for each State extend to the exchange’s financing, characteristics of an essential health benefits package and potential supplementary benefits, plan carrier requirements and information technology systems. Also substantial are the private sector’s required exchange investments. With projections that premium revenues in 2014 through the exchanges could top US$50 billion, insurance companies must decide which State exchanges to participate in, the features of their proposed plans, technology integration with each exchange and the details of managing new risk parameters. Even if the ACA remains intact, adjustments are inevitable, given the experience of nations such as the Netherlands and Switzerland that offer universal coverage through private insurance with regulated market competition. An interesting side note as the health care debate intensifies with the November elections approaching, are the discussions in some States and insurers to sustain some of the reforms, such as the exchanges, regardless of the political outcome.
U.S. Health Insurance Exchanges — Moving Forward
Mary Webb (416) 866-4202 [email protected]
Emily Jackson (416) 607-0058 [email protected]
*Exchange Planning Grants: up to $1 million/State for research and planning towards an exchange. Exchange Establishment Grants: up to one year of funding for States that have made some progress under the Exchange planning grant. May apply for more grants if met certain criteria with first grant. Early Innovator Grants: awarded to States that demonstrate leadership in developing cutting-edge, cost-effective exchange plans. Source: Henry J. Kaiser Family Foundation, State Health Facts.
June 28, 2012: Supreme Court Decision
Nov 16, 2012: Deadline for Submission of Blueprint to Run State-based or State-Partnership Exchange
January 1, 2013: Approval Date for State-Based and State-Partnership Exchanges
October 1, 2013: Initial Enrollment Period Begins
January 1, 2014: Exchanges Become Fully Operational
November 6, 2012: Elections
0
5
10
15
20
25
30
35
40
45
50
Participating States …
number of States receiving grant*
Exchange Planning
Exchange Establishment
Early Innovator
No Grants
U.S. Federal Grants for
Health Insurance Exchanges:
Timeline for U.S. Health Insurance Exchanges
0
100
200
300
400
500
600
700
800
900… And Amounts Distributed
total grants distributed, $mil
Exchange Planning
Exchange Establishment
Early Innovator

Global Views
Economics
7 July 6, 2012
… continued from previous page
FISCAL
Mary Webb (416) 866-4202 [email protected]
Emily Jackson (416) 607-0058 [email protected]
Options for Organization of State Health Insurance Exchanges State-Based: The State operates all exchange activities, but may use federal services for functions such as: premium tax credit and cost-sharing reduction determination, exemptions, risk adjustment programs and reinsurance. State-Partnership: The State operates plan management and/or consumer assistance, and may elect to provide: reinsurance program and Medicaid and CHIP (Children’s Health Insurance Program) eligibility assessment, or have these provided by federal services. Federally-Facilitated Exchange (FFE): The federal department of Health and Human Services (HHS) operates the exchange, however, the State may elect to perform reinsurance program or Medicaid and CHIP eligibility assessment.
Premium Tax Credits Individuals and families with incomes from 100-400% of the federal poverty level will be eligible for tax credits, with the credit amount being linked to the amount of the premium, allowing the elderly and those with pre-existing conditions who face higher premiums to receive larger tax credits. The credit amount is the difference between the premium for the “benchmark plan” and the taxpayer’s expected contribution, with the expected contribution ranging from 2% of taxpayer’s household income for families at 100% of the federal poverty level to 9.5% for families at 400% of the FPL. These credits are estimated to assist 18 million people in purchasing private insurance.

Global Views
Economics
8 July 6, 2012
AUTOS
Enhanced incentives and solid U.S. replacement demand drive gains despite a slowing labour market and intensifying global headwinds.
While global economic growth has downshifted in recent months, passenger vehicle sales in North America remain in the fast lane, advancing 20% y/y in June — a noticeable acceleration from a 12% y/y increase during the previous five months. Purchases were especially robust in the United States, climbing a stronger-than-expected 22% y/y to an annualized 14.1 million units, up from 13.8 million in May. The improvement was broad-based and highlights the sizeable potential for vehicle replacement in the United States, especially since the pick-up occurred against the backdrop of a softening labour market and waning consumer confidence. The gain was more subdued in Canada, with purchases advancing 3% y/y last month. However, the comparison is distorted by the fact that last June was the highest selling rate of any month in 2011. In fact, we estimate that sales climbed back above an annualized 1.70 million units in June, up from an average of 1.67 million in the March to May period. Last month’s robust performance partly reflects increased discounting, as several automakers re-introduced “employee pricing” in June. Even prior to the latest inducements, Statistics Canada estimates that new vehicle prices had declined by nearly 1% in May. Given the response to these initiatives by both households and fleets, we have increased our 2012 Canadian passenger vehicle sales forecast to 1.68 million units, up from 1.64 million. Western Canada accounts for most of the strength, with volumes in the region advancing 12% in the first half of 2012 — double the increase in the rest of the country. The latest improvement in vehicle sales in both Canada and the United States is a relief for the industry, since it occurred against the backdrop of the intensifying euro zone debt crisis and slowing global economic growth. There is still a risk that the recent softening in the U.S. labour market could dampen confidence and reduce sales. However, even prior to last month’s robust results, global car sales had been immune to the ongoing problems in Western Europe and the moderation in global economic growth. In fact, global volumes accelerated to an 11% y/y increase in May — the strongest gain in more than two years and double the increase from January through April. Global purchases are being buoyed by solid gains in Japan, North America and Eastern Europe, as well as the recent quickening of the sales pace in China following the introduction of stimulus measures by the government in May. Strength in these regions is overwhelming the ongoing deterioration in Western Europe and the recent slowdown in Brazil. Japanese automakers led last month’s gain in both Canada and the United States, lifting their market share in both countries by roughly five percentage points — the largest increase in four years. The improvement reflects a normalization of their dealer inventories following last year’s tsunami-related depletion, as well as the introduction of popular new models, such as the Toyota Camry — the best-selling car in the United States this year. The Detroit Three also posted a double-digit sales increase in the United States last month, but reported a 9% y/y decline in Canada, due to lower truck sales. In particular, pickup truck sales for each of the Detroit Three declined in June — a sharp reversal from more than a 25% y/y increase through May. The decline in pickup truck sales possibly reflects some moderation in the Canadian housing market, as residential contractors are normally big buyers of pickup trucks.
Carlos Gomes (416) 866-4735 [email protected]
Vehicle Sales Accelerate In North America
0
4
8
12
16
20
2011 2012
0
2
4
6
8
10
Vehicle Sales Accelerate
Source: Scotia Economics
6MMA,y/y % change
Canada/U.S.A. (LHS)
Global Car Sales (RHS)
6MMA,y/y % change

Emerging Markets Strategy Global Views
9 July 6, 2012
The following article was published on July 3, 2012.
Belize finally released its proposed budget for fiscal year 2012/2013 last Friday. The delay in releasing the budget back in April had coincided with the government’s reassessment of its liabilities, creating expectations that the government would take some action on the debt or at least reveal what type of restructuring it wants by the time the budget was ready. In this respect, creditors could be disappointed since the budget envisions full payment of bond coupons for the year while at the same time expounding on the need for a restructuring. In general, this year’s budget is not that different from previous budgets. Relative to the realized budget for the previous year, we see increases in primary expenditures and capital expenditures totaling about 1% of GDP. An additional 1% of GDP comes from increases in interest on the debt, mostly the step-up in the coupon on the Global bond. On the revenue side, there are almost no new taxes. Instead, the government expects an increase in financing from multilateral and bilateral development funds. The government forecasts an overall deficit of 2.5% of GDP, which is worse than the 1% deficit achieved last year but still fairly conservative, especially considering the current global environment. The fiscal update issued on June 20th addresses the government’s position with regards to its debt more directly. That report delves in significant detail into the economic and fiscal problems the country will face through 2015 stemming from global economic problems, a decline in oil production, and a deteriorating infrastructure. Nevertheless, the core of the report’s conclusions that the government needs a restructuring result not from those economic problems but rather from an approximately 80% expected increase in debt service (interest and amortizations) arising mostly from compensation claims related to the current administration’s nationalizations of the country’s telecommunications and electric utilities. While that report’s projection of paying compensation claims over a five-year period at the mid-point between the government’s fair value assessment and the former shareholder’s asking price could provide some comfort to those former shareholders, it is unlikely to convince bondholders. Why should those bondholders accept a lower coupon or a maturity extension so that newer creditors could be repaid in full right away? We doubt the government has enough time to complete a voluntary restructuring prior to the August 20th due date of the next coupon payment. Recent government statements and actions suggest the government will first pursue a voluntary restructuring before resorting to an Ecuador style default, but much uncertainty remains.
Belize Budget Provides Little Clarity
We review the implications of the recently released Belize budget as well as the economic report published two weeks ago for holders of Belize government bonds.
Joe Kogan (212) 225-6541 [email protected]

Portfolio Strategy Global Views
10 July 6, 2012
The following article was published on July 4, 2012. The "official" Q2 earnings season will kick off next week in the U.S., with Alcoa reporting on
Monday. In Canada, the earnings season will really get underway in late July. We expect Q2 earnings to miss consensus in both Canada and the U.S.
S&P/TSX Q2/12 Preview Q2 earnings expectations are too high. The TSX Q2 earnings season could prove quite challenging as lower commodity prices, weak equity markets, and falling bond yields should negatively impact earnings. Despite negative revisions, Q2 EPS forecasts still appear relatively optmistic, in our view. We expect TSX's most important sectors (Energy, Materials, and Financials) to report lower than expected earnings. These three sectors should generate 78% of TSX total earnings in Q2. Beat or miss. Based on our regression models, we expect TSX Energy, Gold, Mining, and Financials sectors to post Q2 EPS below Street expectations. The TSX beat ratio has hovered below 50% since Q4/10. TSX Q2 EPS is expected to hit $216 based on bottom-up consensus figures, implying an EPS run rate of $864. Q2 earnings should be down 5% YOY, marking the first negative print since Q2/10. Sector-wise, earnings for the big three (Financials, Energy, and Materials) are expected to be a mixed bag. Financials EPS should expand 4% YOY, while Energy (-16%) and Materials (-10%) earnings should suffer double-digit declines.
Commodity prices and earnings risk Exacerbated by the intensifying debt concerns in Europe and a slower pace of economic growth in China and the United States, commodity prices have weakened further in the past few weeks. The CRB index has recently declined to its lowest level since September 2010. From its post-financial crisis peak (April 2011), the CRB index has retreated over 25%. Earnings expectations for the TSX index have come down, but bottom-up forecasts still remain too optimistic, in our view. Expectations are calling for EPS of $232 and $245 for Q3 and Q4, respectively. These forecasts are suggesting a 7% and 13% bounce from Q2 levels, which is optimistic given the current macro backdrop. Moreover, TSX quarterly earnings have not exceeded the $228 level since Q1/11. Hence, to produce quarterly earnings well in excess of $230 would require a sharp turnaround in commodity prices and global macro indicators.
Beat The Street — Q2/12 Earnings Preview
Hugo Ste-Marie (514) 287-4992 [email protected]
Exhibit 1 — S&P/TSX: Q2/12 Consensus Estimates
Contribution Sector Top-line Profit
$ QOQ YOY to Earnings Weighting (YOY%) Margin (%)S&P/TSX 216 -2% -5% 100% 100% -4% 12%
Energy 36 -13% -16% 20% 25% 6% 10%Materials 57 28% -10% 21% 19% 9% 19% Divers. M/Mining 132 -3% -15% 3% 3% 14% 15% Gold 42 7% -4% 10% 11% 16% 23%Industrials 22 13% 7% 5% 6% -15% 9%Discretionary 22 27% 14% 5% 5% 6% 7%Staples 34 25% -2% 3% 3% 14% 3%Health Care 14 5% 52% 2% 2% 55% 13%Financials 35 -8% 4% 37% 32% -18% 16% Banks 46 -1% 7% 26% 21% -16% 25% Insurance 17 -39% -11% 6% 5% -10% 6%Technology 1 -64% -74% 1% 1% -20% 4%Telecom 20 6% 0% 6% 5% 6% 13%Utilities 17 -48% -2% 1% 2% 34% 5%TSX 60 14 -1% -2% 80% n/a n/a 14%TSX Completion 11 -1% -17% 20% n/a n/a 7%
Q2/12 E
Source: Scotiabank GBM estimates; CPMS; Bloomberg

Portfolio Strategy Global Views
11 July 6, 2012
Exhibit 2 highlights the relationship between the CRB and trailing earnings of Canadian small and large caps. As shown on the chart, downtrends in the CRB have usually led to lower earnings in Canada. Since the CRB has started to rollover, Canadian earnings have faced stronger headwinds. Large cap earnings have been range bound, while small cap trailing earnings have come down slightly. If the downtrend in the CRB extends in the coming months, it could fuel further negative revisions, and possibly, lead to an outright contraction in earnings in Canada. S&P 500 Q2/12 Preview In the United States, we expect the Q2 earnings season to also negatively surprise. Following a relatively good Q1 earnings season, with S&P 500 EPS exceeding consensus by 2%, we are less upbeat for Q2. Amongst potential headwinds, we note: 1) a softer pace of global economic growth; 2) a rising U.S. dollar; 3) U.S bellwethers providing lower guidance, 4) a weak preliminary beat ratio, and 5) optimistic expectations for Q2 EPS. S&P 500 Q2 EPS is expected to come in at US$25.34 based on bottom-up consensus figures, which would set a new record high. Q2 EPS is expected to increase 5% sequentially and expand 1.9% year-over-year. Earnings growth has been decelerating rapidly in the past few quarters, going from 17% YOY in Q3/11 to less than 2% currently. S&P 500 revenues are expected to expand 3.6% YOY in Q2, which is about half the pace observed in the past two quarters.
… continued from previous page
Hugo Ste-Marie (514) 287-4992 [email protected]
0
50
100
150
200
250
300
350
400
Dec
-95
Dec
-96
Dec
-97
Dec
-98
Dec
-99
Dec
-00
Dec
-01
Dec
-02
Dec
-03
Dec
-04
Dec
-05
Dec
-06
Dec
-07
Dec
-08
Dec
-09
Dec
-10
Dec
-11
Large cap trailing EPS
Small cap trailing EPS
CRB index (12-M avg.)
NormalizedDec-95 = 100
Exhibit 2 — CRB index vs. Canadian Large Caps and Small Caps Earnings
Source: Scotiabank, Thomson Financial, Bloomberg
Exhibit 3 — S&P 500 EPS: Q2/12 Consensus Estimates
Contribution Sector$ QOQ YOY to Earnings Weighting
S&P 500 25.34 5% 1.9% 100% 100%
Energy 12.17 6% -6% 14% 11%Materials 4.68 11% -14% 4% 3%Industrials 5.98 9% 8% 11% 10%Discretionary 5.26 7% -2% 10% 11%Staples 5.48 8% 2% 9% 11%Health Care 8.51 2% 3% 13% 14%Financials 4.05 3% 3% 16% 12%Technology 8.59 4% 12% 19% 20%Telecom 1.89 -1% 6% 2% 3%Utilities 2.61 -12% -9% 3% 4%S&P 600 5.94 13% 11% n/a n/a
Q2/12 E
Source: S&P, Thomson Financial

Portfolio Strategy Global Views
12 July 6, 2012
Full- length report, detailed model portfolio and sector strategy changes will be available early next week. Balanced risk-reward outlook, looking to raise cyclical exposure in 2H12 We shifted to a more conservative stance in our Spring Strategy update and are leaving our recommended asset mix unchanged for now. We are carrying an overweight cash/neutral equity stance along with a DM over EM preference. Although our asset mix call remains unchanged, we are shifting our equity sector strategy away from a very defensive stance in Q2/12. See model portfolio changes. Our strategy message for Q3 is one of slow transition away from the defensive/low beta stance recommended in 1H12. Our tactical asset mix model is not flashing green on equities yet and we believe the opportunity to significantly add beta (asset mix and sector strategy) will present itself later in Q3 when PMI/ISM indices bottom and negative earnings revisions stabilize. U.S. 10-Yr Treasury yields declined 56 bp in Q2 with the MSCI World AC Index pulling back 6% and the CRB correcting 8%. We believe Q2's de-risking has balanced equities' risk-reward outlook as downside risks (weaker GDP, negative earnings revisions, fiscal cliff) are somewhat offset by compelling relative valuations and a growing chorus of pro-growth measures. We do not rule out recession risks, but view improving U.S. housing figures and China's broader easing bias as reducing odds of a global hard landing scenario. No "Risk-On" without positive earnings revisions. In our opinion, risk-appetite could still be challenged as a potentially disappointing earnings season triggers more negative revisions. We are lowering our 2012 and 2013 TSX earnings estimates to $850 and $900, respectively. Our TSX price target moves down to 12,400 (from 12,600). Our S&P500 earnings forecasts stand at US$100 for 2012 (from US$102) and US$105 for 2013. Our target remains unchanged at 1,425. Bonds pricing a lot of bad news. Slowing macro momentum through Q3 and easing hopes should keep U.S. and Canadian long term yields hovering near their 2012 lows, but our view is that North American sovereign bond yields are already positioned for lacklustre growth. Scotia Economics expects 10-Yr Canadian and U.S. government yields to increase north of 100 bp over the next 12-18 months, pointing to mid-single digit negative total returns for bonds. Central Banks Strike Back. Risk assets have attempted to rally since the last Euro Council meeting and early July's easing from the ECB, the BoE, and the PBoC could help risk appetite. Pervasive evidence of recessionary data in Europe and muted growth in China has been largely dismissed by investors recently as easing hopes offset these disappointments. In the U.S., even the staggering ISM miss was greeted with cheers on Wall Street.
Strategic Edge Quarterly — 2012 Summer Outlook
Vincent Delisle (514) 287-3628 [email protected]
Exhibit 1 — Scotiabank GBM Recommended Asset Mix - Summer 2012
ExpectedChange from Total Return
Benchmark Recommended Spring 12 Next 12-MEquities 60% 60% 5% Canada (TSX) 5% 5% +1% 5% U.S. (S&P 500) 20% 21% -1% 6% Int'l (Europe, Japan) 18% 19% 6% EM-Asia 10% 8% 4% EM-LatAm 7% 7% 4%
Bonds 40% 36% -4% Government 30% 22% -5% Corporate 10% 14% 0%
Cash (91-D Tbills) 0% 4% 1%
Asset Mix
Source: Scotiabank GBM estimates
Portfolio Strategy Global Views
13 July 6, 2012
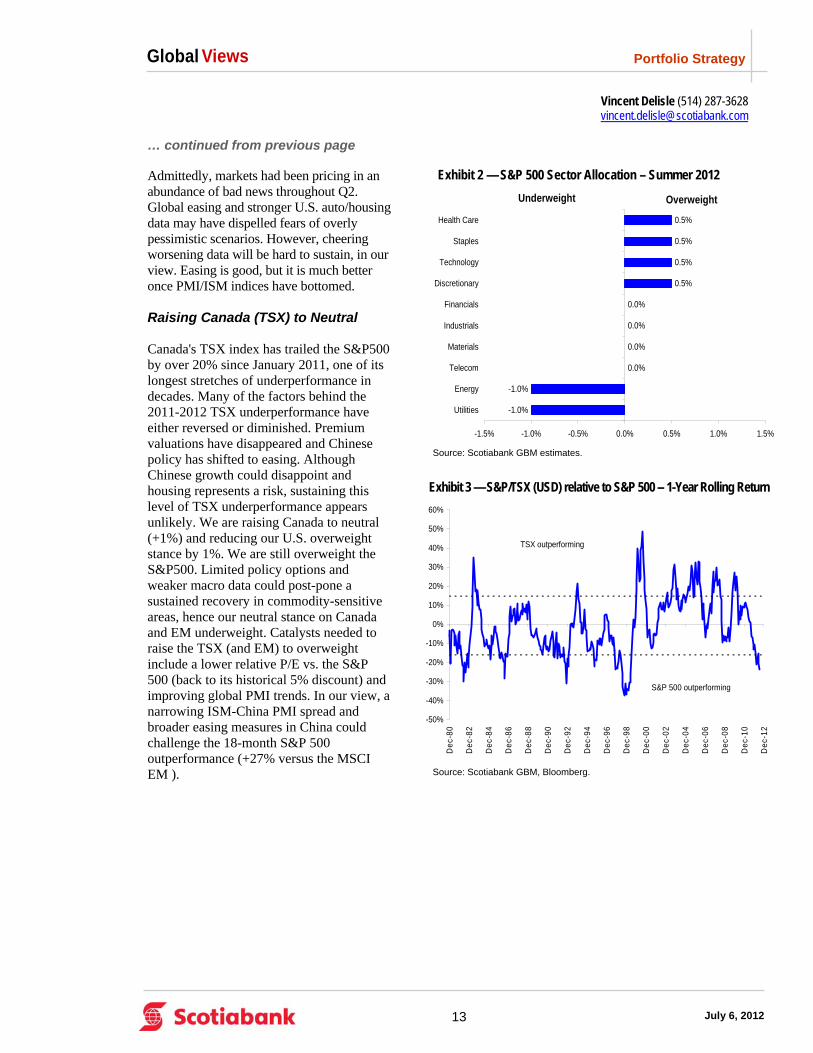
Admittedly, markets had been pricing in an abundance of bad news throughout Q2. Global easing and stronger U.S. auto/housing data may have dispelled fears of overly pessimistic scenarios. However, cheering worsening data will be hard to sustain, in our view. Easing is good, but it is much better once PMI/ISM indices have bottomed. Raising Canada (TSX) to Neutral Canada's TSX index has trailed the S&P500 by over 20% since January 2011, one of its longest stretches of underperformance in decades. Many of the factors behind the 2011-2012 TSX underperformance have either reversed or diminished. Premium valuations have disappeared and Chinese policy has shifted to easing. Although Chinese growth could disappoint and housing represents a risk, sustaining this level of TSX underperformance appears unlikely. We are raising Canada to neutral (+1%) and reducing our U.S. overweight stance by 1%. We are still overweight the S&P500. Limited policy options and weaker macro data could post-pone a sustained recovery in commodity-sensitive areas, hence our neutral stance on Canada and EM underweight. Catalysts needed to raise the TSX (and EM) to overweight include a lower relative P/E vs. the S&P 500 (back to its historical 5% discount) and improving global PMI trends. In our view, a narrowing ISM-China PMI spread and broader easing measures in China could challenge the 18-month S&P 500 outperformance (+27% versus the MSCI EM ).
… continued from previous page
Vincent Delisle (514) 287-3628 [email protected]
Exhibit 2 — S&P 500 Sector Allocation – Summer 2012
-1.0%
-1.0%
0.0%
0.0%
0.0%
0.0%
0.5%
0.5%
0.5%
0.5%
-1.5% -1.0% -0.5% 0.0% 0.5% 1.0% 1.5%
Utilities
Energy
Telecom
Materials
Industrials
Financials
Discretionary
Technology
Staples
Health Care
OverweightUnderweight
Source: Scotiabank GBM estimates.
Exhibit 3 — S&P/TSX (USD) relative to S&P 500 -- 1-Year Rolling Return
-50%
-40%
-30%
-20%
-10%
0%
10%
20%
30%
40%
50%
60%
Dec
-80
Dec
-82
Dec
-84
Dec
-86
Dec
-88
Dec
-90
Dec
-92
Dec
-94
Dec
-96
Dec
-98
Dec
-00
Dec
-02
Dec
-04
Dec
-06
Dec
-08
Dec
-10
Dec
-12
TSX outperforming
S&P 500 outperforming
Source: Scotiabank GBM, Bloomberg.

Global Views
Economics
14 July 6, 2012
KEY DATA PREVIEW
Key Data Preview
CANADA No aspect of the Canadian economy has received more press in 2012 than the housing sector, so Canadian housing starts data for June are likely to receive a fair bit of attention when they’re released on July 10. Scotia anticipates that the level of starts will remain fairly high: 210k in June after registering 211k in May. Our forecast is based on the still elevated level of building permits being issued: 224k in May, 197k in April, 213k in March. Even if new regulations are likely to dampen activity in the housing sector eventually, in the interim there are still elevated levels of permits for construction that are yet to turn into housing starts. The high level of permits is attributable to condos: of the 229k building permits issued in December 2011, 139k were for multi-unit construction; 141k of the May 2012 permits were for multis as were 128k of the permits issued in March. Those are respectively the fourth, third and thirteenth highest amounts of construction permits issued for multis on record for Canada. Four of the past six months registered levels of multi-unit housing construction permit issuance in the top 25 of all time. That’s not because the levels of permits being issued or housing starts being undertaken are particularly high (they’re not, see chart) but rather because of the extent of activity in the condo space with a focus on Ontario. While data that we track imply that there are a decent amount of condo projects in the pipeline yet, what looks to be a slowing-down in planned construction in Toronto during the second half of the year should temper housing starts numbers at some point — although there could well be a final spurt of building first. Canada will also release merchandise trade data for May on July 11. Scotia is expecting a fairly modest retrenchment in the trade balance, from C$-0.37B in April to a lower C$-0.5B. The main catalyst should be falling prices for some of the principal crude distillates that Canada exports. The price of Western Canada Select crude fell by 6.7% m/m during May according to Bloomberg, which ought to negatively impact Canada’s exports. Some of this will be mitigated by a greater fall in the price of the crude that Canada imports (Brent crude fell by 8.2% m/m), however as Canada exports more crude than it imports, the net of the price effect ought to knock down Canada’s trade balance. New orders of machinery were lower in April as well, implying that we should see some weakness in machinery and equipment shipments for export in May. The broader story with respect to Canadian trade is that Canada ran a merchandise trade surplus during Q1, but Q2 is shaping up more weakly. A modestly negative Q2 trade balance of the type that we’re forecasting would chip away at the Q1 trade surplus without negating it. UNITED STATES The US will release its international trade balance data for May on July 11, and Scotia expects the number to come in at US$-48bn, an improvement from the US$-50.1bn trade balance during April. There have been major changes in oil prices over the past number of months, but particularly during May and June. The falling crude prices ought to meaningfully benefit the US trade balance. While the US carries a fairly wide trade deficit of +/- US$50bn per month before adjustments (US$-574bn in 2011 or 3.7% of GDP), if crude and petroleum are taken out of the picture then the deficit is significantly smaller (US$-447bn in 2011, or 2.9% of GDP). The falling crude prices won’t eliminate the petroleum deficit, however they go some ways towards making it less of a factor. If the trade deficit narrows, then net trade could start to post positive contributions to GDP over the next couple of quarters merely by virtue of being less negative. The stronger USD during May and June also ought to help out, as the US imports more than it exports and therefore cheaper imports matter more than the hit to US exports.
A1
Dov Zigler (416) 862-3080 [email protected]
Derek Holt (416) 863-7707 [email protected]
0
50
100
150
200
250
300
350
Jan-2000 Jan-2002 Jan-2004 Jan-2006 Jan-2008 Jan-2010 Jan-2012
Canada: Building Permits Driven by Multiple Housing Units
Total SinglesMultis
Source: Scotia Economics, Statscan
Building Permits,Thousands,SAAR

Global Views
Economics
15 July 6, 2012
KEY DATA PREVIEW
… continued from previous page
EUROPE French industrial production surprised on the upside in April, rising a strong 1.5% m/m. However, this increase had more to do with the impact of cold temperatures, which boosted output in the energy sector (+16.6% m/m), than any underlying strength. Indeed, manufacturing growth, the core of the report, actually dropped 0.7% m/m and has been negative for four of the past five months. Further weakness in May would strengthen the feeling that the French economy — which so far has been able to avoid a quarterly GDP contraction — is flirting with recessionary conditions in the second quarter. A deep fall in the latest INSEE general production component is worrying. Also, as in April, there is a risk of unfavourable working days dampening activity. On the positive side, the slight rise in exports over the past two months suggests that external demand could still offer some support. Overall, we look for industrial production to fall 0.5% m/m, although manufacturing should recover by around 0.3% m/m. Inflation data for June will also be released in France next week. We look for an almost stable month-on-month reading, with the yearly rate easing to 1.9% y/y from 2.0%. Conflicting factors will likely be apparent in the June CPI report. On the softer side will be the ongoing effect of lower energy prices. Looking to the weekly trend in gasoline prices, we expect energy prices to drop between 2.0% and 2.5% m/m. On the upside will be the possible impact of higher food prices; we expect around a +0.5% m/m rise, which would imply a reacceleration on a yearly basis to 3.1% y/y from 2.9% in May. Another upside factor could come from core inflation as the sale period this year started roughly one week later than last year. As a consequence, we could see higher annual core inflation as the impact of discounting clothing prices in particular will fully play in to the July report, though not much in June like last year. LATIN AMERICA Mexican industrial production (IP) for May will be released next Thursday, July 12th. We continue to expect a positive performance in the Mexican industry sector, a main component of the country’s solid economic outlook. In April, IP grew by 3.6% y/y, supported by a 4.8% y/y expansion in construction and a 4.6% advance in manufacturing; mining on the other hand, contracted by almost 1.0% for the third consecutive month. On a monthly basis, IP continued its positive trend, advancing by 0.65% m/m. We expect IP to grow by 4.0% y/y in May. ASIA Next Thursday, July 12th, China will release an estimate of GDP growth in the three months to June. The economy lost momentum in the second quarter, likely slowing from 8.1% y/y in the first quarter to around 7.8% (this will be the slowest pace since the first quarter of 2009). We retain our view that a soft landing is materializing and that the world’s second biggest economy will expand at, or slightly below, the 8% mark on average this year, before advancing a bit faster in 2013. Nevertheless, there are notable downside risks in our forecast, primarily connected to a potential erosion of growth dynamics in both the United States and Europe. In March the government lowered the official forecast to 7.5%, and the People’s Bank of China (PBoC) has since lowered the benchmark lending rate to 6.00% and the deposit rate to 3.00% so as to protect the economy against external financial market volatility and to encourage domestic bank lending in particular.
A2
Frédéric Prêtet (00 33) 17037-7705 [email protected]
Sarah Howcroft (416) 863-2859 [email protected]
Daniela Blancas (416) 862-3908 [email protected]
0
2
4
6
8
10
10 11 12
Mexican Industrial Production
Source: Bloomberg.
y/y % change

Economics
1
Global Views
July 6, 2012
KEY INDICATORS
Key Indicators for the week of July 9 - 13
Forecasts at time of publication. Source: Bloomberg, Scotia Economics.
A3
Country Date Time Indicator Period BNS Consensus LatestMX 07/09 09:00 Consumer Prices (m/m) JUN 0.39 0.4 -0.3MX 07/09 09:00 Consumer Prices (y/y) JUN 4.27 4.3 3.9MX 07/09 09:00 Consumer Prices Core (m/m) JUN 0.2 0.2 0.3CA 07/09 10:30 BoC Senior Loan Officer Survey 2Q -- -- -16.9CA 07/09 10:30 Business Outlook Future Sales 2Q -- -- 35.0US 07/09 15:00 Consumer Credit ($ bn m/m) MAY -- 8.5 6.5
CA 07/10 08:15 Housing Starts (000s a.r.) JUN 210 200 211
CA 07/11 08:30 Merchandise Trade Balance (C$ bn) MAY -0.5 -0.6 -0.4US 07/11 08:30 Trade Balance ($ bn) MAY -48.0 -48.4 -50.1MX 07/11 09:00 Trade Balance (US$ mn) MAY F -- -- 362.7US 07/11 10:00 Wholesale Inventories (m/m) MAY -- 0.3 0.6
US 07/12 07:00 MBA Mortgage Applications (w/w) JUL 7 -- -- -6.7CA 07/12 08:30 New Housing Price Index (m/m) MAY -- 0.2 0.2US 07/12 08:30 Initial Jobless Claims (000s) JUL 7 390 374 374US 07/12 08:30 Continuing Claims (000s) JUN 30 3300 374 3306US 07/12 08:30 Export Prices (m/m) JUN -- -1.6 -1.0US 07/12 08:30 Import Prices (m/m) JUN -- -1.6 -1.0MX 07/12 09:00 Industrial Production (m/m) MAY -- 0.2 0.7MX 07/12 09:00 Industrial Production (y/y) MAY 4.0 3.6 3.6US 07/12 14:00 Treasury Budget ($ bn) JUN -- -- -124.6
US 07/13 08:30 PPI (m/m) JUN -0.5 -0.6 -1.0US 07/13 08:30 PPI ex. Food & Energy (m/m) JUN 0.2 0.2 0.2US 07/13 09:55 U. of Michigan Consumer Sentiment JUL P 73.5 73.5 73.2
Country Date Time Indicator Period BNS Consensus LatestGE 07/09 02:00 Current Account (€ bn) MAY -- 10.1 11.2GE 07/09 02:00 Trade Balance (€ bn) MAY -- 14.0 14.4
FR 07/10 02:45 Industrial Production (m/m) MAY -0.5 -0.8 1.5FR 07/10 02:45 Manufacturing Production (m/m) MAY 0.3 -0.3 -0.7IT 07/10 04:00 Industrial Production (y/y) MAY -- -9.0 -9.2UK 07/10 04:30 Industrial Production (m/m) MAY -- -0.2 0.0UK 07/10 04:30 Manufacturing Production (m/m) MAY -- -0.1 -0.7UK 07/10 04:30 Visible Trade Balance (£ mn) MAY -- -9100 -10103
GE 07/11 02:00 CPI (y/y) JUN F 1.7 1.7 1.7GE 07/11 02:00 CPI - EU Harmonized (y/y) JUN F 2.0 2.0 2.0FR 07/11 02:45 Current Account (€ bn) MAY -- -3.5 -4.2
FR 07/12 01:30 CPI (m/m) JUN 0.0 0.0 -0.1FR 07/12 01:30 CPI (y/y) JUN 1.9 1.9 2.0FR 07/12 01:30 CPI - EU Harmonized (m/m) JUN 0.0 0.0 -0.1FR 07/12 01:30 CPI - EU Harmonized (y/y) JUN 2.2 2.1 2.3EC 07/12 05:00 Industrial Production (m/m) MAY -- 0.0 -1.1
SP 07/13 03:00 CPI (y/y) JUN F 1.9 1.9 1.9SP 07/13 03:00 CPI - EU Harmonized (y/y) JUN F 1.8 1.8 1.8IT 07/13 04:00 CPI (y/y) JUN F 3.3 3.3 3.3IT 07/13 04:00 CPI - EU Harmonized (y/y) JUN F 3.6 3.6 3.6
North America
Europe

Economics
2
Global Views
July 6, 2012
KEY INDICATORS
Key Indicators for the week of May 21 - 25
Forecasts at time of publication. Source: Bloomberg, Scotia Economics.
A4
Country Date Time Indicator Period BNS Consensus LatestPE 07/10 06:59 Trade Balance (PEN mn) MAY -- -- -84.4
BZ 07/11 07:59 Economic Activity Index SA (m/m) MAY -- -0.2 0.2BZ 07/11 07:59 Economic Activity Index NSA (y/y) MAY -- 0.4 0.0BZ 07/11 07:59 SELIC Target Rate (%) JUL 11 8.00 8.00 8.50BZ 07/11 08:00 Retail Sales (m/m) MAY -- 0.5 0.8BZ 07/11 08:00 Retail Sales (y/y) MAY -- 10.5 6.0
CL 07/12 18:00 Nominal Overnight Rate Target (%) JUL 12 5.00 5.00 5.00PE 07/12 19:00 Reference Rate (%) JUL 4.25 4.25 4.25
Key Indicators for the week of July 9 - 13
Asia Pacific
Latin America
Country Date Time Indicator Period BNS Consensus LatestJN 07/08 19:50 Bank Lending (y/y) JUN -- -- 0.3JN 07/08 19:50 Current Account (¥ bn) MAY -- 493.1 333.8JN 07/08 19:50 Machine Orders (m/m) MAY -- -2.6 5.7JN 07/08 19:50 Trade Balance (¥ bn) MAY -- -836.8 -463.9CH 07/08 21:30 CPI (y/y) JUN -- 2.3 3.0CH 07/08 21:30 PPI (y/y) JUN -- -2.0 -1.4
JN 07/09 01:00 Eco Watchers Survey (current) JUN -- 47.5 47.2TA 07/09 04:00 Trade Balance (US$ bn) JUN -- 2.3 2.3PH 07/09 21:00 Exports (y/y) MAY -- 6.8 7.6
JN 07/10 01:00 Consumer Confidence JUN -- 40.7 40.7CH 07/10 06:59 Trade Balance (US$ bn) JUN -- 24.0 18.7JN 07/10 19:50 Tertiary Industry Index (m/m) MAY -- 0.2 -0.3AU 07/10 21:30 Home Loans (%) MAY -- 0.8 0.2
JN 07/11 02:00 Machine Tool Orders (y/y) JUN P -- -- -3.0CH 07/11 07:59 Foreign Reserves (US$ bn) JUN -- 3359.0 3305.0CH 07/11 07:59 New Yuan Loans (bn) JUN -- 880.0 793.2NZ 07/11 07:59 REINZ Housing Price Index (m/m) JUN -- -- 1.7SK 07/11 21:00 BoK Base Rate (%) JUL 12 3.25 3.25 3.25AU 07/11 21:30 Employment (000s) JUN -- 0.0 38.9AU 07/11 21:30 Unemployment Rate (%) JUN -- 5.2 5.1
JN 07/12 06:59 BoJ Target Rate (%) JUL 12 0.10 -- 0.10ID 07/12 07:59 BI Reference Interest Rate (%) JUL 12 5.75 5.75 5.75CH 07/12 22:00 Fixed Asset Investment YTD (y/y) JUN -- 20.0 20.1CH 07/12 22:00 Industrial Production (y/y) JUN -- 9.8 9.6CH 07/12 22:00 Real GDP (y/y) 2Q 7.8 7.7 8.1CH 07/12 22:00 Retail Sales (%) JUN -- 13.5 13.8
JN 07/13 00:30 Capacity Utilization (m/m) MAY F -- -- -0.7JN 07/13 00:30 Industrial Production (m/m) MAY F -- -- -3.1IN 07/13 02:30 Monthly Wholesale Prices (y/y) JUN -- -- 7.6

Economics
3
Global Views
July 6, 2012
AUCTIONS
Global Auctions for the week of July 9 - 13
Source: Bloomberg, Scotia Economics.
A5
Country Date Time EventUS 07/09 11:30 U.S. to Sell 3-Month BillsUS 07/09 11:30 U.S. to Sell 6-Month Bills
US 07/10 11:30 U.S. to Sell 4-Week BillsUS 07/10 13:00 U.S. to Sell 3-Year Notes
US 07/11 13:00 U.S. to Sell 10-Year Notes Reopening
US 07/12 13:00 U.S. to Sell 30-Year Bonds Reopening
Country Date Time EventGE 07/09 05:30 Germany to Sell EU4 Bln 6-Mth BillsFR 07/09 09:00 France to Sell Bills (BTF)
NE 07/10 04:00 3Y Bond Amount SoldGR 07/10 05:10 6M T-Bill Average YieldGR 07/10 05:10 6M T-Bill Bid/Cover RatioSZ 07/10 05:30 Switzerland to Sell 12-Month BillsUK 07/10 05:30 U.K. to Sell GBP900 Mln 0.5% I/L 2050 Bonds
SZ 07/11 05:30 Switzerland to Sell BondsGE 07/11 05:30 Germany to Sell Add'l EU5 Bln 10-Year Notes
IT 07/12 05:00 Italy to Sell BillsUK 07/12 05:30 U.K. to Sell GBP3.5 Bln 1.75% 2022 Bonds
IT 07/13 05:00 Italy to Sell Bonds/Floating/Zero CouponBE 07/13 06:00 Belgium to Sell BondsUK 07/13 06:10 U.K. to Sell Bills
Country Date Time EventCH 07/08 21:50 China Muni to Sell CNY23.9 Bln 3-Year Bonds (1203)
JN 07/09 23:45 Japan to Sell 30-Year Bonds
CH 07/10 23:00 China to Sell 7-Year BondsJN 07/10 23:35 Japan to Sell 3-Month Bills
NZ 07/11 22:30 New Zealand Plans to Sell Bonds
CH 07/12 23:00 China to Sell 6-Month Bill
North America
Europe
Asia Pacific
Latin America
Country Date Time EventBZ 07/10 11:00 Brazil to Sell I/L Bonds due 8/15/2016BZ 07/10 11:00 Brazil to Sell I/L Bonds due 8/15/2050BZ 07/10 11:00 Brazil to Sell I/L Bonds due 8/15/2018BZ 07/10 11:00 Brazil to Sell I/L Bonds due 8/15/2022BZ 07/10 11:00 Brazil to Sell I/L Bonds due 8/15/2030BZ 07/10 11:00 Brazil to Sell I/L Bonds due 8/15/2040
BZ 07/12 10:00 Brazil to Sell Bills due 4/1/2013BZ 07/12 10:00 Brazil to Sell Bills due 7/1/2014BZ 07/12 10:00 Brazil to Sell Bills due 1/1/2016BZ 07/12 10:00 Brazil to Sell Floating-rate Notes due 3/1/2018

Economics
4
Global Views
July 6, 2012
EVENTS
Source: Bloomberg, Scotia Economics.
Events for the week of July 9 - 13
A6
Country Date Time EventUS 07/09 Fed's Evans Speaks in ThailandUS 07/09 Fed's President Speaks on Banking, Financial Crises in BangkokUS 07/09 11:55 Fed's Williams Speaks in Couer d'Alene, Idaho
US 07/10 06:05 Fed's Bullard Speaks on the Eurozone in London
US 07/11 14:00 Fed Releases Minutes from June 19-20 FOMC Meeting
US 07/12 15:40 Fed's Williams Speaks in Portland, Oregon
US 07/13 13:20 Fed's Lockhart Speaks on Economy in Jackson, MS
Country Date Time EventEC 07/08 02:45 ECB's Draghi Speaks in AixGE 07/08 04:30 Hollande, Merkel Commemorate 50 Years of German-French Ties
FR 07/09 04:00 Hollande to Hold Conference on Social, Labor IssuesEC 07/09 08:30 ECB's Draghi Speaks to European Parliament in BrusselsEC 07/09 11:00 Euro-Area Finance Ministers Meet in BrusselsEC 07/09 13:00 ECB's Nowotny Speaks in Brussels
EC 07/10 03:00 EU-27 Finance Ministers Meet in BrusselsGE 07/10 04:00 German Constitutional Court Discusses Motions to Stop ESMIT 07/10 09:00 Bini Smaghi, Padoan, Patuano Speak at Conference in MilanFR 07/10 Hollande to Visit UK PM Cameron in London
EC 07/12 04:00 ECB Publishes July Monthly Report
North America
Europe
Country Date Time EventCL 07/07 Chile Central Bank President Vergara Speaks in Colombia
CL 07/10 08:30 Central Bank Economist Survey
CL 07/11 08:30 Central Bank's Traders SurveyBZ 07/11 SELIC Target - Central Bank
CL 07/12 18:00 Nominal Overnight Rate TargetPE 07/12 19:00 Reference Rate
Country Date Time EventAU 07/10 19:00 RBA's Lowe Gives Speech to Economists' Conference in Melbourne
AU 07/11 20:00 RBA Deputy Governor Lowe Speaks at Conference in SydneySK 07/11 21:00 BoK Base RateJN JUL 11-12 BOJ Target RateID JUL 11-12 Bank Indonesia Reference Rate
Asia Pacific
Latin America

Economics
5
Global Views
July 6, 2012
NORTH AMERICARate Current Rate Next Meeting Scotia's Forecasts Consensus ForecastsBank of Canada – Overnight Target Rate 1.00 July 17, 2012 1.00 --
Federal Reserve – Federal Funds Target Rate 0.25 August 1, 2012 0.25 --
Banco de México – Overnight Rate 4.50 July 20, 2012 4.50 4.50
EUROPERate Current Rate Next Meeting Scotia's Forecasts Consensus ForecastsEuropean Central Bank – Refinancing Rate 0.75 August 2, 2012 0.75 --
Bank of England – Bank Rate 0.50 August 2, 2012 0.50 0.50
Swiss National Bank – Libor Target Rate 0.00 September 13, 2012 0.00 --
Central Bank of Russia – Refinancing Rate 8.00 July 13, 2012 8.00 --
Hungarian National Bank – Base Rate 7.00 July 24, 2012 7.00 7.00
Central Bank of the Republic of Turkey – 1 Wk Repo Rate 5.75 July 19, 2012 5.75 --
Sweden Riksbank – Repo Rate 1.50 September 6, 2012 1.50 --
Norges Bank – Deposit Rate 1.50 August 29, 2012 1.50 --
ASIA PACIFICRate Current Rate Next Meeting Scotia's Forecasts Consensus ForecastsBank of Japan – Target Rate 0.10 July 12, 2012 0.10 --
Reserve Bank of Australia – Cash Target Rate 3.50 August 7, 2012 3.50 3.25
Reserve Bank of New Zealand – Cash Rate 2.50 July 25, 2012 2.50 --
People's Bank of China – Lending Rate 6.00 TBA -- --
Reserve Bank of India – Repo Rate 8.00 July 31, 2012 7.75 --
Bank of Korea – Bank Rate 3.25 July 11, 2012 3.25 3.25
Bank of Thailand – Repo Rate 3.00 July 25, 2012 3.00 --
Bank Indonesia – Reference Interest Rate 5.75 July 12, 2012 5.75 5.75
LATIN AMERICARate Current Rate Next Meeting Scotia's Forecasts Consensus ForecastsBanco Central do Brasil – Selic Rate 8.50 July 11, 2012 8.00 8.00
Banco Central de Chile – Overnight Rate 5.00 July 12, 2012 5.00 5.00
Banco de la República de Colombia – Lending Rate 5.25 July 27, 2012 5.25 --
Banco Central de Reserva del Perú – Reference Rate 4.25 July 12, 2012 4.25 4.25
AFRICARate Current Rate Next Meeting Scotia's Forecasts Consensus ForecastsSouth African Reserve Bank – Repo Rate 5.50 July 19, 2012 5.50 --
Fed: US jobs data continues to disappoint (+80k nonfarm payrolls in June, +77k in May, +68k in April), implying that the full employment aspect of the Fed’s mandate is challenged. The Fed extended its duration maturity program (‘Operation Twist’) during June, and there is a risk that it will add to its outright asset purchases during H2 contingent on a) global developments, and b) the performance of the economy and particularly the jobs market. BoC: Canada’s economic situation has deteriorated since the April Monetary Policy Report was released. Markets are now pricing very slight odds of BoC easing this summer, which we think is rather unlikely barring a global liquidity and funding crisis – a risk that has abated somewhat since the European Summit in late June and by no means our base case. We expect the BoC to revise its growth projections lower in the July MPR (due out on July 18) and to remain on hold at least until mid-2013 with the risks tilted towards a longer hold period as recent changes to housing regulations have provided effective tightening targeting the housing sector.
Russia’s central bank will likely leave the benchmark refinancing rate at 8.00% after the next monetary policy meeting on July 13th. Inflation accelerated in June, from 3.6% y/y to 4.3% (still below the 5%-6% target), on the back of higher food costs and recent ruble depreciation. However, the bank likely won’t risk choking off the domestic economy by raising interest rates at this time, in the face of continued uncertainty over oil prices and global demand. Unless more evidence emerges of an economic overheating, we do not anticipate any monetary tightening until early 2013.
With a sluggish economic performance and the continued protective tone of the authorities, we expect the central bank of Brazil to maintain its loose monetary policy stance and cut the reference rate by 50 basis points to a new record low of 8.0% at the next meeting on July 11. We maintain our view that both the central bank of Peru and the monetary authorities in Chile will leave their reference rates unchanged at 4.25% and 5.0%, respectively. In Peru, inflation continues to hold above the 4.0% y/y mark while economic activity has shown some moderation. In Chile, inflation is trending down but also economic activity has decelerated somewhat. Both central banks have highlighted that lower metal prices, slowing growth in Asian trade partners and European debt concerns remain the main risks to their economies.
Improving economic data in recent weeks indicate that the recovery in Japan has taken hold. Notably, consumer and business sentiment are on the mend and private consumption has gained momentum. However, the Bank of Japan (BoJ) still considers the yen overvalued, and the risk of deflation remains prevalent (the annual inflation rate dropped to 0.2% y/y from 0.4% in May, while the core measure fell 0.1%). We thus consider additional monetary easing by the BoJ likely in the near term, with an augmentation of the asset purchase program to be announced as early as next week. The central bank of Indonesia is expected to maintain the benchmark interest rate at 5.75% next week. Though a jump in food prices pushed the headline inflation rate higher in June (to 4.53% y/y from 4.45%), the central bank sees inflation staying within the target range (3.5%-5.5%) over the medium term, and is currently more concerned with the stability of the rupiah. Bank Indonesia will continue to intervene in the foreign exchange market in order to shield the domestic economy from currency volatility.
Global Central Bank Watch
CENTRAL BANKS
A7
Forecasts at time of publication. Source: Bloomberg, Scotia Economics.
North America
Europe
Asia Pacific
Latin America
Africa

Economics
6
Global Views
July 6, 2012
FORECASTS
A8
Forecasts as at July 6, 2012* 2000-10 2011 2012f 2013f 2000-10 2011 2012f 2013f
Output and Inflation (annual % change) Real GDP Consumer Prices2
World1 3.7 4.0 3.1 3.6
Canada 2.2 2.4 2.0 1.9 2.1 2.9 2.0 2.0 United States 1.8 1.7 2.0 2.1 2.5 3.1 2.0 2.0 Mexico 2.1 4.2 3.7 3.6 4.9 3.8 3.9 4.1
United Kingdom 2.0 0.7 0.2 1.5 2.1 4.2 2.2 3.0 Euro zone 1.4 1.5 -0.7 0.5 2.1 2.7 1.6 1.9
Japan 0.9 -0.7 2.3 1.5 -0.3 -0.2 0.1 0.3 Australia 3.1 2.1 3.1 3.3 3.1 3.1 2.5 2.8 China 9.4 9.3 7.8 8.4 2.3 4.1 4.0 4.4 India 7.6 10.0 6.0 6.5 6.4 7.7 6.5 6.8 Korea 4.6 3.6 3.4 4.2 3.1 4.8 3.3 3.0 Thailand 4.4 5.7 5.0 4.5 2.7 3.5 3.0 2.8
Brazil 3.7 2.7 2.4 4.0 6.6 6.5 5.0 5.5 Chile 4.6 6.1 5.1 5.6 3.4 4.4 3.2 3.1 Peru 5.5 7.0 6.3 6.2 2.4 4.7 3.0 3.0
Central Bank Rates (%, end of period) 12Q1 12Q2f 12Q3f 12Q4f 13Q1f 13Q2f 13Q3f 13Q4f
Bank of Canada 1.00 1.00 1.00 1.00 1.00 1.00 1.25 1.50Federal Reserve 0.25 0.25 0.25 0.25 0.25 0.25 0.25 0.25European Central Bank 1.00 1.00 0.75 0.75 0.75 0.75 0.75 0.75Bank of England 0.50 0.50 0.50 0.50 0.50 0.50 0.50 0.50Swiss National Bank 0.00 0.00 0.00 0.00 0.00 0.00 0.00 0.00Bank of Japan 0.10 0.10 0.10 0.10 0.10 0.10 0.10 0.10Reserve Bank of Australia 3.75 3.50 3.25 3.00 3.00 3.00 3.25 3.50
Exchange Rates (end of period)
Canadian Dollar (USDCAD) 1.00 1.02 1.02 0.99 0.98 0.97 0.97 0.97Canadian Dollar (CADUSD) 1.00 0.98 0.98 1.01 1.02 1.03 1.03 1.03Euro (EURUSD) 1.33 1.27 1.23 1.23 1.22 1.22 1.21 1.21Sterling (GBPUSD) 1.60 1.57 1.59 1.60 1.62 1.63 1.64 1.64Yen (USDJPY) 83 80 81 83 84 85 86 87Australian Dollar (AUDUSD) 1.03 1.02 0.99 1.02 1.04 1.04 1.05 1.05Chinese Yuan (USDCNY) 6.3 6.4 6.3 6.3 6.3 6.2 6.2 6.1Mexican Peso (USDMXN) 12.8 13.4 13.3 13.1 13.2 13.1 13.1 13.3Brazilian Real (USDBRL) 1.83 2.01 1.96 1.95 1.92 1.87 1.88 1.90
Commodities (annual average) 2000-10 2011 2012f 2013f
WTI Oil (US$/bbl) 54 95 90 95Brent Oil (US$/bbl) 52 111 104 104Nymex Natural Gas (US$/mmbtu) 5.81 4.03 2.75 3.00
Copper (US$/lb) 1.93 4.00 3.65 3.45Zinc (US$/lb) 0.75 0.99 0.89 1.02Nickel (US$/lb) 7.36 10.38 8.00 7.80Gold, London PM Fix (US$/oz) 586 1,569 1,665 1,650
Pulp (US$/tonne) 694 977 880 955Newsprint (US$/tonne) 575 640 640 670Lumber (US$/mfbm) 273 255 280 310
1 World GDP for 2000-10 are IMF PPP estimates; 2011-13f are Scotia Economics' estimates based on a 2010 PPP-weighted sample of 38 countries. 2 CPI for Canada and the United States are annual averages. For other countries, CPI are year-end rates.
* See Scotia Economics 'Global Forecast Update' (http://www.gbm.scotiabank.com/English/bns_econ/forecast.pdf) for additional forecasts & commentary.
Brazil
India South Korea Thailand
Chile Peru
Japan
Canada
United States
Mexico
United Kingdom
Australia China
Euro Zone

Economics
7
Global Views
July 6, 2012
ECONOMIC STATISTICS
Source: Bloomberg, Scotia Economics.
Canada 2011 11Q4 12Q1 Latest United States 2011 11Q4 12Q1 Latest Real GDP (annual rates) 2.4 1.9 1.9 Real GDP (annual rates) 1.7 3.0 1.9 Current Acc. Bal. (C$B, ar) -48.4 -38.7 -41.1 Current Acc. Bal. (US$B, ar) -466 -475 -549 Merch. Trade Bal. (C$B, ar) 2.3 14.9 7.9 -4.4 (Apr) Merch. Trade Bal. (US$B, ar) -738 -757 -778 -778 (Apr) Industrial Production 3.5 3.0 1.1 1.4 (Apr) Industrial Production 4.1 4.0 4.0 4.9 (May) Housing Starts (000s) 193 199 206 211 (May) Housing Starts (millions) 0.61 0.68 0.71 0.71 (May) Employment 1.6 1.2 0.9 1.0 (Jun) Employment 1.1 1.3 1.6 1.3 (Jun) Unemployment Rate (%) 7.5 7.5 7.4 7.2 (Jun) Unemployment Rate (%) 9.0 8.7 8.3 8.2 (Jun) Retail Sales 4.1 4.2 4.3 3.4 (Apr) Retail Sales 8.2 7.5 6.4 14.3 (May) Auto Sales (000s) 1588 1603 1701 1603 (Apr) Auto Sales (millions) 12.7 13.4 14.5 14.0 (Jun) CPI 2.9 2.7 2.3 5.1 (May) CPI 3.2 3.3 2.8 5.4 (May) IPPI 4.6 3.9 1.7 -6.3 (May) PPI 6.0 5.4 3.4 8.3 (May) Pre-tax Corp. Profits 15.4 13.7 5.4 Pre-tax Corp. Profits 4.2 9.3 13.9
Mexico Brazil Real GDP 3.9 3.9 4.6 Real GDP 2.5 1.2 0.6 Current Acc. Bal. (US$B, ar) -9.0 -7.5 -0.2 Current Acc. Bal. (US$B, ar) -52.5 -63.2 -48.3 Merch. Trade Bal. (US$B, ar) -1.5 -2.9 7.1 4.4 (May) Merch. Trade Bal. (US$B, ar) 29.8 27.0 9.8 9.7 (Jun) Industrial Production 4.0 3.5 4.4 3.6 (Apr) Industrial Production 0.4 -1.8 -3.5 -3.4 (May) CPI 3.4 3.5 3.9 7.3 (May) CPI 6.8 6.7 6.6 (Jan)
Chile Italy Real GDP 6.0 4.5 5.6 Real GDP 0.5 -0.5 -1.4 Current Acc. Bal. (US$B, ar) 0.0 -5.1 -1.4 Current Acc. Bal. (US$B, ar) -0.07 -0.03 -0.07 -0.02 (Apr) Merch. Trade Bal. (US$B, ar) 10.0 9.4 11.1 -1.8 (May) Merch. Trade Bal. (US$B, ar) -34.2 -8.3 -17.5 -3.2 (Apr) Industrial Production 6.9 2.1 3.9 2.8 (May) Industrial Production 0.2 -3.2 -5.4 -8.8 (Apr) CPI 3.3 4.0 4.1 2.6 (Jun) CPI 2.8 3.3 3.4 6.0 (May)
Germany France Real GDP 3.1 2.0 1.2 Real GDP 1.7 1.2 0.3 Current Acc. Bal. (US$B, ar) 204.1 256.1 215.8 176.7 (Apr) Current Acc. Bal. (US$B, ar) -60.1 -58.2 -53.2 -66.2 (Apr) Merch. Trade Bal. (US$B, ar) 216.2 224.1 223.3 255.4 (Apr) Merch. Trade Bal. (US$B, ar) -51.1 -46.2 -53.0 -50.0 (May) Industrial Production 8.0 3.4 1.0 8.0 (May) Industrial Production 2.4 0.4 -1.5 0.9 (Apr) Unemployment Rate (%) 7.1 6.9 6.8 6.8 (Jun) Unemployment Rate (%) 9.7 9.8 10.0 10.1 (May) CPI 2.3 2.3 2.2 1.7 (Jun) CPI 2.1 2.4 2.3 4.1 (May)
Euro Zone United Kingdom Real GDP 1.5 0.7 -0.1 Real GDP 0.8 0.6 -0.2 Current Acc. Bal. (US$B, ar) -4 183 -37 26 (Apr) Current Acc. Bal. (US$B, ar) -46.5 -40.7 -76.4 Merch. Trade Bal. (US$B, ar) 6.4 76.9 10.1 94.2 (Apr) Merch. Trade Bal. (US$B, ar) -159.8 -152.5 -160.3 -194.1 (Apr) Industrial Production 3.6 -0.1 -1.5 -2.4 (Apr) Industrial Production -1.2 -3.0 -3.0 -1.0 (Apr) Unemployment Rate (%) 10.1 10.5 10.8 11.0 (May) Unemployment Rate (%) 8.1 8.4 8.2 8.2 (Mar) CPI 2.7 2.9 2.7 5.2 (May) CPI 4.5 4.7 3.5 7.2 (May)
Japan Australia Real GDP -0.7 -0.5 2.7 Real GDP 2.1 2.5 4.3 Current Acc. Bal. (US$B, ar) 119.2 48.0 114.5 49.2 (Apr) Current Acc. Bal. (US$B, ar) -33.1 -39.4 -66.0 Merch. Trade Bal. (US$B, ar) -33.4 -75.3 -73.5 -98.9 (May) Merch. Trade Bal. (US$B, ar) 35.7 28.9 1.8 26.9 (May) Industrial Production -2.3 0.0 2.7 -2.0 (May) Industrial Production -1.1 1.3 4.7 Unemployment Rate (%) 4.6 4.5 4.5 4.4 (May) Unemployment Rate (%) 5.1 5.2 5.2 5.1 (May) CPI -0.3 -0.3 0.3 0.0 (May) CPI 3.4 3.1 1.6
China South Korea Real GDP 10.4 8.9 Real GDP 3.6 3.3 2.8 Current Acc. Bal. (US$B, ar) 201.7 Current Acc. Bal. (US$B, ar) 26.5 46.0 10.2 43.3 (May) Merch. Trade Bal. (US$B, ar) 155.0 193.0 3.0 224.4 (May) Merch. Trade Bal. (US$B, ar) 30.8 36.6 5.8 59.5 (Jun) Industrial Production 12.8 12.8 9.3 9.6 (May) Industrial Production 6.9 5.2 2.9 7.8 (May) CPI 4.1 4.1 3.6 3.0 (May) CPI 4.0 4.0 3.0 2.2 (Jun)
All data expressed as year-over-year % change unless otherwise noted.
A9
Mexico
Euro Zone
Canada
Chile
Germany
Japan
China
United States
Brazil
United Kingdom
Australia
Italy
France
South Korea

Economics
8
Global Views
July 6, 2012
FINANCIAL STATISTICS
* Latest observation taken at time of writing. Source: Bloomberg, Scotia Economics.
A10
Interest Rates (%, end of period)
Canada 12Q1 12Q2 Jun/29 Jul/06* United States 12Q1 12Q2 Jun/29 Jul/06*BoC Overnight Rate 1.00 1.00 1.00 1.00 Fed Funds Target Rate 0.25 0.25 0.25 0.25 3-mo. T-bill 0.91 0.88 0.88 0.86 3-mo. T-bill 0.07 0.08 0.08 0.07 10-yr Gov’t Bond 2.11 1.74 1.74 1.68 10-yr Gov’t Bond 2.21 1.64 1.64 1.54 30-yr Gov’t Bond 2.66 2.33 2.33 2.29 30-yr Gov’t Bond 3.34 2.75 2.75 2.66 Prime 3.00 3.00 3.00 3.00 Prime 3.25 3.25 3.25 3.25 FX Reserves (US$B) 69.2 68.5 (May) FX Reserves (US$B) 138.0 137.8 (May)
Germany France 3-mo. Interbank 0.71 0.53 0.53 0.33 3-mo. T-bill 0.07 0.04 0.04 0.02 10-yr Gov’t Bond 1.79 1.58 1.58 1.33 10-yr Gov’t Bond 2.89 2.69 2.69 2.38 FX Reserves (US$B) 67.9 68.3 (May) FX Reserves (US$B) 49.2 49.6 (May)
Euro-Zone United Kingdom Refinancing Rate 1.00 1.00 1.00 0.75 Repo Rate 0.50 0.50 0.50 0.50 Overnight Rate 0.39 0.38 0.38 0.33 3-mo. T-bill 0.37 0.37 0.37 0.37 FX Reserves (US$B) 319.9 322.6 (May) 10-yr Gov’t Bond 2.20 1.73 1.73 1.60
FX Reserves (US$B) 82.4 84.6 (May)
Japan Australia Discount Rate 0.30 0.30 0.30 0.30 Cash Rate 4.25 3.50 3.50 3.50 3-mo. Libor 0.13 0.13 0.13 0.13 10-yr Gov’t Bond 3.98 3.04 3.04 3.09 10-yr Gov’t Bond 0.99 0.84 0.84 0.80 FX Reserves (US$B) 47.7 47.8 (May) FX Reserves (US$B) 1247.8 1239.4 (May)
Exchange Rates (end of period)
USDCAD 1.00 1.02 1.02 1.02 ¥/US$ 82.87 79.79 79.79 79.58CADUSD 1.00 0.98 0.98 0.98 US¢/Australian$ 1.03 1.02 1.02 1.02GBPUSD 1.601 1.571 1.571 1.549 Chinese Yuan/US$ 6.30 6.35 6.35 6.36EURUSD 1.334 1.267 1.267 1.230 South Korean Won/US$ 1133 1145 1145 1138JPYEUR 0.90 0.99 0.99 1.02 Mexican Peso/US$ 12.811 13.361 13.361 13.496USDCHF 0.90 0.95 0.95 0.98 Brazilian Real/US$ 1.827 2.009 2.009 2.039
Equity Markets (index, end of period)
United States (DJIA) 13212 12880 12880 12720 U.K. (FT100) 5768 5571 5571 5662 United States (S&P500) 1408 1362 1362 1353 Germany (Dax) 6947 6416 6416 6431 Canada (S&P/TSX) 12392 11597 11597 11673 France (CAC40) 3424 3197 3197 3181 Mexico (Bolsa) 39521 40200 40200 39954 Japan (Nikkei) 10084 9007 9007 9021 Brazil (Bovespa) 64511 54355 54355 55353 Hong Kong (Hang Seng) 20556 19441 19441 19801 Italy (BCI) 859 761 761 774 South Korea (Composite) 2014 1854 1854 1858
Commodity Prices (end of period)
Pulp (US$/tonne) 890 870 900 900 Copper (US$/lb) 3.85 3.45 3.45 3.45 Newsprint (US$/tonne) 640 640 640 640 Zinc (US$/lb) 0.91 0.84 0.84 0.84 Lumber (US$/mfbm) 261 266 283 288 Gold (US$/oz) 1662.50 1598.50 1598.50 1587.00 WTI Oil (US$/bbl) 103.02 84.96 84.96 84.60 Silver (US$/oz) 32.43 27.08 27.08 27.32 Natural Gas (US$/mmbtu) 2.13 2.82 2.82 2.88 CRB (index) 308.46 284.19 284.19 288.24
Canada
France
Japan Australia
Euro Zone
United States
United Kingdom
Germany

DISCLAIMER Global Views
Emerging Markets Strategy www.gbm.scotiabank.com
TM Trademark of The Bank of Nova Scotia. Used under license, where applicable. Scotiabank, together with “Global Banking and Markets”, is a marketing name for the global corporate and investment banking and capital markets businesses of The Bank of Nova Scotia and certain of its affiliates in the countries where they operate, including Scotia Capital (USA) Inc. The fixed income strategy reports contained herein have been prepared for Institutional Investors by Fixed Income Strategists of Scotia Capital (USA) Inc. (“SCUSA”) and may include contributions by strategists who are employees of affiliates of SCUSA. Fixed Income Strategists are employees of SCUSA’s Fixed Income Credit Sales & Trading Desk and support the trading desk through the preparation of market commentary, including specific trading ideas, and other materials, both written and verbal, which may or may not be made publicly available, and which may or may not be made publicly available at the same time it is made available to the Fixed Income Credit Sales & Trading Desk. Fixed Income Strategists are not research analysts, and this report was not reviewed by the Research Departments of SCUSA. Fixed Income Strategist publications are not research reports and the views expressed by Fixed Income Strategists in this and other reports may differ from the views expressed by other departments, including the Research Department, of SCUSA. The securities laws and regulations and the policies of SCUSA that are applicable to Research Analysts may not be applicable to Fixed Income Strategists. These reports are provided to you for informational purposes only. Prices shown in this publication are indicative and SCUSA is not offering to buy or sell, or soliciting offers to buy or sell any financial instrument. SCUSA may engage in transactions in a manner inconsistent with the views discussed herein. SCUSA may have positions, or be in the process of acquiring or disposing of positions, referred to in this publication. Other than the disclosures related to SCUSA, the information contained in this publication has been obtained from sources that SCUSA knows to be reliable, however we do not represent or warrant that such information is accurate and complete. The views expressed herein are the views of the Fixed Income Strategists of SCUSA and are subject to change, and SCUSA has no obligation to update its opinions or information in this publication. SCUSA and any of its officers, directors and employees, including any persons involved in the preparation or issuance of this document, may from time to time act as managers, co-managers or underwriters of a public offering or act as principals or agents, deal in, own or act as market makers or advisors, brokers or commercial and/or investment bankers in relation to the securities or related derivatives which are the subject of this publication. Neither SCUSA nor any of its officers, directors, partners, employees or affiliates accepts any liability for any direct or consequential loss arising from this publication or its contents. The securities discussed in this publication may not be suitable for all investors. SCUSA recommends that investors independently evaluate each issuer and security discussed in this publication, and consult with any advisors they deem necessary prior to making any investment.
July 6, 2012
DISCLAIMER Global Views
Portfolio Strategy The following analysts certify that (1) the views expressed in this report in connection with securities or issuers they analyze accurately reflect their personal views and (2) no part of their compensation was, is, or will be directly or indirectly, related to the specific recommendations or views expressed by them in this report: Hugo Ste-Marie, and Vincent Delisle This research report was prepared by employees of Scotia Capital Inc. who have the title of Analyst. All pricing of securities in reports is based on the closing price of the securities’ principal marketplace on the night before the publication date, unless otherwise explicitly stated. All Equity Research Analysts report to the Head of Equity Research. The Head of Equity Research reports to the Managing Director, Head of Institutional Equity Sales, Trading and Research, who is not and does not report to the Head of the Investment Banking Department. Scotiabank, Global Banking and Markets has policies that are reasonably designed to prevent or control the sharing of material non-public information across internal information barriers, such as between Investment Banking and Research. The compensation of the research analyst who prepared this report is based on several factors, including but not limited to, the overall profitability of Scotiabank, Global Banking and Markets and the revenues generated from its various departments, including investment banking. Furthermore, the research analyst's compensation is charged as an expense to various Scotiabank, Global Banking and Markets departments, including investment banking. Research Analysts may not receive compensation from the companies they cover. Non-U.S. analysts may not be associated persons of Scotia Capital (USA) Inc. and therefore may not be subject to NASD Rule 2711 restrictions on communications with subject company, public appearances and trading securities held by the analysts. General Disclosures This report has been prepared by analysts who are employed by the Research Department of Scotiabank, Global Banking and Markets. Scotiabank, together with “Global Banking and Markets”, is a marketing name for the global corporate and investment banking and capital markets businesses of The Bank of Nova Scotia and certain of its affiliates in the countries where they operate, including Scotia Capital Inc. All other trademarks are acknowledged as belonging to their respective owners and the display of such trademarks is for informational use only. Scotiabank, Global Banking and Markets Research produces research reports under a single marketing identity referred to as “Globally-branded research” under U.S. rules. This research is produced on a single global research platform with one set of rules which meet the most stringent standards set by regulators in the various jurisdictions in which the research reports are produced. In addition, the analysts who produce the research reports, regardless of location, are subject to one set of policies designed to meet the most stringent rules established by regulators in the various jurisdictions where the research reports are produced. This report is provided to you for informational purposes only. This report is not, and is not to be construed as, an offer to sell or solicitation of an offer to buy any securities and/or commodity futures contracts. The securities mentioned in this report may neither be suitable for all investors nor eligible for sale in some jurisdictions where the report is distributed. The information and opinions contained herein have been compiled or arrived at from sources believed reliable, however, Scotiabank, Global Banking and Markets makes no representation or warranty, express or implied, as to their accuracy or completeness. Scotiabank, Global Banking and Markets has policies designed to make best efforts to ensure that the information contained in this report is current as of the date of this report, unless otherwise specified. Any prices that are stated in this report are for informational purposes only. Scotiabank, Global Banking and Markets makes no representation that any transaction may be or could have been effected at those prices. Any opinions expressed herein are those of the author(s) and are subject to change without notice and may differ or be contrary from the opinions expressed by other departments of Scotiabank, Global Banking and Markets or any of its affiliates. Neither Scotiabank, Global Banking and Markets nor its affiliates accepts any liability whatsoever for any direct or consequential loss arising from any use of this report or its contents.
July 6, 2012

Global Views
Scotia Economics
Scotia Plaza 40 King Street West, 63rd Floor
Toronto, Ontario Canada M5H 1H1
Tel: (416) 866-6253 Fax: (416) 866-2829
Email: [email protected]
For general and publication-related inquiries, contact
us by telephone, email and/or fax.
Scotia Economics
This report has been prepared by Scotia Economics as a resource for the clients of Scotiabank. Opinions, estimates and projections contained herein are our own as of the date hereof and are subject to change without notice. The information and opinions contained herein have been compiled or arrived at from sources believed reliable but no representation or warranty, express or implied, is made as to their accuracy or completeness. Neither Scotiabank nor its affiliates accepts any liability whatsoever for any loss arising from any use of this report or its contents. TM Trademark of The Bank of Nova Scotia. Used under license, where applicable.
DISCLAIMER