u.s. global investors · 2014-05-14 · the us dollar compound annual rates 1971 - 2008-2.70% vs...
TRANSCRIPT

www.usfunds.com1.800.US.FUNDS
U.S. Global InvestorsSearching for Opportunities, Managing Risk
November 201010-702
Post-Election Update How Will the Results Impact the Markets?Ian McAvity,Author, Deliberations on World Markets
Frank Holmes,CEO and Chief Investment Officer,U.S. Global Investors

www.usfunds.comNovember 2010 10-702 22
Fund Recognition
Winner of 26 Lipper Fund Awards and certificates since 2000
Investment leadership results
in performance

www.usfunds.comNovember 2010 10-702 33
Government Policy Model — Precursor for Change

Ian McAvity’s
DELIBERATIONSOn World Markets
Technical analysis & other perspectives on the major world markets for stocks /bonds /currencies /precious metals
Ian McAvity Toronto, Canada
US Global Web cast 3-Nov-10

Confused? You’re not alone…
As confused as a herd of goats on Astroturf ?
Stock Market
Dollar Gold
The following comments are intended to give bigger
picture perspectives on trends, but are NOT intended as trading advice. Consult your own professional advisors
before acting on any ideas expressed here today.

S&P from 1900 Stocks Always Go Up
S&P Composite (Cowles early data)
1900 - 2020
#3
#2
#1
Jun-49
Mar-00
Aug-82
Jan-66
Oct-21
Sep-29
0.500
1.000
1.500
2.000
2.500
3.000
3.500
Jan-
00
Jan-
10
Jan-
20
Jan-
30
Jan-
40
Jan-
50
Jan-
60
Jan-
70
Jan-
80
Jan-
90
Jan-
00
Jan-
10
Jan-
20
Logs of
price
In the long termStocks ‘always’ go up
But sometimes you have to wait up to 20 years…
22-Oct-10

Secular Uptrends from 1900: 38% of the timeS&P Composite Secular Trends
1900 - 2009
0.5000
1.0000
1.5000
2.0000
2.5000
3.0000
3.5000
Jan-
00
Jan-
10
Jan-
20
Jan-
30
Jan-
40
Jan-
50
Jan-
60
Jan-
70
Jan-
80
Jan-
90
Jan-
00
Jan-
10
Jan-
20
1921 / 1929
1949 / 1966
1982 / 2000
Secular UptrendsAverage BEAR Cycle-20% over 34 Weeks
(1949-1966 & 1982-2000)
Logs of
price
"Other" Secular periodsAverage BEAR Cycle-32% over 75 Weeks
(1900/21, 1966/82 & 2000/16?) (Excluding 1929/42)
24-Sep-10

Secular Others from 1900:
62% of the timeS&P Composite"Other"
Secular Phases
62% of the time1900 / 2010
Oct-07
0.000
0.500
1.000
1.500
2.000
2.500
3.000
3.500Ja
n-00
Jan-
10
Jan-
20
Jan-
30
Jan-
40
Jan-
50
Jan-
60
Jan-
70
Jan-
80
Jan-
90
Jan-
00
Jan-
10
Jan-
20
Average BEAR Cycle-32% over 18 Months
(Excluding 1929/32)
Average BEAR Cycle -20% over 7 Months
(1949-1966 & 1982-2000)
Logs of
price22-Oct-10

Political Cycle Gridlock, Nastiness &
a lurch to the right looming?
Politics…Derived from
POLY – meaning MANY&
TICS – Bloodsucking insects

Presidential Election Cycles since 1953
Mid-Term Years (2010) S&P Down 6 of 14 times
Pre-Election Years (2011) S&P Down 0 of 15 times
Q4-10 to Q2-11 are the best 3 quarters of a
Presidents 16 quarter term

Average Qtrly change 1949/2010
31-Mar-09
31-Dec-1031-Mar-11
30-Jun-11
30-Jun-10-4
-2
0
2
4
6
8
10D
ec-0
8M
ar-0
9Ju
n-09
Sep-
09D
ec-0
9M
ar-1
0Ju
n-10
Sep-
10D
ec-1
0M
ar-1
1Ju
n-11
Sep-
11D
ec-1
1M
ar-1
2Ju
n-12
Sep-
12D
ec-1
2
1949 / 2010 Presidential Cycles
Average Quarterly % ChangeS&P 500
31-Mar-10 1.03 Down 9 of 1630-Jun-10 -2.82 Down 9 of 1630-Sep-10 0.06 Down 6 of 1631-Dec-10 7.89 Down 2 of 1531-Mar-11 7.60 Down 1 of 1530-Jun-11 5.63 Down 3 of 1530-Sep-11 2.09 Down 5 of 1531-Dec-11 2.48 Down 5 of 1531-Mar-12 0.68 Down 5 of 15
24 Dn of 48
6 Dn of 45
15 Dn of 45
S&P 500 Quarterly % Change Average over 16 Cycles since 1949
Mid Term & Pre-election Years
Pre-Election YearMost Bullish

This cycle crashed in the bullish period and rallied in the bearish period…
This cycle 2007/10
Oct-07
Feb-09
Apr-10
1952-2007 Average
70
100
130
160
Jan-
07
Jan-
08
Jan-
09
Jan-
10
Jan-
11
Election YearBulish
Pre-Election YearMost Bullish
Mid Term YearMost Bearish
Post Election YearBearish
Average 1980-1999(Blue- Secular Ups)
Average 1964-1983(Green - Secular Others)
Average Presidential
Cycles

SPX Seasonals
+8.8%
-4.7%
+7.9%-5.4%
-8.2%
+1.5%2010 Seasonals have been upside down.
2010 Index % Added
-3.7%
+5.9%
+2.9%
Might thenext 2
becomethe worst?
Chart courtesy of Bianco Research LLC
+3.7%
XX XX XXX
7 of 10 Months = X

HGX IXBK & SPX Topped & failing30-Apr-10
100
1000Se
p-02
Mar
-03
Sep-
03
Mar
-04
Sep-
04M
ar-0
5
Sep-
05M
ar-0
6
Sep-
06M
ar-0
7
Sep-
07
Mar
-08
Sep-
08M
ar-0
9
Sep-
09
Mar
-10
Sep-
10
Mar
-11
Housing Topped July 05
Regional Banks Topped
Dec 06S&P Topped
Oct 07
HGXHousing
Index
IXBKNasdaq
Bank Index
SPXSP 500 Index
29-Oct-10
Weekly Average PricesRebased for visual comparability
A
B
C
D

ABS Issuance Courtesy Jim Bianco Research Chart courtesy of Jim BiancoBianco Research LLC

BKX – 24 Money Center Banks
BKX - BANK Stock Indexwith 40wk MAs
15-Sep-08
14-Jul-08
Feb-07
Oct-07
1.200
1.300
1.400
1.500
1.600
1.700
1.800
1.900
2.000
2.100
2.200D
ec-0
2
Dec
-03
Dec
-04
Dec
-05
Dec
-06
Dec
-07
Dec
-08
Dec
-09
Dec
-10
Dec
-11
(Log
s of
Pric
e)
2.2000
2.3000
2.4000
2.5000
2.6000
2.7000
2.8000
2.9000
3.0000
3.1000
3.2000SPX
SP 500 Index
1-Nov-10
Worrisome DivergenceUnderway
Shades of 2007?

Euro BanksEuro Banks Index SX7P.Z
21-Oct-09
50
100
150
200
250
300
350
400
450
500
550Ju
n-02
Jun-
03
Jun-
04
Jun-
05
Jun-
06
Jun-
07
Jun-
08
Jun-
09
Jun-
10
Jun-
11
Even worse looking?

Visa & MasterCard broke sharply last week
and are well below their April/May
highs ---
Any further weakness might
be an early warning of tapped out
consumers pre-Christmas?

The conflict…
-Case for the Bulls: Powerful seasonal time of year and the
Presidential Election Cycle …
But both have been upside down from their ‘normal’ behavior patterns.
- - - - I’ll remain skeptical, cautious and worry
that Housing & Financials are giving an early warning of downside risks that
may overwhelm the bulls.

The FED weather update

Low Bridge surprise…
Just when you think the worst of it is over, and you see a little light at the end of that tunnel......
How’s your day going so far…Too many bulls in the sunshine?

Forex & Gold Post Bretton WoodsBP, US$, Euro/DM & Yen vs. GOLD
(Logs of Monthly Average)
US$/oz
DM-Euro/oz
BP/oz
Yen/oz
0.500
1.000
1.500
2.000
2.500
3.000
3.500
Jan-
46
Jan-
51
Jan-
56
Jan-
61
Jan-
66
Jan-
71
Jan-
76
Jan-
81
Jan-
86
Jan-
91
Jan-
96
Jan-
01
Jan-
06
Jan-
11
Jan-
16
2.500
3.000
3.500
4.000
4.500
5.000
5.500
1971 / 1980
2001 / 2015?
Fiat Currenciesvs. Gold
Lose value over time(Pre & Post Bretton Woods)
24-Oct-10

Demise of UK Pound as Reserve Currency£4.24
Sep-31
1-Oct-10£827
Jan-80£322.4
July 1864$12.98
Mar-1985$1.06
Sep-49
Aug-14
1.0
10.0
100.0
1000.0
Nov
-00
Nov
-10
Nov
-20
Oct
-30
Oct
-40
Sep-
50
Sep-
60
Sep-
70
Aug
-80
Aug
-90
Jul-0
0
Jul-1
0
Jul-2
0
0.1
1.0
10.0
100.0
British Poundvs. US$
British Poundvs. Gold
British Pound (Wkly Avg)
Long Term DECLINE vs. US$ & Gold
1860 - 2010
$5.20/$3.15 Range
Brown sells UK Gold $275 Avg
$2.05 / $1.35 Range
Ian McAvity’s DELIBERATIONS on World Markets
1860-1900
Post Bretton Woods Aug 1971 to date

Dollar vs DM/Euro 1971 - 2010US$ vs. Euro (DM pre-1999)
with 40wk MA
Nov-051.1667
0.50
0.60
0.70
0.80
0.90
1.00
1.10
1.20
1.30
1.40
1.50
1.60
1.70
Dec
-70
Dec
-72
Dec
-74
Dec
-76
Dec
-78
Dec
-80
Dec
-82
Dec
-84
Dec
-86
Dec
-88
Dec
-90
Dec
-92
Dec
-94
Dec
-96
Dec
-98
Dec
-00
Dec
-02
Dec
-04
Dec
-06
Dec
-08
Dec
-10
Dec
-12
The US DollarCompound annual rates
1971 - 2008-2.70% vs Euro/DM
-3.74% vs Yen
With 30 Year US Treasury yield of 3.74% pre-tax,those long term currency depreciation rates
make you wonder what Japanese buyers are thinking when they buy Long-dated US T-Bonds.
22-Oct-10

Dollar 2000–2010 basing?US Dollar Index (DX)
with 40 wk MA
60
70
80
90
100
110
120
Dec
-99
Dec
-00
Dec
-01
Dec
-02
Dec
-03
Dec
-04
Dec
-05
Dec
-06
Dec
-07
Dec
-08
Dec
-09
Dec
-10
Dec
-11
US$ Bottomingto becomeBLHiGF ?

Gold & Dollar 2000 - 2010Logs of Gold & DX Index (Weekly Average Values)
1.7500
1.8000
1.8500
1.9000
1.9500
2.0000
2.0500
2.1000
Dec
-99
Dec
-00
Dec
-01
Dec
-02
Dec
-03
Dec
-04
Dec
-05
Dec
-06
Dec
-07
Dec
-08
Dec
-09
Dec
-10
2.4000
2.5000
2.6000
2.7000
2.8000
2.9000
3.0000
3.1000
DXY Index BlueGold INVERTED Red
US$ & Gold NOT
Agreeing
US$ & Gold NOT
Agreeing
29-Oct-10
US$ Vs. GoldRising vs. Paperbut not vs. GoldBLHiGF ?

US$ vs. Euro/DM & Yen from 1967The US Dollar Major Declines 1968 - 2010with Intervening Rebounds
US Dollar vs. Yen#4
Apr'95
#3 Dec'87
Oct-00
Mar-85
#2Dec'79
#1Jul'73
#5?Apr'08 (Euro)
Coming soon Yen?1.800
1.900
2.000
2.100
2.200
2.300
2.400
2.500
2.600
2.700D
ec-6
6
Dec
-70
Dec
-74
Dec
-78
Dec
-82
Dec
-86
Dec
-90
Dec
-94
Dec
-98
Dec
-02
Dec
-06
Dec
-10
Dec
-14
Logs of FxRates
US Dollar vs. Euro (DM prev)
22-Oct-10
The US DollarCompound annual rates
1971 - 2008-2.70% vs Euro/DM
-3.74% vs Yen

Currency HistoryModern history of fiat currency
£ s dto
¥ € $No… they make no ¢
How many versions of Pesos, Marks, Francs & Lira
does it take to learn from history?
They all lose purchasing power over time

Zim Inflation $100 Trillion (2008)

From a South African Public Toilet

Copper from 1900Copper from 1900
London - RedNY - Blue(US$/lb)
Mar-58
Mar-56
Apr-46
Dec-08
Jul-08
0.010
0.100
1.000
10.000
Jan-
00
Jan-
10
Jan-
20
Jan-
30
Jan-
40
Jan-
50
Jan-
60
Jan-
70
Jan-
80
Jan-
90
Jan-
00
Jan-
10
Jan-
20
"Secular Uptrend"Copper 1932 to 19744 1/2 cents to $1.50
?
?
1949 - 56 Breakout from a 50 Year Range, gave back 50% in two years before
continuing the new secular uptrend.
2000 - 06 Broke out of a 40 year range
22-Sep-10
A
B

S&P and SP-GSCI-22Sep10SP-GS Commodity Index & The S&P 500with 65 Wk MAs
1.70
1.90
2.10
2.30
2.50
2.70
2.90
3.10
3.30
Dec
-69
Dec
-73
Dec
-77
Dec
-81
Dec
-85
Dec
-89
Dec
-93
Dec
-97
Dec
-01
Dec
-05
Dec
-09
Dec
-13
Running together ?
Retail & Custom products largely based
on 1980 - 2002
Non-corelation history?
SP-GS Commodity Index
Logs
S&P 500 Index
Opposite Harmony
1972 - 1982
23-Sep-10
Non-correlated history

Savings Rate & Debt/GDP Ratio
Debt/GDP Ratio (scale left - red) US Personal Savings Rate (scale right - blue)
DEBT/GDP Ratio
Mar-521.30
3.55
1.65
Mar-696.9%
SAVINGS RATE
Mar-082.7%
Mar-556.4%
Dec-8111.9%
Jun-7512.5%
0.50
1.00
1.50
2.00
2.50
3.00
3.50
4.00D
ec-5
0
Dec
-54
Dec
-58
Dec
-62
Dec
-66
Dec
-70
Dec
-74
Dec
-78
Dec
-82
Dec
-86
Dec
-90
Dec
-94
Dec
-98
Dec
-02
Dec
-06
Dec
-10
Dec
-14
0.0
2.0
4.0
6.0
8.0
10.0
12.0
14.0
1982 to 2007Personal Savings Collapsed
& Debt/GDP exploded
1966 to 1982
1951 - 1981

Savings & S&P from 1959S&P (logs) and US Savings Rate (3 Mo MA)
Jul-10
0
2
4
6
8
10
12
14D
ec-5
8
Dec
-62
Dec
-66
Dec
-70
Dec
-74
Dec
-78
Dec
-82
Dec
-86
Dec
-90
Dec
-94
Dec
-98
Dec
-02
Dec
-06
Dec
-10
Dec
-14
1.500
2.000
2.500
3.000
3.500
1958-86 High SavingsRate
1999-2007NO Savings
1982-1999Stocks & Debt
SoaredSavingsSpent
S&P 500
1966-82
1998-2014?

S&P and Debt/GDP Ratio from 1950S&P 500 (Logs of price, scale left)
US DEBT/GDP Ratio (logs, scale right)
Mar-521.30
2.63Jun-00
DEBT/GDPRatio
---Crazy
2001 to 2009
Mar-093.76
Dec-811.65
1.2000
1.7000
2.2000
2.7000
3.2000D
ec-5
0
Dec
-54
Dec
-58
Dec
-62
Dec
-66
Dec
-70
Dec
-74
Dec
-78
Dec
-82
Dec
-86
Dec
-90
Dec
-94
Dec
-98
Dec
-02
Dec
-06
Dec
-10
Dec
-14
0.1000
0.3000
0.5000
0.7000
1982 to 2001Stocks soared
Personal Savings Collapsed
& Debt/GDP exploded
1966 to 1982
1952 to 1965
S&P 500

Debt / US at Waterfall edge?Chart Courtesy of Bianco Research LLC
Deficits don’t matter ?

Who’s going to bail out Uncle Sam? Hu ?
Foreign Reserves
China* $2,648Russia 458Saudi Arabia 435Taiwan 381South Korea 290Brazil 274India 268Hong Kong 266Singapore* 215Thailand 151
$5,386The Economist
22-Oct-10

DJI & DeflatedDJIA in Nominal & Constant Dollars(Deflated by US CPI All Urban Consumers Index)
(Logs of price levels)
1.000
1.500
2.000
2.500
3.000
3.500
4.000
4.500O
ct-2
8
Oct
-38
Oct
-48
Oct
-58
Oct
-68
Oct
-78
Oct
-88
Oct
-98
Oct
-08
Oct
-18
0.300
0.800
1.300
1.800
2.300
2.800
3.300
3.800
Erosion of purchasing power illustrated by the widening gap between the two regression lines
DJIA in Nominal US$
DJIA in Constant US$based on US CPI
22-Sep-10

Gold Current & Constant$
1.000
1.500
2.000
2.500
3.000
Oct
-28
Oct
-38
Oct
-48
Oct
-58
Oct
-68
Oct
-78
Oct
-88
Oct
-98
Oct
-08
Oct
-18
-0.200
0.300
0.800
1.300
1.800
GOLD in Nominal & Constant US$(Deflated by US CPI All Urban Consumers)
Logs of price
1980 Gold Top in inflation adjusted US$ was $2388
(Sep-10)
Goldin Constant US$based on US CPI
Goldin Nominal US$
based on US CPI
22-Sep-10
Bubble top unlikely without a new high
in nominal & constant $

US Gross Debt & Gold Reserves
US Gross Federal Debt & US Gold Reserves Mar-66 Sep-71 Mar-2010
Mar-2014 Est
US Gross Federal Debt ($ bil) $321 $421 $12,825 $18,350US Gold Reserves (mil oz) 401.9 291.6 261.6 261.6
Valued at: $35.00 $41.22 $1,150 $1,200
Gold value ($ bil) $14 $12 $301 $314
Debt / Gold Reserves Ratio 23 35 43 58
$2,131 $3,050Gold price to revert to 23x
Debt/Gold multiplier
In 1971, US Debt growth prompted a run on US Gold and Nixon closed the gold window. The US Debt/Gold Reserves ratio had
increased 54% from 23x to 35x since 1966.

Gold Now vs. Then
$732May-06
$1436Dec'74
$5479Jan'80
$786Aug'76
100
1000
10000
Dec
-98
Dec
-99
Dec
-00
Dec
-01
Dec
-02
Dec
-03
Dec
-04
Dec
-05
Dec
-06
Dec
-07
Dec
-08
Dec
-09
Dec
-10
Dec
-11
Dec
-12
Dec
-13
Dec
-14
100
1000
10000
Jan 1970 - $34.85 (Wkly Avg)= Apr 2001 $259 (Wkly Avg)
GOLD: "Now vs. Then" The Post-2000 Run
vs 1968-1980
Rebasing Jan. 1970 to Apr. 2001
29-Oct-10$1358
Apr
-201
1 ?
Oct'78DollarCrisis(Low)
May'10EuroCrisis
(UpsideBreakout)

Euro/DM Crisis Oct 1978 and Gold Rush3-Nov-78
0.700
0.800
0.900
1.000
1.100
1.200
Dec
-75
Dec
-76
Dec
-77
Dec
-78
Dec
-79
Dec
-80
Dec
-81
Dec
-82
100
1000
US$ Crisis Swaps & Intervention to stop it
Euro/DMvs. US$
GOLD$243
to $193then up to $850
B
A

Oct’78: US$ intervention bottom – Gold then ran $160 to $850
Logs of Gold & DX Index (Weekly Average Values)
1.8500
1.9000
1.9500
2.0000
2.0500
2.1000
2.1500
2.2000
2.2500
Dec
-76
Dec
-77
Dec
-78
Dec
-79
Dec
-80
Dec
-81
Dec
-82
Dec
-83
Dec
-84
Dec
-85
Dec
-86
Dec
-87
Dec
-88
2.1000
2.2000
2.3000
2.4000
2.5000
2.6000
2.7000
2.8000
2.9000
DXY Index - Blue(scale magnified)
Gold - Red
US$ & Gold NOT Agreeing
US$ & Gold NOT
Agreeing
1978/80Dollar Bottoming
while Gold ran from
$160 to $850

Gold and Interest Rates 1976 - 1982Interest Rates 1976 - 82
2.00
4.00
6.00
8.00
10.00
12.00
14.00
16.00
18.00D
ec-7
5
Dec
-76
Dec
-77
Dec
-78
Dec
-79
Dec
-80
Dec
-81
Dec
-82
100
1000Series1Series2Series4Series6
T-Bills - Green10 Yr US - BlackBaa Bonds - RedGOLD - Blue
Jun'78 to Jun'80
T-Bill Yields above 10 Yr
Both above 9%As Gold
Crosses $400

Gold “still” lousy Barron’s Oct’09
2.800
2.900
3.000
3.100
3.200
3.300
3.400
3.500
3.600D
ec-0
2
Jun-
03
Dec
-03
Jun-
04
Dec
-04
Jun-
05
Dec
-05
Jun-
06
Dec
-06
Jun-
07
Dec
-07
Jun-
08
Dec
-08
Jun-
09
Dec
-09
Jun-
10
Dec
-10
S&P 500 (red) & Comex Gold (blue)Weekly Averages
rebased to Dec 31, 2002Logs of price for visual comparability
29-Oct-10
GOLD
S&P 500
•Deflationary crash •Hyper-inflationary
"Gold Is Still a Lousy Investment!"Barron's Insight - 4-Oct-09
Does "STILL" exclude the past 7 years?

Gold Breakout RunsThe Gold Bull Comex - Logs of Price Weekly
Key Breakout Runs
2.300
2.500
2.700
2.900
3.100
3.300
Dec
-97
Dec
-98
Dec
-99
Dec
-00
Dec
-01
Dec
-02
Dec
-03
Dec
-04
Dec
-05
Dec
-06
Dec
-07
Dec
-08
Dec
-09
Dec
-10
Dec
-11
Logs
of P
rice
A
B
C
D?
Possibilitiesimplied
from B & C?
$1459 ?2-Apr-10
$1584?7-May-10
Didn't happen in terms of time.
29-Oct-10
$300/$328
$428/$454
$726/$732
$1020/$1030
Low DateLow Price High Date
High Price Wks
% Change
2-Aug-02 300 2-Apr-04 433 A 87 45% 300/328 Breakout
15-Jul-05 418 12-May-06 732 B 43 75% 428/454 Breakout
29-Jun-07 641 21-Mar-08 1034 C 38 61% 726/732 Breakout
So far…10-Jul-09 905 15-Oct-10 1388 D 66 53% 1020/1030 Breakout
IF Repeat of A 11-Mar-11 $1,308 87 45%
IF Repeat of B 7-May-10 $1,584 43 75%
IF Repeat of C 2-Apr-10 $1,459 38 61%
The Breakout Runs (Comex price)

50 Day MA vs. 200 Day MA
GOLD50 DMA Below 200 DMA in Red
100
1000
Jun-
80Ju
n-82
Jun-
84Ju
n-86
Jun-
88Ju
n-90
Jun-
92Ju
n-94
Jun-
96Ju
n-98
Jun-
00Ju
n-02
Jun-
04Ju
n-06
Jun-
08Ju
n-10
Jun-
12
100
1000
29-Oct-10
Still on 4th ‘signal’ since 200111-Feb-09 at $944.50
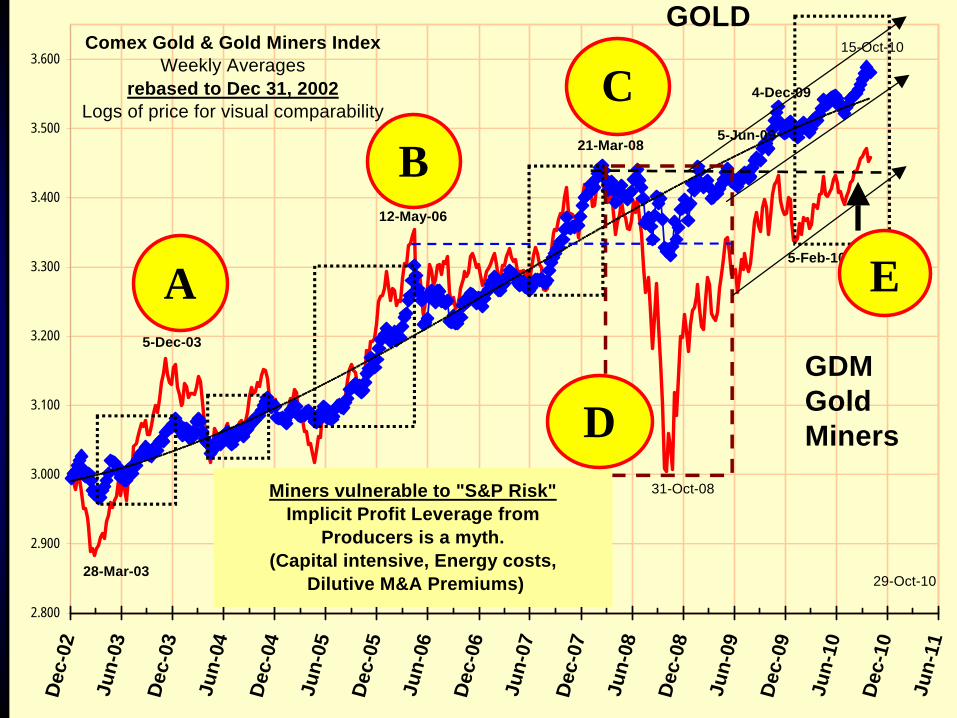
Gold and GDM Gold & GDM from Dec’024-Dec-09
21-Mar-085-Jun-09
15-Oct-10
12-May-06
5-Dec-03
31-Oct-08
5-Feb-10
28-Mar-03
2.800
2.900
3.000
3.100
3.200
3.300
3.400
3.500
3.600D
ec-0
2
Jun-
03
Dec
-03
Jun-
04
Dec
-04
Jun-
05
Dec
-05
Jun-
06
Dec
-06
Jun-
07
Dec
-07
Jun-
08
Dec
-08
Jun-
09
Dec
-09
Jun-
10
Dec
-10
Jun-
11
Comex Gold & Gold Miners Index Weekly Averages
rebased to Dec 31, 2002Logs of price for visual comparability
29-Oct-10
GOLD
Miners vulnerable to "S&P Risk"Implicit Profit Leverage from
Producers is a myth.(Capital intensive, Energy costs,
Dilutive M&A Premiums)
GDMGold MinersD
C
B
A E

Gold and GDM/Gold Sh/Met RatioGold Weekly& GDM Miners/Metal Ratio
Bre-XMay-96
1.500
1.700
1.900
2.100
2.300
2.500
2.700
2.900
3.100
Dec
-67
Dec
-71
Dec
-75
Dec
-79
Dec
-83
Dec
-87
Dec
-91
Dec
-95
Dec
-99
Dec
-03
Dec
-07
Dec
-11
Logs
of P
rice
Leve
l
0.00
0.50
1.00
1.50
2.00
2.50
3.00
3.50
4.00
Gold Miners vs. Metal Ratio
Gold Weekly, logs of rice
with 52wk MA
B
A C

Gold vs Gold Shares from 1934
0.5000
1.0000
1.5000
2.0000
2.5000
3.0000
Dec
-33
Dec
-38
Dec
-43
Dec
-48
Dec
-53
Dec
-58
Dec
-63
Dec
-68
Dec
-73
Dec
-78
Dec
-83
Dec
-88
Dec
-93
Dec
-98
Dec
-03
Dec
-08
Dec
-13
0.000
0.500
1.000
1.500
2.000
2.500
3.000
3.500
4.000
4.500GDM (pre'93 TSEG-US$)
Gold Price PM Fix
Shs Metal Ratio US$
Poly. (Shs Metal Ratio US$)
1986 to 2008Range
1968 to 1980Run
Logsofprice
1-Oct-10
Gold Miners /Metal Ratio(scale right - not log scale)
Gold (blue) & Gold Miners (US$) (red)
from 1934
Shares LaggedMetal
1968 / 80

Gold and GDM/Gold Sh/Met RatioComex Gold (logs of price) & GDM Shares vs. Metal Ratio
1.97601.9996
1.700
1.900
2.100
2.300
2.500
2.700
2.900
3.100Se
p-93
Sep-
94
Sep-
95
Sep-
96
Sep-
97
Sep-
98
Sep-
99
Sep-
00
Sep-
01
Sep-
02
Sep-
03
Sep-
04
Sep-
05
Sep-
06
Sep-
07
Sep-
08
Sep-
09
Sep-
10
Sep-
11
0.60
1.00
1.40
1.80
2.20
2.60
3.00
3.40
Gold Shares Vs. Metal Ratio
(Not semi-log scaled)
Comex Gold Near Active
29-Oct-10
$350
$250
$425
$725
$250
A
DC
B
$1000
D
E
$420
E
$1380
$1200F
F
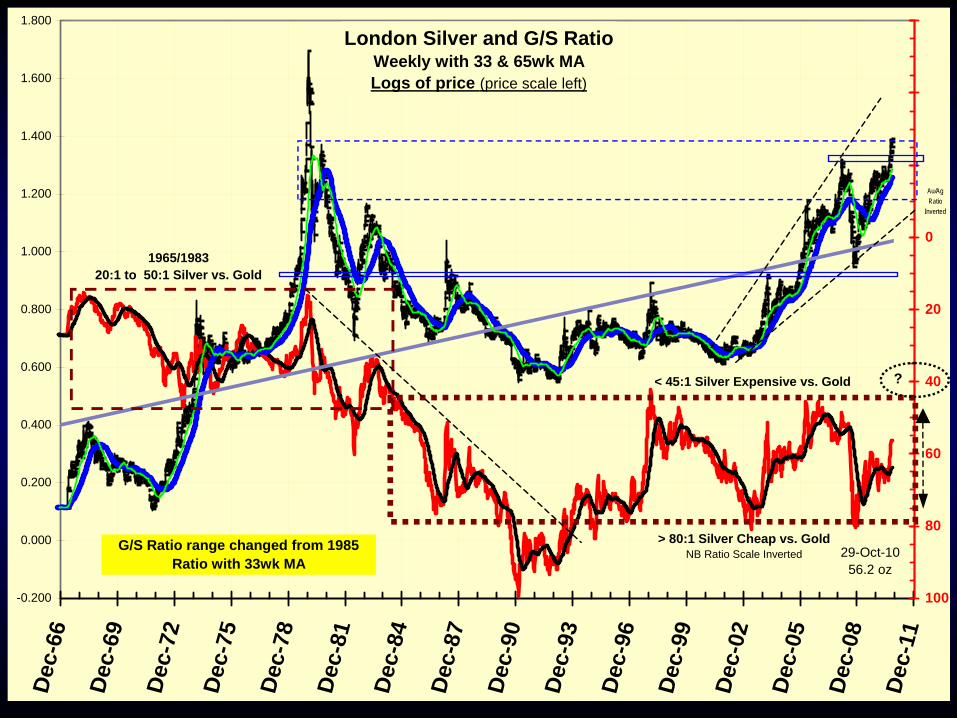
Silver and Ag/Au RatioLondon Silver and G/S Ratio Weekly with 33 & 65wk MALogs of price (price scale left)
-0.200
0.000
0.200
0.400
0.600
0.800
1.000
1.200
1.400
1.600
1.800
Dec
-66
Dec
-69
Dec
-72
Dec
-75
Dec
-78
Dec
-81
Dec
-84
Dec
-87
Dec
-90
Dec
-93
Dec
-96
Dec
-99
Dec
-02
Dec
-05
Dec
-08
Dec
-11
-60
-40
-20
0
20
40
60
80
100
< 45:1 Silver Expensive vs. Gold
> 80:1 Silver Cheap vs. GoldNB Ratio Scale Inverted
1965/1983 20:1 to 50:1 Silver vs. Gold
29-Oct-1056.2 oz
G/S Ratio range changed from 1985Ratio with 33wk MA
?
Au/Ag Ratio
Inverted

Heli Ben at work…

Dow Gold Ratio from 1885DJIA Vs. Gold
from 1885
7.1xMar-09
43.7xSep'99
27.7xFeb'66
18.3xSep'29
Jan'801.0x
Aug'961.0x
Jul'322.0x
1
10
100
Apr
-01
Apr
-09
May
-17
May
-25
May
-33
May
-41
May
-49
May
-57
May
-65
Jun-
73
Jun-
81
Jun-
89
Jun-
97
Jun-
05
Jun-
13
From Jan 1885Weekly
27Oct-108.4 Oz
DJ 11,126Gold $1,324
Median Ratio1968-2009 = 9.8x1900-2009 = 5.5x
2 or3 Oz?

Gold vs. Dow from 1980
Daily DJI / Gold Ratioinverted to trend with Gold
with 200 day MA1980 - 2010
19-Oct-87
7.0 Oz6-Mar-09
1.1 Oz22-Jan-80
16.0 Oz12-May-06
44.64 Oz25 Aug 99
21.1 Oz4-Feb-03
1
10
100
Nov
-79
Nov
-81
Nov
-83
Nov
-85
Nov
-87
Nov
-89
Nov
-91
Nov
-93
Nov
-95
Nov
-97
Nov
-99
Nov
-01
Nov
-03
Nov
-05
Nov
-07
Nov
-09
Nov
-11
The EquityBubble M k t
40
20
6 Oz
8.4 Oz27-Oct-10
2 Oz

Comex Gold Dec

Conclusions - 1
S&P 500 ? Despite this cyclical bullish phase,
I’m nervous about Housing & Financialsdiverging again, and choose to be cautious.
I would put a greater weight on capital preservation…(Bear in mind I’m NOT a short term trader…)
In a big picture sense, I expect to see the March 2009 lows tested
before we see the October 2007 highs again.

Conclusions - 2Gold & Silver:
More to go in this leg, in my view, but we will need a corrective / digestive phase to sustain the orderly trend of the past decade.
A “disorderly run” does lie ahead in my view, and could occur almost any time.
Stick with the secular uptrend if you’re a concerned investor as opposed to a shorter term trader.
Silver & Junior Miners firming up relative to gold tells me we’re getting to the later stages of this leg,
but too many people calling tops…
Silver is becoming poor man’s gold,or gold on steroids… but volatility works both ways…

Conclusions - 3
The Dollar & US Bond Market ?
I suspect foreign holders may flex some muscleon both the US$ and the long end of the bond market.
Great expectations that US$ Index can avoid breaking 70 may get a downside surprise,
and then get ‘that’ rebound…Forget about seeing the old 2000 top around 120,
not likely in my lifetime…
If 30-Year Treasury Bond prices break below 129, that would be a loud warning bell….

30 Yr Bond price (136/129 range?)
A break below 129 could be a bellwether
of a major trend turn

CNBC &
Politics &
Wall Street

Patience My Ass, I’m Going to Kill Something !
‘Opportunity’ rarely
happens at your
convenience
Bad buying causes losses

www.usfunds.comNovember 2010 10-702 64
MFEA Awards-Brand Recognition
64
www.usfunds.comNovember 2010 10-702 6565
Come Visit Us at…
Facebook: www.facebook.com/usfunds
Twitter: www.twitter.com/usfunds
Frank Talk: www.usfunds.com/franktalk
Investor Alert: www.usfunds.com/alert

www.usfunds.comNovember 2010 10-702 66
Disclosures
All opinions expressed and data provided are subject to change without notice. Some of these opinions may not be appropriate to every investor.
The S&P 1500 Composite is a broad-based capitalization-weighted index of 1500 U.S. companies and is comprised of the S&P 400, S&P 500, and the S&P 600. The index was developed with a base value of 100 as of December 30, 1994. The S&P 500 Stock Index is a widely recognized capitalization-weighted index of 500 common stock prices in U.S. companies. The NASDAQ Bank Index is a broad-based capitalization-weighted index of domestic and foreign common stocks of banks that are traded on the Nasdaq National Market System as well as the SmallCap Market. The PHLX Housing Sector Index is a modified capitalization-weighted index currently composed of members whose primary lines of business are construction, development, support and sales relating to the residential housing industry. The KBW Bank Index is a modified capitalization- weighted index consisting of 24 exchange-listed and National Market System stocks, representing national money center banks and leading regional institutions. The index is intended to reflect the evolving financial sector. The STOXX 600 Banks (Price) Index (SX7P) is a capitalization- weighted index which includes European companies that are involved in the bank sector. The U.S. Trade Weighted Dollar Index provides a general indication of the international value of the U.S. dollar. The S&P GSCI Spot index tracks the price of the nearby futures contracts for a basket of commodities. The Dow Jones Industrial Average is a price-weighted average of 30 blue chip stocks that are generally leaders in their industry. The Consumer Price Index (CPI) is one of the most widely recognized price measures for tracking the price of a market basket of goods and services purchased by individuals. The weights of components are based on consumer spending patterns. The NYSE Arca Gold Miners Index (GDM) is a modified market capitalization weighted index comprised of publicly traded companies involved primarily in the mining for gold and silver. The index benchmark value was 500.0 at the close of trading on December 20, 2002. Beta is a measure of the volatility, or systematic risk, of a security or a portfolio in comparison to the market as a whole.
The following securities mentioned in the presentation were held by one or more of U.S. Global Investors’ Funds as of 9/30/2010: Market Vectors Gold Miners ETF, SPDR Gold Shares, Market Vectors Junior Gold Mine ETF, Walmart.
Although Lipper makes reasonable efforts to ensure the accuracy and reliability of the data contained herein, the accuracy is not guaranteed by Lipper. Users acknowledge that they have not relied upon any warranty, condition, guarantee, or representation made by Lipper. Any use of the data for analyzing, managing, or trading financial instruments is at the user's own risk. This is not an offer to buy or sell securities.
66