us epa general principles for performing aggregate ... principles for performing aggregate exposure...
TRANSCRIPT

Fax-On-DemandFax Number: (202) 401-0527Item: 6043
General Principles For Performing Aggregate
Exposure And Risk Assessments
Environmental Protection Agency Office of Pesticide Programs
November 28, 2001

Table of Contents
ACRONYMS . . . . . . . . . . . . . . . . . . . . . . . . . . . . . . . . . . . . . . . . . . . . . . . . . . . . . . . . . 3
EXECUTIVE SUMMARY . . . . . . . . . . . . . . . . . . . . . . . . . . . . . . . . . . . . . . . . . . . . . . . 4
I. Introduction . . . . . . . . . . . . . . . . . . . . . . . . . . . . . . . . . . . . . . . . . . . . . . . . . . . 8A. Legal Background . . . . . . . . . . . . . . . . . . . . . . . . . . . . . . . . . . . . . . . . . 8B. Scope and Organization of Document . . . . . . . . . . . . . . . . . . . . . . . . . . . 9
II. Data Inputs for Aggregate Exposure Assessment and Methods ofAggregation . . . . . . . . . . . . . . . . . . . . . . . . . . . . . . . . . . . . . . . . . . . . . . . . . . 12A. Deterministic vs. Probabilistic Treatment of Data in
Aggregate Exposure Assessments . . . . . . . . . . . . . . . . . . . . . . . . . . . . 14B. Aggregate Exposure and Risk Assessment: Current Practice . . . . . . . 15C. Toxicological Endpoint Selection: Current Practice . . . . . . . . . . . . . . . 16D. Food Exposure Assessments: Current Practice . . . . . . . . . . . . . . . . . . 17E. Drinking Water Exposure Assessments: Current Practice . . . . . . . . . . 19F. Residential Exposure Assessments: Current Practice . . . . . . . . . . . . . 21
III. Framework for Expanded Aggregate Exposure and Risk Assessment . . 24A. Expanded Method of Aggregation and Key
Concepts of Revised Approach . . . . . . . . . . . . . . . . . . . . . . . . . . . . . . . 251. Exposure to the Individual . . . . . . . . . . . . . . . . . . . . . . . . . . . . . 262. Calendar-Based Approach, Exposure Interval,
and Event Correlation . . . . . . . . . . . . . . . . . . . . . . . . . . . . . . . . . 283. Relevant Toxicological Information . . . . . . . . . . . . . . . . . . . . . . . 304. Rolling Time Window of Exposure . . . . . . . . . . . . . . . . . . . . . . . 31
B. Pathway-Specific Considerations Before Aggregation . . . . . . . . . . . . . 341. Food Pathway and Aggregation . . . . . . . . . . . . . . . . . . . . . . . . . 342. Drinking Water Pathway and Aggregation . . . . . . . . . . . . . . . . . 353. Residential Pathway and Aggregation . . . . . . . . . . . . . . . . . . . . 37
IV. Questions To Consider When Conducting Aggregate ExposureAssessment . . . . . . . . . . . . . . . . . . . . . . . . . . . . . . . . . . . . . . . . . . . . . . . . . . 40A. Questions and Issues to Consider when Employing
the Expanded Method of Aggregation . . . . . . . . . . . . . . . . . . . . . . . . . 411. Identify Toxicological Parameters . . . . . . . . . . . . . . . . . . . . . . . . 412. Identify the Potential Exposures Scenarios . . . . . . . . . . . . . . . . 453. Reconcile the Routes and Duration of Potential Exposures . . . . 474. Determine Which of the Possible Residential Exposure Scenarios
Are Likely to Occur Together . . . . . . . . . . . . . . . . . . . . . . . . . . . 485. Determine Magnitude (i.e., Exposure
Concentration), Frequency, and Duration of Exposure . . . . . . . . 48

6. Determine Most Appropriate Technique . . . . . . . . . . . . . . . . . . . 507. Determine the Appropriate Risk Metric . . . . . . . . . . . . . . . . . . . . 518. Conduct Analysis to Determine the Magnitude of
Exposure and Risk for Each Pertinent Exposure Pathway . . . . . 559. Conduct Sensitivity Analysis . . . . . . . . . . . . . . . . . . . . . . . . . . . . 5510. Aggregate Exposure and Risk Characterization . . . . . . . . . . . . . 56
B. Aggregate Assessment Reporting Guidance. . . . . . . . . . . . . . . . . . . . . . . . . . . . . . . . . . . . . . . . . . . . . . . . . . . . . . . 59
V. Future Data and Research Needs . . . . . . . . . . . . . . . . . . . . . . . . . . . . . . . . . 61A. Food Ingestion Pathway . . . . . . . . . . . . . . . . . . . . . . . . . . . . . . . . . . . . 61B. Drinking Water Pathway . . . . . . . . . . . . . . . . . . . . . . . . . . . . . . . . . . . . 62C. Residential Pathway . . . . . . . . . . . . . . . . . . . . . . . . . . . . . . . . . . . . . . . 63
VI. Limitations in Aggregate Exposure and Risk Assessments . . . . . . . . . . . 65A. Food Ingestion Pathway: Limitations . . . . . . . . . . . . . . . . . . . . . . . . . . 67B. Drinking Water Pathway: Limitations . . . . . . . . . . . . . . . . . . . . . . . . . . 67C. Residential Pathway: Limitations . . . . . . . . . . . . . . . . . . . . . . . . . . . . . 68
VII. Validation and Verification of Aggregate Assessment . . . . . . . . . . . . . . . . 70A. Model Evaluation and Enhancement . . . . . . . . . . . . . . . . . . . . . . . . . . . 70B. Biomonitoring . . . . . . . . . . . . . . . . . . . . . . . . . . . . . . . . . . . . . . . . . . . . 71
GLOSSARY . . . . . . . . . . . . . . . . . . . . . . . . . . . . . . . . . . . . . . . . . . . . . . . . . . . . . . . 72
REFERENCES . . . . . . . . . . . . . . . . . . . . . . . . . . . . . . . . . . . . . . . . . . . . . . . . . . . . . . 75
2

ACRONYMS
ai Active IngredientARI Aggregate Risk IndexCSFII Continuing Surveys of Food Intakes by IndividualsDWLOC Drinking Water Level of ComparisonFDA U.S. Food and Drug AdministrationFQPA Food Quality Protection ActFFDCA Federal Food and Drug Cosmetic ActFIFRA Federal Insecticide, Fungicide, and Rodenticide ActGIS Geographic Information SystemHED Health Effects Division, Office of Pesticide Programs, USEPAHHANES Hispanic Health and Nutrition Examination SurveyLCO Lawn Care OperatorMMPE Milk, Meat, Poultry and EggsMRID Master Record Identification MOE Margin of ExposureNASS National Agricultural Statistics ServiceNHAPS National Human Activity Pattern SurveyNHEXAS National Human Exposure Assessment SurveyNHANES National Health and Nutrition Examination SurveyNOAEL No-Observed-Adverse-Effect LevelOPP Office of Pesticide Programs, USEPAORD Office of Research and Development, USEPAPAD Population-Adjusted DosePCO Pest Control OperatorsPDP Pesticide Data ProgramPHED Pesticide Handlers' Exposure DatabaseRfC Reference ConcentrationsRfD Reference DoseRI Risk IndexSAP FIFRA Scientific Advisory PanelSDWA Safe Drinking Water ActSOP Standard Operating ProcedureUF Uncertainty FactorUSDA U.S. Department of AgricultureUSGS U.S. Geological Survey
3

EXECUTIVE SUMMARY
EPA’s Office of Pesticide Programs (OPP) is responsible for regulating pesticide residues in food under the Federal Food, Drug, and Cosmetic Act (FFDCA). In 1996, Congress passed the Food Quality Protection Act (FQPA) which amended FFDCA. The FQPA amendments to the FFDCA directed OPP to consider “aggregate exposure” in its decision-making. Aggregate exposure and risk assessment involve the analysis of exposure to a single chemical by multiple pathways and routes of exposure. The pathways of exposure considered in this general principles document include the potential for pesticide residues in food and drinking water, as well as residues from pesticide use in residential, nonoccupational environments. The pathway of exposure refers to how human behavioral patterns potentially interact with pesticides in the environment. All potential, relevant routes of exposure are analyzed within an aggregate exposure assessment. These include the oral, dermal (absorption), and inhalation routes of exposure. Thus, OPP was required by the FQPA amendments to modify its exposure and risk assessment methods to consider that pesticide chemicals may enter the body through various pathways (through food, drinking water, and residential uses) and routes (ingestion, dermal, and inhalation).
In response to the FQPA mandates to consider aggregate exposure, OPP implemented “HED SOP 97.2 Interim Guidance for Conducting Aggregate Exposure and Risk Assessments (11/26/97),” which is commonly known as the Interim Guidance (USEPA, 1997e), in 1997 for assessing aggregate exposure and risk. This general principles document uses a mix of data as point estimates and data in a distributional form. According to the Interim Guidance, most frequently the "high-end" or “upper-bound” point estimates from the drinking water and residential exposure pathways are added to an estimate of food ingestion exposure from food (for acute exposures, generally the 99.9th percentile on the distribution of daily exposures). The Aggregate General Principles presented in this revised document support a different approach.
These general principles replace the Interim Guidance. They focus on describing principles to guide the way in which aggregate exposure and risk assessment may be performed when more extensive distributional data and more sophisticated exposure assessment, methods and tools are available. The current general principles document discusses the Interim Guidance methods, but emphasizes an expanded approach which looks beyond the Interim Guidance to encompass the use of distributional data for all pathways of exposure when data are available. A distributional data analysis (as opposed to a point estimate approach) is preferred because this tool allows an aggregate exposure assessor to more fully evaluate exposure and resulting risk across the entire population, not just the exposure of a single, high-end individual. The expanded general principles encourage assessment techniques which, using a combination of data, models, and reasonable judgements, represent each potentially exposed “individual” in the population over calendar time. This approach can generate reasonable estimates of risks across a population only if the exposure parameters
4

associated with each hypothetical individual are coherent, consistent, and logical. This means the hypothetical individual’s temporal exposure characteristics, spatial exposure characteristics, and demographic and behavioral exposure characteristics should be consistent and reasonable for each type of individual, for each day in the assessment, over all days in the assessment. The use of distributional data sets which comprise the aggregate exposures to many individuals in the population of interest and the principle that the individual’s aggregate exposure be consistent in temporal, spatial and demographic characteristics are two central components to this expanded aggregate exposure and risk general principles document. Using this approach OPP and others in the risk assessment community can move toward using a distribution of total aggregate exposures to many types of individuals potentially exposed in a population of interest.
A version of the Aggregate General Principles document was presented to the FIFRA Scientific Advisory Panel (SAP) in February of 1999. SAP member comments were incorporated into the general principles document where appropriate. On November 10, 1999 the availability of the draft “Guidance for Performing Aggregate Exposure and Risk Assessments” (commonly known as Aggregate Guidance) was published in the Federal Register (USEPA, 1999b; 64 FR 61343) and public comments were requested on the overall content of the document as well as seven specific questions. Based in part on the comments received, this science policy paper was revised and is now being issued in its revised format. In addition, OPP has prepared a separate Response-to-Comment document which specifically addresses comments received.
OPP anticipates that, as the scientific community conducts aggregate exposure and risk assessments following the principles in this document, new data sets and new models will be developed. It is important that quality and representativeness of any new data sets be evaluated, and that the details of any new models be transparent, including key assumptions. OPP intends to continue its practice of making its preliminary aggregate risk assessments for individual chemicals available for public review and comment and to seek external scientific peer review of significant changes in databases and assessment methodologies. Although this revised document is not being issued for another round of comment, OPP may revise and reissue this document periodically, as needed to update the document to reflect progress in improving aggregate risk assessment methodologies or changes made in response to peer review or public comment.
5

This revised document is organized to present an overview of aggregate exposure and risk assessment highlighting revised and expanded concepts. Section I describes the regulatory background of aggregate assessment, gives a brief introduction to the scope and organization of the document, and provides a review of some of the key terms and definitions in this document. Section II of the document provides a description of current practices and data sources utilized in conducting aggregate exposure analysis, including an explanation of the combination of probabilistic (food pathway only at this time) and deterministic types of exposure assessments. Section III provides a general framework and set of key concepts for the refinements put forth in the Aggregate General Principles. Pathway-specific considerations based upon the revised document are for performing aggregate exposure and risk assessment, expanding upon the Interim Guidance for Conducting Aggregate Exposure and Risk Assessment. Following this section, there are recommendations for future data and research needs (Section V) as well as an acknowledgment of the limitations in conducting aggregate exposure assessments (Section VI). The last section of the document, Section VII, describes approaches to model validation and verification, an important part of evaluating aggregate exposure and risk assessments, as assumptions embedded in any model and/or method and uncertainties and variability in the input data can be significant to the outcome of the assessment.
This general principles document for performing aggregate exposure and risk assessments is not meant to be comprehensive or to be interpreted as a prescriptive approach. Rather it articulates broad principles for consideration in the design of an aggregate risk assessment for a particular pesticide. Other factors, especially the exposure scenarios and the extent and quality of a variable data, will also influence significantly the specific approach. OPP will evaluate any and all methods or models developed to assess aggregate exposure.
The current document is one of a series of documents that OPP is issuing with specific emphasis on addressing new facets of the risk assessment process as required by FQPA. In particular, the current document relies heavily on the Exposure Factors Handbook (USEPA, 1997b); the draft “Standard Operating Procedures (SOPs) for Residential Exposure Assessments” (commonly known as the Draft Residential SOP’s); (USEPA, 1997a); the Interim Guidance (USEPA, 1997e); and “Guidance for Submission of Probabilistic Human Health Exposure Assessments to the Office of Pesticide Programs” (USEPA, 1998c). These earlier documents provide substantial background to the information provided. This science policy paper is intended to provide guidance to EPA personnel and decision-makers, and to the public. As a guidance document and not a rule, the policy in this document is not binding on either EPA or any outside parties. Although this document provides a starting point for EPA risk assessments, EPA will depart from its policy where the facts or circumstances warrant. In such cases, EPA will explain why a different course was taken. Similarly, outside parties remain free to assert that a policy is not appropriate for a specific pesticide or that the circumstances surrounding a specific risk assessment demonstrate that a policy should
6

be abandoned. Finally, EPA expects to update this science policy paper in the future as necessary to reflect significant developments in the scientific approach or policy positions that affect how the Agency performs aggregate risk assessments.
7

I. Introduction A. Legal Background
Pesticides are regulated in the U.S. under both the Federal Insecticide, Fungicide, and Rodenticide Act (FIFRA) and the Federal Food, Drug and Cosmetics Act (FFDCA). In 1996, Congress passed the Food Quality Protection Act (FQPA) which amended both FIFRA and FFDCA. Through these statutes, OPP evaluates risks posed by the use of each pesticide to make a determination of safety.
The FQPA amendments to the FFDCA directed OPP to consider “aggregate exposure” in its decision-making. “Aggregate exposure” refers to the combined exposures to a single chemical across multiple routes (oral, dermal, inhalation) and across multiple pathways (food, drinking water, residential). Prior to the FQPA amendments to FIFRA and FFDCA, OPP generally performed its risk assessments and established the safety of tolerances by examining each pathway separately, i.e., exposures to a pesticide through the food, drinking water, and residential pathways were each assessed independently and no concerted effort was made to evaluate potential exposures through all three pathways simultaneously. As amended by FQPA, Section 408(b)(2)(ii) of FFDCA requires OPP to make a finding for each tolerance or tolerance exemption “that there is a reasonable certainty that no harm will result from aggregate exposure to the pesticide chemical residue, including all anticipated dietary exposures and all other exposures for which there is reliable information.” Section 408(b)(2)(C)(ii)(I) of FFDCA states that the Agency must find “there is a reasonable certainty that no harm will result to infants and children from aggregate exposure to the pesticide chemical residues.” Finally, Section 408(b)(2)(D)(vi) directs OPP, when making tolerance decisions, to consider “aggregate exposure levels...to the pesticide chemical residue...including dietary exposure and exposure from other non-occupational sources.”
8

The FQPA-amended FIFRA also speaks to the requirement that OPP evaluate risks on an aggregate basis. Under FIFRA, OPP may register a pesticide for sale and distribution only if the use of the pesticide will not cause “unreasonable adverse effects on the environment.” The term “unreasonable adverse effects on the environment” means (1) any unreasonable risk to man or the environment, taking into account the economic, social, and environmental costs and benefits of the use of any pesticide; or (2) a human dietary risk from residues that result from a use of a pesticide in or on any food inconsistent with the standard under section 408 of FFDCA (21 U.S.C. 346a.). Thus, the standard for making decisions whether to register or continue registration of a pesticide for food-use must satisfy the standards in the FFDCA.
B. Scope and Organization of Document
Given the above-discussed statutory requirements imposed by FQPA and OPP’s desire to better evaluate exposure and risks of pesticides to the population, OPP has developed the current general principles document for performing aggregate exposure and risk assessment. This document describes the overall framework and the general principles for performing an aggregate exposure and risk assessment. Aggregate exposure and risk assessment involve the analysis of exposure to a single chemical by multiple pathways (e.g., food, drinking water, and residential uses) and routes (ingestion, dermal, and inhalation).
In this general principles document, OPP proposes an approach to assessing aggregate exposure and risk for the total population. This approach relies on characterizing a large, representative group comprised of hypothetical, potentially exposed “individuals,” where an “individual” is represented by a set of data or scientific judgements brought together from a variety of data sources. For example, an assessor may use currently available data sources such as the U.S. Census or the USDA’s Continuing Survey of Food Intake of Individuals (CSFII) (USDA, 1992), which provide characteristics of each survey respondent, e.g., gender, geographic location, time of interview (consumption). This information on an “individual” can be used to match other exposure-related characteristics from other databases or data sources back to the individual, such as probability of application of a pesticide in the home or likelihood of being served by a community water system. As this process of identification and combination of data sources proceeds and is refined, assessors will be able to combine and connect data sets or other reasonable judgements together to represent coordinated descriptions of potentially exposed hypothetical “individuals.”
There are a number of acknowledged limitations to this approach. For example, there is currently a limited amount of data and information concerning
9

residential exposures or standard methodologies for matching characteristics to ensure the assembly of a reasonably-representative population, or collection of “individuals.” The Aggregate General Principles do not fully investigate the data needed to describe the interdependencies and linkages between and among pathways of possible exposure. OPP realizes that the investigation is on-going and that further work in this area will improve and refine aggregate exposure analyses.
It is also important to note that risk assessment and risk management are considered separate activities. Risk assessment involves the determination of the hazard potential, dose-response relationship, exposure potential of pesticides in the environment, and quantitative or qualitative characterization of risk. Risk management relates to the ways in which those risks may be mitigated or eliminated and includes such tools as tolerance revocation, changes to the agricultural or residential use pattern, or the application of requirements that those who apply the pesticide are trained in risk-reducing procedures. The revised and expanded Aggregate General Principles apply only to the risk assessment process, and not to the risk management process. It is important to note, too, that the approach discussed in this document does not support the use of any one particular percentile of exposure in regulatory decision-making, e.g., 95th percentile of exposure. This is considered to be a risk management issue that is informed but not determined by the level of refinement and the quality of the data used in the risk assessment. In any case, OPP will review all data included in an aggregate exposure and risk assessment and determine, on a case-by-case basis, the percentile of exposure to be used in making regulatory decisions for a particular chemical.
OPP acknowledges that exposures to pesticides may also occur from nonpesticidal uses of chemicals, e.g., in household products such as soaps, toothpaste, or paints. However, at this time the tools and methods available to estimate such exposure are extremely limited. OPP will work to develop science policy detailing the way in which aggregate exposure assessment may be performed for -pesticidal uses of a the data needed to make the assessment. At this time, data are limited for exposure estimation, and, therefore, risk assessment for nonpesticidal uses of pesticide chemicals is conducted on a case-by-case basis. Although this paper does not directly address the aggregate assessment of nonpesticidal uses of pesticide chemicals, OPP sees no intrinsic limitations which would prevent the described methodology from being adapted to include exposure from nonpesticidal chemicals in an aggregate exposure assessment.
This document is organized to present an overview of aggregate exposure and risk assessment highlighting revised and expanded concepts. The current section (Section I) describes the legal background of aggregate assessment, gives a brief introduction to the scope and organization of the document. The document also provides a description of current practices and data sources
10

utilized in conducting aggregate exposure analysis (Section II), including an explanation of the combination of probabilistic (food pathway only at this time) and deterministic types of analysis. This section includes a pathway-specific set of comments on important points concerning the current methods for performing aggregate exposure and risk assessment. Section III provides a general framework and set of key concepts for the refinements to aggregate exposure and risk assessment put forth in this general principles document. Pathway-specific considerations based upon these revised general principles are also examined in this section. Section IV presents a standard procedure for performing aggregate exposure and risk assessment, expanding upon the Interim Guidance. Following this section, there are recommendations for future data and research needs (Section V), as well as an acknowledgment of the limitations in conducting aggregate exposure assessments (Section VI). The last section of the document, Section VII, describes approaches to model validation and verification, part of evaluating aggregate exposure risk assessments, as assumptions, uncertainties and variabilities embedded in any model and/or method can be significant to the outcome of the assessment.
This document explains the definition and implementation of aggregate exposure analysis at OPP and expands upon the Interim Approach Paper for the March 1997 FIFRA Scientific Advisory Panel (SAP) (USEPA, 1997c). The pursuit of information, methods, and results of aggregate exposure assessment described in this paper allows OPP to realistically evaluate the potential exposure of individuals and the population to pesticides in the environment. OPP strongly believes that these methods, expanding upon the Interim Guidance for assessing the aggregate exposure will substantially improve the protection of public health, especially infants and children. Nonetheless, this concept document for performing aggregate exposure and risk assessments is not meant to be comprehensive or to be interpreted as a prescriptive approach. OPP will evaluate any and all methods or models developed to assess aggregate exposure. However, the framework, principles, and contents of the steps presented in this document should be considered in any aggregate exposure and risk assessment.
11

II. Data Inputs for Aggregate Exposure Assessmentand Methods of Aggregation Prior to the enactment of FQPA, when performing risk assessments, OPP has
treated exposures to pesticides from different pathways as independent events i.e., OPP only analyzed each individual’s exposure to one pesticide via a single pathway. In reality, however, exposures to pesticides do not occur as single, isolated events, but rather as a series of sequential or concurrent events that may overlap or be linked in time and space. By directing OPP to perform aggregate assessment (single chemical, multiple pathway/routes), Congress intended that OPP’s exposure and risk assessments would move closer to describing the pattern of exposure actually encountered by individuals in the real world.
Since 1996, OPP has taken a number of steps to enhance its risk assessment capacity to respond to the FQPA mandate to consider aggregate exposure and risk in making decisions about the safety of tolerances. In 1997, OPP issued “HED SOP 97.2 Interim Guidance for Conducting Aggregate Exposure and Risk Assessments (11/26/97),” commonly known as the Interim Guidance (USEPA, 1997e). Since then OPP has worked to develop more sophisticated methods of estimating the combined exposure to pesticides by different routes and pathways. This paper explains OPP’s current approach to aggregate risk assessment.
OPP will determine its approach to the assessment of each pesticide’s aggregate exposure and risk on a case-by-case basis. OPP will always start with estimates of exposure by each relevant pathway–food, drinking water, and residential. As necessary to determine whether potential exposures are acceptable, OPP may perform multiple aggregate exposure assessments to refine exposure estimates. To the extent data permit, there are two basic ways to refine an assessment: employ improved data on exposure or conduct more sophisticated analysis of the data.
The initial aggregate risk assessment uses available data (which may be limited in scope), together with assumptions designed to be protective of public health and standard analytical methods, to produce a separate estimate of exposure to a pesticide, for a highly exposed subgroup of the general population, for each potential pathway and route of exposure. Then, as described more fully in the Interim Guidance, OPP calculates potential aggregate exposure and risk by combining point estimates that reflect an upper-bound or high end of exposure for each route / pathway. The assumption implicit in this approach is that individuals could encounter the high end exposures from different pathways at the same time and place. OPP believes, however, that the co-occurrence of high end food, drinking water and residential exposure scenarios will often be impossible or, at best, highly unlikely. For example, infants typically experience higher food and water exposures, while adults applying residential use pesticides account for many of the high end residential exposures. Although temporal and geographic co-occurrence of high food and water residues with
12

residential use patterns involving high exposure is theoretically possible, OPP thinks it is demographically unlikely because infants do not apply pesticides and adults do not have the same food and water consumption patterns as children. In other words, there will be very few, if any people who actually experience the high levels of exposure estimated by simply adding the high end values for each pathway. Thus, using this methodology, OPP is confident that the combined point estimates will overstate, sometimes significantly, the potential exposure that the vast majority of the general population group actually receives. The degree of overestimation decreases, however, as the refinement of the individual pathway exposure estimates improve. The primary advantage of a highly conservative, deterministic assessments is that they require relatively fewer data and analytical resources, and less time to conduct. Often, an aggregate risk assessment of this type is sufficient to demonstrate that proposed and approved pesticide uses are acceptable.
If the initial aggregate exposure assessment suggests that the proposed and approved uses of the pesticide may have unacceptable risks, it may be possible to refine the initial aggregate risk assessment. In the past, OPP’s approach was to refine the estimates of the exposure by one or more of the different pathways; such refinements typically require considerable additional data. For example, OPP might use a point estimate from a Tier3 Food analysis in place of a value taken from a Tier 2 Food assessment. Or, OPP might develop residential exposure estimates using appropriately representative biomonitoring data instead of the values generated by using the Draft Residential SOP’s. In effect, the refinements allow OPP to provide a more accurate aggregate exposure assessment, and the refinements may show that estimated exposure would be acceptable.
Alternatively, OPP could analyze the available data in a different manner, i.e., by using probabilistic techniques to combine exposures by different pathways. In order to combine exposure estimates across pathways using probabilistic techniques, OPP would need the capability of portraying exposure via each pathway as a distribution of potential exposures in the population. This is possible only when OPP has a representative distribution of data for one or more of the critical input values in the pathway exposure assessment, e.g., a database showing the distribution of pesticide residues in surface water or information on the application rate and frequency of use of a residential pesticide.
13

The following subsections present an overview of the methods used to assess exposure to pesticides by different pathways–in food, in drinking water, and from residential use. The ideas presented can be considered to apply to any aggregate exposure and risk assessment, regardless of the level of sophistication of the method of aggregation. Relevant points from the toxicological endpoint selection process are also described since pathways and routes are only aggregated when they share a common toxic effect. This information is presented since it is important to first fully understand the data sources, model capabilities and limitations, and robustness of data available for each of the three pathways of exposure upon which the revised approach expands. As the level of sophistication of aggregation increases, data input types and methods may also be augmented in quality and quantity.
A. Deterministic vs. Probabilistic Treatment of Data in Aggregate Exposure Assessments
Before considering the ways in which aggregate exposure and risk are currently assessed and data inputs are derived, it is important to understand deterministic and probabilistic treatment of data. A deterministic approach uses a point estimate from a data set, e.g., a single maximum value or an average value, to represent an input variable in the exposure model. This approach does not consider the range of potential exposures incurred by members of a population and does not describe the potential or probability of exposure to individuals within a population. Rather, the deterministic approach produces an output value that represents the potential exposure or risk of a group; depending on how the estimate was generated, the output value may reflect a “central tendency,” a “high-end,” or an “upper-bound.” In contrast, a probabilistic approach uses the full range of the data and produces a distribution of values as an output.
Currently, there are three possible combinations of data types in performing an aggregate exposure and risk assessment. First, an assessment could be entirely deterministic, i.e., the level of exposure for each pathway is estimated using the available data to produce point estimates. Second, the three pathways considered in aggregate exposure assessment may include both probabilistic and deterministic assessments of exposure, the former describing exposure as a distribution for a given population, and the latter utilizing point estimates to calculate a single estimate of exposure. Typically, the food exposure pathway for a single day is estimated on a population basis using probabilistic techniques based on distributions of residue and consumption data for specific food items, while exposure by the residential and drinking water pathways are presented as point estimates. Third, all three pathways might be described using probabilistic techniques. Clearly, because all pathways are more fully described, the latter approach provides the assessor with a better sense of the sources of variability and uncertainty in the assessment. In this way, too, an
14

assessor can gain a clearer picture of where additional data would be most useful in further refining risk estimates. On the other hand, the first two approaches generally require fewer data and involve less analytical resources, with the result that assessments may be completed more quickly. Section IV below describes considerations that may be helpful in guiding the choice of the type of analysis of aggregate exposure.
B. Aggregate Exposure and Risk Assessment: Current Practice
In 1997, OPP began conducting its aggregate exposure and risk assessments using procedures outlined in the Interim Guidance (USEPA, 1997e). The Interim Guidance was developed from material presented to the SAP in March 1997. This document described factors to consider when aggregating exposures or risks and methods for using toxicity endpoints in the aggregate risk assessment, among other things. The Interim Guidance is briefly summarized here; however, specific steps are not provided.
The Interim Guidance described five general durations of exposure used for the different pathways under consideration. They were:
˜ acute (relevant for one-day exposure scenarios specific to the food and water pathways, and reflects distribution of daily food consumption and daily water residue values);
˜ short-term (relevant for one- to 30-day exposure scenarios, which assumes average food and average water exposure and combines this with exposures specific to short-term residential pathway);
˜ intermediate-term (relevant for 30- to 180-day exposure scenarios, which assumes average food and average water exposure and combines this with exposures specific to intermediate-term residential pathway);
˜ chronic/long-term (average food and average water exposures combined with relevant residential exposures for aggregate exposures for greater than six months in duration); and
˜ cancer (average food and average water and residential exposures relevant for lifetime assessment) using the Q1* approach.
OPP’s current approach to assessing aggregate risk is in transition, contains many elements of the approach described in section II of this document. The methodology currently used for aggregate risk assessment varies with each
15

specific chemical and depends on the types of use patterns for the pesticide, the extent and quality of data available, and the level of refinement needed for the assessment. In general, OPP’s aggregate assessments incorporate exposures by all pathways–food, water and residential–and consider, as appropriate, multiple time-frames. In addition, to the extent possible, OPP combines the available exposure information using probabilistic techniques.
Under current practice, exposure scenarios which result in negligible exposure may be considered for elimination from the assessment. However, this should be done cautiously because the final exposure which is analyzed in the assessment may be the accumulation of many small exposures from many pathways. Resources might be saved by excluding unimportant exposure scenarios or pathways (e.g., those that do not contribute appreciably to the total exposure) from full probabilistic analyses or from further analyses altogether. This concept is not meant to be used to minimize potential exposures but to conserve resources to investigate those potentially most significant. Unimportant parameters may be excluded from full probabilistic treatment, and for important parameters, empirical distributions or parametric distributions may be used. In all cases however, OPP believes that numerical experiments should be conducted to determine the sensitivity of the output to different parameters and assumptions.
C. Toxicological Endpoint Selection: Current Practice
The proper selection of the hazard endpoint for each route of exposure is essential to the accurate performance of aggregate exposure assessment. In general, an aggregate risk assessment should match the anticipated route of exposure with appropriate toxicity studies performed by the same route. When assessing exposures from food and drinking water, the oral route is of concern and, therefore, an oral toxicity study is appropriate for use in defining the hazard endpoint. When reviewing exposure potential from the residential (nonoccupational) use of a pesticide, exposure may occur by the oral, dermal, or inhalation routes, or by some combination of the three routes. Toxicity studies by these routes would be optimal. Where route-specific data are not available, route-to-route extrapolation may be necessary.
16

In addition to the selection of an appropriate hazard endpoint for each route of exposure (e.g., oral, dermal, inhalation), an aggregate risk assessment should attempt to match the anticipated frequency and duration of exposure with toxicity studies that reflect comparable timing of exposure. For example, if an effect occurs only after several days of chemical dosing (of animals), it would be inappropriate to compare the estimated exposure over a single day with the exposure associated with an effect which requires multiple days to develop. Rather, a sustained period of continued exposure, among other things, would be necessary to indicate that there is a potential for an adverse effect in humans. Similarly, a toxic effect that is established following a single dose or one day’s exposure may prescribe that exposure be evaluated over the time period of a single day. As appropriate the matching of hazard endpoints and exposure patterns will include consideration of available data on pharmacokinetics and internal dose. OPP anticipates that multiple aggregate exposure and risk assessments may be performed per chemical under review based upon different toxicological endpoints evaluated.
D. Food Exposure Assessments: Current Practice
The primary source of food consumption data used in dietary risk assessments is the CSFII. The CSFII is particularly well suited to the conduct of national level dietary risk assessments because it is statistically designed to sample individuals of all ages and major ethnic subgroups to permit a reflection of the appropriate demographics. It is also balanced so that the national estimate of consumption is not biased by seasons of the year or regions of the country. As subsequent surveys are translated into foods as eaten for use in risk assessment, they will be used to update the dietary risk assessment process. OPP’s assessments will incorporate the latest CSFII data (1994-1996) and the Children’s Supplemental survey of 1998 beginning in 2001.
Data on the residues of pesticides in foods are obtained from a variety of sources. Traditionally, the primary source of residue data in foods has been field trial data which must be submitted in support of the registration and reregistration of a pesticide. These data overestimate the residues that are likely to occur in food as actually consumed because they reflect the maximum application rate and shortest preharvest interval allowed by the label. Data that are more reflective of residues on foods as consumed are often available from monitoring data in which food samples are obtained closer to the dinner table in the chain of commerce. These data may come from federally-conducted surveys such as the Pesticide Data Program (PDP) conducted by the U.S. Department of Agriculture (USDA), and the Food and Drug Administration (FDA) Surveillance Monitoring data or from market basket studies that are typically performed by registrants. These data generally provide a better characterization of pesticide residues in or on foods consumed by the U.S. population.
17

Food exposure scenarios are typically evaluated for multiple time-frames: acute (one-day), chronic (several months to several years), and, in the event a pesticide has carcinogenic potential, lifetime exposure. When estimating exposure for both acute and chronic time-frames, OPP uses a series of refinements to reduce conservatism and to better reflect the actual exposure. Advancing through the refinement process requires additional use-related, and other data concerning each commodity. In most cases, refinements may be possible for some proportion of the commodities undergoing evaluation, but not for others. In such cases, deterministic estimates may be made for some food commodities in the assessment and more refined probabilistic assessments using distributional data sets may be used for other commodities and combined with the point estimates from deterministic assessments.
The approach to refining an acute dietary (food only) risk assessments is outlined in a previously released policy document–“Interim Office Policy for Performing Acute Dietary Risk Assessment” (USEPA, 1996). OPP defines Tiers 1 and 2 as using pesticide residue data on foods as point estimates in a deterministic assessment and Tiers 3 and 4 using distributions of pesticide residue data in a probabilistic assessment. A Tier 1 or initial range of refinement for food exposure assessment uses a single, high-end point residue estimate (tolerance) and a distribution of consumption data to provide a single, upper-bound (worst-case) point estimate of acute exposure. Tier 2 is the same as Tier 1, except that it uses a single, average residue data point (point estimate) for commodities which are typically mixed or blended. It provides a more realistic estimation of exposure than Tier 1 by considering average anticipated residues for food forms that are typically widely mixed or blended prior to consumption (e.g., corn oil from field corn). Tier 3 uses a distribution of residue data points (adjusted to include true zero values to reflect the percent of crop which is not treated) as well as a distribution of consumption data points. Tier 4 requires even more extensive data than Tier 3 (e.g., single-serving market basket surveys, cooking studies, etc.), but provides the most representative exposure picture (USEPA, 1996).
18

Chronic food exposure and risk assessments may also be refined to produce better estimates. All Tiers of the chronic assessment produce estimates of dietary (food only) risk which are based on average consumption of foods (which may be categorized by population and age and other subgroups) and average residue concentrations in specific foods. Chronic assessments currently conducted by OPP are deterministic. Tier 1 of a chronic food exposure and risk assessment uses tolerance level estimates of the magnitude of the residue and assumes that 100% of the crop is treated. Tier 2 is the same as a Tier 1 chronic food assessment, but data on the national percent of the crop treated is incorporated into the assessment. Tier 3 uses average residues from field trials or monitoring data, incorporates the percent of the crop which is treated, incorporates commercial processing factors, and uses refined livestock burden and milk, meat, poultry and eggs (MMPE) residue values. A Tier 4 food exposure and risk assessment may use any combination of market basket survey data (as average residue values) and incorporate cooking, residue decline, and residue degradation information, if available.
E. Drinking Water Exposure Assessments: Current Practice
To estimate aggregate exposure to pesticide residues in drinking water, OPP uses the general policy outlined in the “HED SOP 99.5 Updated Interim Guidance for Incorporating Drinking Water Exposure into Aggregate Risk Assessments” (USEPA, 1999a) and updated in the document “Standard Operating Procedure (SOP) for Incorporating Screening-Level Estimates of Drinking Water Exposure into Aggregate Risk Assessments;” draft document (USEPA, 2000a). The registered uses and the potential for a pesticide to contaminate surface and groundwaters are considered initially. If the use pattern and potential to contaminate water resources are such that there is no reasonable likelihood of transport to or contact with surface or groundwaters, OPP concludes the pesticide will not impact drinking water residues, and exposure and risk to the pesticide in water are not included in the aggregate assessment. For example, this would be the case for pesticides exclusively registered as baits or seed treatments and pesticides with import tolerances only.
If a pesticide has any potential to contaminate water resources based on use patterns, OPP uses water quality models to estimate the concentration of the pesticide that could run off into surface water or leach into shallow groundwater. The concentration estimates generated from the models are considered to be upper-bounds on pesticide concentrations in drinking water obtained from surface and groundwater sources. OPP then calculates a DWLOC (Drinking Water Level of Comparison) which is the highest concentration of a pesticide in drinking water that would be acceptable (i.e., produce total exposure equal to the population-adjusted dose or PAD) considering the estimated exposure to that pesticide from other sources (i.e., food and residential use). Separate DWLOCs
19

are calculated for different exposure durations and age groups where warranted, e.g., for acute (one-day), or for chronic (long-term) exposures. OPP compares the model-generated concentration estimates for a pesticide in ground- and surface water to the DWLOC. If the model-estimated concentrations in ground-and surface waters are less than the DWLOC, OPP concludes with reasonable certainty that residues of the pesticide in drinking water from present uses do not contribute towards an aggregate level of exposure that exceeds a risk level of concern.
If the model estimates are greater than OPP’s levels of comparison for drinking water (DWLOC), OPP refines its model estimates using more realistic information/assumptions and compares the refined estimates to levels of comparison for drinking water again ( USEPA, 2000a). If the model estimates still exceed OPP’s levels of comparison (DWLOC) for the pesticide in drinking water, OPP may obtain available water quality monitoring data for the pesticide, and conduct an in-depth review of the data to determine if they are acceptable and reliable for use in quantitative drinking water exposure and risk assessment. Some of the data sources reviewed include: (1) prospective monitoring studies designed to track a pesticide’s movement into surface or groundwater from the point of application; (2) retrospective monitoring studies designed to provide information on general pesticides occurrence (examples include U.S. Geological Service (USGS), National Water Quality Assessment Program (NAWQA) database on ambient surface water and some groundwater), data collected under the Safe Drinking Water Act (SDWA) for approximately 25 pesticides in finished drinking water, data collected under the EPA National Well Survey (1990); and (3) pesticide specific data as collected by registrants (examples include the Acetochlor Registration Partnership, and surveys for atrazine in drinking water).
If the monitoring data are suitable, they may be used to calculate aggregate exposure for use in a human health risk assessment. Average annual and maximum (peak) or high end concentration values (point estimates) from localized monitoring data for the pesticide may be used in deterministic chronic and acute exposure assessments, as appropriate, i.e., usually average values are used in assessments concerned with exposures greater than one day, and maximum or high end values are used in exposure assessments of one day’s duration.
20

If the available water quality models’ estimates are equal to or exceed OPP’s DWLOC, and no appropriate monitoring data are available, OPP considers the entire risk picture for the pesticide and determines the appropriate action. That is, if exposure to the pesticide is above levels of concern from food and residential exposures, and drinking water impacts are indicated to be potentially significant by the model estimates, a risk management decision may include a requirement for monitoring data to assess the pesticide’s presence in drinking water, or various other risk management options. Also, for those pesticides that fail the screening Tiers and require detailed risk assessments, the preferred approach to the dietary (food + drinking water) portion of an aggregate exposure assessment is to combine a probabilistic drinking water exposure assessment with a probabilistic food exposure assessment.
F. Residential Exposure Assessments: Current Practice
Currently, OPP uses the draft “Standard Operating Procedures (SOPs) for Residential Exposure Assessments” (commonly known as the Draft Residential SOP’s) (USEPA, 1997a) as guidance for conducting estimates of residential exposure. These SOP’s identify common (approximately 13) pesticide use patterns/use sites (e.g., treatment of residential lawns, garden plants, etc.) that result in residential exposures. Each of these residential activities/use sites is further divided into handler and postapplication categories. (“Handler” exposures may occur when individuals mix, load, or apply a pesticide; individuals could incur “postapplication” exposure either as bystanders affected by the application of a pesticide or when they enter a treated site.) These are further divided by age group (e.g., adult, toddler, etc.), route (oral, inhalation, dermal), and specific activity (e.g., incidental ingestion of soil, incidental ingestion from hand-to-mouth transfer). As an example, the left-hand side of Figure 1 illustrates these pathways and routes for residential lawns. These SOP’s produce a point estimate of exposure for each assessed scenario.
The basic steps in performing a residential assessment are as follows:
˜ identify formulations, application rates, and sites of application (from labels);
˜ identify method of application;
˜ determine magnitude of exposure by route for the applicator;
˜ identify postapplication exposure scenarios;
˜ determine magnitude of postapplication exposures (accounting for overall residues and dissipation);
21

˜ determine duration of exposure (short-term, intermediate-term, and long-term).
Additional details on the residential analytical methods, assumptions, and default values are described in the Draft Residential SOP’s (1997a). Note that the SOP’s are undergoing revision and will be released in an updated form.
Useful data for residential assessments are available from several sources. Data addressing nondietary exposure have traditionally been required (under the Series 875 Occupational and Residential Exposure Test Guidelines Group A–Applicator Exposure Monitoring Test Guidelines and draft Group B–Post Application Exposure Guidelines) (USEPA, 1998a; USEPA, 1987) when certain toxicity and exposure criteria are met. Acutely toxic compounds in Acute Dermal Toxicity Category I and Acute Toxicity Category II, are triggers for applicator exposure and postapplication exposure monitoring data requirements, respectively. Other adverse effects such as developmental or neurotoxicity are also considered, if results of those studies show adverse effects.
Other sources include proprietary data submitted to the Agency to support residential uses of pesticides, and in a few cases published studies. However, for most nondietary exposure assessments, surrogate data and screening-level (Tier I) assessments presented in the Draft Residential SOP’s (USEPA, 1997a) will be used.
If the estimates of residential exposure in combination with estimates of food exposure exceed the PAD or RfD, OPP determines the appropriate regulatory action. That is, if food and residential exposures are above the level of concern for a pesticide, a risk management decision may include a requirement for additional data and/or various other risk management options to reduce risk to acceptable levels.
22

Residential
Residential Lawns
Garden Plants
Trees
Swimming Pools
Painting and Wood Preservative
Treatments
Fogging
Crack and Crevice and Broadcast
Treatment
Pet Treatment
Detergent/Hand Soap
Impregnated Materials
Termiticides
Rodenticides
Pick Your Own
Refer to Standard Operating Procedures (SOPs) for
Residential Exposure Assessments for Handler and Postapplication
Exposure Scenarios
Drinking Water Food
Exposure and Risk from
Dermal Route
Figure 1. in an Aggregate Exposure and Risk Assessment
Exposure and Risk from
Inhalation Route
Oral Route
Handler Postapplication
Exposure and Risk from
Dermal Route (Adults)
Exposure and Risk from
Inhalation Route (Adults)
Exposure and Risk from
Dermal Route (Adults)
Exposure and Risk from Incidental
Ingestion of Pesticide
Residues from Hand-to-Mouth
Transfer (Toddlers)
Exposure and Risk from Incidental
Ingestion of Soil from Pesticide Treated
Residential Areas
(Toddlers)
Some Pathways and Routes to be Considered
23

III. Framework for Expanded Aggregate Exposureand Risk Assessment The previous section provided a brief overview of the Interim Aggregate
Guidance and illustrated some of the concepts which apply to both the interim and expanded approaches to aggregate risk assessment. This Section III details some of the specific characteristics of the revised (expanded) general principles. This document is meant to provide a framework for future aggregate exposure and risk assessment. Future assessments should be based on assessing exposure to an individual in the population and then assessing exposure to the population (or subpopulation) as a whole. This section describes the key concepts and definitions that are important to understanding the expanded approach to aggregate exposure and risk assessment.
Since pesticides are used in a wide variety of ways in numerous locations, there is no simple approach to describing which exposure scenarios should comprise a group of individual aggregate exposure estimates nor any universal standard for the types and quality of data required for any set of given exposure scenarios. Therefore, exposure analysts are expected to take into appropriate consideration many case-specific pieces of information and employ suitable judgement concerning the use of data in the development of aggregate exposure and risk assessments. Consequently, a specific step-by-step set of instructions is not presented.
While current and revised practices for performing aggregate exposure and risk assessment use the same data sources and inputs, the same data quality standards, and the same pathways of aggregation (food, drinking water, and residential), these general principles describe new ways to frame the data and to combine data from existing sources. Generally, OPP envisions that the aggregate exposure assessment process begins with the identification of the toxicological endpoint(s) of concern for a particular chemical assessment; proceeds toward the identification of possible exposure scenarios (e.g., based upon label use patterns) and assigns certain toxicological endpoints for each route of exposure of concern in the aggregate assessment; and, finally, defines a series of hypothetical, potentially exposed “individuals” by bringing together data sets or a series of professional judgements relating to the aggregate exposure assessment under consideration (toxicological endpoint, duration of exposure, exposure scenario). This is done by appropriately combining information about a potentially exposed “individual’s” demographic (e.g., age, gender, and racial/ethnic background), temporal (season), and spatial (region of the country) characteristics throughout the analysis in a manner which maintains the consistency of the individual. In this way, the analysis is not limited to individuals with only certain predefined characteristics, but rather utilizes data representing the entire distribution of possibly exposed “individuals” to develop not only the “average”or the “high-end” exposure value (“individual” as a point in time and space), but the entire distribution for evaluation. It is important to note that neither the current, interim practices for performing aggregate
24

exposure and risk assessment, nor the revised and expanded approach discussed in this document suggest the use of any one particular percentile of aggregate exposure for use in regulatory decision-making, e.g., 95th percentile of exposure. OPP will review all data included in an aggregate exposure and risk assessment and determine, on a case-by-case basis, the percentile of exposure to be used in making regulatory decisions for a particular chemical.
A. Expanded Method of Aggregation and Key Concepts of Revised Approach
The revised approach to aggregate exposure and risk assessment focuses on the potential exposure to a single chemical by multiple routes to individuals in a population. A fundamental difference between the current and revised approach to aggregate exposure assessment is the principle that exposure occurs to each individual in the population, individual by individual, and that significant variation or differences among individuals based on exposure-related characteristics such as age, gender, and geographic location should be captured in an aggregate assessment. The expanded approach will consider consistent spatial, temporal, and demographic/behavioral factors as well as linkages among product uses and overlapping exposures in developing a population-based distribution of individual exposures. By probabilistically considering these exposures on an individual-by-individual basis, combining these exposures into a population-based distribution, and examining exposures to individuals on a collective basis, the risk assessor is able to provide the risk manager with more realistic information on the distribution of exposures in the total population and the characteristics of and reasons behind any high-end exposure estimates.
Under this new, expanded approach, aggregate exposure assessment is performed by identifying a series of scenarios which are defined in part by a series of characteristics of time, space, activity pattern that also describe a subgroup of the general population who will experience exposure to a pesticide. These exposure scenarios should correspond to the exposure durations deemed to be of significance in light of the toxicity data available for the pesticide. The identification of realistic individual-focused exposure scenarios helps prospectively to define populations of concern, and provide critical windows within time-frames and routes of exposure that will be linked to toxicity endpoints. By focusing on the individual and then the population (or subpopulation) of individuals, an assessor builds the aggregate analysis which considers jointly the multitude of temporal-spatial, demographic, and other factors that, together, determine the exposure profiles of individuals, both singly and collectively.
1. Exposure to the Individual
25

The basic concept underlying aggregate exposure assessments is that exposure occurs on an individual-by-individual basis. Since an individual may only be in one place at a time and engage in only one series of behaviors at a time, the revised approach recognizes that estimates of an individual’s exposure should reflect consistent spatial, temporal, and behavioral and demographic characteristics. As such, the revised approach should better ensure that exposures agree in temporal, spatial and demographic characteristics, and should avoid creating an exposure situation which makes little logical or practical sense. The revised approach recognizes that exposures to an individual in a population: (1) may occur by more than one route (i.e., oral, dermal and/or inhalation); (2) may originate from more than one source and/or pathway (i.e., food, drinking water, and residential); (3) may occur within a time- frame that corresponds to the period of exposure required in an appropriately designed toxicity study to elicit an adverse toxicological effect; (4) should occur at a spatially relevant set of locations that correspond to an individual’s potential exposure; and (5) should be consistent with the individual’s demographic and behavioral attributes.
It is important that the consistency of the data concerning the hypothetically exposed individual be maintained throughout the aggregate exposure assessment within the limitations deemed necessary by the risk assessor. The aggregate intake values should reflect, to the extent useful to characterize significant variability, the food, drinking water, and residential exposure estimates for the same hypothetical individual at the same time, in the same place, and using the same demographic and behavioral characteristics. The exposures assigned to an individual should be internally consistent and appropriately reflect the dependencies and linkages that are inherent under different temporal and spatial exposure scenarios. In other words, when useful to characterize significant differences in potential exposure, the aggregation should be simultaneously temporally, spatially, and demographically specific, i.e., characteristics of the hypothetical individual should agree in time, place, and demographic and behavior factors (ILSI, 1998a). By “individual” OPP is referring to a consistent set of characteristics, based in data and realistic judgements which reflect potential aggregate exposure for each type of person, over time. This concept is illustrated in the matrix in Figure 2 which shows examples of various dimensions which should be considered in developing a hypothetical individual for aggregate exposure modeling purposes.
In assessing aggregate exposure, each of the individual “sub-assessments” should be linked back to the same hypothetical individual. In other words, each of the “sub-assessments” investigating the food, drinking water and residential pathways of exposure must apply to the
26

same “individual” and it is these individual-based “sub-assessments” which are subsequently aggregated into a population-based aggregate exposure assessment. As such, aggregate exposure estimates should provide a description of the distributional exposures received by individuals across the U.S. population from all potential pathways.
It is important to note the “individuals” are not selected or chosen using some criteria or scheme under this new, expanded approach, but rather the “individual” is seen as the modeling basis from which to begin the aggregate exposure assessment. Thus, when using the phrase “calculated on an ‘individual-by-individual’ basis” when referring to exposures, OPP does not mean to perform calculations for specific, identified, real individuals. Rather, OPP means to develop estimates of exposure for “hypothetical individuals” each of whom represent a realistic member of the U.S. population. The attributes of hypothetical individuals that are considered in the revised document are summarized in Figure 2. OPP generally does not support selecting only certain subsets of individuals, either the most highly exposed or the average individual, but instead seeks to utilize all available data to assess aggregate exposure to the total population. By combining data sources and using reasonable professional judgement, OPP intends to prepare enough individual assessments that the collective group, in total, will provide a reasonably accurate characterization of the distribution of exposure across the entire exposed population.
27

Figure 2. Exposure to an Individual in the Population Example(s) of Individual
Characteristics Dimension Correlation for an Individual in the Population
<Person’s Age
<Season of the Year Temporal
<Age correlates with body weight/height, consumption pattern (record), inhalation rate
<drinking water consumption and residential pesticide application pattern consistent with season of year
<Location and type of home (urban area, region of country) Spatial
<drinking water estimates consistent with region of country (rural or municipal water supply)
< residential pesticide usage likely for region of country
<Gender
Demographic
<reproductive status consistent with age
<personal preferences, behaviors, and characteristics consistent with data on home pesticide usage and type of home
Individual Example. A hypothetical individual who is part of a population of concern in an aggregate exposure and risk assessment might be a one-year old female, in New England, during the winter, in a rural location without municipal water (on rural well water), whose food consumption is selected from the range of records for the age one-year old, and who encounters residential pesticide use (exposure) consistent with a rural, New England location in the winter. She does not apply home pesticides, but may come in contact with pesticides by crawling on the floor. Body weight, height, surface area, inhalation and other biological determinants are consistent for a one-year old.
2. Calendar-Based Approach, Exposure Interval, and Event Correlation
In developing a detailed exposure assessment to individuals in a population for a single chemical with a variety of use patterns, the assessment ideally should estimate the daily exposure of an individual to the exposure from each source on any given day. A calendar-based approach provides the ability to estimate daily exposures over time (and from multiple sources) to an individual on an individual by individual basis and is in keeping with a basic tenet of aggregate risk assessment that exposures, when aggregated, be consistent and realistic. Importantly, this approach permits the inclusion of exposures due to the presence of residual pesticides from applications on previous days. Carryover is particularly important in the evaluation of pesticides used in and around residences and similar sites. Residential application of a pesticide may occur on a single day, but exposures may continue for several days following application as the product degrades in the residential environment. Each succeeding day following application is anticipated to result in a decreased exposure until the level returns to pretreatment event levels. Multi-day exposures of this type can be reflected in a calendar-
28

based model in the form of decay curves which model the decline in pesticides residues on the initial day over the next several days of the modeled year. For example, if a homeowner uses an indoor fogger on one day to treat a roach problem, the inhabitants may also receive exposures on subsequent days as the pesticide is distributed in the house. As the pesticide decays with time, subsequent exposures (on subsequent days) from this application would decline as well, but a calender-based approach does not preclude a second or subsequent applications from subsequently occurring and “adding to” exposures from previous applications.
In addition, an adequate calendar-based assessment should appropriately incorporate linkages or correlations/associations (which can be either positive or negative) between exposure scenarios. For example, in some cases the use of one product may affect the likelihood of using another product. This might be true with respect to products used for flea control: an indoor fogger, lawn care product, and a flea product for a pet might be more likely to be used simultaneously by a homeowner performing an integrated treatment for fleas. In other cases, the products may serve essentially the same purpose, such that the use of one will almost certainly preclude the use of the other. In the same vein, if a homeowner uses an indoor fogger on one day, he or she is unlikely to use a fogger on the following day.
In addition to linkages in time, linkages can be extended to spatial aspects as well. For example, places of residence can be linked or otherwise correlated to a type of water source. It is much more likely, for example, that a residence located in a rural site in the Midwest will have a private well as a source of the household water supply than a residence in an urban location in the Northeast. In this case, the location of the residence can be linked through the use of existing data with the source of the water supply to appropriately incorporate real-world situations and ensure that unrealistic or unlikely combinations are appropriately discounted.
29

Finally, a calender based approach can allow the risk assessment to correlate exposure with a toxicologically relevant period of the exposed individual’s life span. Occasionally, toxicology studies may identify a toxic effect that uniquely affects one gender or people in a specific age range. The calendar-based system allows the risk assessor to focus and evaluate on the differences in exposures that occur at any critical life stages. Various computer software programs have been or are being developed which incorporates a calender based approach to estimating aggregate exposures including CalendexTM , LifeLineTM, and CARESTM. The developers of the first two programs have presented their programs for review by the SAP (USEPA, 2000f; USEPA, 2001). These models use a variety of data including generic data, chemical specific information, and default assumptions as necessary.
3. Relevant Toxicological Information
One critical concept which is described in both the Interim Aggregate Guidance and this revised document is the relationship between the scope of an aggregate exposure assessment and the toxicity profile of a pesticide. First, it is important that an individual’s exposure be matched with relevant toxicological doses in terms of route, duration, and effect. Moreover, it is appropriate to combine exposures occurring by different pathways/routes only when the toxicological endpoints for the pathways/routes are related with respect to target organ and nature of adverse effect.
Toxicological endpoints must be matched with an appropriate exposure duration to perform an aggregate risk analysis. Exposure scenarios without associated, measured toxicological endpoints can be included in an aggregate assessment through use of extrapolation methods which have been reviewed and approved by the Agency (i.e., route-to-route extrapolation). The mode of action of the toxicological effect must be the same across routes of exposure for this to be legitimately performed. In some cases, however, the toxic effects are markedly different by one route and duration from those produced by a different route and duration. To produce an aggregate risk estimate in situations in which it is NOT appropriate to aggregate exposures due to differing toxicological effects, risk measures should be calculated separately for each route and duration for a given toxic effect for each hypothetical “individual,” and then combined to characterize the distribution of exposure for the total population. In these situations, multiple aggregate assessments may be performed for a single chemical of interest if the relevant toxicological endpoints for all routes/pathways are not the same. When that is the case, a separate aggregate assessment is then performed for each toxic effect of concern.
30

4. Rolling Time Window of Exposure
The calendar-based approach discussed in III.B.2. provides new avenues for incorporation of toxicological data by permitting the use of “rolling time-frames” of varying length to examine the entire spectrum of likely exposures for periods of exposure that exceed the safe level for the appropriate toxicity endpoint. The “rolling time-frame” of exposure refers to a technique for calculating a series of sequential calendar-based averages which attempts to better reflect the dosing regimes used to determine the toxicological estimates. For example, if the toxicologically relevant duration of exposure is a week, the initial value for a seven-day rolling average would include exposure values from January 1 through January 7, and the 2nd set of values would include exposure values for January 2nd through January 8th, etc. Each of the 365-available rolling seven-day periods for the year would be examined by moving the start date by one day on each pass. A calendar-based rolling average provides OPP with a much more realistic representation of exposure over time and with greater flexibility in matching the human exposure duration with a toxicological effects from animal studies. For example, in the case of a toxicity study that measures effects following a seven-day dosing period, it could be appropriate to consider exposure expressed on a “seven-day rolling time-frame” basis.
The use of a rolling time-frame approach will allow for more detailed use of toxicological data than today’s methods and better incorporates the time-frame associated with the dosing which produces a toxic effect. OPP currently selects multiple toxicological endpoints for pesticides to reflect a variety of time-frames (acute and chronic for the food pathway and short- term, intermediate-term, and long-term for the residential pathway) and routes of exposure (oral, dermal, and inhalation). The use of a rolling time-frame approach is expected to make it less necessary for the time-frames of the exposure assessments to be “force-fit” into the time-frames associated with the dosing during the toxicological studies on which the risk assessments are based. With the advent of the new, revised aggregate exposure and risk assessment methods described in the Aggregate General Principles, a series of short-term exposures could be matched with a developmental or reproductive effect which may occur only during critical periods because aggregate exposure and risk assessment includes use of a rolling time window of exposure.
When an aggregate assessment is conducted using a calendar-based approach, the results of the assessment can be considered in a manner similar to Figure 3 which demonstrates the relationship between duration of exposure and toxicology endpoint for three pathway-specific exposure distributions (food, drinking water, and residential) and the total
31

exposure distribution when an acute endpoint is selected. Here, the magnitude of daily exposures indicated on the y-axis and time is plotted on the x-axis. In these examples, the potential for an exposure value which exceeds the PAD is determined by comparing the magnitude of daily exposure to a toxicological endpoint such as an acute or short-term PAD, depending upon the toxicological data available for a chemical. Determination of which endpoint should be used for comparison is based upon the duration and route of the exposure.
Investigating these exposure profiles in detail, the noticeable “spike” in the second and fourth graph can reflect a change in drinking water exposure. In these graphs, there is an increased exposure to the compound of interest, but the increase persists for only one or two days. The appropriate comparison would be to the acute PAD which is exceeded in both the second and fourth graphs in Figure 3. Comparison to the short-term endpoint would be inappropriate because the duration of the increased exposure relative to background exposure is of insufficient duration according to the definition of short-term exposure. The opposite case occurs in the Residential Exposure example, the third graph in Figure 3. Here, the increased exposure occurs for several days in a row, during which time the short-term PAD is exceeded. Comparison to the acute PAD would be not be appropriate in this case according to the definition of acute exposure which is one day or less. The final graph is an illustration of the possible results from an aggregate assessment combining all three pathways of exposure. Here, the proximate relationship between the two episodic exposures and the overlayering of the background food exposure means that a number of time-based toxicological criteria (e.g., acute PAD, short-term margin of exposure or MOE) can be calculated. In this case, a potential concern for acute exposure exists from drinking water exposure (during which time the acute PAD is clearly exceeded). The concern for the short-term exposure from the residential scenario also remains.
32

Figure 3. Pathway-specific and Combined Exposure
Expo
sure
(mg/
kg)
Expo
sure
(mg/
kg)
Expo
sure
(mg/
kg)
Expo
sure
(mg/
kg)
A.
Short-term toxicity endpoint
Acute toxicity endpoint
Food Exposure
Time (Days)
B.
Short-term toxicity endpoint
Acute toxicity endpoint
Exposure Drinking Water
Time (Days)
C.
Short-term toxicity endpoint
Acute toxicity endpoint
Residential Exposure
Time (Days)
D.
Short-term toxicity endpoint
Acute toxicity endpoint
Total Exposure
Time (Days)
33

However, an added complexity is introduced in this example of aggregate scenarios because a constant exposure to the compound continues in the time interval between the two episodic exposures. This intervening exposure represents the combination of the background food and water exposures and is roughly half the short-term PAD. The short- term PAD is clearly exceeded during the period of elevated drinking water exposure. If the short-term effect of concern is not clearly reversible within the one day between the drinking water exposure and the introduction of the residential exposure, this entire series of exposures would be treated as a single, continuous exposure for the purposes of risk assessment. If the effect of concern is reversible within the one-day time-frame, the exposures can be treated as discrete events. Through aggregate exposure assessment techniques, an assessor may be able to examine in more detail the relationship between the duration of exposure to an individual in a population and the toxicologically significant exposure duration in which an adverse effect may occur. This helps to create a more realistic sense of exposure to individuals in a population.
B. Pathway-Specific Considerations Before Aggregation
This section describes pathway-specific issues and issues for consideration when performing aggregate exposure and risk assessment for individuals in a total population. There are a number of specific issues to consider when performing the pathway-specific analysis prior to aggregation which are described in additional detail below.
1. Food Pathway and Aggregation
Aggregate exposure scenarios often are developed beginning with the food exposure pathway. Aggregate analysis should be performed on an individual basis in order to maintain the linkages and associations between consumption data and demographic data. Food consumption data files provide very extensive demographic information including region of residence, season, and socioeconomic status of the consumption survey respondents. This information assures that, by starting with the survey respondents in the CSFII, the risk assessor has a hypothetical population that is representative of the U.S. population. In addition, the demographic data may also be useful in defining likely related residential and drinking water exposure scenarios. Similarly, pesticide use and usage data may be characteristic of or otherwise related to region of residence, and knowledge of characteristic differences related to region may permit development of more refined and focused individual-based aggregate risk assessments. Regional factors will also be important in selecting the appropriate drinking water data for use in the assessment. Finally, OPP notes that starting with the food pathway in developing an aggregate to assessment does not mean that it is the most significant
34

contributor to overall risk. Therefore it is important to consider other pathways–water and residential–that may be more significant.
2. Drinking Water Pathway and Aggregation
Specific issues in aggregating potential exposure to pesticides through drinking water also include spatial, temporal, and treatment-related considerations. The concentration of pesticides in drinking water, and thus exposure, is usually a local or regional phenomenon driven by pesticide use patterns and local hydrologic and climatological conditions. Accordingly, it cannot be assumed that exposure to a pesticide in one location of the country will be the same for other locations, and drinking water exposures to pesticides to individuals in a population should be incorporated into aggregate exposure assessments on a localized basis. This step can be accomplished using distinct data sets collected in light of specific pesticide use patterns, when available. However, local data sets are applicable only for that locale, i.e., drinking water concentrations of products used in the corn belt would not be assumed for all individuals across the entire country, but only for individuals who may potentially be exposed in that locale. Also, pesticide impacts on drinking water are often seasonal in nature and are driven by time of application and the weather conditions present shortly after application. Therefore, temporal variation in pesticide concentrations in drinking water should be considered in any individual-based, aggregate exposure assessment for drinking water. The impact of treatment in whatever form (sedimentation, flocculation, chlorination, filtering through granular or powdered activated carbon, etc.) should be considered in any drinking water exposure assessment, where data are available. Municipal drinking water facilities across the nation use a variety of treatment processes in delivering tap water to the public. OPP will publish a policy document discussing the effects of treatment on water concentrations of pesticides in fall of 2001. Drinking water obtained from private wells can be assumed to be mostly untreated.
Exposures of individuals to pesticide residues in drinking water should be incorporated into exposure assessments on a local or regional basis. Factoring drinking water exposure into the framework already contemplated for food-related exposures means developing a "person-by-person" approach to estimating drinking water exposure to pesticides over time. Because exposure to pesticides in drinking water is a local or a regional concern, and additionally, because the food portion of the dietary exposure assessment is being done on an individual basis, each hypothetical person included in an aggregate risk assessment should be assigned to a location and a drinking water source consistent with that location.
35

Once an individual has been associated with a representative drinking water source, the available data should be examined for the occurrence of pesticides in the drinking water source over time. Geographic Information System (GIS) tools, cropping and pesticide use information, fate and transport data, modeling results, monitoring data, and information on the effects of blending and treatment should be used to determine the pesticides most likely to occur in that water source, and potential pesticide concentrations over time. Initially, OPP expects to assume that a person would be exposed only to those pesticides that are used in the recharge area above an aquifer for groundwater, or in the watershed of the drinking water source for surface water. As a guide to determining likely regions upon which to focus risk assessment scrutiny, OPP will consider using information such as the National Agricultural Statistics Service (NASS) database or data from Doane’s Marketing Service. Alternatively, an analysis of cropping patterns and pest pressure may be explored to identify likely areas for concentration of effort.
OPP will continue to move forward in refining the screening-level approach. OPP plans to move beyond the screening-level assessment by using distributional data for the drinking water pathways. OPP is investigating the incorporation of the full range of data from models such as PRZM/EXAMS as a distribution to permit expression of the full range of predicted values in exposure estimates. OPP is also currently investigating the use of linear regression techniques as applied across occurrence data for pesticides in surface water. A draft guidance document will be issued in winter of 2002 describing a tiered approach to estimating drinking water concentrations, with distributional analysis reflecting variability in concentration due to seasonal use patterns as the highest tier. The technique is intended to provide a distribution of pesticide concentrations at drinking water intakes prior to treatment that may be used in a probabilistic analysis for drinking water exposure. In this and other ways, OPP is moving beyond a screening-level aggregate assessment to incorporate more realistic, quantitative estimates of exposure to pesticides from drinking water.
36

3. Residential Pathway and Aggregation
Assessing potential aggregate exposure to pesticides resulting from applications made in and around the home and public places such as playgrounds and playing fields, is also influenced by temporal, spatial, and demographic considerations. In addition, an individual’s age and gender attributes may play a significant role when addressing an individual’s residential exposure in an aggregate exposure assessment.
In general, a decision to use a pesticide depends on a perceived need for control of a certain pest or group of pests. For example, those desiring a weed free lawn are inclined to use an herbicide at different times of the year based on when weed seeds are germinating or shortly after they have emerged. An individual may make a decision to self-treat a lawn or to hire a professional lawn care operator (LCO). Urban houses may be more likely to receive pesticide treatment for chronic pests such as cockroaches on a routine basis. Exposure of young children in any of these environments may be higher than adults because of their unique behavior (nondietary ingestion, i.e., hand-to-mouth), increased activity, or greater contact with the surfaces where pesticide applications may have been made. An assessor should attempt to bring together these residential pesticide use scenarios in the form of a representative group of hypothetical individuals, based in data.
Temporal considerations can be identified by focusing on the pest to be treated and whether the application has been made by the resident himself or a professional applicator. Weed control on lawns using broadcast applications is typically performed in the spring to control germinating or newly emerging weeds. Insects such as billbugs or sod webworms appear in lawns as the growing season progresses. Summer weed control tends to be accomplished by the use of spot applications either made by the resident using a hand held sprayer of specific weeds or along patio borders. Professional applicators normally treat weeds during the summer on an “as needed” basis while making routine fertilizer treatments. Most LCO’s have an additional trigger on their spray wands to activate the herbicide spray when they run into a weedy spot during the fertilizer treatment. Residents typically have poor knowledge of turf diseases and thus are less likely to use fungicides while professional lawn services are more likely to anticipate disease conditions and make appropriate treatments. Temporal consideration regarding the use of LCO’s and the time of the week of application may need to be considered. Typically, treatments are likely to be made by a professional during the work week and by the resident on the weekend. Based in available data, an assessor should link the probability of professional or self-applied
37

residential pesticide use with a hypothetical individual in an aggregate assessment.
Spatial (geographic) considerations can also be identified by focusing on the site/pest considerations such as fire ants on lawns in the South. The use of a pesticide may be limited to cool season grasses which are primarily grown in the North and Midwest. Home gardens in the humid Southeast may require more fungicide treatments than gardens in California. For example, the periodic cicada is a problem in the Northeast, yet does not occur in the Pacific Northwest. Spatial considerations can be made for the characteristics (e.g., location of residence) for each individual in the population.
Applications of pesticides made in and around homes, schools, offices, and other public areas may result in potential exposure via the oral, dermal, and inhalation routes. Consideration of linkage of uses where appropriate is particularly important for residential uses. Linked uses are those in which two products are or may be used in combination, such as dipping a pet and treating the carpet of a flea-infested home, or used in such a way that using one product substantially increases the probability of using a second product. The recognition and maintenance of these potential linkages will be critical in developing realistic estimates of exposures to a hypothetical individual with defined demographic characteristics. At this time, the understanding of patterns of use is limited, although the Agency is aware of efforts to conduct surveys describing the pesticide use practices of the U.S. public. Exposure assessments for residential and other nonoccupational sources will focus on those use scenarios outlined in the Draft Residential SOP’s (USEPA, 1997a). The patterns of use for pesticides in residential, nonoccupational, and institutional settings are highly dependent upon location, season, dwelling type, and a myriad of other factors that impact the behavior of a potential pesticide user. Where appropriate, an assessor should link residential pesticide use preferences with particular classes or categories of individual, based on data, when performing aggregate exposure assessments. Where data are limited in quantity or are of poor quality, the Draft Residential SOP’s should serve as the basis for initial estimates of exposure.
38

Age/gender/pathway considerations play a role in aggregate assessments related to the behavior of individuals. Young children may be exposed to more pesticide residues for a variety of reasons. For example, young children engage in more hand-to-mouth activity (nondietary ingestion) than do adults. Some national surveys of home and garden pesticide usage suggest that more males than females treat lawns, whereas females are more likely to treat the interior of the house. Consideration of data of this type will aid in developing reasonable and realistic aggregate exposure and risk assessment scenarios.
To the extent possible, the assessment of residential, nonoccupational, and institutional use patterns should characterize seasonal and geographic variations, and associated pest pressures. Residential uses cannot necessarily be assumed to be consistent with or coincide with the large national or broad regional breakouts currently used in the food exposure assessment arena. For instance, a food exposure assessment might cover the entire Pacific Northwest region of the United States. However, the coastal regions of Washington and Oregon are more humid and have milder temperatures than would be found in Idaho. Thus, residential uses of pesticides would likely differ considerably between these two areas because of differences in pest pressure, even though they are within the same "region." Aggregate risk assessments should reflect use patterns and practices on a scale sufficient to capture the variability in pesticide use , but not so large as to inappropriately dilute real and significant differences.
Demographic considerations may be important for characterization of individuals in the population. For example, urban poor and rural poor may have different pesticide usage patterns based on a greater likelihood of having a vegetable garden or increased likelihood of living in a multifamily dwelling in an urban area. Low income residents in suburban areas may be less likely to hire lawn services than other suburbanites. Those who own homes may be more likely to hire lawn services than those who rent. These demographic considerations can also be considered for each individual in the population.
39

IV. Questions To Consider When ConductingAggregate Exposure Assessment These general principles for performing aggregate exposure and risk
assessments are not meant to be comprehensive or to be interpreted as a prescriptive approach. OPP will evaluate any and all methods or models developed to assess aggregate exposure. However, the framework, principles, and contents of the steps presented in this document should be considered in aggregate exposure and risk assessments.
The appropriate means of combining probabilistic exposure estimates from food, drinking water, and residential exposure in the expanded approach involves combining exposures for a single chemical from all pathways for each individual (separately) in the population. In other words, aggregate exposure estimates are combined by considering exposures of collections of hypothetical individuals in the population. In this way, the aggregate exposures in a population of individuals (e.g., U.S. population or children ages one to six years old) is a collection (distribution) of exposures of all the individuals in the population. Each individual’s aggregate exposure distribution is defined by applying the key concepts presented in Section III.
For example, it is not appropriate to derive separate, unlinked, independent distributions of exposed individuals for each pathway of potential exposure, and to then merely sum exposure from each pathway to derive a distribution of aggregate exposure for a population of individuals. The assessor should identify linked individual-specific pathway exposure scenarios that are reasonable and supported by data. In essence, the incorrect approach would place three sets of individuals (or three different populations), which are not connected through logical correlations and linkages of potential exposure, into one population aggregate exposure distribution. In this case, each “individual” would represent a series of illogical and incoherent set of exposures which would not occur in reality. Therefore, it is critical to honor as much as possible the temporal, spatial and demographic data available for each type of hypothetical individual in the population when developing an aggregate exposure assessment of population, and ensure that logically inconsistent combinations are not generated. The distinction between the current, Interim practices and the expanded approach should be considered when reviewing Section IV.
40

Section IV describes OPP’s practices and proposed principles which it intends to use in conducting aggregate exposure and risk assessments under FFDCA. These practices expand upon the Interim Aggregate Exposure and Risk Assessment Guidance. These principles and practices are illustrated in the form of “Ten Steps.” While OPP is not prescribing that these specific steps be implemented in strict accordance with the discussion offered here, OPP does expect any aggregate assessment to take the Ten Steps into consideration and explain any deviations from the ideas and principles discussed herein. See Figure 4 for an overview of the sequence of steps to consider in an aggregate exposure and risk assessment.
A. Questions and Issues to Consider when Employing the Expanded Method of Aggregation
1. Identify Toxicological Parameters (i.e., effect, dose, and duration of dosing), each potential exposure route (i.e., oral, dermal, inhalation), and exposure duration (i.e., acute (one-day), short-term, intermediate-term, and long-term) of interest. The appropriate exposure duration would be selected and identified by consideration of the duration of the health effect (i.e., the reversibility of the effect) and the time to onset of the health effect.
An initial step in performing an aggregate risk assessment is to review all available toxicity data to identify the toxicological endpoints of concern for a particular pesticide active ingredient (ai) and their associated parameters (e.g., dose, duration, route, etc.). Generally for a pesticide, these data include the results of the tests species in 40 CFR Part 158, as well as other data. The results of this hazard identification step should influence the subsequent identification of appropriate exposure scenarios which will be impacted by the toxicity profile of the pesticide, especially factors relating to the time to onset of effects and duration of effects or period of reversibility. The toxicity endpoint should match the temporal characteristics of the exposure scenarios identified for inclusion in the assessment. These factors should be evaluated in a coordinated manner to ensure that all appropriate scenarios are accounted for and that all toxicity endpoints of concern are addressed.
41

Figure 4. Ten Steps in Performing Aggregate Exposure and Risk Assessme
STEP 1. endpoints for each potential exposure route and duration
STEP 2. exposures for each pathway (constrained by regisitered
uses and use patterns)
STEP 3. and durations of potential exposures with routes and durations of health effects
STEP 4. of possible residential exposure
scenarios
STEP 6. Determine data treatment method
STEP 5. Determine magnitude, frequency, and duration for all pertinent exposure pathway/route combinations
STEP 10.Aggregate Exposure and Risk Characterization
STEP 9.Conduct sensitivity analysis
STEP 8.Conduct Aggregate Exposure and Risk Assessment
STEP 7.Assign route-specific risk metrics
Drinking Water Food Residential
Drinking Water Food Residential
Identify toxicological Identify potential
Reconcile routes
Determine cooccurence
42

If toxicological endpoints are the same, toxicological effects which occur at different dose levels via different routes of exposure should be combined within an aggregate exposure and risk assessment. For example, cholinesterase inhibition may occur from either oral or dermal exposures but at different dose levels. In these situations, conversion to a common risk metric may be needed, in order to combine the routes of exposure (here, oral and dermal). Additional details and steps for combining pathways of exposure and issues to consider while developing route-specific exposure scenarios, and combining exposure scenarios, are provided in “Step 7" of this section.
Frequently, there may be more than one toxicological endpoint for a single chemical. If the toxicological effects via different routes of exposure are not the same, then those exposure scenarios should NOT be combined. For example, if dermal exposure to a pesticide results in cholinesterase inhibition but inhalation exposure causes liver damage, then dermal exposure and inhalation exposure should NOT be combined in an aggregate assessment since the toxicological effects are different. Here, for example, more than one aggregate exposure and risk assessment can be performed for a single active ingredient, if necessary, in which each endpoint (e.g., cholinesterase inhibition and liver damage) is evaluated separately. Similarly, if a particular pesticide active ingredient elicits a specific toxic effect only following oral administration, and no effects are seen via the inhalation or dermal routes, only those exposure scenarios which reflect the oral route of exposure would be included in the analysis of this toxicological endpoint. Specifically, in this latter example, only the food pathway, any oral pathway residential exposure scenarios listed in the Draft Residential SOP’s, and the drinking water exposure scenarios would be evaluated in the assessment of aggregate exposure and risk.
In addition, routes should only be combined when the duration of exposure and toxic effect of the chemical exposure correspond. For example, it would not be appropriate to combine an exposure by the oral route in which a liver enzyme is inhibited following a one-day exposure with an exposure by the dermal route in which that same enzyme is destroyed following only a long-term exposure. Similarly, if there is no effect seen at the acute dose level, but there is an effect in the long-term (one-year dog study), only the long-term exposure scenario would be evaluated. The time period of exposure needed to produce a toxic effect is determined through critical analysis of the toxicological literature for the chemical of interest. Factors to be considered in evaluating a toxicological endpoint include the type of effect, the dose level, the duration of the exposure, the reversibility of the effect, and the time to onset of the effect.
43

All these considerations will be included in the identification of appropriate exposure scenarios via all pathways (i.e., food, drinking water, and residential) in the analysis of aggregate exposure and risk.
An additional factor to be considered when determining the toxicological endpoints of concern for a particular pesticide active ingredient is the potential difference in the toxicity of a pesticide resulting from different routes of exposure. The differences may result from pharmacokinetic factors including rate and degree of absorption, distribution, and potential differences in metabolism. Materials absorbed through the skin may be partially metabolized as they enter the skin. Alternatively, some pesticides may require activation by the liver. The liver may be bypassed when chemicals are absorbed through the lung and skin and therefore exposure via these routes may not result in first-pass bioactivation in the liver. Although both lung and skin each have the capability to metabolize xenobiotics themselves, they also have the capacity to initiate the bioactivation process for metabolism by other organs. The toxicity endpoint may also vary in treatment in the risk assessment depending upon the assumptions made about its interaction with the body. For instance, considerations of threshold may be important for noncancer endpoints. Although low-dose linearity is typically assumed for cancer, mechanistic research is increasingly providing support for nonlinear dose-response for certain cancer effects (e.g., thyroid carcinogenicity via perturbation of thyroid-pituitary axis).
The importance of the duration of exposure on toxicological effect in the evaluation of aggregate exposure is illustrated in Figure 3 above. A single pathway-specific exposure scenario for an individual or group of individuals in the population may not result in a duration of exposure which equals or surpasses the exposure duration which may cause an effect from a specific chemical. However, a combination of exposure scenarios (or, more precisely, their aggregation) for an individual or group of individuals in the population may exceed the exposure duration in which the effect may occur. As illustrated in Figure 3, none of the individual pathways (food, drinking water, or residential), taken separately, exceed the short-term toxicity endpoint for significantly longer than one day, but, when these separate pathways are combined or aggregated (as in the bottom panel of Figure 3) the short-term toxicity endpoint is exceeded for a period of greater than one day and would potentially trigger a concern for short-term exposure.
2. Identify the Potential Exposures Scenarios (including duration and route) for each pathway for each hypothetical individual in the identified population. The universe of potential exposure scenarios should be constructed by first characterizing all proposed and
44

registered use patterns for the chemical. Using bounding estimates and the results of less refined aggregate assessments, identify exposure scenarios, routes, and/or pathways that would be excluded from the refined assessment because the contribution to aggregate exposure is negligible. Document such decisions.
The starting point for identifying the exposure scenarios for inclusion in an aggregate exposure assessment is the universe of proposed and approved uses for the pesticide. The aggregate assessment should identify all potential pathways and routes by which individuals in any identifiable subpopulation might be exposed to the pesticide. OPP is not prescribing any particular methodology to perform aggregate exposure and risk assessment, nor is OPP prescribing any specific number of potential exposure scenarios or individuals to include in the assessment. Depending on the proposed and approved uses and use patterns for the chemical, separate scenarios considered may range from a single scenario to dozens of scenarios.
The initial identification of potential exposure scenarios may result in a seemingly limitless number of combinations, and performing an aggregate exposure assessment to address all of them could prove extremely difficult or impossible. If so, it may be appropriate to limit the scope of the assessment. The first step in narrowing an aggregate exposure assessment would be to consider the relative contribution to aggregate exposure of whether the scope of the assessment may be limited by excluding specific routes of exposure within an exposure scenario, specific exposure scenarios, and entire pathways. If (as discussed below) such routes, exposure scenarios, or pathways make only negligible contributions to aggregate exposure, the assessment could exclude them from further quantitative analysis. In addition, it may also be appropriate to limit a refined aggregate exposure assessment to a focus on a specific duration of exposure, e.g., one day or lifetime, because earlier, less refined aggregate exposure assessments have shown that other exposure durations present no risk concerns.
45

In addition to considering the toxicological effect, dose level and duration and timing of effect, the analyst should also consider all proposed or approved uses and use patterns of the pesticide active ingredient in developing realistic aggregate exposure scenarios via all relevant routes of exposure. Evaluating all proposed or approved use patterns will enable the analyst to determine for the food pathway, for example, which crops and crop groups should be considered in the analysis; for the residential pathway, which uses are registered for the chemical and, therefore, which residential application scenarios should be included in the analysis; for the drinking water pathway whether drinking water contamination should be evaluated, and if so, the degree to which localized drinking water assessments, should or can be performed. Of the seemingly limitless combinations of food, drinking water, and residential pathway scenarios which could be developed in an aggregate exposure assessment, a review of the toxicologically appropriate constraints (e.g., the duration of effect) and the proposed or approved uses and use patterns would likely significantly limit the number of aggregate exposure scenarios to be evaluated.
Because of the complexity introduced into the risk assessment process by the multitude of potential exposure scenarios, the identification of the potential aggregate exposure scenarios to be included in the assessment should be preceded by conducting a bounding estimate of all exposure scenarios. This is an important step in determining the scope of the assessment. The bounding process will greatly simplify the data preparation and calculation phases, but will also make the risk characterization process more transparent and useful by permitting the attention of the risk manager to be focused on the more important aspects of the assessment. A first step in the bounding process is the evaluation of the relative contribution/importance of the various routes and pathways that may be of concern in the final risk estimate. Generally, OPP would ordinarily consider as negligible a particular pathway that contributes less than 1.0% of the total PAD in the most refined assessment performed, and OPP would recommend that such use not be included in a quantitative, refined analysis. Similarly, where a specific exposure scenario contributes less than 0.1% of the PAD, OPP would ordinarily consider such exposure scenario as negligible. No more than 10% of the PAD should be excluded in this manner. The decision to exclude a pathway or exposure scenario should be made only if the criteria appear to be met for all identifiable subgroups who are potentially exposed. Each such decision should be identified and it should be noted in the risk assessment as extant but not included in the quantitative risk assessment. Similarly, if specific uses make negligible contributions to the risk assessment, or the toxicity by a particular route is low, the uses or routes should be noted in the risk assessment, but not included in the quantitative risk assessment. The
46

rationale for exclusion from the quantitative risk assessment should be explained in each case. At the conclusion of the process, the risk assessment should be transparent regarding what pathways, exposures scenarios, or uses have been excluded from the quantitative analysis and there should be a qualitative analysis of how these exclusions affect the quantitative analysis.
A negligible contribution from a pathway or route can be demonstrated by conducting a bounding estimate for a given pathway. A bounding estimate is one in which several conservative assumptions are combined to provide an estimate of exposure unlikely to be exceeded in actual practice. An example of a bounding estimate for food exposure is a Tier 1 or 2 acute dietary assessment in which the entire crop is assumed to be treated and residues are assumed to be present at tolerance or field trial levels. The actual exposure in the diet is unlikely to exceed this level and in most cases is anticipated to be much lower. For residential exposure assessments, there are no “bounding estimates” per se, but use of the equations defined in the Draft Residential SOP’s (USEPA, 1997a) with upper-end and mean values inserted for each of the parameters may provide a reasonable, health protective estimate. The use of surface and groundwater concentrations generated by water quality models as currently used by OPP (GENEEC, PRZM/EXAMS, and SCI-GROW) would provide a bounding estimate for comparison to at DWLOC for the drinking water portion of the assessment.
3. Reconcile the Routes and Duration of Potential Exposures with the routes and durations of the health effects. Match exposures (by route and duration) with the toxicological endpoints (by route and duration) and then conduct an aggregate risk assessment on the matches only when the integrity of the individual relationship between the endpoint, route, and duration is maintained.
Determining which routes (i.e., ingestion, inhalation, and dermal) and pathways (i.e., food, drinking water, and residential) are to be aggregated is a key decision in the development of an aggregate exposure assessment. Two general factors control this decision process–the toxicologically relevant dose and the potential exposure pattern of the active ingredient. The exposed individual’s dose should be matched against a relevant toxicological dose in terms of route, duration, and effect.
The careful evaluation of all route-specific exposure scenarios based on timing of effect and other toxicologically relevant characteristics as well as the registered uses and use patterns, and then the matching of
47

those scenarios based on data that support the combinations further assures the integrity of the aggregate exposure scenarios.
4. Determine Which of the Possible Residential Exposure Scenarios Are Likely to Occur Together ( i.e., co-occur within a given time-frame) and which occur independently.
Within the residential exposure pathway there may be multiple possible scenarios, potentially involving exposure via all routes of exposure. Some of those exposure scenarios might be linked or correlated such that the occurrence of one affects the likelihood of the occurrence of another. For example, the use of one product may generally preclude the use of another and a homeowner is unlikely to use more than one type of roach spray to treat a given roach infestation problem. On the other hand, the use of one home pesticide product may indicate the likelihood of another. For example, it is not unusual for a person performing conventional treatment of flea-infestation to concomitantly treat the pet with a type of dog dip and to spray for the fleas in the home, so as to completely eliminate the problem and lessen the chance for reoccurrence. These types of codependencies and interrelationships should be evaluated so as to properly discount unlikely and unrealistic combinations of residential exposure scenarios while at the same time appropriately accounting for correlated or linked uses. Marketing data may be available to aid in evaluating these dependencies.
5. Determine Magnitude (i.e., Exposure Concentration), Frequency, and Duration of Exposure (i.e., contact) for all pertinent exposure combinations.
To bring together exposure pathways (food, drinking water, and residential) to chemicals used as pesticides, the magnitude of exposure and risk needs to be calculated for each pathway/route separately, then brought together as a total risk value. The pathways/routes to be considered in an aggregate assessment are food/oral; drinking water/oral; and residential/oral, dermal, inhalation. In bringing these pathways together, particular consideration should be given to temporal and spatial issues with regard to the likely overlapping of exposure events from a pesticide through multiple sources of exposure.
Temporal issues include those relating to seasonal variation within an exposure scenario. For example, certain types of behaviors (e.g., lawn care) are unlikely to occur in the cold winter months in the northern part of the country: data may be available to evaluate the application of a lawn treatment in December in Maine, but such a scenario defies reasonable logic. No such application is likely to take place and, thus, does not merit
48

inclusion in the risk assessment. Similarly, contamination of water by a rapidly metabolized corn herbicide is most likely to occur in the spring and is less likely to occur in the winter months. Thus, aggregation scenarios in which drinking water exposures were involved would likely focus on other exposure scenarios which occur in the spring.
Another temporal aspect which should be considered is the frequency of and time interval between, exposure events. If a home owner fumigates a house today, it is unlikely that fumigation would be repeated tomorrow. However, residual exposure may continue for the next several days following fumigation although at a reduced level. Spatial considerations include the region of the country and climatic differences that may be anticipated. These differences include allowances for the seasonal differences in temperature that occur depending upon the region. In this example, the impact of a region coincides with temporal considerations. For example, impacts of winter on use patterns for pesticides might be very different in Maine as compared to Florida.
In addition to temporal issues, spatial issues should also be considered. For example, it might be important in evaluating certain exposure scenarios to distinguish between rural versus urban settings. A rural setting is more likely to be associated with a private well as a drinking water source than an urban setting. Similarly, data may show that regional production of fresh market produce is limited to distribution in that region and this may impact the need for a regional dietary assessment especially during peak harvest season requiring that an assessment with a regional focus be performed.
To further illustrate the principle that temporal and spatial issues are relevant and need to be considered within an aggregate exposure assessment, consider two hypothetical individuals–a man living in a single family home in rural central Florida and a woman living in an apartment in Chicago. The individual in Florida would be more likely to depend on a private well for drinking water, perform his own lawn care throughout much of the year, treat his home several times a year for roaches, have a private swimming pool, and eat locally produced food for nine months a year. The individual in Chicago depends on municipal drinking water, does not have a private lawn or swimming pool, and lives in an apartment with monthly scheduled pest control service. Based solely on time, place, and demographics it is likely that these two individuals have significantly different potential exposures to a given pesticide. After defining the toxicological endpoint (effect) and route of concern, the assessor should decide upon the appropriate set of residential, food and drinking water exposure assumptions for combining these risk scenarios. The decisions concerning which residential scenarios should be considered in aggregate
49

risk assessments should be made using the scenarios in the Draft Residential SOP’s as a basis for primary selection.
6. Determine Most Appropriate Technique (deterministic or probabilistic) for incorporating data into exposure algorithms.
Once input data are collected for exposure variables of interest, several techniques are available for representing these variables. OPP has traditionally used a deterministic approach to generate a single estimate of exposure and risk based on expressing all input variables in the exposure algorithm as single values (point estimates). Alternatively, one can use probabilistic techniques to more fully incorporate available information taking into account the range of possible values that an input variable could take, and weighting these values by their probability of occurrence. Probabilistic techniques acceptable to OPP are discussed in another guidance (USEPA, 1997d). Isn’t this just the little plain english paper?] OPP anticipates that a probabilistic approach to exposure assessment via all pathways will be possible in the future.
The choice of distributions to include as inputs into the aggregate exposure and risk model should always be based on all relevant information (both qualitative and quantitative) available for input. The selection of a distributional form (probabilistic or deterministic) should consider the quality and quantity of the information in the database, and should address broad questions such as the mechanistic basis for choosing a distributional form, the discrete or continuous nature of the variable, and whether the variable is bounded or unbounded. In all cases, input values expressed as a distribution should be fully described (USEPA, 1998c).
50

Not all input values need, or necessarily should, be expressed as a mathematically-modeled distribution, and probabilistic techniques should be used only on those pathways and exposure patterns which significantly influence the final risk estimate. If an input variable does not significantly affect an exposure estimate regardless of its distribution, then its use in a probability distribution represents marginal value added (USEPA, 1998c). Given this, using both deterministic and distributional data in the aggregate assessment process is acceptable. From a computational standpoint, a probabilistic analysis can include a mix of point estimates and distributions for the input parameters to the exposure model. However, when doing so the risk assessor and risk manager should continually review the basis for “fixing” certain parameters as point values to avoid the perception that these are indeed constants that are not subject to change.
7. Determine the Appropriate Risk Metric to be used in analysis and calculating aggregate exposure and risk.
There are several methods of measuring and aggregating risk for single chemical, multi-route, multi-source assessments. Two aggregation methods were developed by OPP–the Total MOE and the Aggregate Risk Index (ARI) (USEPA, 1998e). Arithmetically, the two approaches are the same when the uncertainty factors (UF) are the same for all routes of exposure. When the UF’s differ by route, however, the ARI is preferred. OPP will continue to employ either the total MOE or the ARI in its aggregate exposure and risk assessments.
Currently, risk assessments in OPP are based on the MOE concept. The MOE is calculated by dividing the No-Observed-Adverse-Effect Level (NOAEL) from a toxicity study by an appropriate estimate of the level of anticipated exposure. Thus, as a rule, risk increases as the MOE decreases. Each MOE is compared against a composite UF which serves as a standard when ascertaining whether a given hazard is acceptable.
51
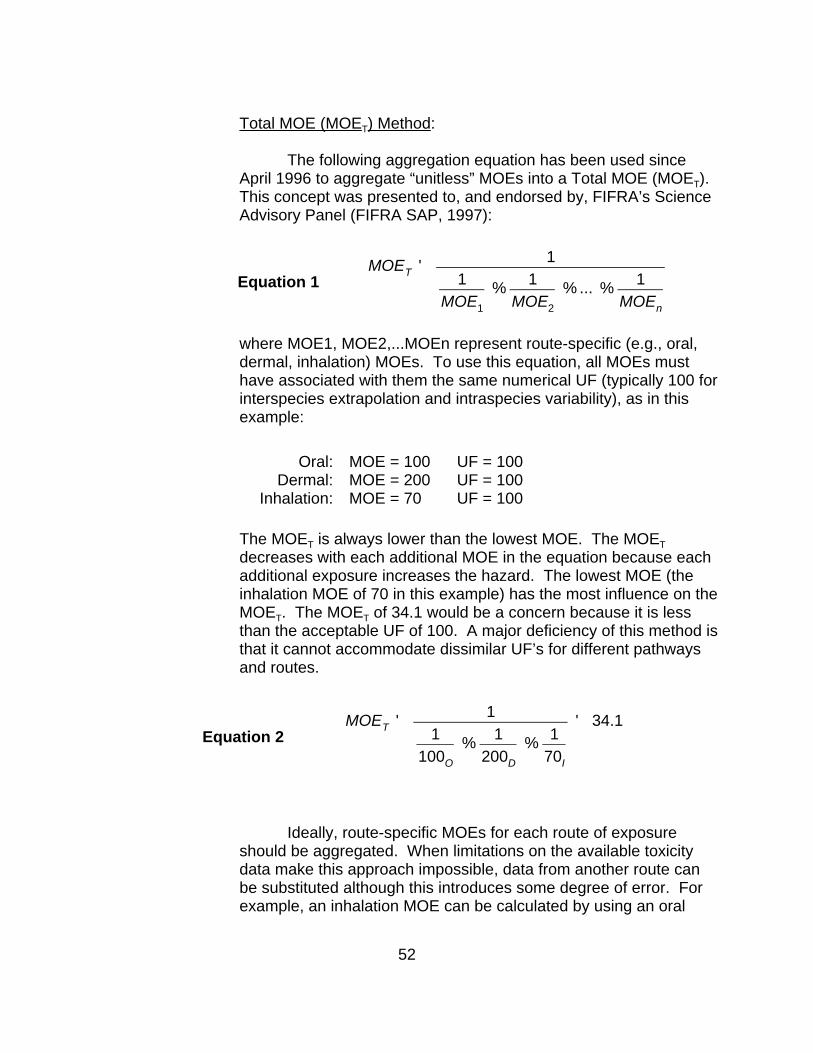
Total MOE (MOET) Method:
The following aggregation equation has been used since April 1996 to aggregate “unitless” MOEs into a Total MOE (MOET). This concept was presented to, and endorsed by, FIFRA’s Science Advisory Panel (FIFRA SAP, 1997):
1 Equation 1
MOET ' 1
% 1 % ... % 1
MOE1 MOE2 MOEn
where MOE1, MOE2,...MOEn represent route-specific (e.g., oral, dermal, inhalation) MOEs. To use this equation, all MOEs must have associated with them the same numerical UF (typically 100 for interspecies extrapolation and intraspecies variability), as in this example:
Oral: MOE = 100 UF = 100 Dermal: MOE = 200 UF = 100
Inhalation: MOE = 70 UF = 100
The MOET is always lower than the lowest MOE. The MOET decreases with each additional MOE in the equation because each additional exposure increases the hazard. The lowest MOE (the inhalation MOE of 70 in this example) has the most influence on the MOET. The MOET of 34.1 would be a concern because it is less than the acceptable UF of 100. A major deficiency of this method is that it cannot accommodate dissimilar UF’s for different pathways and routes.
MOET ' 1 ' 34.1
Equation 2 1 % 1
% 1 100O 200D 70I
Ideally, route-specific MOEs for each route of exposure should be aggregated. When limitations on the available toxicity data make this approach impossible, data from another route can be substituted although this introduces some degree of error. For example, an inhalation MOE can be calculated by using an oral
52

----------- ----------- -----------
NOAEL that has been extrapolated to an “equivalent” inhalation NOAEL. Uncertainty could result from using an extrapolation method that does not account for pharmacokinetic differences between the routes, and from assuming that the route with no data will have the same toxic signs as the well characterized route.
Aggregate Risk Index (ARI) Method:
The ARI was devised as a way to aggregate MOEs that have dissimilar UF’s. MOEs for each route of concern are compared against UF’s which reflect the nature, source, and quality of the data, and the FQPA mandate to protect susceptible infants and children. This can result in a variety of UF’s such as these:
Oral Dermal Inhalation
MOE: 300 100 1000
UF: 1000 100 300
MOE’s can only be combined if they have a common UF. If the MOE/UF ratios for each route are treated as fractions (as shown above), they can be adjusted to a common denominator of 1. This is accomplished by dividing each MOE by its UF to yield a Risk Index (RI):
Oral Dermal Inhalation
RI: 0.30 1.0 3.3
The RIs can then be combined to yield an ARI:
ARI ' 1 Equation 3 1
% 1 % ... % 1
RI1 RI2 RIn
ARI ' 1 ' 0.22
Equation 4 1 % 1
% 1 0.30O 1.0D 3.3I
53

RI’s and ARI’s are always compared against 1. This allows for direct comparisons between routes and between chemicals. As a general rule, an RI or ARI greater than or equal to 1 is of little concern, but an RI or ARI less than 1 suggests a risk of concern. In this example, the ARI (0.22) suggests a risk of concern because it is less than 1. The oral exposure has the lowest RI (0.30), so it is the major route of concern.
The ARI is an extension of the MOE concept. As with the MOE, risk increases as the RI or ARI decreases. The ARI method automatically considers each route’s potency when route-specific NOAELs are used. The following equation is a simplified way of calculating a chemical’s ARI in a single step:
ARI ' 1 Equation 5 UF1
% UF2
% ... % UFn
MOE1 MOE2 MOEn
Oral hazards are usually expressed as the “Percent of RfD” rather than as an MOE. Because the UF for the oral route is used to define the oral RfD, the percent of RfD (expressed as a decimal) can be put directly into the equation (assume oral exposure is 330% of the RfD, i.e., 3.3:
ARI ' 1 Equation 6 % RfDO %
UFD %
UFI
MOED MOEI
ARI ' 1 ' 0.22
Equation 7 3.3O % 100D
% 300I
100D 1000I
Percentages of reference doses (RfDs) and reference concentrations (RfCs) for all routes may also be aggregated:
1 Equation 8 ARI '
% RfDO % % RfDD % % RfCI
54

8. Conduct Analysis to Determine the Magnitude of Exposure and Risk for Each Pertinent Exposure Pathway. Aggregate, as appropriate, exposure and risk and sum risk. Then aggregate risk for each pathway from all pathways to each individual in the population. Several aggregate exposure and risk assessments may be required for a single active ingredient.
In this step, the aggregate assessment is conducted from information generated in Steps 1 to 7 with the appropriate temporal, spatial, and demographic exposure factors correctly assigned and consistently maintained throughout the analysis. In accordance with Steps 1 through 7, specific considerations in this “bringing together” include:
˜ Time (duration, frequency, and seasonality of exposure; seasonally-based pesticide residues in food; frequency of residential pest control which reflects housing location and type);
˜ Place (location and type of home); watershed (size of drinking water facility) or aquifer characteristics (confined or unconfined); region (regionally specific drinking water concentrations of the pesticide being considered); and
˜ Demographics (age; gender; gender- and age-specific body weights; reproductive status; ethnicity; personal preferences, behaviors, and characteristics).
All "linkages" of time, space and demographic characteristics should be made using supporting data. Aggregate exposure and risk assessment are first completed for individuals, who are then combined to develop distributions of aggregate exposure and risk to subpopulations and populations.
9. Conduct Sensitivity Analysis to identify the “driver” or source(s) of risk for each route. Identify scenario(s) of concern, such as highly exposed subpopulations by sources.
After performing an aggregate exposure and risk assessment, it may be helpful to also conduct sensitivity analysis to ascertain the pathway, commodity, exposure scenario, route, or other element of the analysis, which contributes the highest amount to total exposure and risk. Those routes and pathways with the lowest RI pose the greatest risk, and are potential candidates for risk mitigation. Sensitivity analyses can also be performed to learn how changes to input assumptions would change
55

the result. Sensitivity analysis in aggregate exposure and risk assessment is performed by examining characteristics defining high exposure and examining and investigating the differences in total exposure and risk with those exposure contributors of interest modified or eliminated.
A sensitivity analysis can be used to examine the relative contribution of particular routes of exposure or exposure pathways or other exposure scenarios within a pathway. For example, the sensitivity analysis might focus upon which route of exposure contributes the largest portion of the total exposure, which residential scenario of the many that were included in the aggregate analysis is the greatest contributor to exposure, or for the food exposure pathway, which commodity or commodities are the greatest contributors to the total food exposure value. For example, in food exposure assessment, commodities with extensive use, greater consumption reported, and higher concentration of pesticide residue are likely to contribute the largest overall exposure for the food pathway. The inclusion/exclusion of such commodities from the analysis could provide valuable information as to the relative importance of use of this commodity to total exposure and risk.
With this knowledge, an aggregate exposure and risk assessor may be able to: (1) state for risk management purposes the pathway of exposure which accounts for the greatest proportion of the total estimated risk; ( 2) recommend where future data gathering efforts might be focused; or (3) suggest ways in which total exposure and risk could be reduced. Sensitivity analyses are particularly useful in deciding whether or not to elevate a pathway-specific analysis to the next level of data refinement (increasing sophistication of exposure and toxicological data) and therefore consume more resources.
10. Aggregate Exposure and Risk Characterization
The risk characterization process includes an integrative analysis followed by a risk characterization summary detailing the major results of the risk assessment. The integrative analysis brings together the assessments of hazard, dose-response, and exposure to make risk estimates for the exposure scenarios of interest. The integrative analysis typically identifies the elements of the aggregate analysis which most affect the exposure and risk conclusion for use in decision-making. It is an appraisal of the science that supports the risk manager in making regulatory decisions. Risk characterization reports also indicate where the greatest opportunities for data or methodological improvements may exist.
56

Risk characterization routinely includes the following points capturing the important items covered in hazard, dose-response, and exposure characterization:
˜ primary conclusions about hazard, dose-response, and exposure, including other plausible alternatives,
˜ nature of key supporting information and analytical methods,
˜ risk estimates and their attendant uncertainties, including use of key assumptions when data are missing or uncertain,
˜ statement of the extent of extrapolation of risk estimates from observed data to exposure levels of interest (i.e., MOE) and its implications for certainty or uncertainty in quantifying risk,
˜ significant strengths and limitations of the data and analyses, including any major peer reviewers' issues, and
˜ if appropriate, comparison with similar risk analyses or common risks with which people may be familiar.
The risk characterization should identify all exposure scenarios that are not quantified in the aggregate risk assessment, and discuss qualitatively the possible impact of such exposure scenarios on the results of the risk assessment. Among other scenarios, the characterization should address potential exposures through breast milk and inhalation exposures from pesticide residue in water used for bathing and nonpesticidal uses of the chemical, unless sufficient data support inclusion of the scenario in the quantitative assessment.
Whenever assessing aggregate exposure from different pathways, it is important to characterize potential differences in the uncertainty of each pathway. Estimates of exposure by different pathways are calculated using different inputs: exposure data, assumptions, survey for pathways populations. Therefore the resulting estimates for pathways may differ in their level of accuracy and representativeness. The risk characterization should consider and discuss, as appropriate, how the inputs relating to populations, exposure data, and default assumptions may influence the relative accuracy of the pathway estimates. Further the risk characterization should discuss the potential differences in susceptibility of major identifiable subgroups and life stages.
57

The risk characterization is a valuable part of generating any Agency report on aggregate risk, whether the report is preliminary to support allocation of resources toward further study, or comprehensive to support regulatory decisions. In the former case, the detail and sophistication of the characterization are appropriately small in scale; in the latter case, appropriately extensive. Also, on the continuum from simple to more sophisticated assessments, default assumptions are used at almost every stage because the database is almost never complete. The use of defaults is predominant at screening stages and is used less as more data are gathered and incorporated. The risk characterization should carefully delineate which issues in a particular assessment are most important.
Transparency in environmental decision-making, clarity in communication, consistency in core assumptions and science policies from case to case, and reasonableness are important elements of risk characterization. While it is appropriate to err on the side of protection of health and the environment in the face of scientific uncertainty, common sense and reasonable application of assumptions and policies are important to avoid unrealistic estimates of risk (USEPA, 1995). Both integrative analyses and the risk characterization summary present an integrated and balanced picture of the analysis of the hazard, dose-response, and exposure. The risk characterization should summarize the evidence and results, and describe the quality of available data and the degree of confidence to be placed in the risk estimates. Important features include the constraints of available data and the state of knowledge, significant scientific issues, and significant science and science policy choices that were made when alternative interpretations of data existed (USEPA, 1995). Choices made about using default assumptions or data in the assessment are explicitly discussed in the course of analysis, and if a choice is a significant issue, it is highlighted in the summary.
58

B. Aggregate Assessment Reporting Guidance
For OPP to evaluate aggregate risk assessments submitted for consideration, sufficient information must be provided such that the assessment can be reproduced for confirmation of the procedures and results reported. This position is consistent with OPP's policy for single pathway assessments. Similarly, aggregate risk assessments prepared by OPP should provide adequate information to permit confirmation of the outcome by the public. The format for an aggregate risk assessment report should fully describe and document the ten steps for conducting an aggregate risk assessment as detailed in this document (Section IV.A.1-10). In addition, information should be provided on: purpose and scope; inputs and assumptions; data sources; exposure algorithms and scenarios; and, definitions of defaults.
The purpose and scope of the assessment should be clearly stated in a "problem formulation" section that includes a full discussion of any highly exposed or highly susceptible subpopulations evaluated (e.g., children, the elderly). The questions the assessment attempts to answer are to be discussed and the assessment endpoints are to be well defined and supported. In addition, key inputs and assumptions for exposure and hazard portion of the assessment should be listed. Information for each input and output distribution is to be provided in the report. This includes tabular and graphical representations of distributions (e.g., probability density function and cumulative distribution function plots) that indicate the location of any point estimate of interest (e.g., mean, median, high end percentiles). The selection of distributions and whether distributions used for input parameters reflect resampling of empirical distribution functions or imputations should be explained and justified.
The sources for data used in an assessment should be clearly identified. Where these are studies that have previously been submitted, and/or reviewed by the Agency, identifying information such as petition number, reregistration submission, document number (MRID), or Agency review number should be provided, so the data points can be readily confirmed. Where data points have been excluded from the probabilistic analysis, the exclusion should be identified and justified. Studies from which data are obtained should contain sufficient quality assurance/quality control of data to assure sample integrity during treatment, collection, transportation, storage, and analysis.
59

A discussion of the exposure algorithm(s) and their appropriateness for the scenario and population under study is recommended. Names of models and software used to generate the analysis should be identified. Routes of exposure should be clearly defined. Sufficient information is to be provided to allow the results of the analysis to be independently reproduced. Moreover, the analyst should identify all assumptions used and explain why they are reasonable. Assumptions that have a significant impact upon the results are to be documented and explained.
60

V. Future Data and Research Needs Although the development of probabilistic aggregate risk assessment tools has
greatly expanded the level of detail with which risk assessment can evaluate the variability and impact of pesticide use patterns on estimated risk, OPP does not anticipate initiating any new data call-ins or data requirements with the finalization of the Aggregate General Principles.
EPA's Office of Research and Development (ORD) is conducting research on aggregate exposure and risk in support of OPP's mandate to improve its capabilities to perform aggregate risk assessment. For example, there is a major population-based field study underway that focuses on children’s aggregate exposure to pesticides in homes, daycare centers, and schools. This study is scheduled for completion in FY 2004, with major products delivered in FY 2005. The results will be used to evaluate and refine a protocol that can be used by the pesticide industry and others to develop exposure data to refine residential assessments. This research will also verify pathways and activities that represent the highest exposures to children. In FY 2003, ORD will refine the current aggregate SHEDS-Pesticides exposure model to estimate exposures and absorbed dose to environmental contaminants by children and adults. ORD is also analyzing data that focuses on aggregate exposure and risk from multiple chemicals through multiple pathways, particularly for children. Data sources include NHEXAS (National Human Exposure Assessment Survey), NHANES (National Health and Nutrition Examination Survey) and ORD’s STAR grants.
A. Food Ingestion Pathway
The importance of the rate of application of pesticides to agricultural commodities and the use patterns associated with pesticides have been recognized as a potential area for refinement in estimating food exposure which has not always been included in the assessment process. This issue is discussed in the "The Role of Use-Related Information in Pesticide Risk Assessment and Risk Management” (USEPA, 2000e). The “Guidance for Submission of Probabilistic Human Health Exposure Assessments to the Office of Pesticide Programs” (USEPA, 1998c) includes a discussion of how use-related information can be better included in the risk assessment. That document also describes acceptable sources of data and how the data will be used. Other documents which are available include “Guidance for Refining Anticipated Residue Estimates for Use in Acute Dietary Probabilistic Risk Assessment” (USEPA, 2000c) and “Available Information on Assessing Exposures from Pesticide in Food: A Users Guide” (USEPA, 2000d). Other possible modifications to food assessments might include adjustment for residue levels in foods based upon differences in use patterns on fresh market and processed commodities or information concerning domestic vs. foreign production and treatment practices during different seasons. OPP is confident that this revised
61

document can substantially be followed using current data sources, judgements or other methods.
In the area of food consumption, few data are available describing intraindividual variation in daily consumption patterns over long periods of time. Existing cross sectional consumption data define interindividual variation, but give little insight into intraindividual behavior over time. Longitudinal data exist for a few groups of individuals in highly localized areas across the United States. More small surveys for a greater variety of subpopulations or a systematic subset nationwide would provide information needed to estimate the likely exposure of an individual to food borne pesticides over an extended period of time.
B. Drinking Water Pathway
For drinking water, in the short-term, OPP is working to improve the current screening-level models used to estimate the concentration of pesticides in drinking water, particularly for surface water. Several approaches have recently been completed and incorporated into OPP’s standard practices: (1) use of a “cropped area” factor to take into account that 100 percent of a basin supporting a drinking water facility may not be cropped; and (2) modification of the pond scenario currently incorporated into OPP’s screening-level water quality models to simulate a small reservoir that is large enough to support a drinking water facility. OPP is currently working on development of a more refined screening model for groundwater. There is consensus among the water quality modeling community that a basin scale water quality model linked to a GIS to estimate concentrations of pesticides in drinking water with a moderate to high level of confidence, although not currently available, would improve the ability to predict concentrations of pesticides in drinking water. In addition, research to estimate of the extent to which various kinds of drinking water treatment remove pesticides from tap water would improve model estimates of pesticide concentrations in drinking water.
62

It is often useful to collect available data on pesticides in drinking water from state agencies for public health, environmental protection, water resources, etc., as well as to generate data on pesticides in drinking water from statistically based surveys. For pesticides that are not found to have acceptable residue levels in screening-level models, available monitoring data and refined model estimates representing either drinking or nondrinking water supplies will be used to develop pesticide concentration distributions in drinking water for use in probabilistic aggregate exposure and risk assessments. Focused, targeted monitoring stratified across a variety of drinking water sources (vulnerable & typical) with known pesticide use for relevant pesticides is one possible source of such information. Data sets from most vulnerable drinking water sources (smaller facilities serving small populations) could be used with high confidence to bound the upper-end of the distribution of pesticide concentrations in drinking water. Data sets from more typical drinking water sources (larger systems serving large populations) could be used with high confidence to evaluate the “middle” or central tendency of the distribution of pesticide concentrations in drinking water. For incorporating drinking water into acute and chronic aggregate exposure and risk assessments these are the most critical portions of the pesticide concentration distribution.
C. Residential Pathway
In the residential exposure pathway, the ability to assess the likelihood of coincidental dietary and nondietary exposure improves with detailed use-related information. Use-related information includes details regarding the amount of pesticide applied per use, the frequency and timing of use events, and an estimate of the numbers and kinds of people making these applications. In addition, exposure assessors should be aware of applications made by consumers themselves and applications made by professional for hire services such as, pest control operators (PCO’s) and professional LCO’s. Usage information sources include inferences from pesticide product labels and information provided by proprietary market research service firms or government agencies. States such as California have databases of usage information and associations representing professional for hire services may also have usage information.
Frequency of use information, on a national scale, is available in the Agency’s National Home and Garden Pesticide Usage Survey (NHGPUS). However, this survey is 10 years old and focuses only on major use pesticides. In addition, this survey provides very little information about postapplication activities.
Increasingly, as pesticide registrants form data generating Task Forces in response to the FQPA, longitudinal surveys are being considered for use in residential exposure scenarios. These surveys are being designed to address
63

usage, frequency of use, and other key information needed in an aggregate assessments such as demographic, geographic and seasonal variation.
OPP recognizes that refinements to risk assessment are always possible and that future research will lead to improved methodologies. As new data and research become available, OPP will review this document to determine whether it should be updated.
64

VI. Limitations in Aggregate Exposure and RiskAssessments Aggregate exposure and risk assessments have a number of limitations
depending upon whether the analysis uses deterministic or probabilistic treatment of data. Deterministic data used in an aggregate exposure and risk assessment can provide a conservative, “worst case” estimate if the estimates themselves represent the high end or upper-bound. However, as described by Cullen and Frey, because of the variability and uncertainty about exposure, the degree and direction of the conservatism associated with deterministic inputs and outputs is unknowable without detailed description of the specific exposure scenario. Deterministic estimates based on conservative inputs provide no indication of the magnitude of uncertainty surrounding the quantities estimated and lend no insight into the key sources of underlying uncertainty. Analysts should be aware of the limitations surrounding the use of deterministic data sets and make these limitations known to the risk manager (Cullen and Frey, p. 7).
The use of distributional data in a probabilistic aggregate exposure assessment also has limitations. Probabilistic analysis enables an expanded characterization of the uncertainty and variability in the data set providing information about the range and likelihood of potential exposure. However, assigning an incorrect distribution or an unrepresentative data set to an input variable with a sparse data produces an inaccurate assessment with unquantifiable uncertainty. Thus, there are cases for which probabilistic analysis is not the most appropriate choice. In particular, this may be the case when data limitations make a screening-level assessment the reasonable stopping point in the analysis, or when exposures are found to be negligible (See Table 1).
65

Table 1. Where Probabilistic Analysis May and May Not Be Useful Cases in Which Probabilistic
Analysis May Be Useful Cases in Which Probabilistic Analysis May Not Be Useful
When the consequences of poor or biased exposure estimates are unacceptably high
When a screening-level deterministic calculation indicates that exposures are negligible
When a screening-level, deterministic calculation indicates exposures of potential concern, but carries a level of uncertainty that does not warrant immediate expenditures on remediation
When the cost of averting the exposure is smaller than the cost of probabilistic analysis
When there is interest in the value of collecting additional information, such as when time and resources permit additional sampling, but questions remain about whether this will impact the quality of the decision to be made
When safety is an immediate and urgent concern
When uncertain information stems from multiple sources
When the distribution of the input variables is so uncertain and/or indeterminate that detailed probabilistic analysis is inappropriate
When significant equity issues are raised by sources of variability, such as when subpopulations face unusual exposures relative to those of the general population
When there is little variability or uncertainty in the analysis
When assessing the potential benefits of targeting resources for various interventions, for example, when more than one strategy for remediation is available, but one would reduce exposure via the food chain while another would improve air quality
When ranking or prioritizing exposures, exposure pathways, sites, or contaminants in important
When the cost of remedial or intervention activity is high
Cullen and Frey, p.8
OPP believes that as long as: (1) assumptions are well-explained, reasonable, and transparent; (2) sensitivity analyses are performed to determine if any assumptions are “driving” the risk or control the resulting risk estimate; and (3) the resulting risk estimate is properly characterized and incorporates the results of the sensitivity analyses, then the risk estimates are an adequate basis for regulatory decision. Furthermore, the “Guiding Principles for Monte Carlo Analysis” (USEPA, 1997d) suggests that when data for an important pathway/parameter are limited, it may be useful to define plausible alternative scenarios to examine the impact of a possible range of values for important parameters on the overall assessment. In doing this, the risk assessor should select the range of values for important parameters consistent with the knowledge of the variability of the parameter and test the sensitivity of the
66

assessment to the input parameter range. Where parameters are entered as distributions, the assessor should assess the impact of assumptions about the shape of the distribution on the risk assessment. These evaluations should be included in the risk characterization and considered during the interpretation of results.
A. Food Ingestion Pathway: Limitations
The techniques for assessing exposure occurring by each of the exposure pathways described in this document have inherent uncertainties. However, the food exposure pathway is perhaps the most highly investigated pathway included in the aggregate exposure and risk assessments. While there are uncertainties in the food exposure analysis, the uncertainty decreases as higher Tiers in food exposure analysis are reached. Uncertainties present in the food exposure and risk pathway may include the use of residue data from maximum application scenario instead of “typical” pesticide use rate, estimates of the percent of crop treated, and the use of monitoring data from past years which may not reflect current geographical distributions of pesticide uses or use practices. Although percent of crop treated information collected nationally are highly refined, more accurate data may be available in the form of the individual company marketing information or data from growers or producers. Additionally, regional residue data and longitudinal consumption data are limitations at this time. These uncertainties should be considered as the food exposure pathway is investigated within an aggregate exposure and risk assessment.
B. Drinking Water Pathway: Limitations
In the drinking water pathway, there are various sources of uncertainties associated with incorporating data on exposure to pesticides in drinking water into an aggregate exposure and risk assessment whether using models to estimate pesticide concentrations in drinking water or the available monitoring data on water quality. OPP understands that the results provided by the computer simulation models currently used at the first and second Tier of analysis for pesticide concentrations in surface water do not characterize either the effects of dilution, distribution and/or potential treatment at a drinking water facility. However, model refinements to provide improved estimates are in progress. Therefore, the models’ limitations increase the uncertainty in the semiquantitative exposure assessment upon which the results are based. OPP has developed and implemented in early 2000 a model scenario that more accurately reflects pesticide concentrations in reservoirs that are large enough to be used as a drinking water facility including the output of time-dependent distributions of residues that reflect actual weather data. The SCI-GROW groundwater screening model provides concentration estimates for a pesticide that consistently bound greater than 99% of concentrations for that pesticide in drinking water wells in use areas (USEPA, 1999c).
67

The highest degree of confidence and lowest uncertainty would be associated with extensive monitoring data representing finished drinking water sampled over several years for specific pesticides known to be highly to moderately used in areas surrounding the drinking water facility. A range of drinking water facilities stratified across those considered to be most vulnerable to contamination to those considered to be more typical would be included in a data set associated with a high level of confidence. For surface water, these vulnerable areas are represented by small- to medium-sized watersheds in agricultural areas that are heavily cropped. For groundwater, agricultural areas with shallow depths to potable groundwater, coarse or sandy soils, and high recharge rates are considered vulnerable to contamination from pesticides.
C. Residential Pathway: Limitations
In the residential exposure pathway, reconciling environmental measurements, human activity patterns that contribute to potential exposure, and the biological factors that ultimately lead to absorbed dose presents unique challenges for exposure assessors attempting to estimate nondietary, residential exposure. Many of the current estimates (postapplication in particular) are made in the absence of formal guidance by the Agency beyond the screening-level SOP’s. ORD is conducting and designing studies to support postapplication and residential model development, and the results of those studies will become available over the next several years. Similar exposure studies to be generated by industry task forces are also in the design phase. All of this information will be reviewed and used as it is made public.
The current, postapplication residential exposure models addressing reentry onto treated lawns and carpets are simple algorithms. Estimates (e.g., Guranathan et al., 1998) need to be viewed in the context of available health surveillance data and studies in which biological monitoring was performed following structured activities. Biological monitoring studies such as those of young children living in the immediate vicinity of pesticide treated orchards (Loewenherz et al., 1997; Simcox et al., 1995) can also provide insight regarding the magnitude of residential exposure. While the models discussed above often predicted up to thousands of micrograms of pesticide per kilogram body weight, the available biological monitoring data and health surveillance data suggest much less per kilogram body weight. The Agency is currently evaluating the default assumptions in the available model/algorithms which may account for the apparent discrepancy in exposure estimates from these sources.
Estimating residential exposure of the pesticide applicator is more straightforward. To estimate residential handler exposure, Agency exposure assessors use data available in the Pesticide Handlers’ Exposure Database (PHED) and from studies on individual pesticides. These data are based on guideline studies and other published data concerning methods and quantity of
68

pesticide application. While the data may contain many nondetects, they do address activities that are reasonably well defined. When a specific application scenario does not exist in PHED or other available databases, exposure assessors estimate the quantity of pesticides that residents use to treat their homes, lawns and gardens, and how often are those applications made using surrogate data and professional judgement. Some of the questions surrounding an application scenario without data specifically targeted to that use pattern can be answered through the use of indirect data available though marketing services, company data, or well designed surveys. To the extent that data are not available for use in estimating a home pesticide applicator’s exposure, and estimates based on surrogate use data are used, different types of uncertainty exist.
Postapplication exposure following treatment of vegetables is also based on activities that are fairly well defined and based on models designed to estimate farm worker exposure. Often, levels of available residues can be estimated. However, chemical dissipation rates are often unavailable, thus allowing only high-end residue estimates. Postapplication inhalation exposure can be addressed using survey data from the National Human Activity Pattern Survey (NHAPS) and well defined ventilation rates available in the Agency’s Exposure Factors Handbook (USEPA, 1997b). Surveys such as NHAPS can assign “individuals” to a place for a period of time while conducting a certain activity, e.g., reading a book. Exposure is estimated by comparing an activity, a time duration as reported in NHAPS, and an appropriate (age/weight/gender) ventilation rate from the Exposure Factors Handbook to a residue estimate. But, what is often unknown is airborne concentrations of pesticides following applications and their subsequent dissipation.
69

VII. Validation and Verification of AggregateAssessment A. Model Evaluation and Enhancement
In any computer-based simulation/modeling effort, it is important that the analyst determine that a model is valid, i.e., that the model-predicted result corresponds reasonably well to results obtained in the “real world.” Specifically, this suggests that a model be both verified and validated. Model verification attempts to confirm that the computer simulation is performing as intended and check the translation of the conceptual simulation model into the appropriate computer code. Model validation, on the other hand, concerns itself with determining whether the conceptual model is an appropriate simulation of reality and an accurate representation of the system under study (Law and Kelton, 1991).
Given the complexity of the models under consideration for conducting aggregate assessments, and the state of the available data, rigorous validation and verification of any model is probably undoable. Any model used to assess aggregate exposure should undergo a rigorous evaluation phase (including peer review) to establish the credibility of the model and determine that the model output (i.e., the model predictions) are adequately representative of reality (ILSI, 2001). This stage of model evaluation should also include identification of the model’s strengths and limitations as well as the most critical parameters and assumptions used by the model. The validity and credibility of any aggregate exposure model can be investigated by comparing model predictions (in terms, for example, of the distribution of daily exposures, expressed in mg pesticide/kg body weight) with the exposure distributions as predicted by a variety of completed studies such as the Hispanic Health and Nutrition Examination Survey (HHANES) and NHANES, various OPP and academic institution data, industry task force studies, and (if available) proprietary data from industry or trade groups. Data to support such investigations are limited for many pesticides and therefore validation may not always be possible.
70

B. Biomonitoring
Biological monitoring, or biomonitoring, provides a basis for estimating an internal dose by measuring a pesticide and/or its metabolite concentrations in selected body tissues or fluids. Biomonitoring studies of selected chemicals measure exposures that have already incurred. Also, biomonitoring involves sampling only (e.g., blood sample) with no additional health or other consequences likely to occur from the sampling procedures. When done quantitatively, the internal dose determined from biomonitoring reflects exposures (i.e., absorbed doses) from all possible routes. Since the internal dose calculated from biomonitoring represents exposures from all pathways by all routes, biomonitoring may provide a method of validation for aggregate exposure assessments. It should, however, be supplemented with information on when and how exposure occurred, how the sample was collected, and data describing the absorption, metabolism and excretion for the compounds in question.
Biomonitoring studies should not be confused with using humans as test subjects. The government has in place very stringent standards that apply to federally funded research to ensure the protection of human subjects. OPP believes that the protection of public health from adverse effects of pesticides can be achieved through reliance on animal testing and use of the highest ethical standards. Biomonitoring studies investigate the biological consequences of pesticide exposure during the normal cycle of product use, and not the intentional dosing of human subjects.
The most appropriate methods for biological monitoring should be chosen based on a thorough knowledge and understanding of the pharmacokinetics of the specific pesticide in humans. Detailed guidance for the design and execution of biological monitoring studies is presented elsewhere (USEPA, 1998a and references therein). For certain pesticides, biological monitoring may not be an appropriate validation technique. Consider a particular pesticide that is extensively metabolized to a large number of minor metabolites. Each minor metabolite may be subject to interindividual variability. The following example illustrates the degree of potential inaccuracy in predicting absorbed doses from minor metabolites. A minor metabolite may represent an average of two percent of the absorbed dose with reported values ranging from 0.5 percent to 5.0 percent in human volunteers. Using the average value would require the use of a 50-fold correction factor to calculate an absorbed dose. Conversely, if the five percent value is representative, a correction factor of 20-fold would be recommended. It is recommended that a suitable biological monitoring marker metabolite would represent at least 30 percent of the administered dose, with a range of values not exceeding a factor of three in human volunteer studies.
71

GLOSSARY
Absorbed Dose. The amount of a substance penetrating across the absorption barriers (or the exchange barriers) of an organism, via either physical or biological processes. Synonymous with internal dose (USEPA, 1992).
Active Ingredient (ai). The chemical component of a pesticide formulation or end-use product that is intended to act as a pest deterrent. The biologically-active chemical agent in a pesticide product (USEPA, 1997a).
Aggregate Dose. The amount of a single substance available for interaction with metabolic processes or biologically significant receptors from multiple routes of exposure.
Aggregate Exposure. The amount of a chemical available at the biological exchange boundaries (e.g., respiratory tract, gastrointestinal tract, skin) for all routes of exposure.
Aggregate Exposure Assessment. A process for developing an estimate of the extent of a defined population to a given chemical by all relevant routes and from all relevant sources (ILSI, 1998a, p. A-2).
Aggregate Risk. The likelihood of the occurrence of an adverse health effect resulting from all routes of exposure to a single substance.
Biomonitoring. Measurement of a pesticide or its metabolites in body fluids of exposed persons and conversion to an equivalent absorbed dose of the pesticide based on a knowledge of its human metabolism and pharmacokinetics.
Cumulative Risk. The likelihood of the occurrence of an adverse health effect resulting from all routes of exposure to a group of substance sharing a common mechanism of toxicity.
Dislodgeable Residue. The portion of a pesticide (which may or may not include its metabolites) that is available for transfer from a pesticide treated surface (USEPA, 1997a).
Dose. The amount of a substance available for interaction with metabolic processes or biologically significant receptors after crossing the outer boundary of an organism (USEPA, 1992).
Dose Rate. Dose per unit time (e.g., mg/day). Also called dosage. Dose rates are often expressed on a per-unit-body-weight basis (mg/kg/day). Dose rates may also be expressed as an average over a time period (i.e., lifetime) (USEPA, 1992).
72

Exposure. Contact of a chemical, physical, or biological agent with the outer boundary of an organism. Exposure is quantified as the concentration of the agent in the medium in contact integrated over the time duration of that contact (USEPA, 1992).
Exposure Assessment. The qualitative or quantitative determination or estimation of the magnitude, frequency, duration, and rate of exposure of an individual or population to a chemical.
Exposure Scenario. A combination of facts, assumptions, and inferences that define a discrete situation or activity where potential exposures may occur (USEPA, 1997a). OPP uses this term as a synonym for “source.”
High End Exposure. A plausible estimate of individual exposure or dose for those persons at the upper-end of an exposure or dose distribution, conceptually above the 90th percentile, but not higher than the individual in the population who has the highest exposure.
Intake. The process by which a substance crosses the outer boundary of an organism without passing an absorption barrier, e.g., through ingestion or inhalation. (See also potential dose) (USEPA, 1992).
Level of Comparison. Also known as Drinking Water Level of Comparison. A drinking water level of comparison is a theoretical upper limit on a pesticide’s concentration in drinking water in light of total aggregate exposure to a pesticide in food, drinking water, and through residential uses.
Lowest-Observed-Adverse-Effect Level (LOAEL). The lowest dose in a toxicity study at which an adverse effect is observed.
No-Observed-Adverse-Effect-Level (NOAEL). The highest dose in a toxicity study at which no adverse toxic effect is observed.
Pathway. The physical course a chemical or pollutant takes from the source to the organism exposed. Also called exposure pathway (USEPA, 1992).
Population Adjusted Dose (PAD). The reference dose adjusted by the FQPA safety factor.
Potential Dose. The amount of a chemical contained in material ingested, air breathed, or bulk material applied to the skin (USEPA, 1992).
Reference Concentration (RfC). NOAEL (inhalation)/uncertainty factor (UF).
Reference Dose (RfD). NOAEL/uncertainty factor (UF).
73

Route. The way a chemical or pollutant enters an organism after contact, e.g., by ingestion, inhalation, or dermal absorption. Also called exposure route (USEPA, 1992).
Source. A term defined in EPA’s “Guidance of Cumulative Risk Assessment Part 1, Planning and Scoping” as an entity or action that releases to the environment or imposes on the environment chemical, biological, or physical stressor or stressors. See http://www.epa.gov/ORD/spc/cumrisk2.htm. When OPP discusses the different ways in which use of a pesticide may lead to exposure, OPP uses the term “exposure scenario.” These terms are synonyms.
Surrogate Data. Substitute data or measurements on one substance (or population) used to estimate analogous or corresponding values for another substance (or population).
Transfer Coefficient. Residue transfer rate to humans during the completion of specific activities (e.g., cm2 per hour), calculated using concurrently collected environmental residue data (USEPA, 1998a).
Uncertainty. Lack of knowledge about specific factors, parameters, or models.
Uncertainty Factor (UF). Factors used to account for inter- and intraspecies differences in relation to toxic effects, and uncertainties associated with the data.
Unit Exposure. The amount of a pesticide residues to which individuals are exposed, normalized by the amount of active ingredient used.
Uptake. The process by which a substance crosses and absorption barrier and is absorbed into the body (USEPA, 1992).
Variability. Differences attributed to true heterogeneity or diversity in a population or exposure parameter.
74

REFERENCES
Cullen, Alison C. and H. Christopher Frey. Probabilistic Techniques in Exposure Assessment. Plenum Press Society for Risk Analysis. New York, 1999.
FIFRA Scientific Advisory Panel. 1997. Final Report of the FIFRA Scientific Panel Meeting of March 19 and 20, 1997. Office of Pesticide Programs, Office of Prevention, Pesticides, and Toxic Substances, Washington, D.C. Available: http://www.epa.gov/scipoly/sap/1997/
Guranathan, S.; Robson, M.; Freeman, N.; Buckley, B.; Roy, A.; Meyer, R.; Bukowski, J.; P.J. Lioy, P.J. 1998. “Accumulation of Chlorpyrifos on Residential Surfaces and Toys Accessible to Children.” Environmental Health Perspectives, Volume 106, Number 1, Pages 9-16.
International Life Science Institute. 2001. “Aggregate Exposure Assessment: Model Evaluation and Refinement Workshop.” Available: http://www.ilsi.org/.
International Life Sciences Institute. 1998a. Report. “Aggregate Exposure Assessment Workshop.” Available: http://www.ilsi.org/.
Law, Averill M. and Kelton, David W. 1991. Simulation Modeling and Analysis, 2nd
edition, New York: McGraw Hill.
Loewenherz, C.; Fenske, R.A.; Simcox, N.J.; Bellamy, G.; and Kalman, D. 1997. “Biological Monitoring of Organophosphorous Pesticide Exposure among Children of Agricultural Workers in Central Washington State.” Environmental Health Perspectives, Volume 105, Number 12, Pages 1344 - 1353.
Simcox, N.J.; Fenske, R.A.; Wolz, S.A.; Lee, I.; Kalman, D.A. .1995. “Pesticides in Household Dust and Soil: Exposure Pathways for Children of Agricultural Families.” Environmental Health Perspectives, Volume 103, Number 12, Pages 1126-1134.
U.S. Department of Agriculture. 1992. Continuing Survey of Food Intake by Individuals (CSFII) 1988-1991. Food Survey Research Group. Washington D.C.
U.S. Environmental Protection Agency. 2001. LifeLine™-System Operation Review. Working Document for the March 28, 2001 Scientific Advisory Panel (SAP) Meeting.
75

U.S. Environmental Protection Agency. 2000a. “Standard Operating Procedure (SOP) for Incorporating Screening-Level Estimates of Drinking Water Exposure into Aggregate Risk Assessments;” draft document. September 1, 2000. Office of Pesticide Programs, Office of Prevention, Pesticides, and Toxic Substances, Washington, D.C. Available: http://www.epa.gov/fedrgstr/EPA-PEST/2000/October/Day-11/
U.S. Environmental Protection Agency. 2000c. “Guidance for Refining Anticipated Residue Estimates for Use in Acute Dietary Probablistic Risk Assessment.” June 15, 2000. Office of Pesticide Programs, Office of Prevention, Pesticides, and Toxic Substances, Washington, D.C. Available: http://www.epa.gov/oppfead1/trac/science/
U.S. Environmental Protection Agency. 2000d. “Available Information on Assessing Exposures from Pesticides in Food: A User’s Guide.” June 21, 2000. Office of Pesticide Programs, Office of Prevention, Pesticides, and Toxic Substances, Washington, D.C. Available: http://www.epa.gov/oppfead1/trac/science/
U.S. Environmental Protection Agency. 2000e. “The Role of Use-Related Information in Pesticide Risk Assessment and Risk Management.” August 21, 2000. Office of Pesticide Programs, Office of Prevention, Pesticides, and Toxic Substances, Washington, D.C. Available: http://www.epa.gov/oppfead1/trac/science/
U.S. Environmental Protection Agency, et.al. 2000f. “Calendex™: Calendar-Based Dietary & Non-Dietary Aggregate and Cumulative Exposure Software System.” Working Document for the September 2000 FIFRA Scientific Advisory Panel (SAP) Meeting. Available: http://www.epa.gov/scipoly/sap/2000/September/
U.S. Environmental Protection Agency. 1999a. Memorandum from Margaret Stasikowski, Health Effects Division to Staff. “HED SOP 99.5 Updated "Interim Guidance for Incorporating Drinking Water Exposure into Aggregate Risk Assessments;” August 1, 1999. Office of Pesticide Programs, Office of Prevention, Pesticides, and Toxic Substances, Washington, D.C.
U.S. Environmental Protection Agency. 1999b. “Guidance for Performing Aggregate Exposure and Risk Assessments;” draft document. October 29, 1999. Office of Pesticide Programs, Office of Prevention, Pesticides, and Toxic Substances, Washington, D.C. 64 FR 61343. Available: http://www.epa.gov/fedrgstr/EPA-PEST/1999/November/Day-10/.
U.S. Environmental Protection Agency. 1999c. Personal Communication with M. Barrett; 8/31/99. Office of Pesticide Programs, Office of Prevention, Pesticides, and Toxic Substances, Washington, D.C.
U.S. Environmental Protection Agency. 1998a. “Series 875-Occupational and Residential Exposure Test Guidance. Group B-Post-application Exposure Monitoring Test Guidance;” draft document (Ver. 5.4). February 10, 1998. Office of Pesticide
76

Programs, Office of Prevention, Pesticides, and Toxic Substances, Washington, D.C. Available: http://www.epa.gov/scipoly/sap/1998/march/contents.htm
U.S. Environmental Protection Agency. 1998c. “Guidance for Submission of Probabilistic Human Health Exposure Assessments to the Office of Pesticide Programs;” draft document. November 4, 1998. Office of Pesticide Programs, Office of Prevention, Pesticides, and Toxic Substances, Washington, D.C. Available: http://www.epa.gov/fedrgstr/EPA-PEST/1998/November/Day-05/
U.S. Environmental Protection Agency. 1998d. “Framework for Non-Occupational, Non-dietary (Residential) Exposure to Pesticides; draft document. December 22, 1998. Office of Pesticide Programs, Office of Prevention, Pesticides, and Toxic Substances, Washington, D.C. Available: http://www.epa.gov/docs/fedrgstr/EPA-PEST/1999/January/Day-04/
U.S. Environmental Protection Agency. 1998e. Memorandum from J.E. Whalan and H.M. Pettigrew to M. Stasikowski, Health Effects Division. “Inhalation Risk Characterizations and the Aggregate Risk Index (ARI).” Office of Pesticide Programs, Office of Prevention, Pesticides, and Toxic Substances, Washington, D.C.
U.S. Environmental Protection Agency. 1997a. “Standard Operating Procedures (SOPs) for Residential Exposure Assessments;” draft document. December 19, 1997. Office of Pesticide Programs, Office of Prevention, Pesticides, and Toxic Substances, Washington, D.C. Available: http://www.epa.gov/pesticides/trac/science/trac6a05.pdf.
U.S. Environmental Protection Agency. 1997b. Exposure Factors Handbook Volumes I-III. Office of Research and Development, Washington, D.C. EPA/600/P-95/002Fa-c.
U.S. Environmental Protection Agency. 1997c. Issue Paper for the March 1997 Scientific Advisory Panel (SAP) Meeting. “Aggregate Exposure Assessment as Required by the Food Quality Protection Act (FQPA) of 1996–Interim Approach.” Office of Pesticide Programs, Office of Prevention, Pesticides, and Toxic Substances, Washington, D.C. Available: http://www.epa.gov/scipoly/sap/1997/index.htm
U.S. Environmental Protection Agency. 1997d. “Guiding Principles for Monte Carlo Analysis.” Office of Research and Development, Washington, D.C. EPA/630/R-97/001. Available: http://www.epa.gov/ncea/monteabs.htm
77

U.S. Environmental Protection Agency. 1997e. Memorandum from Margaret Stasikowski, Health Effects Division to Health Effects Division Staff. “HED SOP 97.2 Interim Guidance for Conducting Aggregate Exposure and Risk Assessments (11/26/97);” November 26, 1997. Office of Pesticide Programs, Office of Prevention, Pesticides, and Toxic Substances, Washington, D.C.
U.S. Environmental Protection Agency. 1996. Memorandum from Stephanie Irene, Health Effects Division to CBTS, CBRS, DRES, and RCAB Staff. “Interim Office Policy for Performing Acute Dietary Risk Assessment.” Office of Pesticide Programs, Office of Prevention, Pesticides, and Toxic Substances, Washington, D.C.
U.S. Environmental Protection Agency. 1995. Memorandum from Carol M. Browner, Administrator. “Policy for Risk Characterization;“ March 21, 1995. Washington, DC, 1995.
U.S. Environmental Protection Agency. 1992. “Guidance for Exposure Assessment.” 57 FR 22888.
U.S. Environmental Protection Agency. 1987. “Pesticide Assessment Guidance. Subdivision U. Applicator Exposure Monitoring.” Office of Pesticide Programs, Office of Prevention, Pesticides, and Toxic Substances, Washington, D.C. EPA/540/9-87-127.
78