u.s. environmental protection agency region vi r6 st. rose air... · u.s. environmental protection...
TRANSCRIPT
U.S. ENVIRONMENTAL PROTECTION AGENCY Region VI
St. Rose Air Assessment Summary of Air Monitoring/Sampling DataAssessment Period 11/03/2014 through 11/07/2014
At the request of the Louisiana Department of Environmental Quality (LDEQ), the United StatesEnvironmental Protection Agency (EPA) Region 6 conducted an assessment of air quality within 3neighborhoods (Preston Hollow, Riverwood, and Oaklawn) surrounding the Shell Refinery andInternational Matex Tank Terminal facility in St. Rose, Louisiana.
TABLE OF CONTENTS
Summary of Results 2
Attachment A – Air Monitoring Locations 3
Attachment B – Single Point Monitor H2S Detections 4
Attachment C – Air Monitoring Log 5
Attachment D – Air Sampling Analytical Results 17
SUMMARY OF RESULTS:
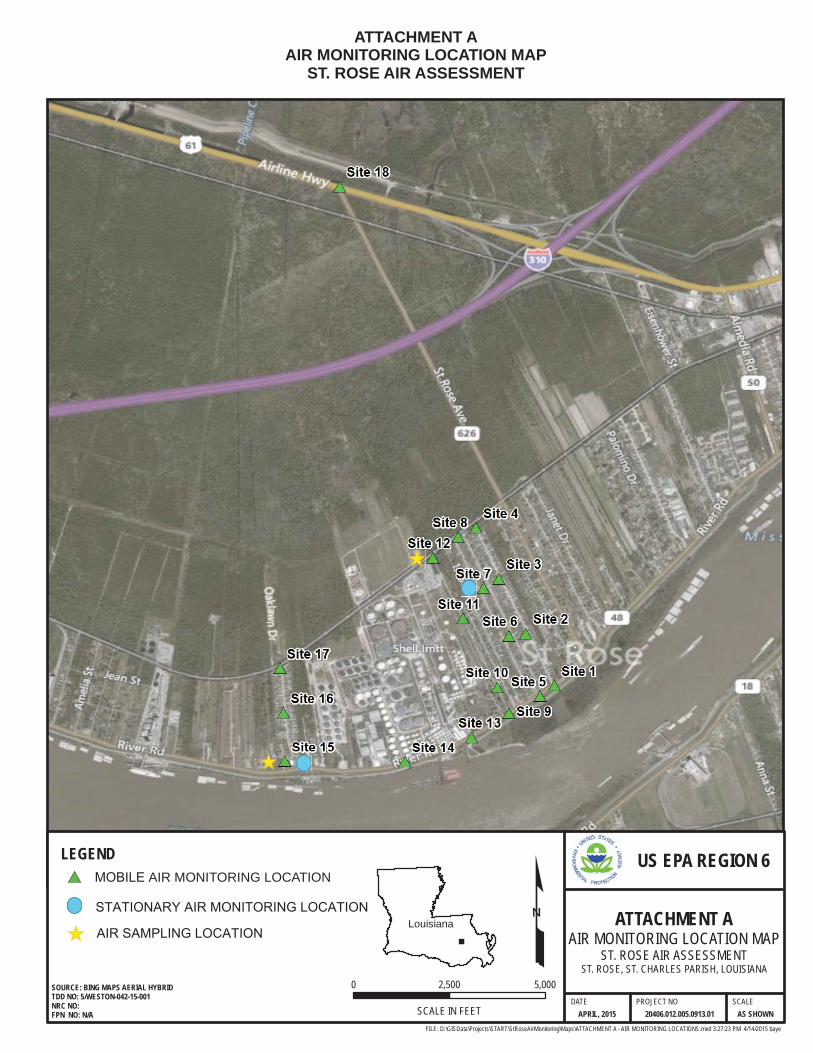
The EPA Team established 18 air monitoring locations (Attachment A) for hydrogen sulfide (H2S); oxygen(O2); carbon monoxide (CO); lower explosive limit (LEL); and volatile organic compounds (VOCs) withinthe neighborhoods. The EPA team utilized the following 3 air monitoring instruments:
Honeywell Single Point Monitor (SPM) with H2S specific detection – H2S
Honeywell RAE Systems MultiRAE multi gas monitor – H2S, O2, CO, LEL, and VOC
Arizona Instrument Jerome 631 gold film hydrogen sulfide analyzer – H2S
The Agency for Toxic Substances and Disease Registry (ATSDR) Minimal Risk Levels for H2S, SO2 andbenzene were utilized during the St. Rose Air Assessment (Table 1). Detections above 70 parts per billion(ppb) H2S and 5 parts per million (ppm) VOCs triggered an air sampling event at that location.
Two SPM units were placed at locations 7 and 15. The units ran continuously for approximately 4 days,analyzing the ambient air every 15 minutes. SPM monitoring began at 1015 on November 3, 2014 andended at 0900 November 7, 2014. A summary of H2S detections above 0 ppb is provided as AttachmentB. No results exceeded the Minimal Risk Level.
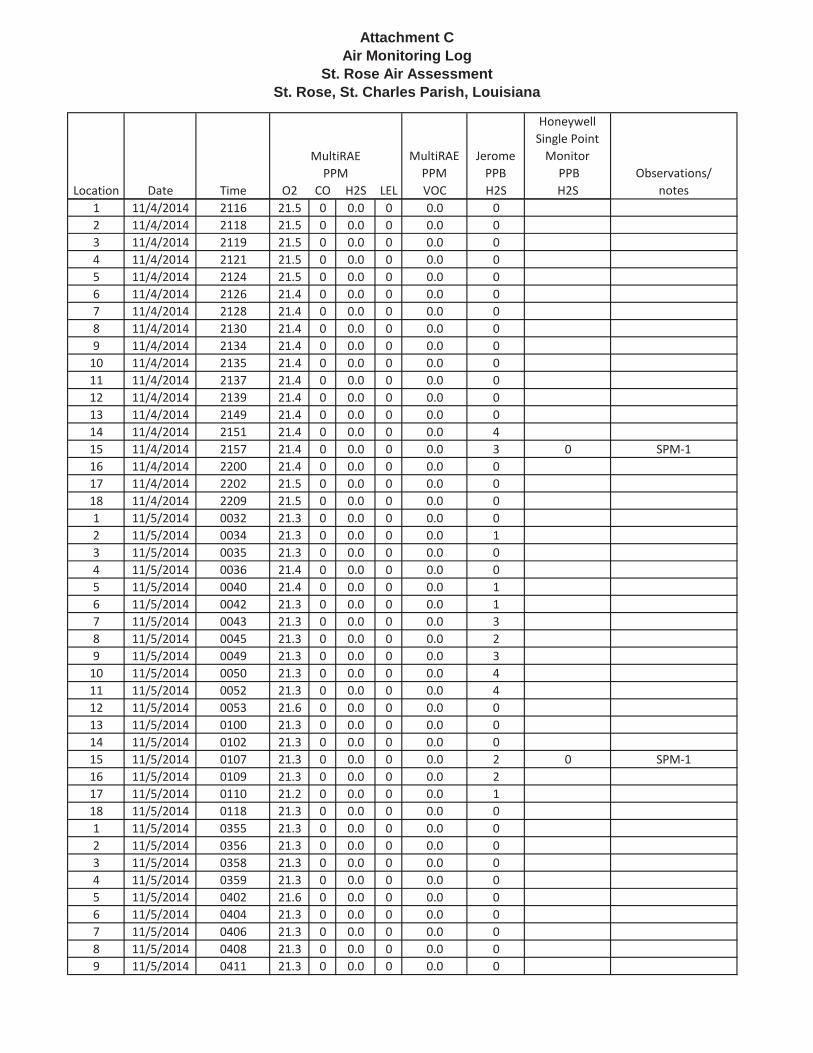
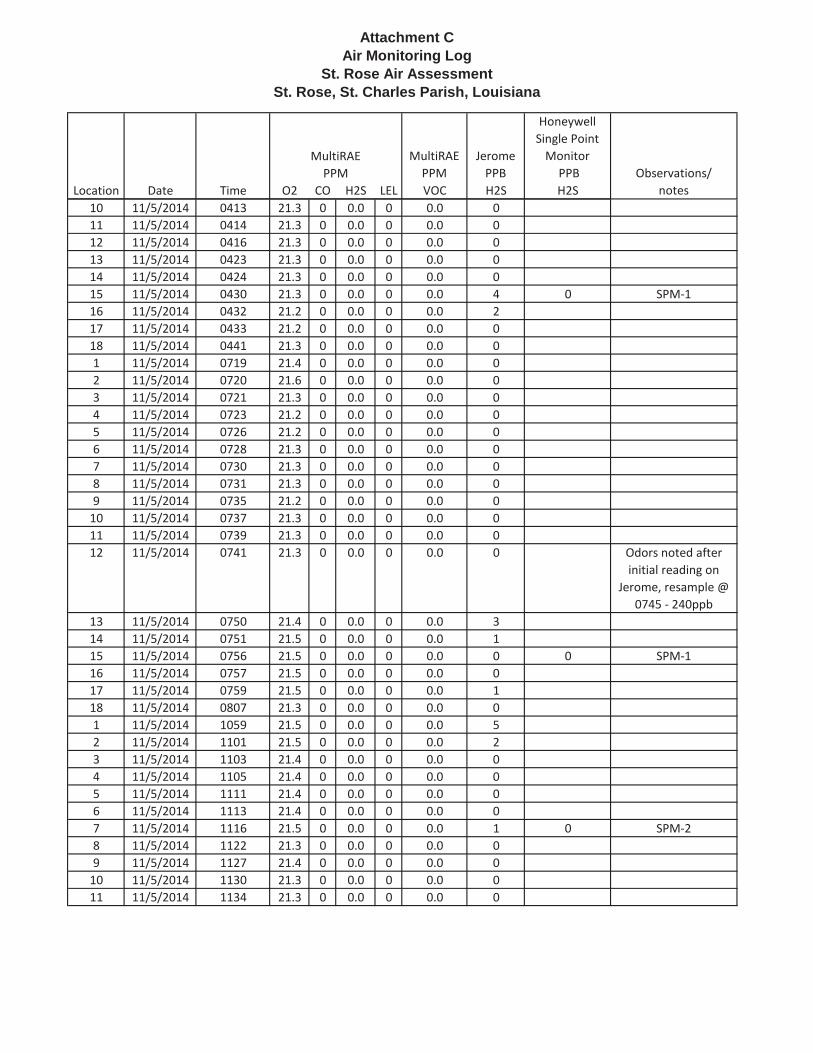
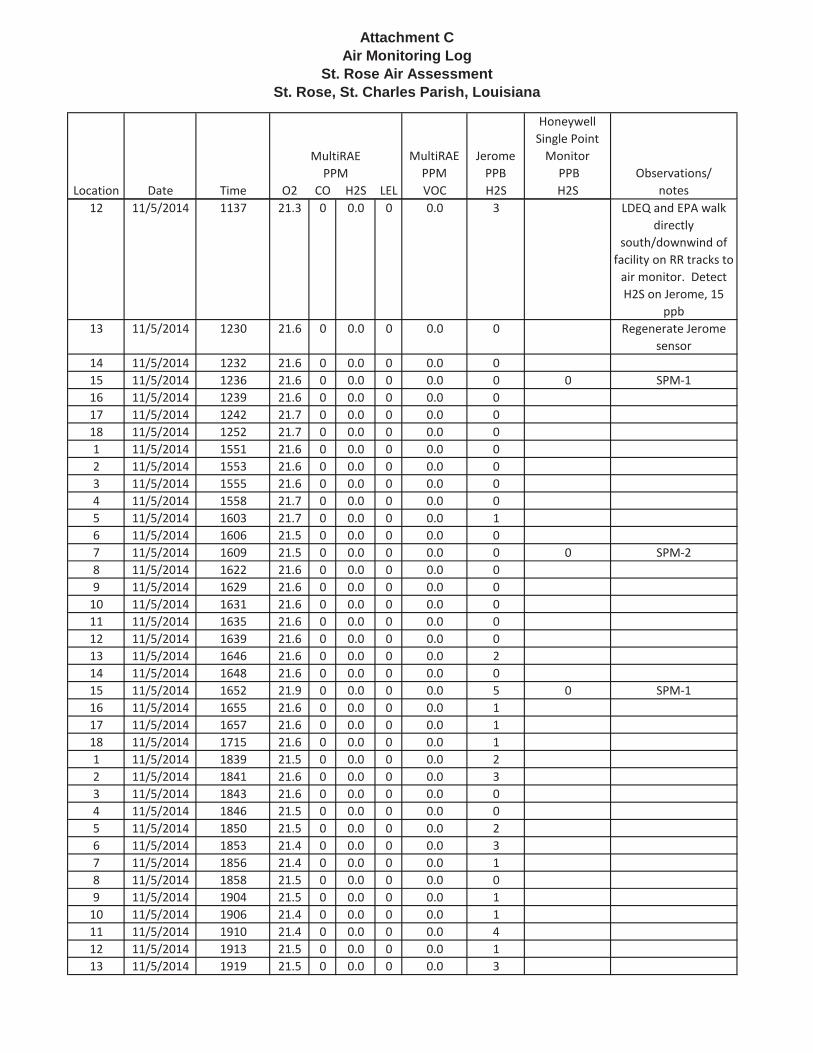
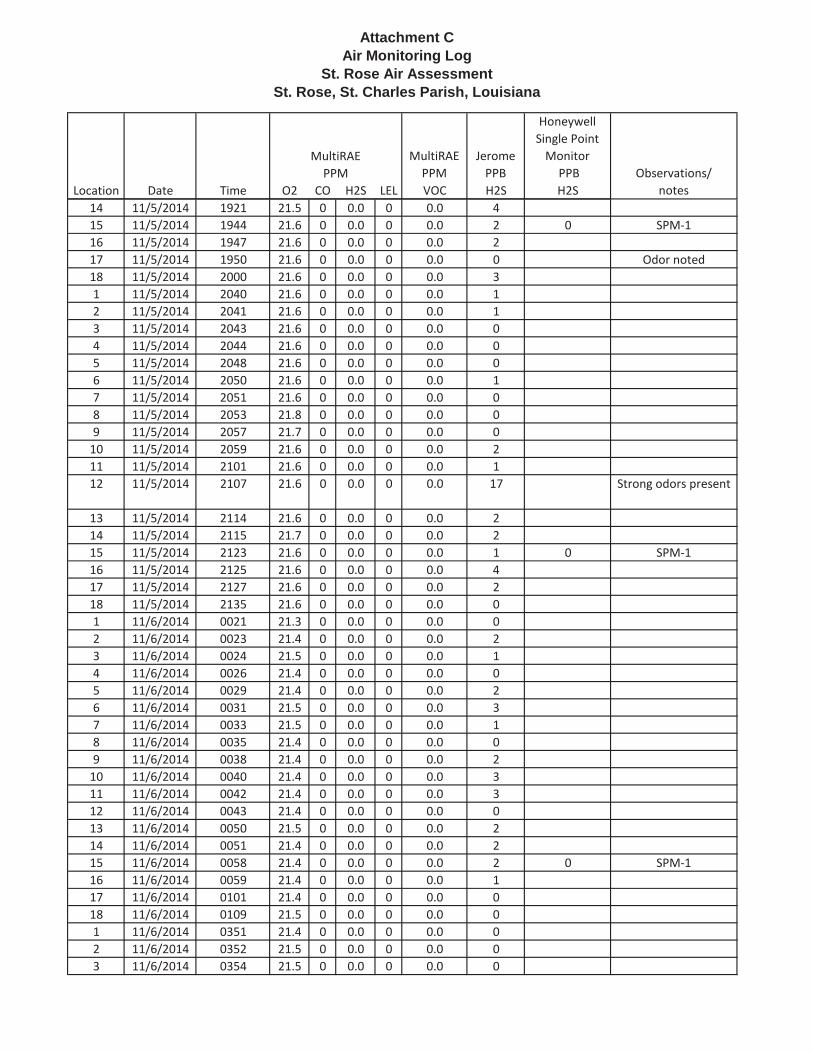
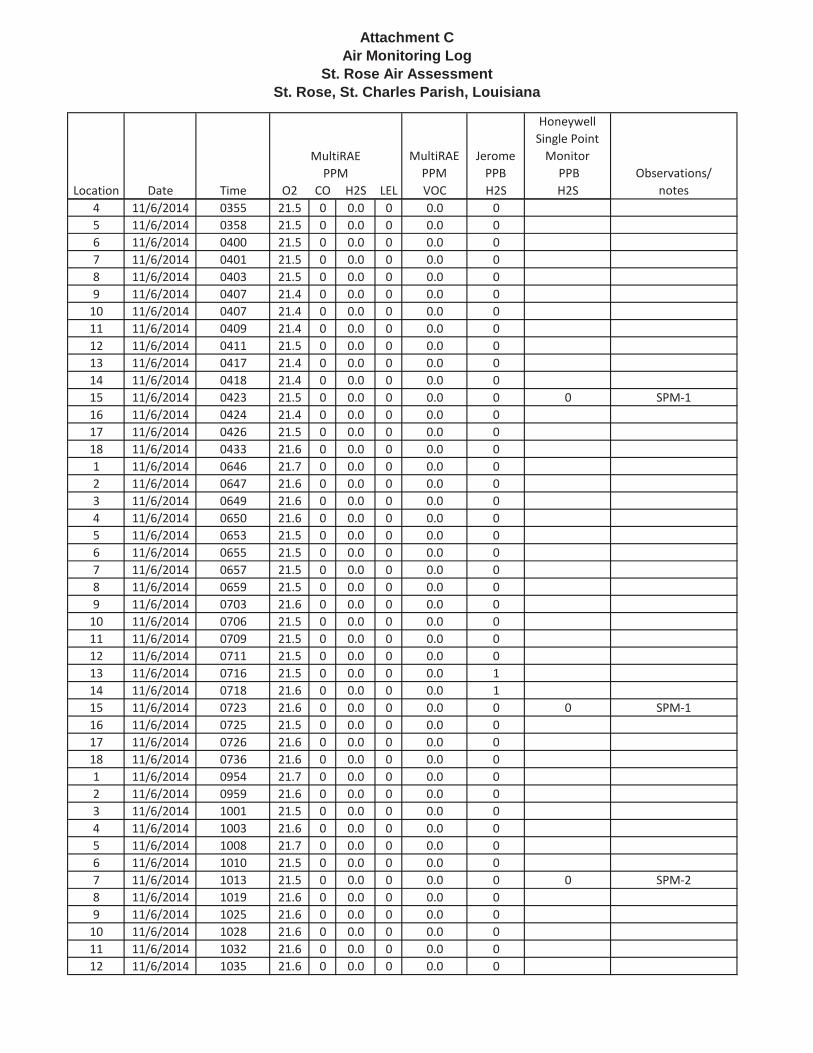
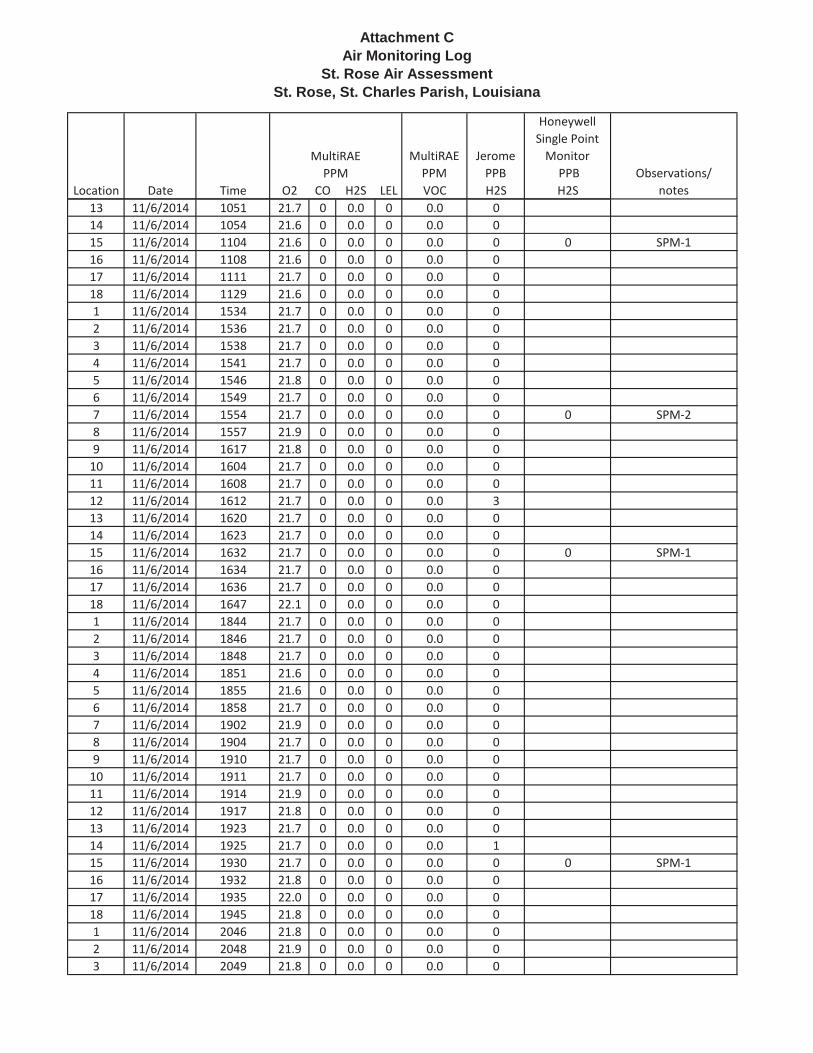
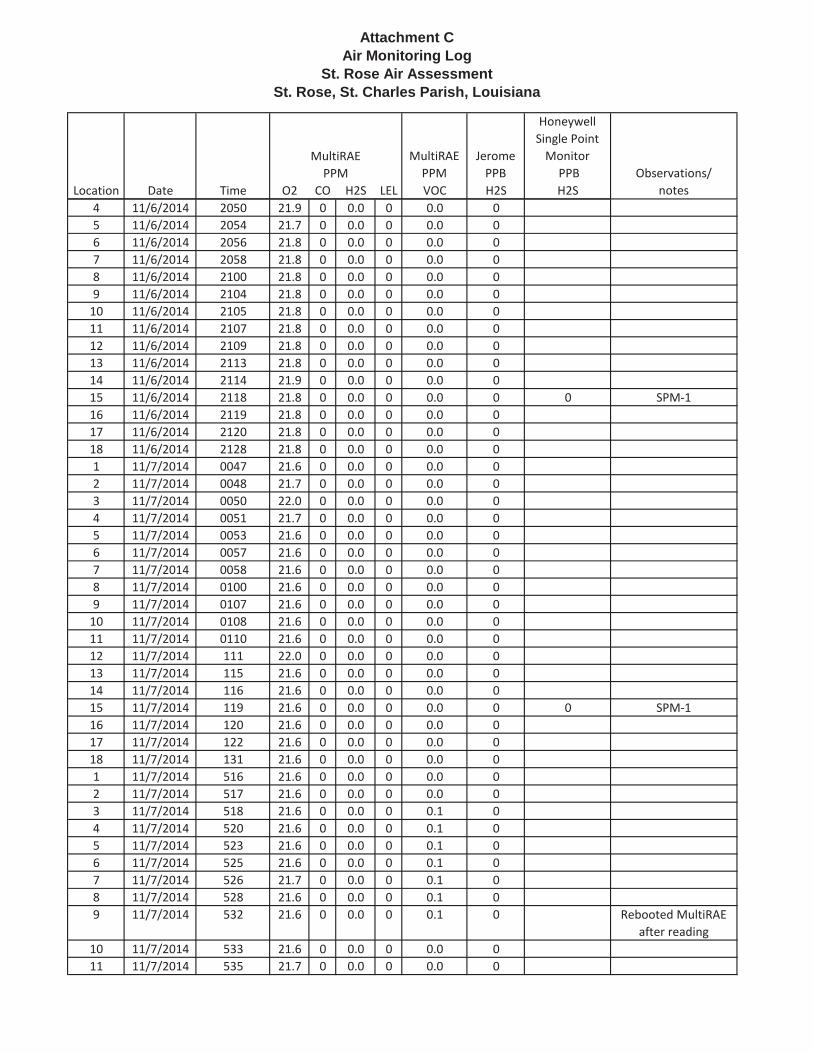
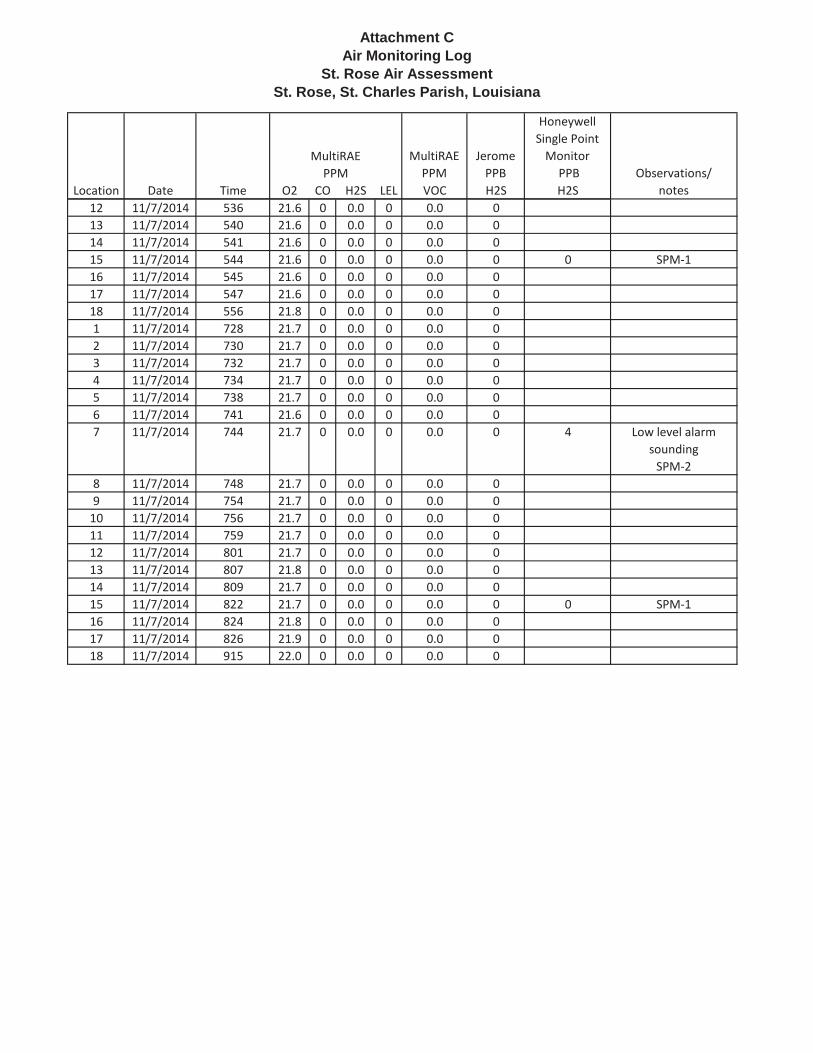
The EPA team utilized the MultiRAE and Jerome instruments to monitor air for CO, O2, LEL, VOC, and H2Sat the 18 air monitoring locations. Instrument readings and observation notes are provided in the AirMonitoring Log (Attachment C). The EPA Team documented readings at each of the 18 locationsapproximately every 4 hours. All readings recorded on the MultiRAE air monitor were at backgroundlevels for H2S, CO, O2, LEL, and VOCs. The Jerome Sulfide Analyzer detected H2S above the Minimal RiskLevel on two occasions at location 12, next to the sewage lift. The EPA Team collected two 24 hour airsamples from this location over a two day period (Attachment D). Two 24 hour background/upwindsamples were collected from monitoring location 15 at the same time. The four samples did not exceedthe Minimal Risk Levels for H2S, SO2 or benzene.
EPA Region 6 has reviewed data collected by both the LDEQ and EPA. EPA acknowledges that odorexperiencedwithin these communities may pose a nuisance and impact quality of life; however, the datacollected indicates that levels of hydrogen sulfide, sulfur dioxide and benzene are all under public healthlevels of concern.
CDC ATSDR Acute Minimal Risk Levels for Inhalation Compound MRL
H2S 70 ppb SO2 10 ppb
Benzene 9 ppb Table 1. Acute MRLs are derived for 1-14 days exposure duration.
£0 2,500 5,000
SCALE IN FEET
LEGEND#* AIR MONITORING LOCATION
20406.012.005.0913.01 AS SHOWN
SOURCE: BING MAPS AERIAL HYBRIDTDD NO: 5/WESTON-042-15-001NRC NO: FPN NO: N/A
FILE: D:\GISData\Projects\START\StRoseAirMonitoring\Maps\ATTACHMENT A - AIR MONITORING LOCATIONS.mxd 3:27:23 PM 4/14/2015 baye
APRIL, 2015DATE PROJECT NO SCALE
ATTACHMENT AAIR MONITORING LOCATION MAP
ST. ROSE AIR ASSESSMENTST. ROSE, ST. CHARLES PARISH, LOUISIANA
"
Louisiana
US EPA REGION 6
ATTACHMENT AAIR MONITORING LOCATION MAP
ST. ROSE AIR ASSESSMENT
STATIONARY AIR MONITORING LOCATION
AIR SAMPLING LOCATION
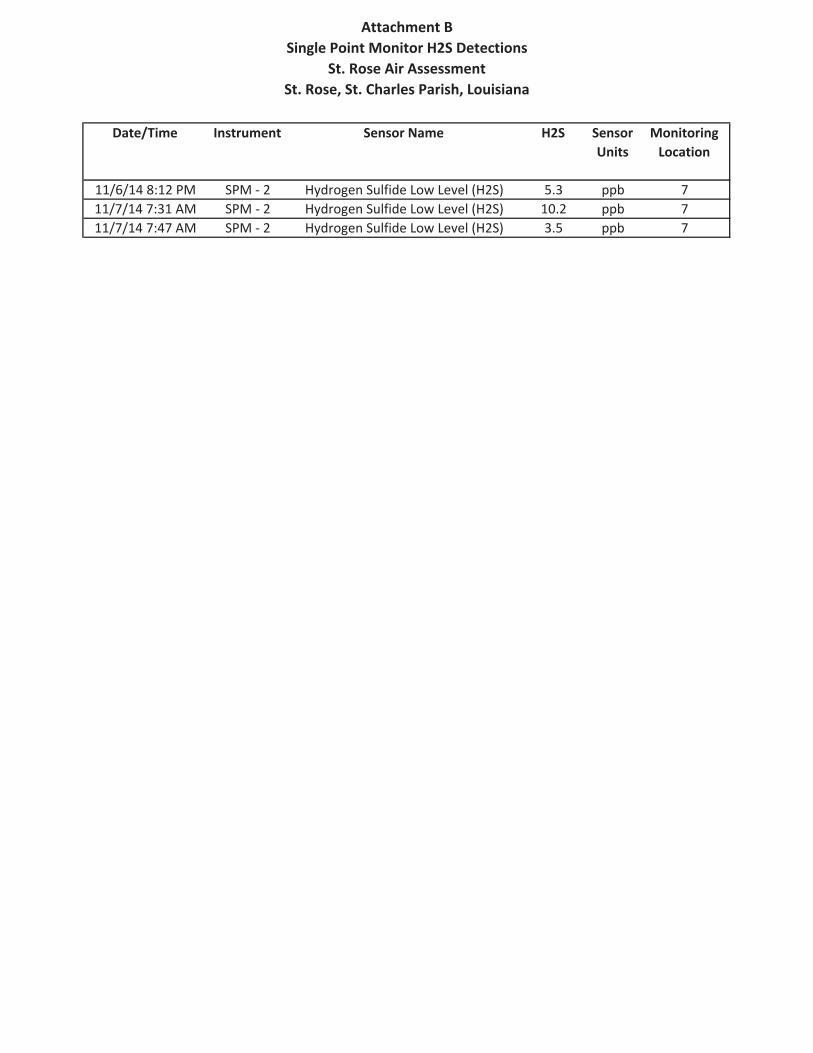
Attachment BSingle Point Monitor H2S Detections
St. Rose Air AssessmentSt. Rose, St. Charles Parish, Louisiana
Date/Time Instrument Sensor Name H2S SensorUnits
MonitoringLocation
11/6/14 8:12 PM SPM 2 Hydrogen Sulfide Low Level (H2S) 5.3 ppb 711/7/14 7:31 AM SPM 2 Hydrogen Sulfide Low Level (H2S) 10.2 ppb 711/7/14 7:47 AM SPM 2 Hydrogen Sulfide Low Level (H2S) 3.5 ppb 7
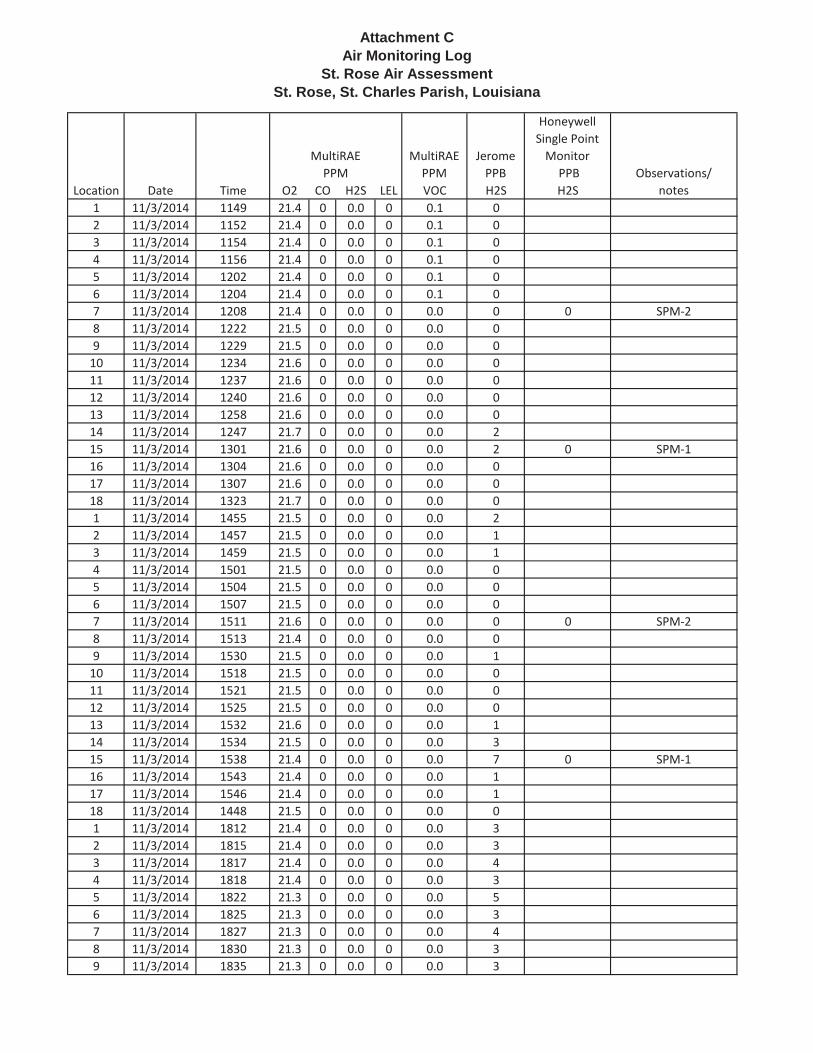
Attachment CAir Monitoring Log
St. Rose Air AssessmentSt. Rose, St. Charles Parish, Louisiana
MultiRAEPPM
JeromePPB
HoneywellSingle PointMonitorPPB Observations/
Location Date Time O2 CO H2S LEL VOC H2S H2S notes1 11/3/2014 1149 21.4 0 0.0 0 0.1 02 11/3/2014 1152 21.4 0 0.0 0 0.1 03 11/3/2014 1154 21.4 0 0.0 0 0.1 04 11/3/2014 1156 21.4 0 0.0 0 0.1 05 11/3/2014 1202 21.4 0 0.0 0 0.1 06 11/3/2014 1204 21.4 0 0.0 0 0.1 07 11/3/2014 1208 21.4 0 0.0 0 0.0 0 0 SPM 28 11/3/2014 1222 21.5 0 0.0 0 0.0 09 11/3/2014 1229 21.5 0 0.0 0 0.0 010 11/3/2014 1234 21.6 0 0.0 0 0.0 011 11/3/2014 1237 21.6 0 0.0 0 0.0 012 11/3/2014 1240 21.6 0 0.0 0 0.0 013 11/3/2014 1258 21.6 0 0.0 0 0.0 014 11/3/2014 1247 21.7 0 0.0 0 0.0 215 11/3/2014 1301 21.6 0 0.0 0 0.0 2 0 SPM 116 11/3/2014 1304 21.6 0 0.0 0 0.0 017 11/3/2014 1307 21.6 0 0.0 0 0.0 018 11/3/2014 1323 21.7 0 0.0 0 0.0 01 11/3/2014 1455 21.5 0 0.0 0 0.0 22 11/3/2014 1457 21.5 0 0.0 0 0.0 13 11/3/2014 1459 21.5 0 0.0 0 0.0 14 11/3/2014 1501 21.5 0 0.0 0 0.0 05 11/3/2014 1504 21.5 0 0.0 0 0.0 06 11/3/2014 1507 21.5 0 0.0 0 0.0 07 11/3/2014 1511 21.6 0 0.0 0 0.0 0 0 SPM 28 11/3/2014 1513 21.4 0 0.0 0 0.0 09 11/3/2014 1530 21.5 0 0.0 0 0.0 110 11/3/2014 1518 21.5 0 0.0 0 0.0 011 11/3/2014 1521 21.5 0 0.0 0 0.0 012 11/3/2014 1525 21.5 0 0.0 0 0.0 013 11/3/2014 1532 21.6 0 0.0 0 0.0 114 11/3/2014 1534 21.5 0 0.0 0 0.0 315 11/3/2014 1538 21.4 0 0.0 0 0.0 7 0 SPM 116 11/3/2014 1543 21.4 0 0.0 0 0.0 117 11/3/2014 1546 21.4 0 0.0 0 0.0 118 11/3/2014 1448 21.5 0 0.0 0 0.0 01 11/3/2014 1812 21.4 0 0.0 0 0.0 32 11/3/2014 1815 21.4 0 0.0 0 0.0 33 11/3/2014 1817 21.4 0 0.0 0 0.0 44 11/3/2014 1818 21.4 0 0.0 0 0.0 35 11/3/2014 1822 21.3 0 0.0 0 0.0 56 11/3/2014 1825 21.3 0 0.0 0 0.0 37 11/3/2014 1827 21.3 0 0.0 0 0.0 48 11/3/2014 1830 21.3 0 0.0 0 0.0 39 11/3/2014 1835 21.3 0 0.0 0 0.0 3
MultiRAEPPM
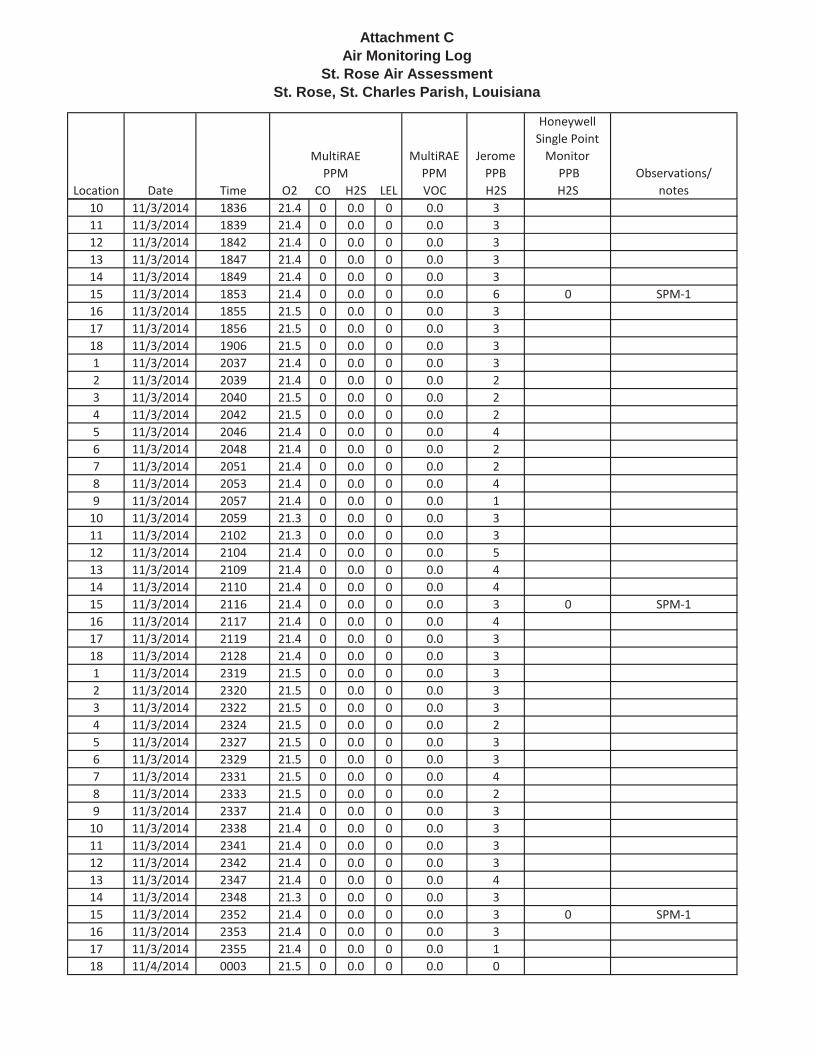
Attachment CAir Monitoring Log
St. Rose Air AssessmentSt. Rose, St. Charles Parish, Louisiana
MultiRAEPPM
JeromePPB
HoneywellSingle PointMonitorPPB Observations/
Location Date Time O2 CO H2S LEL VOC H2S H2S notes
MultiRAEPPM
10 11/3/2014 1836 21.4 0 0.0 0 0.0 311 11/3/2014 1839 21.4 0 0.0 0 0.0 312 11/3/2014 1842 21.4 0 0.0 0 0.0 313 11/3/2014 1847 21.4 0 0.0 0 0.0 314 11/3/2014 1849 21.4 0 0.0 0 0.0 315 11/3/2014 1853 21.4 0 0.0 0 0.0 6 0 SPM 116 11/3/2014 1855 21.5 0 0.0 0 0.0 317 11/3/2014 1856 21.5 0 0.0 0 0.0 318 11/3/2014 1906 21.5 0 0.0 0 0.0 31 11/3/2014 2037 21.4 0 0.0 0 0.0 32 11/3/2014 2039 21.4 0 0.0 0 0.0 23 11/3/2014 2040 21.5 0 0.0 0 0.0 24 11/3/2014 2042 21.5 0 0.0 0 0.0 25 11/3/2014 2046 21.4 0 0.0 0 0.0 46 11/3/2014 2048 21.4 0 0.0 0 0.0 27 11/3/2014 2051 21.4 0 0.0 0 0.0 28 11/3/2014 2053 21.4 0 0.0 0 0.0 49 11/3/2014 2057 21.4 0 0.0 0 0.0 110 11/3/2014 2059 21.3 0 0.0 0 0.0 311 11/3/2014 2102 21.3 0 0.0 0 0.0 312 11/3/2014 2104 21.4 0 0.0 0 0.0 513 11/3/2014 2109 21.4 0 0.0 0 0.0 414 11/3/2014 2110 21.4 0 0.0 0 0.0 415 11/3/2014 2116 21.4 0 0.0 0 0.0 3 0 SPM 116 11/3/2014 2117 21.4 0 0.0 0 0.0 417 11/3/2014 2119 21.4 0 0.0 0 0.0 318 11/3/2014 2128 21.4 0 0.0 0 0.0 31 11/3/2014 2319 21.5 0 0.0 0 0.0 32 11/3/2014 2320 21.5 0 0.0 0 0.0 33 11/3/2014 2322 21.5 0 0.0 0 0.0 34 11/3/2014 2324 21.5 0 0.0 0 0.0 25 11/3/2014 2327 21.5 0 0.0 0 0.0 36 11/3/2014 2329 21.5 0 0.0 0 0.0 37 11/3/2014 2331 21.5 0 0.0 0 0.0 48 11/3/2014 2333 21.5 0 0.0 0 0.0 29 11/3/2014 2337 21.4 0 0.0 0 0.0 310 11/3/2014 2338 21.4 0 0.0 0 0.0 311 11/3/2014 2341 21.4 0 0.0 0 0.0 312 11/3/2014 2342 21.4 0 0.0 0 0.0 313 11/3/2014 2347 21.4 0 0.0 0 0.0 414 11/3/2014 2348 21.3 0 0.0 0 0.0 315 11/3/2014 2352 21.4 0 0.0 0 0.0 3 0 SPM 116 11/3/2014 2353 21.4 0 0.0 0 0.0 317 11/3/2014 2355 21.4 0 0.0 0 0.0 118 11/4/2014 0003 21.5 0 0.0 0 0.0 0
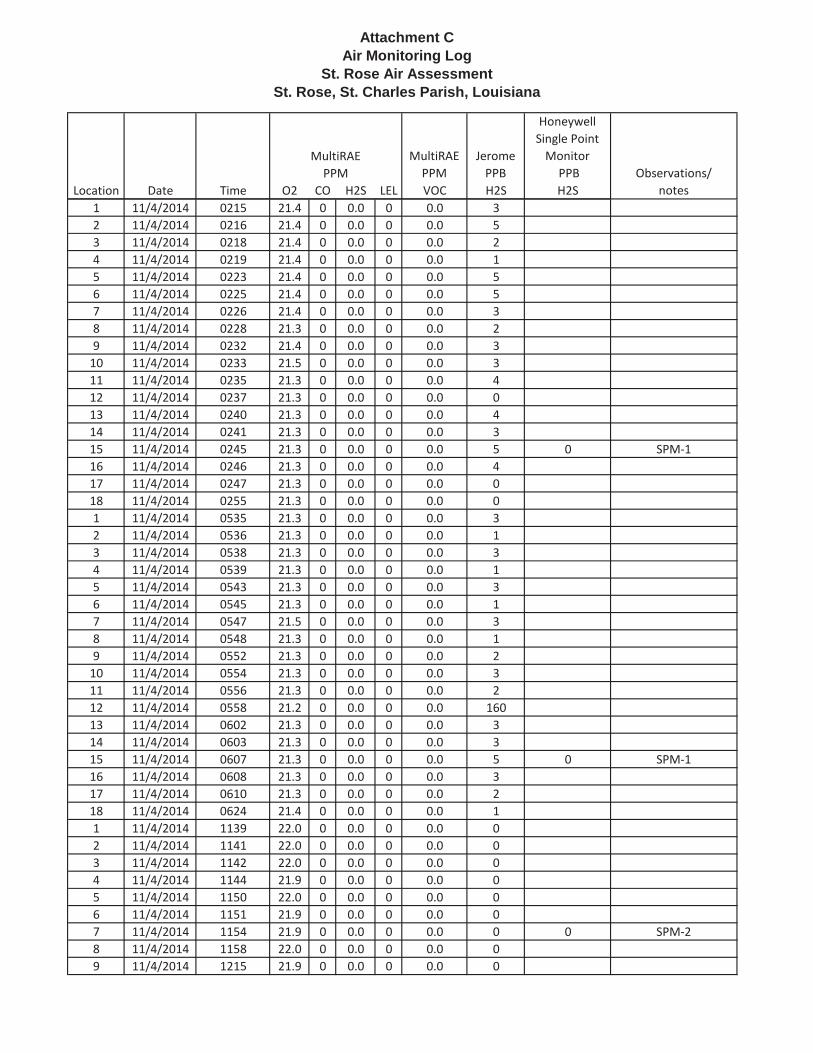
Attachment CAir Monitoring Log
St. Rose Air AssessmentSt. Rose, St. Charles Parish, Louisiana
MultiRAEPPM
JeromePPB
HoneywellSingle PointMonitorPPB Observations/
Location Date Time O2 CO H2S LEL VOC H2S H2S notes
MultiRAEPPM
1 11/4/2014 0215 21.4 0 0.0 0 0.0 32 11/4/2014 0216 21.4 0 0.0 0 0.0 53 11/4/2014 0218 21.4 0 0.0 0 0.0 24 11/4/2014 0219 21.4 0 0.0 0 0.0 15 11/4/2014 0223 21.4 0 0.0 0 0.0 56 11/4/2014 0225 21.4 0 0.0 0 0.0 57 11/4/2014 0226 21.4 0 0.0 0 0.0 38 11/4/2014 0228 21.3 0 0.0 0 0.0 29 11/4/2014 0232 21.4 0 0.0 0 0.0 310 11/4/2014 0233 21.5 0 0.0 0 0.0 311 11/4/2014 0235 21.3 0 0.0 0 0.0 412 11/4/2014 0237 21.3 0 0.0 0 0.0 013 11/4/2014 0240 21.3 0 0.0 0 0.0 414 11/4/2014 0241 21.3 0 0.0 0 0.0 315 11/4/2014 0245 21.3 0 0.0 0 0.0 5 0 SPM 116 11/4/2014 0246 21.3 0 0.0 0 0.0 417 11/4/2014 0247 21.3 0 0.0 0 0.0 018 11/4/2014 0255 21.3 0 0.0 0 0.0 01 11/4/2014 0535 21.3 0 0.0 0 0.0 32 11/4/2014 0536 21.3 0 0.0 0 0.0 13 11/4/2014 0538 21.3 0 0.0 0 0.0 34 11/4/2014 0539 21.3 0 0.0 0 0.0 15 11/4/2014 0543 21.3 0 0.0 0 0.0 36 11/4/2014 0545 21.3 0 0.0 0 0.0 17 11/4/2014 0547 21.5 0 0.0 0 0.0 38 11/4/2014 0548 21.3 0 0.0 0 0.0 19 11/4/2014 0552 21.3 0 0.0 0 0.0 210 11/4/2014 0554 21.3 0 0.0 0 0.0 311 11/4/2014 0556 21.3 0 0.0 0 0.0 212 11/4/2014 0558 21.2 0 0.0 0 0.0 16013 11/4/2014 0602 21.3 0 0.0 0 0.0 314 11/4/2014 0603 21.3 0 0.0 0 0.0 315 11/4/2014 0607 21.3 0 0.0 0 0.0 5 0 SPM 116 11/4/2014 0608 21.3 0 0.0 0 0.0 317 11/4/2014 0610 21.3 0 0.0 0 0.0 218 11/4/2014 0624 21.4 0 0.0 0 0.0 11 11/4/2014 1139 22.0 0 0.0 0 0.0 02 11/4/2014 1141 22.0 0 0.0 0 0.0 03 11/4/2014 1142 22.0 0 0.0 0 0.0 04 11/4/2014 1144 21.9 0 0.0 0 0.0 05 11/4/2014 1150 22.0 0 0.0 0 0.0 06 11/4/2014 1151 21.9 0 0.0 0 0.0 07 11/4/2014 1154 21.9 0 0.0 0 0.0 0 0 SPM 28 11/4/2014 1158 22.0 0 0.0 0 0.0 09 11/4/2014 1215 21.9 0 0.0 0 0.0 0
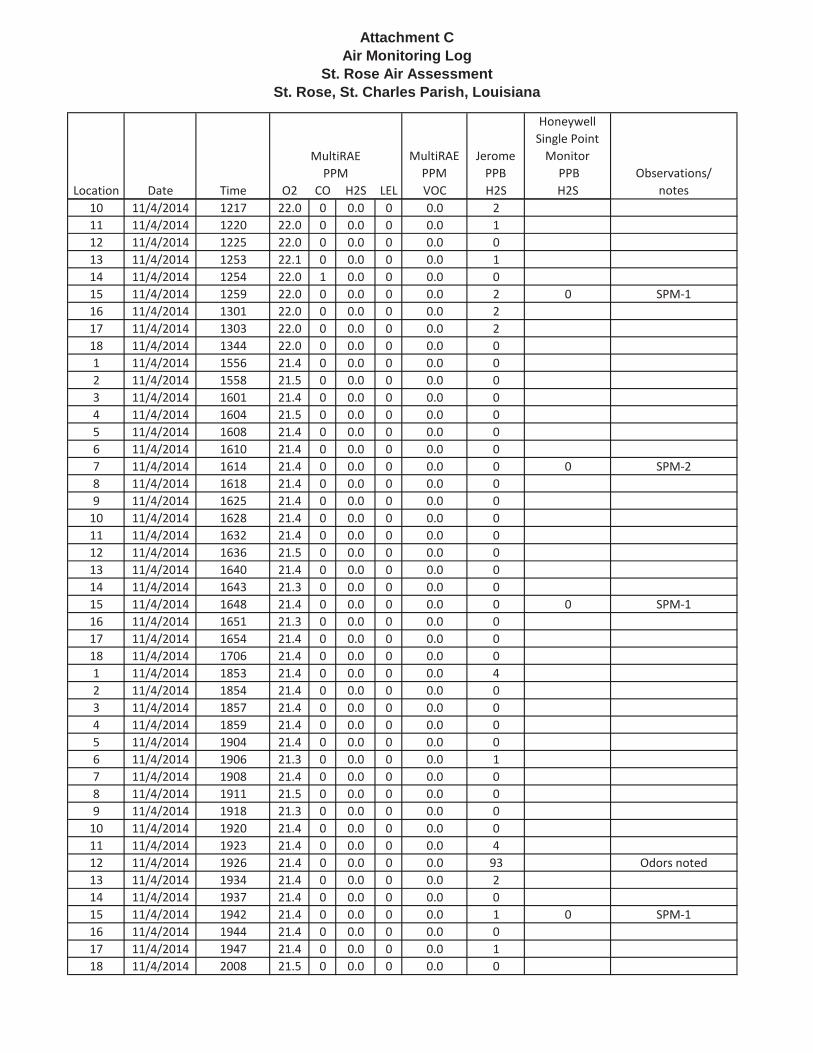
Attachment CAir Monitoring Log
St. Rose Air AssessmentSt. Rose, St. Charles Parish, Louisiana
MultiRAEPPM
JeromePPB
HoneywellSingle PointMonitorPPB Observations/
Location Date Time O2 CO H2S LEL VOC H2S H2S notes
MultiRAEPPM
10 11/4/2014 1217 22.0 0 0.0 0 0.0 211 11/4/2014 1220 22.0 0 0.0 0 0.0 112 11/4/2014 1225 22.0 0 0.0 0 0.0 013 11/4/2014 1253 22.1 0 0.0 0 0.0 114 11/4/2014 1254 22.0 1 0.0 0 0.0 015 11/4/2014 1259 22.0 0 0.0 0 0.0 2 0 SPM 116 11/4/2014 1301 22.0 0 0.0 0 0.0 217 11/4/2014 1303 22.0 0 0.0 0 0.0 218 11/4/2014 1344 22.0 0 0.0 0 0.0 01 11/4/2014 1556 21.4 0 0.0 0 0.0 02 11/4/2014 1558 21.5 0 0.0 0 0.0 03 11/4/2014 1601 21.4 0 0.0 0 0.0 04 11/4/2014 1604 21.5 0 0.0 0 0.0 05 11/4/2014 1608 21.4 0 0.0 0 0.0 06 11/4/2014 1610 21.4 0 0.0 0 0.0 07 11/4/2014 1614 21.4 0 0.0 0 0.0 0 0 SPM 28 11/4/2014 1618 21.4 0 0.0 0 0.0 09 11/4/2014 1625 21.4 0 0.0 0 0.0 010 11/4/2014 1628 21.4 0 0.0 0 0.0 011 11/4/2014 1632 21.4 0 0.0 0 0.0 012 11/4/2014 1636 21.5 0 0.0 0 0.0 013 11/4/2014 1640 21.4 0 0.0 0 0.0 014 11/4/2014 1643 21.3 0 0.0 0 0.0 015 11/4/2014 1648 21.4 0 0.0 0 0.0 0 0 SPM 116 11/4/2014 1651 21.3 0 0.0 0 0.0 017 11/4/2014 1654 21.4 0 0.0 0 0.0 018 11/4/2014 1706 21.4 0 0.0 0 0.0 01 11/4/2014 1853 21.4 0 0.0 0 0.0 42 11/4/2014 1854 21.4 0 0.0 0 0.0 03 11/4/2014 1857 21.4 0 0.0 0 0.0 04 11/4/2014 1859 21.4 0 0.0 0 0.0 05 11/4/2014 1904 21.4 0 0.0 0 0.0 06 11/4/2014 1906 21.3 0 0.0 0 0.0 17 11/4/2014 1908 21.4 0 0.0 0 0.0 08 11/4/2014 1911 21.5 0 0.0 0 0.0 09 11/4/2014 1918 21.3 0 0.0 0 0.0 010 11/4/2014 1920 21.4 0 0.0 0 0.0 011 11/4/2014 1923 21.4 0 0.0 0 0.0 412 11/4/2014 1926 21.4 0 0.0 0 0.0 93 Odors noted13 11/4/2014 1934 21.4 0 0.0 0 0.0 214 11/4/2014 1937 21.4 0 0.0 0 0.0 015 11/4/2014 1942 21.4 0 0.0 0 0.0 1 0 SPM 116 11/4/2014 1944 21.4 0 0.0 0 0.0 017 11/4/2014 1947 21.4 0 0.0 0 0.0 118 11/4/2014 2008 21.5 0 0.0 0 0.0 0
Attachment CAir Monitoring Log
St. Rose Air AssessmentSt. Rose, St. Charles Parish, Louisiana
MultiRAEPPM
JeromePPB
HoneywellSingle PointMonitorPPB Observations/
Location Date Time O2 CO H2S LEL VOC H2S H2S notes
MultiRAEPPM
1 11/4/2014 2116 21.5 0 0.0 0 0.0 02 11/4/2014 2118 21.5 0 0.0 0 0.0 03 11/4/2014 2119 21.5 0 0.0 0 0.0 04 11/4/2014 2121 21.5 0 0.0 0 0.0 05 11/4/2014 2124 21.5 0 0.0 0 0.0 06 11/4/2014 2126 21.4 0 0.0 0 0.0 07 11/4/2014 2128 21.4 0 0.0 0 0.0 08 11/4/2014 2130 21.4 0 0.0 0 0.0 09 11/4/2014 2134 21.4 0 0.0 0 0.0 010 11/4/2014 2135 21.4 0 0.0 0 0.0 011 11/4/2014 2137 21.4 0 0.0 0 0.0 012 11/4/2014 2139 21.4 0 0.0 0 0.0 013 11/4/2014 2149 21.4 0 0.0 0 0.0 014 11/4/2014 2151 21.4 0 0.0 0 0.0 415 11/4/2014 2157 21.4 0 0.0 0 0.0 3 0 SPM 116 11/4/2014 2200 21.4 0 0.0 0 0.0 017 11/4/2014 2202 21.5 0 0.0 0 0.0 018 11/4/2014 2209 21.5 0 0.0 0 0.0 01 11/5/2014 0032 21.3 0 0.0 0 0.0 02 11/5/2014 0034 21.3 0 0.0 0 0.0 13 11/5/2014 0035 21.3 0 0.0 0 0.0 04 11/5/2014 0036 21.4 0 0.0 0 0.0 05 11/5/2014 0040 21.4 0 0.0 0 0.0 16 11/5/2014 0042 21.3 0 0.0 0 0.0 17 11/5/2014 0043 21.3 0 0.0 0 0.0 38 11/5/2014 0045 21.3 0 0.0 0 0.0 29 11/5/2014 0049 21.3 0 0.0 0 0.0 310 11/5/2014 0050 21.3 0 0.0 0 0.0 411 11/5/2014 0052 21.3 0 0.0 0 0.0 412 11/5/2014 0053 21.6 0 0.0 0 0.0 013 11/5/2014 0100 21.3 0 0.0 0 0.0 014 11/5/2014 0102 21.3 0 0.0 0 0.0 015 11/5/2014 0107 21.3 0 0.0 0 0.0 2 0 SPM 116 11/5/2014 0109 21.3 0 0.0 0 0.0 217 11/5/2014 0110 21.2 0 0.0 0 0.0 118 11/5/2014 0118 21.3 0 0.0 0 0.0 01 11/5/2014 0355 21.3 0 0.0 0 0.0 02 11/5/2014 0356 21.3 0 0.0 0 0.0 03 11/5/2014 0358 21.3 0 0.0 0 0.0 04 11/5/2014 0359 21.3 0 0.0 0 0.0 05 11/5/2014 0402 21.6 0 0.0 0 0.0 06 11/5/2014 0404 21.3 0 0.0 0 0.0 07 11/5/2014 0406 21.3 0 0.0 0 0.0 08 11/5/2014 0408 21.3 0 0.0 0 0.0 09 11/5/2014 0411 21.3 0 0.0 0 0.0 0
Attachment CAir Monitoring Log
St. Rose Air AssessmentSt. Rose, St. Charles Parish, Louisiana
MultiRAEPPM
JeromePPB
HoneywellSingle PointMonitorPPB Observations/
Location Date Time O2 CO H2S LEL VOC H2S H2S notes
MultiRAEPPM
10 11/5/2014 0413 21.3 0 0.0 0 0.0 011 11/5/2014 0414 21.3 0 0.0 0 0.0 012 11/5/2014 0416 21.3 0 0.0 0 0.0 013 11/5/2014 0423 21.3 0 0.0 0 0.0 014 11/5/2014 0424 21.3 0 0.0 0 0.0 015 11/5/2014 0430 21.3 0 0.0 0 0.0 4 0 SPM 116 11/5/2014 0432 21.2 0 0.0 0 0.0 217 11/5/2014 0433 21.2 0 0.0 0 0.0 018 11/5/2014 0441 21.3 0 0.0 0 0.0 01 11/5/2014 0719 21.4 0 0.0 0 0.0 02 11/5/2014 0720 21.6 0 0.0 0 0.0 03 11/5/2014 0721 21.3 0 0.0 0 0.0 04 11/5/2014 0723 21.2 0 0.0 0 0.0 05 11/5/2014 0726 21.2 0 0.0 0 0.0 06 11/5/2014 0728 21.3 0 0.0 0 0.0 07 11/5/2014 0730 21.3 0 0.0 0 0.0 08 11/5/2014 0731 21.3 0 0.0 0 0.0 09 11/5/2014 0735 21.2 0 0.0 0 0.0 010 11/5/2014 0737 21.3 0 0.0 0 0.0 011 11/5/2014 0739 21.3 0 0.0 0 0.0 012 11/5/2014 0741 21.3 0 0.0 0 0.0 0 Odors noted after
initial reading onJerome, resample @
0745 240ppb13 11/5/2014 0750 21.4 0 0.0 0 0.0 314 11/5/2014 0751 21.5 0 0.0 0 0.0 115 11/5/2014 0756 21.5 0 0.0 0 0.0 0 0 SPM 116 11/5/2014 0757 21.5 0 0.0 0 0.0 017 11/5/2014 0759 21.5 0 0.0 0 0.0 118 11/5/2014 0807 21.3 0 0.0 0 0.0 01 11/5/2014 1059 21.5 0 0.0 0 0.0 52 11/5/2014 1101 21.5 0 0.0 0 0.0 23 11/5/2014 1103 21.4 0 0.0 0 0.0 04 11/5/2014 1105 21.4 0 0.0 0 0.0 05 11/5/2014 1111 21.4 0 0.0 0 0.0 06 11/5/2014 1113 21.4 0 0.0 0 0.0 07 11/5/2014 1116 21.5 0 0.0 0 0.0 1 0 SPM 28 11/5/2014 1122 21.3 0 0.0 0 0.0 09 11/5/2014 1127 21.4 0 0.0 0 0.0 010 11/5/2014 1130 21.3 0 0.0 0 0.0 011 11/5/2014 1134 21.3 0 0.0 0 0.0 0
Attachment CAir Monitoring Log
St. Rose Air AssessmentSt. Rose, St. Charles Parish, Louisiana
MultiRAEPPM
JeromePPB
HoneywellSingle PointMonitorPPB Observations/
Location Date Time O2 CO H2S LEL VOC H2S H2S notes
MultiRAEPPM
12 11/5/2014 1137 21.3 0 0.0 0 0.0 3 LDEQ and EPA walkdirectly
south/downwind offacility on RR tracks toair monitor. DetectH2S on Jerome, 15
ppb13 11/5/2014 1230 21.6 0 0.0 0 0.0 0 Regenerate Jerome
sensor14 11/5/2014 1232 21.6 0 0.0 0 0.0 015 11/5/2014 1236 21.6 0 0.0 0 0.0 0 0 SPM 116 11/5/2014 1239 21.6 0 0.0 0 0.0 017 11/5/2014 1242 21.7 0 0.0 0 0.0 018 11/5/2014 1252 21.7 0 0.0 0 0.0 01 11/5/2014 1551 21.6 0 0.0 0 0.0 02 11/5/2014 1553 21.6 0 0.0 0 0.0 03 11/5/2014 1555 21.6 0 0.0 0 0.0 04 11/5/2014 1558 21.7 0 0.0 0 0.0 05 11/5/2014 1603 21.7 0 0.0 0 0.0 16 11/5/2014 1606 21.5 0 0.0 0 0.0 07 11/5/2014 1609 21.5 0 0.0 0 0.0 0 0 SPM 28 11/5/2014 1622 21.6 0 0.0 0 0.0 09 11/5/2014 1629 21.6 0 0.0 0 0.0 010 11/5/2014 1631 21.6 0 0.0 0 0.0 011 11/5/2014 1635 21.6 0 0.0 0 0.0 012 11/5/2014 1639 21.6 0 0.0 0 0.0 013 11/5/2014 1646 21.6 0 0.0 0 0.0 214 11/5/2014 1648 21.6 0 0.0 0 0.0 015 11/5/2014 1652 21.9 0 0.0 0 0.0 5 0 SPM 116 11/5/2014 1655 21.6 0 0.0 0 0.0 117 11/5/2014 1657 21.6 0 0.0 0 0.0 118 11/5/2014 1715 21.6 0 0.0 0 0.0 11 11/5/2014 1839 21.5 0 0.0 0 0.0 22 11/5/2014 1841 21.6 0 0.0 0 0.0 33 11/5/2014 1843 21.6 0 0.0 0 0.0 04 11/5/2014 1846 21.5 0 0.0 0 0.0 05 11/5/2014 1850 21.5 0 0.0 0 0.0 26 11/5/2014 1853 21.4 0 0.0 0 0.0 37 11/5/2014 1856 21.4 0 0.0 0 0.0 18 11/5/2014 1858 21.5 0 0.0 0 0.0 09 11/5/2014 1904 21.5 0 0.0 0 0.0 110 11/5/2014 1906 21.4 0 0.0 0 0.0 111 11/5/2014 1910 21.4 0 0.0 0 0.0 412 11/5/2014 1913 21.5 0 0.0 0 0.0 113 11/5/2014 1919 21.5 0 0.0 0 0.0 3
Attachment CAir Monitoring Log
St. Rose Air AssessmentSt. Rose, St. Charles Parish, Louisiana
MultiRAEPPM
JeromePPB
HoneywellSingle PointMonitorPPB Observations/
Location Date Time O2 CO H2S LEL VOC H2S H2S notes
MultiRAEPPM
14 11/5/2014 1921 21.5 0 0.0 0 0.0 415 11/5/2014 1944 21.6 0 0.0 0 0.0 2 0 SPM 116 11/5/2014 1947 21.6 0 0.0 0 0.0 217 11/5/2014 1950 21.6 0 0.0 0 0.0 0 Odor noted18 11/5/2014 2000 21.6 0 0.0 0 0.0 31 11/5/2014 2040 21.6 0 0.0 0 0.0 12 11/5/2014 2041 21.6 0 0.0 0 0.0 13 11/5/2014 2043 21.6 0 0.0 0 0.0 04 11/5/2014 2044 21.6 0 0.0 0 0.0 05 11/5/2014 2048 21.6 0 0.0 0 0.0 06 11/5/2014 2050 21.6 0 0.0 0 0.0 17 11/5/2014 2051 21.6 0 0.0 0 0.0 08 11/5/2014 2053 21.8 0 0.0 0 0.0 09 11/5/2014 2057 21.7 0 0.0 0 0.0 010 11/5/2014 2059 21.6 0 0.0 0 0.0 211 11/5/2014 2101 21.6 0 0.0 0 0.0 112 11/5/2014 2107 21.6 0 0.0 0 0.0 17 Strong odors present
13 11/5/2014 2114 21.6 0 0.0 0 0.0 214 11/5/2014 2115 21.7 0 0.0 0 0.0 215 11/5/2014 2123 21.6 0 0.0 0 0.0 1 0 SPM 116 11/5/2014 2125 21.6 0 0.0 0 0.0 417 11/5/2014 2127 21.6 0 0.0 0 0.0 218 11/5/2014 2135 21.6 0 0.0 0 0.0 01 11/6/2014 0021 21.3 0 0.0 0 0.0 02 11/6/2014 0023 21.4 0 0.0 0 0.0 23 11/6/2014 0024 21.5 0 0.0 0 0.0 14 11/6/2014 0026 21.4 0 0.0 0 0.0 05 11/6/2014 0029 21.4 0 0.0 0 0.0 26 11/6/2014 0031 21.5 0 0.0 0 0.0 37 11/6/2014 0033 21.5 0 0.0 0 0.0 18 11/6/2014 0035 21.4 0 0.0 0 0.0 09 11/6/2014 0038 21.4 0 0.0 0 0.0 210 11/6/2014 0040 21.4 0 0.0 0 0.0 311 11/6/2014 0042 21.4 0 0.0 0 0.0 312 11/6/2014 0043 21.4 0 0.0 0 0.0 013 11/6/2014 0050 21.5 0 0.0 0 0.0 214 11/6/2014 0051 21.4 0 0.0 0 0.0 215 11/6/2014 0058 21.4 0 0.0 0 0.0 2 0 SPM 116 11/6/2014 0059 21.4 0 0.0 0 0.0 117 11/6/2014 0101 21.4 0 0.0 0 0.0 018 11/6/2014 0109 21.5 0 0.0 0 0.0 01 11/6/2014 0351 21.4 0 0.0 0 0.0 02 11/6/2014 0352 21.5 0 0.0 0 0.0 03 11/6/2014 0354 21.5 0 0.0 0 0.0 0
Attachment CAir Monitoring Log
St. Rose Air AssessmentSt. Rose, St. Charles Parish, Louisiana
MultiRAEPPM
JeromePPB
HoneywellSingle PointMonitorPPB Observations/
Location Date Time O2 CO H2S LEL VOC H2S H2S notes
MultiRAEPPM
4 11/6/2014 0355 21.5 0 0.0 0 0.0 05 11/6/2014 0358 21.5 0 0.0 0 0.0 06 11/6/2014 0400 21.5 0 0.0 0 0.0 07 11/6/2014 0401 21.5 0 0.0 0 0.0 08 11/6/2014 0403 21.5 0 0.0 0 0.0 09 11/6/2014 0407 21.4 0 0.0 0 0.0 010 11/6/2014 0407 21.4 0 0.0 0 0.0 011 11/6/2014 0409 21.4 0 0.0 0 0.0 012 11/6/2014 0411 21.5 0 0.0 0 0.0 013 11/6/2014 0417 21.4 0 0.0 0 0.0 014 11/6/2014 0418 21.4 0 0.0 0 0.0 015 11/6/2014 0423 21.5 0 0.0 0 0.0 0 0 SPM 116 11/6/2014 0424 21.4 0 0.0 0 0.0 017 11/6/2014 0426 21.5 0 0.0 0 0.0 018 11/6/2014 0433 21.6 0 0.0 0 0.0 01 11/6/2014 0646 21.7 0 0.0 0 0.0 02 11/6/2014 0647 21.6 0 0.0 0 0.0 03 11/6/2014 0649 21.6 0 0.0 0 0.0 04 11/6/2014 0650 21.6 0 0.0 0 0.0 05 11/6/2014 0653 21.5 0 0.0 0 0.0 06 11/6/2014 0655 21.5 0 0.0 0 0.0 07 11/6/2014 0657 21.5 0 0.0 0 0.0 08 11/6/2014 0659 21.5 0 0.0 0 0.0 09 11/6/2014 0703 21.6 0 0.0 0 0.0 010 11/6/2014 0706 21.5 0 0.0 0 0.0 011 11/6/2014 0709 21.5 0 0.0 0 0.0 012 11/6/2014 0711 21.5 0 0.0 0 0.0 013 11/6/2014 0716 21.5 0 0.0 0 0.0 114 11/6/2014 0718 21.6 0 0.0 0 0.0 115 11/6/2014 0723 21.6 0 0.0 0 0.0 0 0 SPM 116 11/6/2014 0725 21.5 0 0.0 0 0.0 017 11/6/2014 0726 21.6 0 0.0 0 0.0 018 11/6/2014 0736 21.6 0 0.0 0 0.0 01 11/6/2014 0954 21.7 0 0.0 0 0.0 02 11/6/2014 0959 21.6 0 0.0 0 0.0 03 11/6/2014 1001 21.5 0 0.0 0 0.0 04 11/6/2014 1003 21.6 0 0.0 0 0.0 05 11/6/2014 1008 21.7 0 0.0 0 0.0 06 11/6/2014 1010 21.5 0 0.0 0 0.0 07 11/6/2014 1013 21.5 0 0.0 0 0.0 0 0 SPM 28 11/6/2014 1019 21.6 0 0.0 0 0.0 09 11/6/2014 1025 21.6 0 0.0 0 0.0 010 11/6/2014 1028 21.6 0 0.0 0 0.0 011 11/6/2014 1032 21.6 0 0.0 0 0.0 012 11/6/2014 1035 21.6 0 0.0 0 0.0 0
Attachment CAir Monitoring Log
St. Rose Air AssessmentSt. Rose, St. Charles Parish, Louisiana
MultiRAEPPM
JeromePPB
HoneywellSingle PointMonitorPPB Observations/
Location Date Time O2 CO H2S LEL VOC H2S H2S notes
MultiRAEPPM
13 11/6/2014 1051 21.7 0 0.0 0 0.0 014 11/6/2014 1054 21.6 0 0.0 0 0.0 015 11/6/2014 1104 21.6 0 0.0 0 0.0 0 0 SPM 116 11/6/2014 1108 21.6 0 0.0 0 0.0 017 11/6/2014 1111 21.7 0 0.0 0 0.0 018 11/6/2014 1129 21.6 0 0.0 0 0.0 01 11/6/2014 1534 21.7 0 0.0 0 0.0 02 11/6/2014 1536 21.7 0 0.0 0 0.0 03 11/6/2014 1538 21.7 0 0.0 0 0.0 04 11/6/2014 1541 21.7 0 0.0 0 0.0 05 11/6/2014 1546 21.8 0 0.0 0 0.0 06 11/6/2014 1549 21.7 0 0.0 0 0.0 07 11/6/2014 1554 21.7 0 0.0 0 0.0 0 0 SPM 28 11/6/2014 1557 21.9 0 0.0 0 0.0 09 11/6/2014 1617 21.8 0 0.0 0 0.0 010 11/6/2014 1604 21.7 0 0.0 0 0.0 011 11/6/2014 1608 21.7 0 0.0 0 0.0 012 11/6/2014 1612 21.7 0 0.0 0 0.0 313 11/6/2014 1620 21.7 0 0.0 0 0.0 014 11/6/2014 1623 21.7 0 0.0 0 0.0 015 11/6/2014 1632 21.7 0 0.0 0 0.0 0 0 SPM 116 11/6/2014 1634 21.7 0 0.0 0 0.0 017 11/6/2014 1636 21.7 0 0.0 0 0.0 018 11/6/2014 1647 22.1 0 0.0 0 0.0 01 11/6/2014 1844 21.7 0 0.0 0 0.0 02 11/6/2014 1846 21.7 0 0.0 0 0.0 03 11/6/2014 1848 21.7 0 0.0 0 0.0 04 11/6/2014 1851 21.6 0 0.0 0 0.0 05 11/6/2014 1855 21.6 0 0.0 0 0.0 06 11/6/2014 1858 21.7 0 0.0 0 0.0 07 11/6/2014 1902 21.9 0 0.0 0 0.0 08 11/6/2014 1904 21.7 0 0.0 0 0.0 09 11/6/2014 1910 21.7 0 0.0 0 0.0 010 11/6/2014 1911 21.7 0 0.0 0 0.0 011 11/6/2014 1914 21.9 0 0.0 0 0.0 012 11/6/2014 1917 21.8 0 0.0 0 0.0 013 11/6/2014 1923 21.7 0 0.0 0 0.0 014 11/6/2014 1925 21.7 0 0.0 0 0.0 115 11/6/2014 1930 21.7 0 0.0 0 0.0 0 0 SPM 116 11/6/2014 1932 21.8 0 0.0 0 0.0 017 11/6/2014 1935 22.0 0 0.0 0 0.0 018 11/6/2014 1945 21.8 0 0.0 0 0.0 01 11/6/2014 2046 21.8 0 0.0 0 0.0 02 11/6/2014 2048 21.9 0 0.0 0 0.0 03 11/6/2014 2049 21.8 0 0.0 0 0.0 0
Attachment CAir Monitoring Log
St. Rose Air AssessmentSt. Rose, St. Charles Parish, Louisiana
MultiRAEPPM
JeromePPB
HoneywellSingle PointMonitorPPB Observations/
Location Date Time O2 CO H2S LEL VOC H2S H2S notes
MultiRAEPPM
4 11/6/2014 2050 21.9 0 0.0 0 0.0 05 11/6/2014 2054 21.7 0 0.0 0 0.0 06 11/6/2014 2056 21.8 0 0.0 0 0.0 07 11/6/2014 2058 21.8 0 0.0 0 0.0 08 11/6/2014 2100 21.8 0 0.0 0 0.0 09 11/6/2014 2104 21.8 0 0.0 0 0.0 010 11/6/2014 2105 21.8 0 0.0 0 0.0 011 11/6/2014 2107 21.8 0 0.0 0 0.0 012 11/6/2014 2109 21.8 0 0.0 0 0.0 013 11/6/2014 2113 21.8 0 0.0 0 0.0 014 11/6/2014 2114 21.9 0 0.0 0 0.0 015 11/6/2014 2118 21.8 0 0.0 0 0.0 0 0 SPM 116 11/6/2014 2119 21.8 0 0.0 0 0.0 017 11/6/2014 2120 21.8 0 0.0 0 0.0 018 11/6/2014 2128 21.8 0 0.0 0 0.0 01 11/7/2014 0047 21.6 0 0.0 0 0.0 02 11/7/2014 0048 21.7 0 0.0 0 0.0 03 11/7/2014 0050 22.0 0 0.0 0 0.0 04 11/7/2014 0051 21.7 0 0.0 0 0.0 05 11/7/2014 0053 21.6 0 0.0 0 0.0 06 11/7/2014 0057 21.6 0 0.0 0 0.0 07 11/7/2014 0058 21.6 0 0.0 0 0.0 08 11/7/2014 0100 21.6 0 0.0 0 0.0 09 11/7/2014 0107 21.6 0 0.0 0 0.0 010 11/7/2014 0108 21.6 0 0.0 0 0.0 011 11/7/2014 0110 21.6 0 0.0 0 0.0 012 11/7/2014 111 22.0 0 0.0 0 0.0 013 11/7/2014 115 21.6 0 0.0 0 0.0 014 11/7/2014 116 21.6 0 0.0 0 0.0 015 11/7/2014 119 21.6 0 0.0 0 0.0 0 0 SPM 116 11/7/2014 120 21.6 0 0.0 0 0.0 017 11/7/2014 122 21.6 0 0.0 0 0.0 018 11/7/2014 131 21.6 0 0.0 0 0.0 01 11/7/2014 516 21.6 0 0.0 0 0.0 02 11/7/2014 517 21.6 0 0.0 0 0.0 03 11/7/2014 518 21.6 0 0.0 0 0.1 04 11/7/2014 520 21.6 0 0.0 0 0.1 05 11/7/2014 523 21.6 0 0.0 0 0.1 06 11/7/2014 525 21.6 0 0.0 0 0.1 07 11/7/2014 526 21.7 0 0.0 0 0.1 08 11/7/2014 528 21.6 0 0.0 0 0.1 09 11/7/2014 532 21.6 0 0.0 0 0.1 0 Rebooted MultiRAE
after reading10 11/7/2014 533 21.6 0 0.0 0 0.0 011 11/7/2014 535 21.7 0 0.0 0 0.0 0
Attachment CAir Monitoring Log
St. Rose Air AssessmentSt. Rose, St. Charles Parish, Louisiana
MultiRAEPPM
JeromePPB
HoneywellSingle PointMonitorPPB Observations/
Location Date Time O2 CO H2S LEL VOC H2S H2S notes
MultiRAEPPM
12 11/7/2014 536 21.6 0 0.0 0 0.0 013 11/7/2014 540 21.6 0 0.0 0 0.0 014 11/7/2014 541 21.6 0 0.0 0 0.0 015 11/7/2014 544 21.6 0 0.0 0 0.0 0 0 SPM 116 11/7/2014 545 21.6 0 0.0 0 0.0 017 11/7/2014 547 21.6 0 0.0 0 0.0 018 11/7/2014 556 21.8 0 0.0 0 0.0 01 11/7/2014 728 21.7 0 0.0 0 0.0 02 11/7/2014 730 21.7 0 0.0 0 0.0 03 11/7/2014 732 21.7 0 0.0 0 0.0 04 11/7/2014 734 21.7 0 0.0 0 0.0 05 11/7/2014 738 21.7 0 0.0 0 0.0 06 11/7/2014 741 21.6 0 0.0 0 0.0 07 11/7/2014 744 21.7 0 0.0 0 0.0 0 4 Low level alarm
soundingSPM 2
8 11/7/2014 748 21.7 0 0.0 0 0.0 09 11/7/2014 754 21.7 0 0.0 0 0.0 010 11/7/2014 756 21.7 0 0.0 0 0.0 011 11/7/2014 759 21.7 0 0.0 0 0.0 012 11/7/2014 801 21.7 0 0.0 0 0.0 013 11/7/2014 807 21.8 0 0.0 0 0.0 014 11/7/2014 809 21.7 0 0.0 0 0.0 015 11/7/2014 822 21.7 0 0.0 0 0.0 0 0 SPM 116 11/7/2014 824 21.8 0 0.0 0 0.0 017 11/7/2014 826 21.9 0 0.0 0 0.0 018 11/7/2014 915 22.0 0 0.0 0 0.0 0

Attachment DAir Sampling Analytical Results
St. Rose Air Assessment
Analyte CAS.NO Units
Monitoring Location12
10:00 11/04/2014through
10:00 11/05/2014
Monitoring Location12
10:15 11/05/2014through
10:30 11/06/2014
Background MonitoringLocation 15
10:30 11/04/2014through
10:30 11/05/2014
Background MonitoringLocation 15
10:45 11/05/2014through
11:00 11/06/2014ASTM D 5504 12Hydrogen Sulfide 7783 06 4 μg/m3 11 U 9.1 U 9.1 U 17 UTO 151,1,2 Trichlorotrifluoroethane 76 13 1 μg/m3 0.51 J 0.51 J 0.52 J 0.49 J1,2,4 Trimethylbenzene 95 63 6 μg/m3 0.8 U 0.65 U 0.2 J 0.52 J2 Butanone (MEK) 78 93 3 μg/m3 0.51 J 0.48 J 0.56 J 0.9 J2 Propanol (Isopropyl Alcohol) 67 63 0 μg/m3 1.8 J 0.69 J 1.4 J 1.8 JAcetone 67 64 1 μg/m3 5.3 J 4.4 J 5.2 J 7.6 JAcrolein 107 02 8 μg/m3 3.2 U 2.6 U 0.39 J 5 Ualpha Pinene 80 56 8 μg/m3 0.8 U 0.81 0.65 U 0.53 JBenzene 71 43 2 μg/m3 0.79 J 0.41 J 0.89 0.77 JCarbon Tetrachloride 56 23 5 μg/m3 0.46 J 0.46 J 0.47 J 0.46 JChloromethane 74 87 3 μg/m3 0.39 J 0.37 J 0.41 J 0.44 JCyclohexane 110 82 7 μg/m3 0.65 J 1.3 U 0.52 J 0.83 JDichlorodifluoromethane (CFC 12) 75 71 8 μg/m3 2.2 2.2 2.2 2.1Dichloromethane (Methylene Chloride) 75 09 2 μg/m3 0.44 J 0.31 J 0.3 J 1.3 Ud Limonene 5989 27 5 μg/m3 0.8 U 0.21 J 0.65 U 1.3 UEthanol 64 17 5 μg/m3 5.1 J 2.4 J 3.1 J 10 JEthyl Acetate 141 78 6 μg/m3 12 2.2 4.8 8Ethylbenzene 100 41 4 μg/m3 0.8 U 0.65 U 0.65 U 0.45 Jm,p Xylenes 179601 23 1 μg/m3 1.6 U 0.58 J 0.49 J 1.5 JNaphthalene 91 20 3 μg/m3 0.8 U 0.3 J 0.65 U 1.3 Un Heptane 142 82 5 μg/m3 0.8 U 0.65 U 0.43 J 0.9 Jn Hexane 110 54 3 μg/m3 0.77 J 0.61 J 0.61 J 2.3n Nonane 111 84 2 μg/m3 0.32 J 0.22 J 0.54 J 0.69 Jn Octane 111 65 9 μg/m3 0.8 U 0.65 U 0.55 J 0.72 Jo Xylene 95 47 6 μg/m3 0.8 U 0.24 J 0.2 J 0.56 JPropene 115 07 1 μg/m3 1.2 1.3 1.4 2.1Toluene 108 88 3 μg/m3 1.3 0.9 0.98 2.9Trichlorofluoromethane (CFC 11) 75 69 4 μg/m3 1.3 1.3 1.3 1.2 JTO 15 (TICs)1 Hexanol, 2 ethyl 104 76 7 μg/m3 ND 13 T ND ND2 Methylpropane 75 28 5 μg/m3 ND ND 3.8 T 7 TAcetic acid, 2 ethylhexyl ester 103 09 3 μg/m3 3.4 T 4.7 T ND NDButane 106 97 8 μg/m3 ND 2.6 T 3.9 T 6.7 TCyclotrisiloxane, hexamethyl 541 05 9 μg/m3 6.4 T 8.5 T 4.7 T NDPropane 74 98 6 μg/m3 3.9 T 3.4 T 5.6 T 7.4 TSilanediol, dimethyl 1066 42 8 μg/m3 6.6 T 8.1 T ND NDSilanol, trimethyl 1066 40 6 μg/m3 11 T ND 4.3 T 9.6 TSulfur Dioxide 7446 09 5 μg/m3 ND ND ND NDtert Butyldimethylsilanol 18173 64 3 μg/m3 ND 9.6 T ND ND
Qualifiers: J The result is an estimated concentration that is less than the method reporting limit but greater than or equal to the method detection limit.U Undetected, result is less than the method detection limitT Tentatively identified compoundsND Not detected
1 of 1 20406.012.005.0913.01
*
*Units of measure reported by the laboratory (μg/m³) differ from units utilized by ATSDR for MRLs (ppb).