u.s. department of the interior bruce …. department of the interior bruce babbitt, secretary ......
TRANSCRIPT

U.S. DEPARTMENT OF THE INTERIOR BRUCE BABBITT, Secretary
U.S. GEOLOGICAL SURVEY Gordon P. Eaton, Director
The use of trade, product, or firm names in this publication is for descriptive purposes only and does not imply endorsement by the U.S. Government.
For additional information Copies of this report canwrite to: be purchased from:
District Chief U.S. Geological SurveyU.S. Geological Survey, WRD Branch of Information Services10615 S.E. Cherry Blossom Drive Box 25286, Federal CenterPortland, Oregon 97216 Denver, Colorado 80225
Water-Quality, Streamflow, and Meteorological Data for the Tualatin River Basin, Oregon, 1991-93
By Micelis C. Doyle and James M. Caldwell
U.S. Geological Survey Open-File Report 96-173
Prepared in cooperation withUNIFIED SEWERAGE AGENCY OF WASHINGTON COUNTY
Portland, Oregon 1996

CONTENTS
Abstract..................................................................................................................................................................... 1Introduction.........................................^ 1
Purpose and Scope............................................................................................................................................3Study Area........................................................................................................................................................3Acknowledgments............................................................................................................................................5
Data Collection and Laboratory Analysis.................................................................................................................5Water-Quality-Sample Collection....................................................................................................................5
Surface Water....................................................................................................................................... 5Ground Water.......................................................................................................................................6
In-Channel Piezometers ...........................................................................................................6Domestic Wells ........................................................................................................................6
Discharge Measurement and Data Collection................................................................................................ 19Streamflow Data................................................................................................................................. 19Unified Sewerage Agency Wastewater-Treatment-Plant Discharge Data......................................... 19Withdrawal Rates at Major Diversion Points along the Main-Stem Tualatin River.......................... 19
Physical and Chemical Analyses of Water Samples......................................................................................23Field Measurements .......................................................................................................................................23Insolation Rates..............................................................................................................................................28Light-Extinction Coefficients......................................................................................................................... 28Four-Parameter Continuous Field Monitor at River Mile 3.4........................................................................28Meteorological Data from Tualatin Valley Irrigation District Agrimet Weather Station.............................. 28Biological Data...............................................................................................................................................29
Benthic Macroinvertebrates ...............................................................................................................29Phytoplankton....................................................................................................................................29Zooplankton .......................................................................................................................................29
Quality Assurance ..........................................................................................................................................30Laboratory Split Samples...................................................................................................................30Reference Samples.............................................................................................................................30Quality Assurance of Ground-Water Samples................................................................................... 31Calibration of Multiparameter Water-Quality Field Probes ..............................................................31Calibration of Quantum Sensors........................................................................................................31Calibration of Four-Parameter Continuous Field Monitor................................................................. 31Quality Assurance for Biochemical Oxygen Demand Samples ........................................................ 32Quality Assurance for Biological Samples........................................................................................32
References Cited .....................................................................................................................................................32Supplemental Data Tables.......................................................................................................................................33Appendix 1 Data Presentation..............................................................................................................................41Appendix 2 USGS and USA Station-Numbering Systems..................................................................................49
Mi

PLATE
(Plate is in pocket)
1. Map showing surface-water, ground-water, and meteorological data-collection sites in the Tualatin River Basin, Oregon
COMPACT DISK (CD-ROM)(Compact Disk is in pocket)
Repui I text, plalc 1, and-*water-quality, streamflow, and meteorological data
FIGURES
1. Map showing the Tualatin River Basin, Oregon.......................................................................................................... 22. Schematic diagram showing relative positions of selected tributaries, diversions, and stream-gaging
stations in the Tualatin River Basin, Oregon.............................................................................................................. 22
TABLES
1. Data files included on CD-ROM................................................................................................................................. 42. Main-stem Tualatin River sampling sites.................................................................................................................... 73. Tualatin River Basin tributary sampling sites............................................................................................................. 84. Intermittently sampled Tualatin River Basin tributary sites........................................................................................ 95. Frequency analysis of selected water-quality parameters with associated WATSTORE parameter
codes at selected sites on the main-stem Tualatin River........................................................................................... 106. Frequency of analysis of selected water-quality parameters with associated WATSTORE
parameter codes at selected tributary sites, Tualatin River Basin, Oregon............................................................... 117. Codes and definitions of sample-collection methods................................................................................................ 128. Constituents analyzed in surface-water samples from the Tualatin River Basin, Oregon........................................ 149. Description and locations of ground-water sampling sites, Tualatin River Basin, Oregon...................................... 16
10. Constituents analyzed in ground-water samples from the Tualatin River Basin, Oregon........................................ 1811. Main-stem Tualatin River sites for which there is continuous discharge record available during
1991^3 ................................................................12. Tualatin River tributary sites for which there is continuous discharge record available during
1991-93........................................................_13. Unified Sewerage Agency waste water-treatment facilities for which there is discharge data
available during 1991-93 .......................................................................................................................................... 2114. Diversion stations on the main-stem Tualatin River................................................................................................. 2115. Codes for collecting and analyzing agencies............................................................................................................. 2316. Laboratory methods used to analyze water samples from the Tualatin River Basin, Oregon .................................. 2417. Codes for quality-assurance data files....................................................................................................................... 3018. Tualatin River invertebrate sampling: May 1992, river mile 4.3 to river mile 11.6................................................. 3519. Tualatin River invertebrate sampling: May 1992, river mile 16.3 to river mile 63.9............................................... 3620. Tualatin River invertebrate sampling: November 1992, river mile 4.3 to river mile 10.0........................................ 37
iv
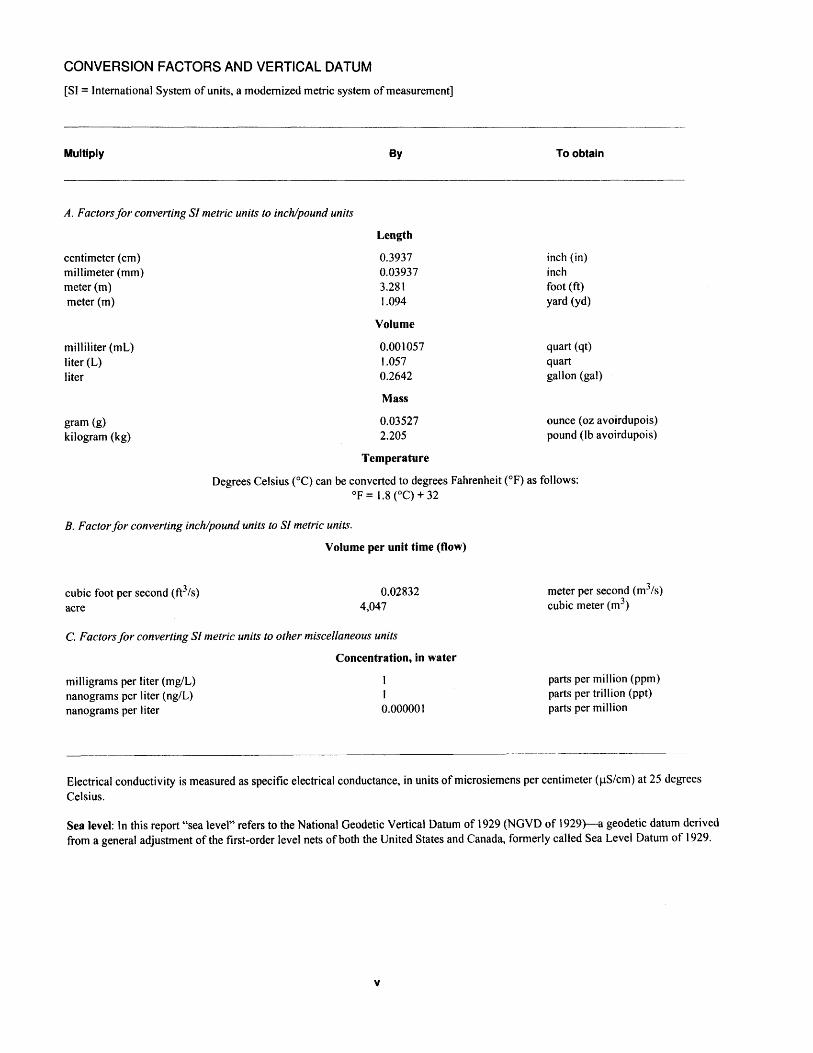
CONVERSION FACTORS AND VERTICAL DATUM
[SI = International System of units, a modernized metric system of measurement]
Multiply By To obtain
A. Factors for converting SI metric units to inch/pound units
centimeter (cm) millimeter (mm) meter (m) meter (m)
milliliter(mL) liter (L) liter
gram (g) kilogram (kg)
Length
0.3937 0.03937 3.281 1.094
Volume
0.001057 1.057 0.2642
Mass
0.03527 2.205
inch (in) inch foot (ft) yard (yd)
quart (qt) quart gallon (gal)
ounce (oz avoirdupois) pound (Ib avoirdupois)
Temperature
Degrees Celsius (°C) can be converted to degrees Fahrenheit (°F) as follows: °F=1.8(°C) + 32
B. Factor for converting inch/pound units to SI metric units.
Volume per unit time (flow)
cubic foot per second (ft /s) acre
0.028324,047
C. Factors for converting SI metric units to other miscellaneous units
Concentration, in water
milligrams per liter (mg/L) nanograms per liter (ng/L) nanograms per liter
1
0.000001
meter per second (m /s) cubic meter (m )
parts per million (ppm) parts per trillion (ppt) parts per million
Electrical conductivity is measured as specific electrical conductance, in units of microsiemens per centimeter ((iS/cm) at 25 degrees Celsius.
Sea level: In this report "sea level" refers to the National Geodetic Vertical Datum of 1929 (NGVD of 1929} a geodetic datum derived from a general adjustment of the first-order level nets of both the United States and Canada, formerly called Sea Level Datum of 1929.
Water-Quality, Streamflow, and Meteorological Data for the Tualatin River Basin, Oregon, 1991-93By Micelis C. Doyle and James M. Caldwell
Abstract
Surface-water-quality data, ground- water-quality data, streamflow data, field measurements, aquatic-biology data, meteoro logical data, and quality-assurance data were collected in the Tualatin River Basin from 1991 to 1993 by the U.S. Geological Survey (USGS) and the Unified Sewerage Agency of Washington County, Oregon (USA). The data from that study, which are part of this report, are presented in American Standard Code for Information Interchange (ASCII) format in subject-specific data files on a Compact Disk- Read Only Memory (CD-ROM). The text of this report describes the objectives of the study, the location of sampling sites, sample- collection and processing techniques, equip ment used, laboratory analytical methods, and quality-assurance procedures. The data files on CD-ROM contain the analytical results of water samples collected in the Tualatin River Basin, streamflow measurements of the main- stem Tualatin River and its major tributaries, flow data from the USA waste- water-treatment plants, flow data from stations that divert water from the main-stem Tualatin River, aquatic- biology data, and meteoro- logical data from the Tualatin Valley Irrigation District (TVID) Agrimet Weather Station located in Verboort, Oregon. Specific infor-mation regarding the contents of each data file is given in the text. The data files use a series of letter codes that
distinguish each line of data. These codes are defined in data tables accompanying the text. Presenting data on CD-ROM offers several advantages: (1) the data can be accessed easily and manipulated by computers, (2) the data can be distributed readily over computer networks, and (3) the data may be more easily transported and stored than a large printed report. These data have been used by the USGS to (1) identify the sources, transport, and fate of nutrients in the Tualatin River Basin, (2) quantify relations among nutrient loads, algal growth, low dissolved-oxygen concentrations, and high pH, and (3) develop and calibrate a water-quality model that allows managers to test options for alleviating water-quality problems.
INTRODUCTION
High nutrient concentrations in the Tualatin River Basin (fig. 1, pi. 1) can sometimes lead to nuisance levels of algal growth. These algal blooms may result in low dissolved-oxygen (DO) concen trations and high pH levels, which are potentially hazardous to aquatic organisms. The Tualatin River Basin study is a cooperative project between the U.S. Geological Survey (USGS) and the Unified Sewerage Agency of Washington County (USA) to determine the sources and effects of nutrient loads on the water quality of the Tualatin River during summer low-flow conditions. USA monitors the effluent from its wastewater-treatment facilities as well as the flow and water quality of the Tualatin
123°22'30" 123° 15' 123° 00' 122°45' 122°37'30"
45° 45' h-
45°30' \
45° 15'
JTILLAMOOKf^
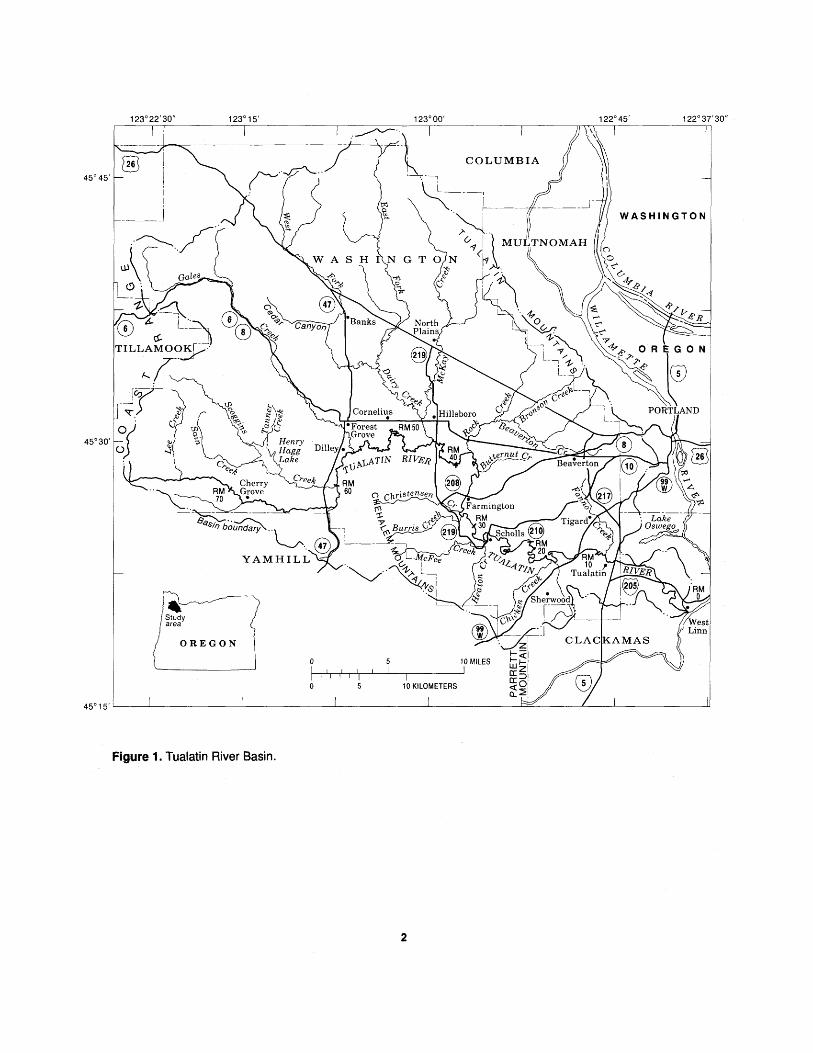
Figure 1. Tualatin River Basin.

River. State and local agencies have implemented water-quality control activities and programs in their efforts to comply with the total maximum daily loads (TMDLs) imposed in compliance with section 303 of the Clean Water Act (CWA) of 1972. TMDLs are established for water when minimum treatment controls for point sources are not stringent enough to meet established instream water-quality standards. To predict the effective ness of the water-quality-management options available for the Tualatin River, water managers need an understanding of the river's water-quality characteristics and dynamics, as well as a pre dictive tool that can aid in the decision-making process.
To meet those needs, the project was designed to accomplish the following objectives: (1) identify the sources and fate of nutrients in the river, (2) quantify relations among nutrient loads, algal growth, dissolved-oxygen concentrations, and pH levels, and (3) develop and calibrate a water- quality model that allows managers to test options for alleviating water-quality problems in the Tualatin River.
Purpose and Scope
The purpose of this report is to present the data collected during the cooperative study of the Tualatin River Basin by the USGS and USA. The report documents the sampling sites, field- measurement techniques, sampling techniques, laboratory-analysis techniques, and the results of an ongoing quality-assurance program. The report also contains field measurements and analytical and quality-control data from main-stem Tualatin River sites, major tributary sites, ground-water sites, and USA wastewater-treatment facilities. The data were collected between January 1991 and December 1993; additional ground-water data were collected in 1990 and 1994. Data in this report may be used by State and local authorities in their efforts to measure compliance with the TMDLs established for the Tualatin River. These data may also be used by water managers to determine whether nutrient reduction plans for the Tualatin River are effective.
The data collected during this study are stored in subject-specific data files on a Compact Disk-Read Only Memory (CD-ROM) in American Standard Code for Information Interchange
(ASCII) format, readable on DOS, UNIX, and Mac intosh platforms. The data files stored on CD-ROM are listed and briefly described in table 1; data formats are detailed in Appendix 1. Presenting the data in digital ASCII files rather than in formatted tables has several advantages: (1) the data can be easily accessed for computer applications, (2) the data can be distributed readily over computer net works, and (3) the data are easier to store and trans port on CD-ROM compared to a large, printed report.
Study Area
The Tualatin River Basin (fig. 1 and pi. 1) is approximately 43 miles long and 29 miles wide and has an area of about 712 square miles. The Tualatin River Basin is a subbasin of the Willamette River Basin and is located west of Portland. The Tualatin River drains most of Washington County and small areas of Multnomah, Clackamas, Yamhill, Tillamook, and Columbia Counties. The basin is bounded by the Coast Range on the west and northwest, the Chehalem Mountains and Parrett Mountain on the south, and the Tualatin Mountains on the east and northeast. For most of its length, the Tualatin River is slow moving and meandering. The river originates in the Coast Range and flows generally eastward for 79.4 miles before emptying into the Willamette River near West Linn, Oregon.
Agricultural and forest lands constitute about 83 percent of the basin's land area in Washington County (S.D. Kelley, Washington County Depart ment of Land Use and Transportation, written commun., 1995). Agricultural commodities include nursery and greenhouse crops, fruits and berries, grain and hay, Christmas trees, and other forest products. Urban land accounts for slightly more than 13 percent of the acreage of Washington County. The remaining 4 percent of the acreage in Washington County is classified as public right-of- way, which includes roads, bridges, paths, and sidewalks. The population in Washington County nearly doubled from 157,900 in 1970 to 311,550 in 1990 (Washington County Department of Land Use and Transportation, undated). Recent projections for the year 2010 predict a populace of 439,500. Continued population and economic growth in the Tualatin River Basin has increased discharges of domestic wastewater, urban stormwater, and industrial waste into the Tualatin River; this trend will likely continue in the near future.

Table 1 . Data files on CD-ROM[BOD, biochemical oxygen demand; CBOD, carbonaceous biochemical oxygen demand; USA, Unified Sewerage Agency]
Subdirectory
biodata
cont_dat
flow
qadata
qwdata
File name
algal.dat
algal.hdr
lightext.dat
lightext.hdr
zooplank.dat
zooplank.hdr
light.datlighthdrmeteoro.dat
meteoro.hdr
qwmonitr.dat
qwmonitr.hdrflow.dat
flow.hdr
I4206990.datI4206990.hdrwwtpflow.dat
wwtpflow.hdralgalqa.dat
algalqa.hdr
bodrepl.datbodrepl.hdr
cbodrepl.datcbodrepl.hdrgwqa.datgwqa.hdr
swqa.datswqa.hdr
cbod.datcbod.hdrcbodwwtp.dat
cbodwwtp.hdr
grdwtr.datgrdwtr.hdr
mainstem.dat
mainstem.hdr
tribs.dat
tribs.hdr
wwtp.datwwtp.hdr
Bytes
444213
806
6920
545334950
767
361925824
24120788
884184
738494718
92646032
1030172430
53222149
884
100701261
23571085
213751056
539035
1231
234361065
13104
1065143241
1067
4679739
1853
22678011843
3121042
1856
Description
phytoplankton data from water-quality samplesheader file for above data file
light extinction coefficients
header file for above data filezooplankton data
header file for above data fileinsolation rates from continuous quantum sensorsheader file for above data filemeteorological data for 1991 93 (period of this study)header file for above data filedata from four-parameter probe at river mile 3.4
header file for above data filestreamflow discharge data
header file for above data filegage-height readings from Tualatin River at Oswego Canal
header file for above data filedischarge data from USA treatment plantsheader file for above data filequality-assurance data for phytoplankton samples
header file for above data filequality-assurance data for BOD samplesheader file for above data file
quality-assurance data for CBOD samples
header file for above data filequality-assurance data for ground-water samplesheader file for above data filequality-assurance data for surface-water samples
header file for above data file
CBOD data from water samplesheader file for above data file
CBOD data from USA treatment-plant samplesheader file for above data file
water-quality data from ground-water samplesheader file for above data file
water-quality data from sites on Tualatin River
header file for above data filewater-quality data from Tualatin River Basin tributary sites
header file for above data file
water-quality data from USA treatment plants
header file for above data file

Acknowledgments
The authors of this report and researchers of the Tualatin River Basin Study would like to recognize the following agencies and individuals for their help on this project: the Unified Sewerage Agency for cooperative funding and laboratory support, particularly Gary Krahmer, William Gaffi, John Jackson, Janice Miller, Tom VanderPlaat, Jan Wilson, and the crews at the USA Water Quality Laboratory; the USA Rock Creek Treatment Facility Laboratory, and the USA Durham Treatment Facility Laboratory; Steven D. Kelley of the Washington County Department of Land Use and Transportation-Planning Division, for the demographic data pertaining to Washington County, Oregon; the Tualatin Valley Irrigation District (TVID) for their cooperation in monitoring water withdrawn from the Tualatin River for irrigation purposes and supplying meteorological data; the Oregon Water Resources Department (OWRD) for assistance in collecting flow data in the Tualatin River Basin; the Oregon Community Foundation for financial support from the Tualatin Valley Water Quality Endowment Fund, which provided matching funds needed to expand the ground-water component of this study; Jim Sweet of Aquatic Analysts and Alan H. Vogel of ZP's Taxonomic Services for providing information regarding methods used in the analysis of phytoplankton and zooplankton samples; and the members of the Tualatin River Research Advisory Committee (TRRAC) for their valuable input and guidance during the study (TRRAC membership included: Wesley'M. Jarrell, Oregon Graduate Institute of Science &Technology; John Jackson, USA of Washington County; Michael Wolf, Oregon Department of Agriculture; David Degenhardt, Oregon Department of Forestry; James Morgan, METRO Planning and Development Department, Portland, Oregon; Richard Kover, Washington County Soil and Water Conservation District; Dan Wilson, TVID; Ela Whelan, Department of Utilities, Clackamas County, Oregon; Bruce Cleland, U.S. Environmental Protection Agency, Region 10, Seattle, Washington; Robert Baumgartner, Aaron Bodor and Don Yon, Oregon Department of Environmental Quality; Jerry Rodgers, Oregon Water Resources Department; David Zimmer, Bureau of Reclamation, Boise, Idaho; Van Burrus, Joint Water Commission, Forest Grove, Oregon; Stephen Hawkins, Bureau of
Environmental Services, Portland, Oregon; Paul Pedone, U.S. Natural Resources Conservation Service; Jay Massey, Oregon Department of Fish and Wildlife; Scott Wells and Roy Koch, Portland State University; Benno Warkentin and Ron Miner, Oregon State University). A very special thanks to all of the landowners that allowed us on their land to access the river or to obtain ground-water samples from their domestic wells.
DATA COLLECTION AND LABORATORY ANALYSIS
Data collection involved the following tasks: (1) collecting field-measured water-quality data and samples from surface water, (2) collecting field- measured water-quality data and samples from ground water, (3) collecting streamflow data, (4) analyzing physical and chemical characteristics of water samples, (5) collecting and analyzing aquatic- biology samples, (6) collecting insolation data, (7) maintaining a four-parameter water-quality monitor at river mile (RM) 3.4, (8) calculating light- extinction coefficients for three stations in the lower Tualatin River, (9) transcribing meteoro logical data from the Tualatin Valley Irrigation District (TVID) Agrimet Weather Station in Verboort, Oregon (pi. 1), and (10) collecting and compiling quality-assurance data from the USA Water Quality Laboratory, the USA Rock Creek Treatment Facility Laboratory, the USA Durham Treatment Facility Laboratory, the USGS National Water Quality Laboratory (NWQL) in Arvada, Colorado, and the USGS District Laboratory in Portland, Oregon.
Water-Quality-Sample Collection
The collection of surface-water-quality samples was a coordinated effort among USGS and USA sampling teams. Main-stem sites, tributary sites, and wastewater-treatment-plant effluent were sampled over the 1991 93 study period. Ground- water samples were collected from late 1990 through the summer of 1994.
Surface Water
The more frequently sampled surface-water sites were sampled one to three times a week during summer or low-flow periods and less frequently

during winter or high-flow periods. Some tributary sites were sampled as infrequently as once a month. For locations of surface-water sites, see tables 2-4 and plate 1. A list of selected regularly sampled surface-water-quality sites on the main-stem Tualatin River and the number of data values for various water-quality parameters recorded for each site are listed in table 5. A similar list for the regularly sampled Tualatin River tributary sites is given in table 6. USGS and USA site-numbering systems are explained in Appendix 2.
Water-quality sample-collection methods of the USGS and USA for surface-water samples were not identical during the first year of this study (1991). Both agencies collected samples from the Tualatin River by using a weighted-bottle sampler equipped with one or two rectangular 2-liter sample bottles. The differences in water-sample-collection techniques by both agencies during the first year of this study were as follows: (1) USA personnel sampled at the center of the river, whereas USGS personnel sampled at five points along a cross section of the river, (2) USA personnel lowered their sampler to a depth of 3 feet, whereas USGS personnel lowered their sampler to a depth of 10 feet or to the bottom of the channel (without disturbing the bottom sediments), and (3) USA personnel subsampled from the rectangular 2-liter bottles, whereas USGS personnel composited their samples into a churn splitter and subsampled from the composited sample. At tributary sites with shallow water, where a depth-integrating sampler could not be used, samples were collected by dipping the sample bottle into the stream by hand. USA personnel subsampled from this sample bottle, whereas USGS personnel composited samples into the churn splitter and then subsampled from the composited sample. By May 1992, USA sampling teams had adopted USGS sampling techniques and equipment for collecting surface-water samples. The sample-collection methods for surface-water samples are differentiated in the data files by using a two-letter abbreviation. The definitions for sample-collection methods are listed in table 7. The USGS Water STOrage and REtrieval System (WATSTORE) parameter codes for the surface- water-quality parameters measured are listed in table 8.
Ground Water
Ground-water sites were sampled by the USGS only. Ground-water sites consisted of 15 USGS- installed in-channel piezometers and 51 domestic wells throughout the Tualatin River Basin. Ground- water sites are identified by using a station number consisting of latitude and longitude (rounded to the nearest second) followed by a two-digit sequence number. Ground-water sites sampled for this study are listed in table 9 and shown in plate 1.
In-Channel Piezometers
Ground water just below the sediments of the main-stem Tualatin River was sampled at 15 locations after the installation of in-channel piezometers. Constructed of a stainless-steel sand point screen and a 1.5-inch polyvinyl-chloride (PVC) casing, these piezometers were driven directly into the riverbed to depths ranging from about 5 to 15 feet. Enough PVC casing was attached to allow each piezometer to be sampled from a boat on the river surface.
Ground water within the in-channel piezometers was pumped out 2 to 7 days prior to collecting a sample for analysis. This method was used to avoid collecting water that had been exposed to atmospheric conditions inside the well casing for an extended period of time. In addition, this procedure allowed a more representative sample of the ground water to be collected. Before collecting a sample for analysis, the water level inside the well was measured. A Hydrolab multiparameter instrument with an attached flow-through chamber was used to measure the temperature, pH, dissolved oxygen, and specific conductance of the ground water. Sample-collection methods used for in-channel wells are described in table 7 under the "CW" sample type. The USGS WATSTORE parameter codes for the ground-water-quality parameters measured are listed in table 10.
Domestic Wells
When possible, the water level for each domestic well was measured before obtaining water samples. Water-treatment devices, such as water softeners and water filters, were disconnected before attaching sampling equipment. Sampling equipment was attached as close to the wellhead as possible. Sampling equipment consisted of stainless-steel

Table 2. Main-stem Tuaiatin River sampling sites[USA, Unified Sewerage Agency; USGS, U.S. Geological Survey; DDDMMSS, degrees, minutes, seconds; --, no number assigned]
Map num ber
1
4
12
17
21
25
27
29
31
34
36
41
42
43
47
48
50
52
53
55
56
57
58
59
60
USA station number
3701715
3701612
3701528
--
3701450
--
--
3701423
3701391
3701380
3701336
3701271
3701233
3701165
3701116
--
3701087
--
3701068
-
3701054
--
--
3701018
3701002
USGS station number
14202300
14203500
14204800
14204900
14206250
14206265
14206275
14206285
14206440
14206460
14206500
14206690
14206700
14206740
14206785
14206790
14206960
14206975
14206990
14207030
14207050
14207150
14207160
14207500
14207600
Station Name
Tuaiatin River at Cherry Grove, Oregon
Tuaiatin River near Dilley, Oregon
Tuaiatin River at Golf Course Road near Cornelius, Oregon
Tuaiatin River above Dairy Creek near Hillsboro, Oregon
Tuaiatin River above Jackson Bottom near Hillsboro, Oregon
Tuaiatin River above irrigation return flow near Hillsboro, Oregon
Tuaiatin River at River mile 43.0 near Hillsboro, Oregon
Tuaiatin River at Minter Bridge near Hillsboro, Oregon
Tuaiatin River at Rood Bridge at Hillsboro, Oregon
Tuaiatin River at Meriwether irrigation pump near Hillsboro, Oregon
Tuaiatin River at Farmington, Oregon
Tuaiatin River at Highway 210 bridge, near Scholls, Oregon
Tuaiatin River near Scholls, Oregon
Tuaiatin River at Elsner Road near Sherwood, Oregon
Tuaiatin River at Highway 99W Bridge near King City, Oregon
Tuaiatin River at river mile 13.06 near King City, Oregon
Tuaiatin River at Boones Ferry Road at Tuaiatin, Oregon
Tuaiatin River at river mile 7.3 near Lake Oswego, Oregon
Tuaiatin River at Oswego Canal at Tuaiatin, Oregon
Tuaiatin River at river mile 6. 1 near Lake Oswego, Oregon
Tuaiatin River at Stafford Road near Lake Oswego, Oregon
Tuaiatin River at river mile 4.6 near Lake Oswego, Oregon
Tuaiatin River at river mile 4.0 near Lake Oswego, Oregon
Tuaiatin River at West Linn, Oregon
Tuaiatin River at Weiss bridge at West Linn, Oregon
Latitude (DDDMMSS)
0452803
0452830
0453008
0453006
0452959
0452959
0452937
0452906
0452925
0452842
0452700
0452505
0452339
0452309
0452340
0452345
0452310
0452301
0452257
0452300
0452247
0452211
0452148
0452103
0452023
Longitude (DDDMMSS)
1231721
1230723
1230318
1225941
1225909
1225846
1225855
1225850
1225701
1225624
1225700
1225511
1225351
1225149
1224750
1224919
1224522
1224355
1224312
1224232
1224148
1224125
1223830
1224030
1223912

Table 3. Tualatin River Basin tributary sampling sites[USA, Unified Sewerage Agency; USGS, U.S. Geological Survey; DDDMMSS, degrees minutes, seconds; , no number assigned]
Map number
219
3
5
6
10
13
14
15
16
18
19
20
22
23
24
26
28
30
32
33
35
37
38
39
40
44
45
46
49
51
USA station number
3805048
3805017
3809011
3810015
~
~
--
--
3815021--
3893007~
--
3898004
~
3820047
3820012
3822002
3830018
3831005
3811010
3813001
3835020~
3839005
3840012
3838002
USGS station number
14202980
14203000
14203700
14204530
14204670
14204830
14204840
14204860
14204865
14206200
14206230
14206240
14206255
14206260
14206263
14206270
14206280
14206290
14206445
14206450
14206490
14206600
14206650
14206670
14206680
14206750
14206755
14206760
14206950
14206970
Station name
Scoggins Creek below Henry Hagg Lake
Scoggins Creek at Old highway 47
Carpenter Creek near Forest Grove, Oregon
Gales Creek at Highway 47 at Forest Grove, Oregon
Unnamed Tributary at Geiger Road near Forest Grove, Oregon
Unnamed Tributary at Golf Course Road near Cornelius, Oregon
Unnamed Tributary at Golf Course near Cornelius, Oregon
Unnamed Tributary at Cook Road near Cornelius, Oregon
Tile drain below Cook Road near Cornelius,Oregon
Dairy Creek at Highway 8 near Hillsboro, Oregon
Dairy Creek at mouth near Hillsboro, Oregon
Unnamed Tributary at Highway 219 near Hillsboro, Oregon
Jackson Slough at mouth near Hillsboro, Oregon
Irrigation seeps to Tualatin at river mile 43.8
Seep near landfill ponds near Hillsboro, Oregon
Unnamed Tributary (Miller Swale) at river mile 43.5 near Hillsboro, Oregon
Unnamed Tributary at river mile 42.8 near Hillsboro, Oregon
Unnamed Tributary at river mile 40.2 Near Hillsboro, Oregon
Rock Creek at Quatama Road near Hillsboro, Oregon
Rock Creek near Hillsboro, Oregon
Butternut Creek at River Road near Farmington, Oregon
Christensen Creek near Farmington, Oregon
Burris Creek near Farmington, Oregon
McFee Creek near Scholls, Oregon
Baker Creek near Scholls, Oregon
Chicken Creek near Sherwood, Oregon
Rock Creek at Rock Creek Road near SixCorners, Oregon
Rock Creek near Sherwood, Oregon
Fanno Creek at Durham, Oregon
Nyberg Creek at Tualatin, Oregon
Latitude (DDDMMSS)
0452810
0452732
0453012
0453039
0453008
0453028
0452912
0453020
0452943
0453112
0453006
0453001
0452959
0452955
0453000
0452959
0452926
0452842
0453126
0453009
0452821
0452619
0452532
0452405
0452408
0452230
0452205
0452254
0452413
0452258
Longitude (DDDMMSS)
1231156
1230916
1230657
1230652
1230459
1230336
1230216
1230129
1230106
1230034
1225940
1225924
1225906
1225902
1225846
1225846
1225854
1225758
1225429
1225648
1225646
1225827
1225735
1225614
1225536
1225119
1224939
1224932
1224513
1224421

Table 4. Intermittently sampled Tualatin River Basin tributary sites[USGS, U.S. Geological Survey; DDDMMSS, degrees, minutes, seconds; "right bank" and "left bank" refer to bank of river as viewed facing downstream]
Map num ber
82
83
84
85
87
88
89
90
92
94
95
97
98
99
100
101
107
108
111
112
113
114
116
117
118
121
122
123
125
126
128
131
132
135
137
138
139
143
144
USGS station number
452722122565700
452724122564400
452727122564300
452734122564000
452746122562800
452808122555700
452810122563300
452820122555800
452835122560600
452840122562400
452842123081201
452843122573900
452845122560600
452845122562600
452850122573100
452851122582600
452909122561300
452909122590900
452918122591000
452919122572400
452924122570400
452927122562800
452939123015600
452940123020700
452940123020800
452952123003500
452955122584600
452955122590100
452958122584500
452959122584700
453001122592400
453022123030700
453028123022100
453040123024900
453041123031100
453042123031000
453045123030300
453113122544401
453115122535500
Station name
Tile drain on right bank at river mile 40.50
Tile drain on right bank at river mile 35.92
Tile drain on left bank at river mile 35.90
Tile drain on right bank at river mile 35.80
Unnamed tributary on left bank at river mile 35.65
Tile drain on right bank at river mile 34.60
Tile drain on right bank at river mile 35.25
Unnamed tributary on left bank at river mile 34.20
Seep on left bank at river mile 36.10
Seep on right bank at river mile 36.70
Unnamed tributary to Tualatin River near Dilley, Oregon
Tile drain on right bank at river mile 39.90
Tile drain on left bank at river mile 36.30
Tile drain on right bank at river mile 36.80
Tile drain on right bank at river mile 39.25
Tile drain on right bank at river mile 41.10
Gordon Creek near Hillsboro, Oregon
Tile drain on right bank at river mile 41 .90
Tile drain on right bank at river mile 42. 10
Tile drain on right bank at river mile 38.80
Tile drain on right bank at river mile 38.50
Seep on right bank at river mile 37.80
Unnamed tributary on right bank at river mile 47.40
Tile drain on left bank at river mile 47.50
Tile drain on left bank at river mile 47.60
Tile drain on right bank at river mile 49.80
Seep on left bank at river mile 43.35
Seep on left bank at river mile 43.75
Seep on left bank at river mile 43.50
Seep on left bank at river mile 43.65
Unnamed tributary on right bank at river mile 44.40
Tile drain on left bank at river mile 5 1 .20
Seep on left bank at river mile 49.40
Tile drain on left bank at river mile 50.35
Seep on left bank at river mile 50.70
Seep on left bank at river mile 50,65
Tile drain on left bank at river mile 50.50
Rock Creek near Hillsboro, Oregon
Beaverton Creek at 2 1 6th Avenue near Orenco, Oregon
Latitude (DDDMMSS)
0452843
0452831
0452829
0452824
0452807
0452802
0452803
0452741
0452835
0452840
0452842
0452843
0452845
0452845
0452857
0452851
0452909
0452912
0452913
0452919
0452924
0452914
0452939
0452940
0452940
0452926
0452955
0452955
0452958
0452813
0453001
0453022
0453028
0453040
0453041
0453042
0453045
0453113
0453115
Longitude (DDDMMSS)
1225751
1225604
1225603
1225601
1225559
1225634
1225508
1225628
1225606
1225619
1230812
1225739
1225606
1225626
1225731
1225821
1225613
1225905
1225910
1225724
1225704
1225628
1230156
1230207
1230208
1230247
1225846
1225901
1225845
1225730
1225924
1230307
1230221
1230249
1230311
1230310
1230303
1225444
1225355

Table 5. Frequency of analysis of selected water-quality parameters with associated WATSTORE parameter codes at selected sites on the main-stem Tualatin River[USGS, U.S. Geological Survey; USA, Unified Sewerage Agency; WATSTORE, Water Storage and Retrieval System Codes]
Map num ber
1
4
12
21
31
34
41
42
43
47
50
56
59
60
USA station number
3701715
3701612
3701528
3701450
3701391
3701380
3701271
3701233
3701165
3701116
3701087
3701054
3701018
3701002
USGS station number
14202300
14203500
14204800
14206250
14206440
14206460
14206690
14206700
14206740
14206785
14206960
14207050
14207500
14207600
Water Tem
perature 10
42
210
204
188
145
77
1,377
21
1,199
747
766
1,519
45
143
Turbi dity 76
28
160
163
135
114
53
192
19
194
79
193
206
12
115
Specific conduct ance, Field 94
2
190
174
182
137
78
1,366
0
1,132
740
760
1,487
0
142
Oxygen Dis
solved 299
40
192
174
182
140
77
1,352
0
1,121
731
760
1,493
0
143
pH, Field 400
2
193
174
186
145
77
1,130
22
1,004
550
666
1,273
46
141
Total Solids 500
42
209
204
184
142
78
263
68
313
126
264
211
0
143
Total Ammo
nia 610
43
211
204
184
142
78
263
44
265
126
264
277
8
143
Total Nitrite plus
Nitrate 630
43
212
204
187
145
78
265
68
318
127
273
302
19
143
Total Phos pho rus 665
43
208
201
182
140
76
258
67
314
122
259
285
19
141
Dis solved Chlo ride 940
43
206
204
185
139
78
259
68
311
127
268
286
19
139
Chloro phyll a 32209
0
154
134
142
99
78
220
43
219
125
219
219
0
99
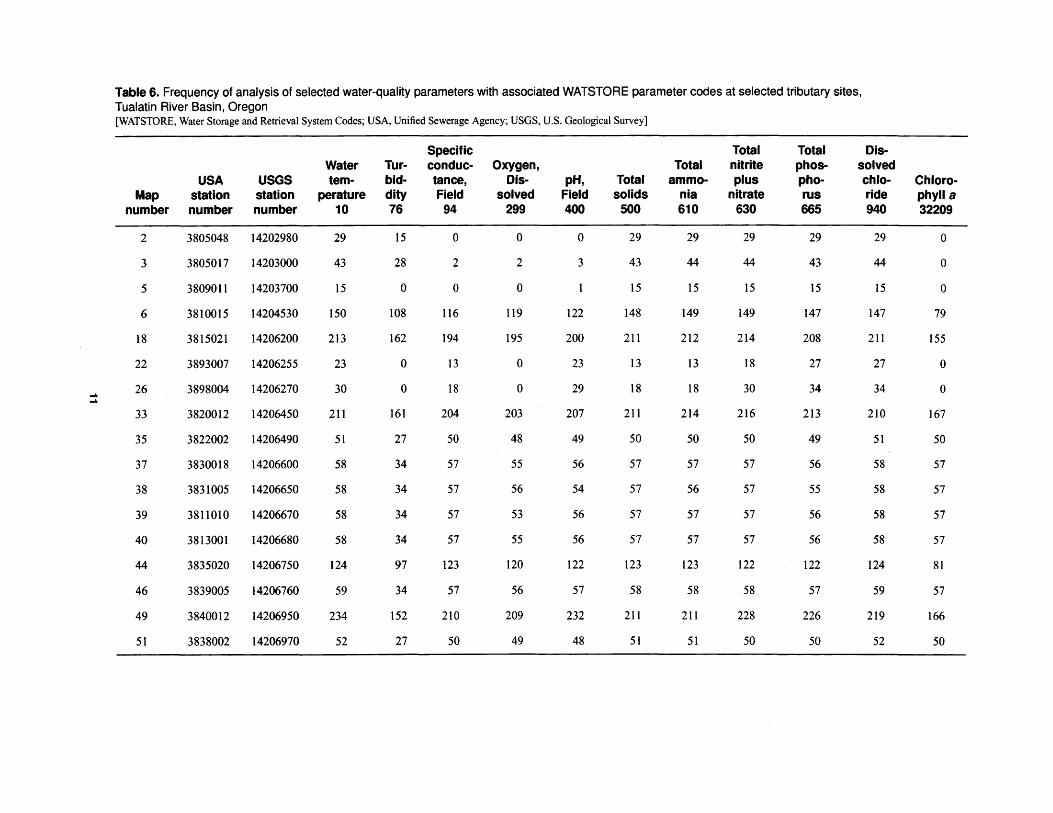
Table 6. Frequency of analysis of selected water-quality parameters with associated WATSTORE parameter codes at selected tributary sites, Tualatin River Basin, Oregon[WATSTORE, Water Storage and Retrieval System Codes; USA, Unified Sewerage Agency; USGS, U.S. Geological Survey]
Map number
2
3
5
6
18
22
26
33
35
37
38
39
40
44
46
49
51
USA station number
3805048
3805017
3809011
3810015
3815021
3893007
3898004
3820012
3822002
3830018
3831005
3811010
3813001
3835020
3839005
3840012
3838002
USGS station number
14202980
14203000
14203700
14204530
14206200
14206255
14206270
14206450
14206490
14206600
14206650
14206670
14206680
14206750
14206760
14206950
14206970
Water tem
perature 10
29
43
15
150
213
23
30
211
51
58
58
58
58
124
59
234
52
Tur- bid- dity 76
15
28
0
108
162
0
0
161
27
34
34
34
34
97
34
152
27
Specific conduc tance, Field 94
0
2
0
116
194
13
18
204
50
57
57
57
57
123
57
210
50
Oxygen, Dis
solved 299
0
2
0
119
195
0
0
203
48
55
56
53
55
120
56
209
49
PH, Field 400
0
3
1
122
200
23
29
207
49
56
54
56
56
122
57
232
48
Total solids 500
29
43
15
148
211
13
18
211
50
57
57
57
57
123
58
211
51
Total ammo
nia 610
29
44
15
149
212
13
18
214
50
57
56
57
57
123
58
211
51
Total nitrite plus
nitrate 630
29
44
15
149
214
18
30
216
50
57
57
57
57
122
58
228
50
Total phos pho rus 665
29
43
15
147
208
27
34
213
49
56
55
56
56
122
57
226
50
Dis solved chlo ride 940
29
44
15
147
211
27
34
210
51
58
58
58
58
124
59
219
52
Chloro phyll a 32209
0
0
0
79
155
0
0
167
50
57
57
57
57
81
57
166
50

Table 7. Codes and definitions of sample-collection methods[USA, Unified Sewerage Agency; USGS, U.S. Geological Survey; NWQL, National Water Quality Laboratory]
Sample-Sample-type collection
code type Sample-collection method
CW In-channel Water was pumped out of the well 2 to 7 days prior to the sampling date by using a peristaltic pump with Tygon tubing. The water waswell pumped from the bottom of the well to obtain a more representative ground-water sample. Initially, water was pumped into a flow-through
cell attached to a Hydrolab multiparameter instrument to obtain field measurements of temperature, pH, dissolved oxygen, and specific conductance. Samples were then pumped directly into sample bottles or directly filtered, in an effort to reduce ground-water exposure to the atmosphere. Samples were then chilled on ice and shipped overnight to the USGS NWQL. Sample tubing was rinsed with distilled- deionized water before and after sampling.
DC Discrete Water samples were collected over a 24-hour period. The samples were composited over equal hour time intervals. The sample volumes composite collected were the same at every interval. This is a USA treatment facility method for collecting effluent samples.
DM Domestic Water from the well was pumped through a flow-through cell attached to a Hydrolab or other multiparameter instrument until fieldwell parameter readings were stabilized. After the field readings were stable, the water was considered to be representative of the "actual"
ground water. Ground water was then pumped directly into sample bottles or filtered. The sample bottles were chilled and sent overnight to the USGS NWQL.
Depth-specific samples were collected at a known depth in the water column. Depth-specific field measurements were taken at known depths in the water column and primarily at main-stem Tualatin River sites below river mile 30.
Samples were obtained from the centroids of equal-discharge increments. This method requires some knowledge of the distribution of streamflow in the cross section based on a long period of discharge record or on a discharge measurement made immediately prior to selecting the sampling verticals. A minimum of four and a maximum of nine verticals were composited into a USGS churn splitter and subsampled for analyses 1 .
This method requires a sample volume proportional to the amount of flow at each of several equally spaced verticals in a cross section. A minimum of 10 verticals and a maximum of 20 verticals were composited into a USGS churn splitter and subsampled for analyses 1 .
Water samples were composited over a 24-hour period. These samples were flow proportioned. An example of this would be a sampler that is set up to collect 100 milliliters of effluent for every 10,000 gallons of flow over the 24-hour sampling period. This sampling technique is used by the USA wastewater-treatment facilities for collecting effluent samples.
FM Field Measurements of temperature, dissolved oxygen, specific conductance, and pH were made in the field. These values can change after sam- measurement pies have been stored for a period of time. More accurate field values are obtained when such measurements are made on-site. Individual
probes or multiparameter probes were used to obtain field measurements.
GS Grab sample Samples were acquired at a point in the stream (preferably at midchannel if possible) by dipping a sample bottle into the body of water to besampled. Grab samples were usually collected when a depth-integrating sampler could not be submerged, or when the flow in the channel was not wide enough to warrant composition of a sample from a cross section of the stream.
HY Hypolimnion Depth-specific hypolimnetic water samples were collected using a Van Dora type sampler and subsampled into individual bottles for analyses.
DS
ED
EW
FC
Depth specific
Equal-dis charge increment
Equal-width increment
Flowcomposite
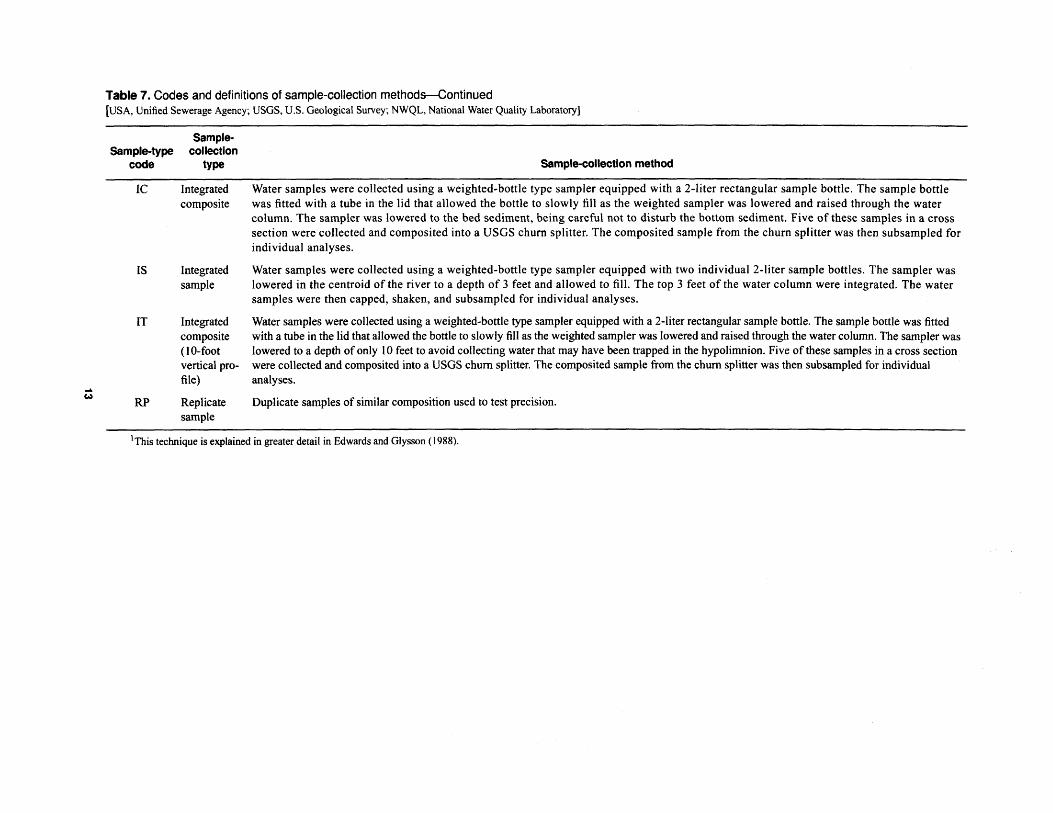
Table 7. Codes and definitions of sample-collection methods Continued[USA, Unified Sewerage Agency; USGS, U.S. Geological Survey; NWQL, National Water Quality Laboratory]
Sample-Sample-type collection
code type Sample-collection method
1C
IS
IT
RP
Integrated composite
Integrated sample
Integrated composite (10-foot vertical pro file)
Replicate sample
Water samples were collected using a weighted-bottle type sampler equipped with a 2-liter rectangular sample bottle. The sample bottle was fitted with a tube in the lid that allowed the bottle to slowly fill as the weighted sampler was lowered and raised through the water column. The sampler was lowered to the bed sediment, being careful not to disturb the bottom sediment. Five of these samples in a cross section were collected and composited into a USGS churn splitter. The composited sample from the churn splitter was then subsampled for individual analyses.
Water samples were collected using a weighted-bottle type sampler equipped with two individual 2-liter sample bottles. The sampler was lowered in the centroid of the river to a depth of 3 feet and allowed to fill. The top 3 feet of the water column were integrated. The water samples were then capped, shaken, and subsampled for individual analyses.
Water samples were collected using a weighted-bottle type sampler equipped with a 2-liter rectangular sample bottle. The sample bottle was fitted with a tube in the lid that allowed the bottle to slowly fill as the weighted sampler was lowered and raised through the water column. The sampler was lowered to a depth of only 10 feet to avoid collecting water that may have been trapped in the hypolimnion. Five of these samples in a cross section were collected and composited into a USGS churn splitter. The composited sample from the churn splitter was then subsampled for individual analyses.
Duplicate samples of similar composition used to test precision.
^his technique is explained in greater detail in Edwards and Glysson (1988).
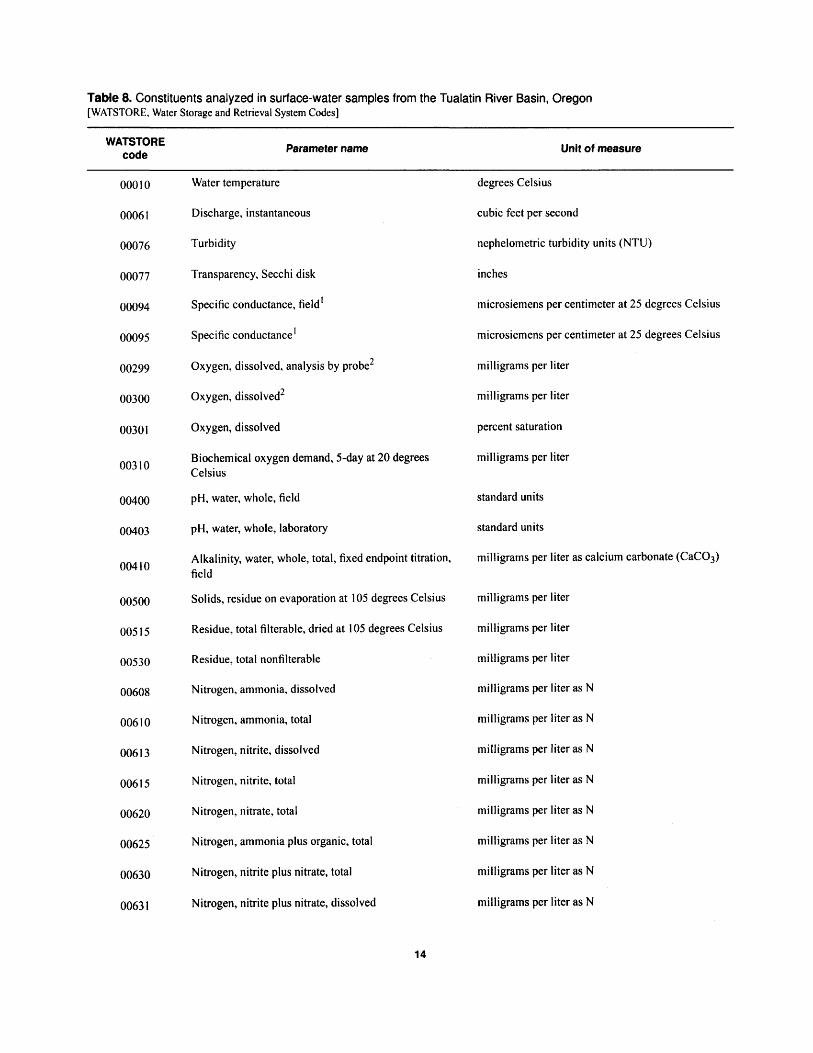
Table 8. Constituents analyzed in surface-water samples from the Tualatin River Basin, Oregon[WATSTORE, Water Storage and Retrieval System Codes]
WATSTORE code
Parameter name Unit of measure
00010 Water tem perature
00061 Discharge, instantaneous
00076 Turbidity
00077 Transparency, Secchi disk
00094 Specific conductance, field 1
00095 Specific conductance 1
00299 Oxygen, dissolved, analysis by probe2
00300 Oxygen, dissolved2
00301 Oxygen, dissolved
Biochemical oxygen demand, 5-day at 20 degrees Celsius
00400 pH, water, whole, field
00403 pH, water, whole, laboratory
Alkalinity, water, whole, total, fixed endpoint titration,Uv^T I U r> i i
field
00500 Solids, residue on evaporation at 105 degrees Celsius
00515 Residue, total filterable, dried at 105 degrees Celsius
00530 Residue, total nonfilterable
00608 Nitrogen, ammonia, dissolved
00610 Nitrogen, ammonia, total
00613 Nitrogen, nitrite, dissolved
00615 Nitrogen, nitrite, total
00620 Nitrogen, nitrate, total
00625 Nitrogen, ammonia plus organic, total
00630 Nitrogen, nitrite plus nitrate, total
00631 Nitrogen, nitrite plus nitrate, dissolved
degrees Celsius
cubic feet per second
nephelometric turbidity units (NTU)
inches
microsiemens per centimeter at 25 degrees Celsius
microsiemens per centimeter at 25 degrees Celsius
milligrams per liter
milligrams per liter
percent saturation
milligrams per liter
standard units
standard units
milligrams per liter as calcium carbonate (CaCO3)
milligrams per liter
milligrams per liter
milligrams per liter
milligrams per liter as N
milligrams per liter as N
milligrams per liter as N
milligrams per liter as N
milligrams per liter as N
milligrams per liter as N
milligrams per liter as N
milligrams per liter as N
14
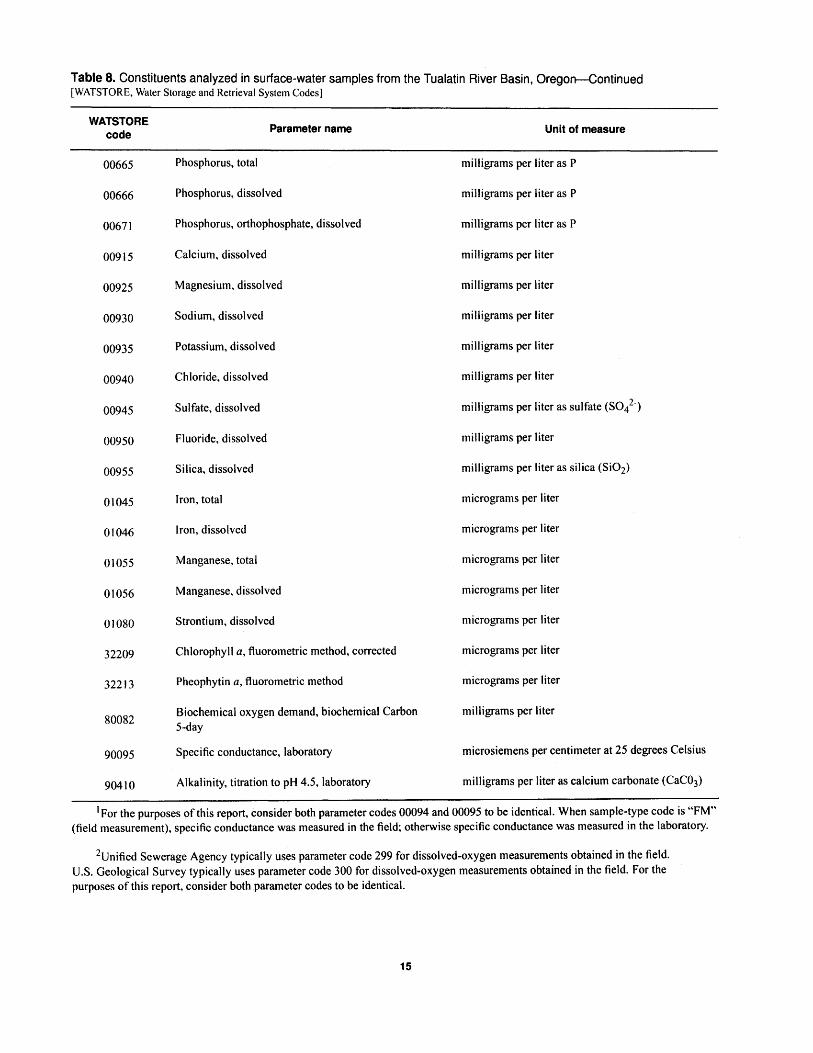
Table 8. Constituents analyzed in surface-water samples from the Tualatin River Basin, Oregon Continued[WATSTORE, Water Storage and Retrieval System Codes]
WATSTORE code Parameter name Unit of measure
00665 Phosphorus, total
00666 Phosphorus, dissolved
00671 Phosphorus, orthophosphate, dissolved
00915 Calcium, dissolved
00925 Magnesium, dissolved
00930 Sodium, dissolved
00935 Potassium, dissolved
00940 Chloride, dissolved
00945 Sulfate, dissolved
00950 Fluoride, dissolved
00955 Silica, dissolved
01045 Iron, total
01046 Iron, dissolved
01055 Manganese, total
01056 Manganese, dissolved
01080 Strontium, dissolved
32209 Chlorophyll a, fluorometric method, corrected
32213 Pheophytin a, fluorometric method
Biochemical oxy8en demand, biochemical Carbon oUOoZ ,. ,5-day
90095 Specific conductance, laboratory
90410 Alkalinity, titration to pH 4.5, laboratory
milligrams per liter as P
milligrams per liter as P
milligrams per liter as P
milligrams per liter
milligrams per liter
milligrams per liter
milligrams per liter
milligrams per liter
milligrams per liter as sulfate (SO42~)
milligrams per liter
milligrams per liter as silica (SiO2)
micrograms per liter
micrograms per liter
micrograms per liter
micrograms per liter
micrograms per liter
micrograms per liter
micrograms per liter
milligrams per liter
microsiemens per centimeter at 25 degrees Celsius
milligrams per liter as calcium carbonate (CaC03)
'For the purposes of this report, consider both parameter codes 00094 and 00095 to be identical. When sample-type code is "FM' (field measurement), specific conductance was measured in the field; otherwise specific conductance was measured in the laboratory.
2 Unified Sewerage Agency typically uses parameter code 299 for dissolved-oxygen measurements obtained in the field. U.S. Geological Survey typically uses parameter code 300 for dissolved-oxygen measurements obtained in the field. For the purposes of this report, consider both parameter codes to be identical.
15
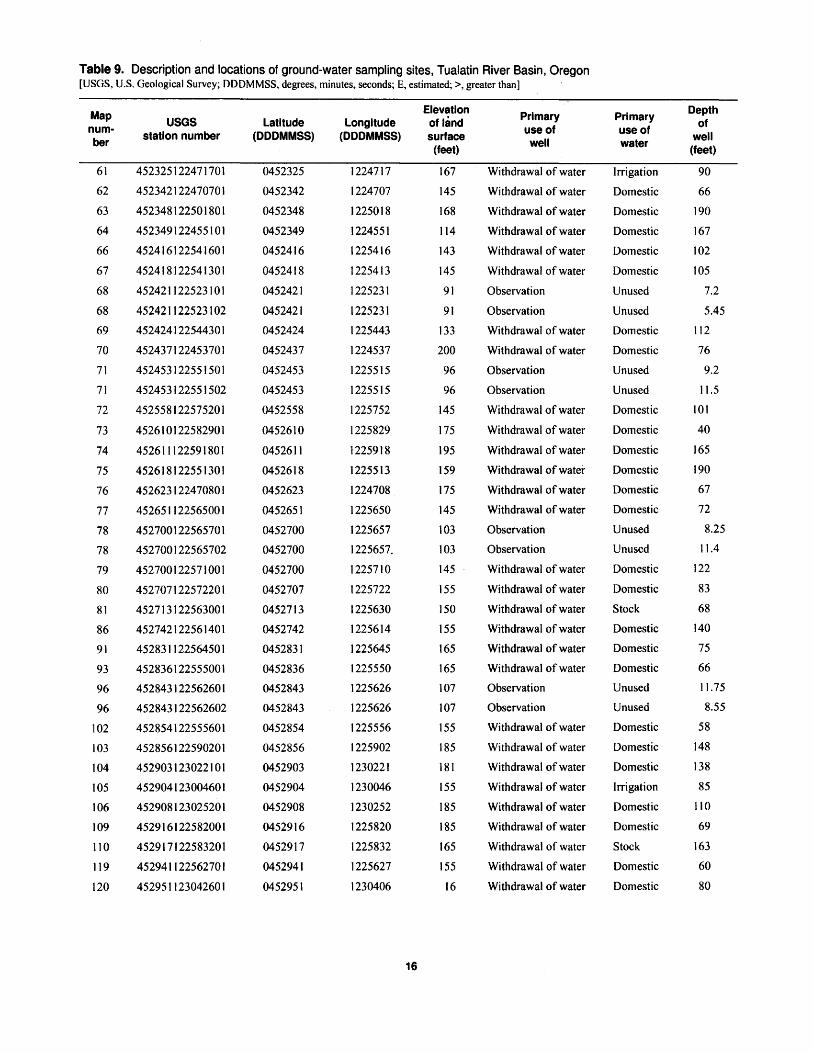
Table 9. Description and locations of ground-water sampling[USGS, U.S. Geological Survey; DDDMMSS, degrees, minutes, seconds; E
sites, Tualatin River Basin, Oregon, estimated; >, greater than]
Map num ber
61
62
63
64
66
67
68
68
69
70
71
71
72
73
74
75
76
77
78
78
79
80
81
86
91
93
96
96
102
103
104
105
106
109
110
119
120
USGS station number
452325122471701
452342122470701
452348122501801
452349122455101
452416122541601
452418122541301
452421122523101
452421122523102
452424122544301
452437122453701
452453122551501
452453122551502
452558122575201
452610122582901
452611122591801
452618122551301
452623122470801
452651122565001
452700122565701
452700122565702
452700122571001
452707122572201
452713122563001
452742122561401
452831122564501
452836122555001
452843122562601
452843122562602
452854122555601
452856122590201
452903123022101
452904123004601
452908123025201
452916122582001
452917122583201
452941122562701
452951123042601
Latitude (DDDMMSS)
0452325
0452342
0452348
0452349
0452416
0452418
0452421
0452421
0452424
0452437
0452453
0452453
0452558
0452610
0452611
0452618
0452623
0452651
0452700
0452700
0452700
0452707
0452713
0452742
0452831
0452836
0452843
0452843
0452854
0452856
0452903
0452904
0452908
0452916
0452917
0452941
0452951
Longitude (DDDMMSS)
1224717
1224707
1225018
1224551
1225416
1225413
1225231
1225231
1225443
1224537
1225515
1225515
1225752
1225829
1225918
1225513
1224708
1225650
1225657
1225657.
1225710
1225722
1225630
1225614
1225645
1225550
1225626
1225626
1225556
1225902
1230221
1230046
1230252
1225820
1225832
1225627
1230406
Elevation of land surface
(feet)
167
145
168
114
143
145
91
91
133
200
96
96
145
175
195
159
175
145
103
103
145
155
150
155
165
165
107
107
155
185
181
155
185
185
165
155
16
Primary use of well
Withdrawal of water
Withdrawal of water
Withdrawal of water
Withdrawal of water
Withdrawal of water
Withdrawal of water
Observation
Observation
Withdrawal of water
Withdrawal of water
Observation
Observation
Withdrawal of water
Withdrawal of water
Withdrawal of water
Withdrawal of water
Withdrawal of water
Withdrawal of water
Observation
Observation
Withdrawal of water
Withdrawal of water
Withdrawal of water
Withdrawal of water
Withdrawal of water
Withdrawal of water
Observation
Observation
Withdrawal of water
Withdrawal of water
Withdrawal of water
Withdrawal of water
Withdrawal of water
Withdrawal of water
Withdrawal of water
Withdrawal of water
Withdrawal of water
Primary use of water
Irrigation
Domestic
Domestic
Domestic
Domestic
Domestic
Unused
Unused
Domestic
Domestic
Unused
Unused
Domestic
Domestic
Domestic
Domestic
Domestic
Domestic
Unused
Unused
Domestic
Domestic
Stock
Domestic
Domestic
Domestic
Unused
Unused
Domestic
Domestic
Domestic
Irrigation
Domestic
Domestic
Stock
Domestic
Domestic
Depth of
well (feet)
90
66
190
167
102
105
7.2
5.45
112
76
9.2
11.5
101
40
165
190
67
72
8.25
11.4
122
83
68
140
75
66
11.75
8.55
58
148
138
85
110
69
163
60
80
16

Table 9. Description and locations of ground-water sampling sites, Tualatin River Basin, Oregon Continued[USOS, U.S. Geological Survey; DDDMMSS, degrees, minutes, seconds; E, estimated; >, greater than]
Map num ber
124
124
127
127
127
129
130
130
133
140
141
142
145
146
147
148
149
150
151
152
153
154
155
156
157
158
159
160
161
USGS station number
452955122591701
452955122591702
452959122584801
452959122584802
452959122584803
453002123025301
453005123031601
453005123031602
453031123004201
453050122574501
453055122530901
453106122560601
453129122561401
453138122560201
453221122594901
453222122555001
453244122584701
453253123054101
453324122572301
453401123032401
453417122572901
453422123020201
453442123035201
453445123063201
453446123063301
453540123041101
453545123072501
453630122590501
453710123012201
Latitude (DDDMMSS)
0452955
0452955
0452959
0452959
0452959
0453002
0453005
0453005
0453031
0453050
0453055
0453106
0453129
0453138
0453221
0453222
0453244
0453253
0453324
0453401
0453417
0453422
0453442
0453445
0453446
0453540
0453545
0453630
0453710
Longitude (DDDMMSS)
1225917
1225917
1225848
1225848
1225848
1230253
1230316
1230316
1230042
1225745
1225309
1225606
1225614
1225602
1225949
1225550
1225847
1230541
1225723
1230324
1225729
1230202
1230352
1230632
1230633
1230411
1230725
1225905
1230122
Elevation of land surface
(feet)
115
115
115
115
102
145
130
130
165
175
185
120
185
175
180
185
185
185
185
169
190
184
175
171
171
170
190
215
214
Primary use of well
Observation
Observation
Observation
Observation
Observation
Withdrawal of water
Observation
Observation
Withdrawal of water
Withdrawal of water
Withdrawal of water
Withdrawal of water
Withdrawal of water
Withdrawal of water
Withdrawal of water
Withdrawal of water
Withdrawal of water
Withdrawal of water
Withdrawal of water
Withdrawal of water
Withdrawal of water
Withdrawal of water
Withdrawal of water
Withdrawal of water
Withdrawal of water
Withdrawal of water
Withdrawal of water
Withdrawal of water
Withdrawal of water
Primary use of water
Unused
Unused
Unused
Unused
Unused
Domestic
Unused
Unused
Domestic
Irrigation
Domestic
Domestic
Irrigation
Domestic
Domestic
Domestic
Domestic
Domestic
Domestic
Domestic
Domestic
Domestic
Domestic
Domestic
Domestic
Domestic
Domestic
Domestic
Domestic
Depth of
well (feet)
7.5
12.0
7.57
14.0
8.16
65
9.17
6.80
45
63
70
48
43
131
105
48
148
80
115
155
70
50E
71
100
28E
70
>100
115E
>100
17
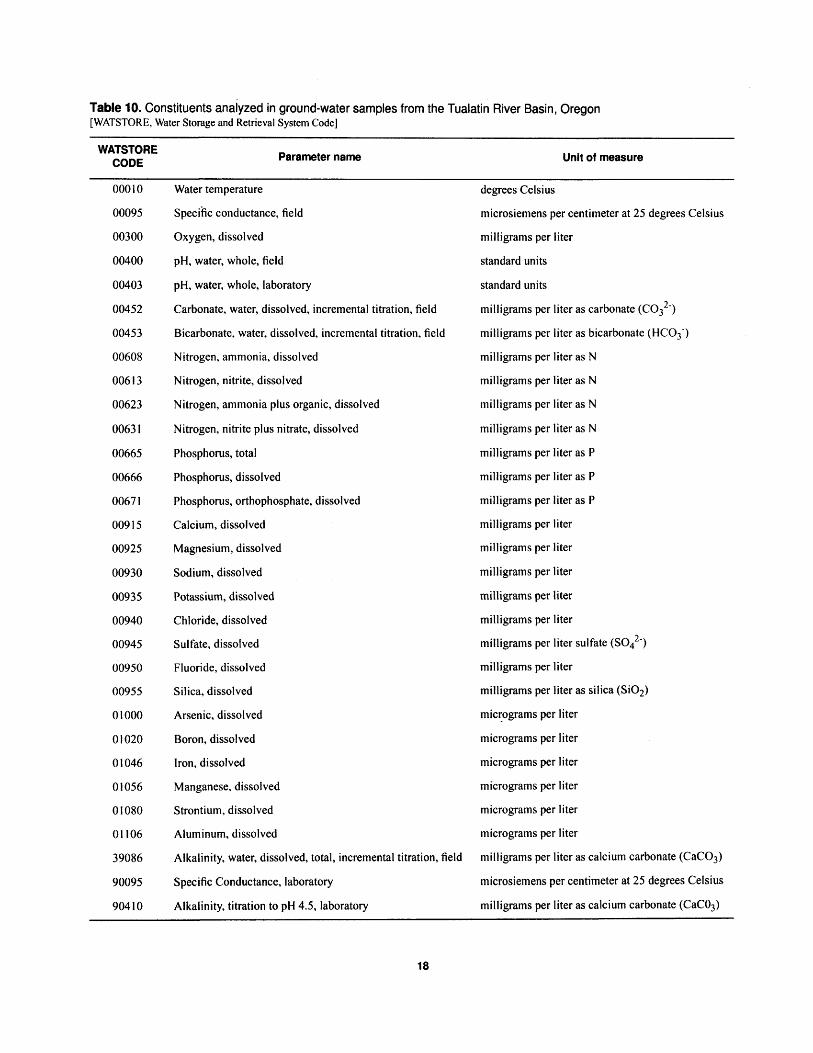
Table 10, Constituents analyzed in ground-water samples from the Tualatin River Basin, Oregon[WATSTORE, Water Storage and Retrieval System Code]
WATSTORE CODE Parameter name Unit of measure
00010 Water temperature
00095 Specific conductance, field
00300 Oxygen, dissolved
00400 pH, water, whole, field
00403 pH, water, whole, laboratory
00452 Carbonate, water, dissolved, incremental titration, field
00453 Bicarbonate, water, dissolved, incremental titration, field
00608 Nitrogen, ammonia, dissolved
00613 Nitrogen, nitrite, dissolved
00623 Nitrogen, ammonia plus organic, dissolved
00631 Nitrogen, nitrite plus nitrate, dissolved
00665 Phosphorus, total
00666 Phosphorus, dissolved
00671 Phosphorus, orthophosphate, dissolved
00915 Calcium, dissolved
00925 Magnesium, dissolved
00930 Sodium, dissolved
00935 Potassium, dissolved
00940 Chloride, dissolved
00945 Sulfate, dissolved
00950 Fluoride, dissolved
00955 Silica, dissolved
OIOOO Arsenic, dissolved
01020 Boron, dissol ved
01046 Iron, dissolved
01056 Manganese, dissolved
01080 Strontium, dissolved
01106 Aluminum, dissolved
39086 Alkalinity, water, dissolved, total, incremental titration, field
90095 Specific Conductance, laboratory
90410 Alkalinity, titration to pH 4.5, laboratory
degrees Celsius
microsiemens per centimeter at 25 degrees Celsius
milligrams per liter
standard units
standard units
milligrams per liter as carbonate (CO32~)
milligrams per liter as bicarbonate (HCO3")
milligrams per liter as N
milligrams per liter as N
milligrams per liter as N
milligrams per liter as N
milligrams per liter as P
milligrams per liter as P
milligrams per liter as P
milligrams per liter
milligrams per liter
milligrams per liter
milligrams per liter
milligrams per liter
milligrams per liter sulfate (SO42~)
milligrams per liter
milligrams per liter as silica (SiC^)
micrograms per liter
micrograms per liter
micrograms per liter
micrograms per liter
micrograms per liter
micrograms per liter
milligrams per liter as calcium carbonate (CaCC^)
microsiemens per centimeter at 25 degrees Celsius
milligrams per liter as calcium carbonate (CaC03 )
18

pipes and metal valves attached to the existing plumbing. Teflon and plastic tubes were subsequently attached to the pipes and valves for collection of water samples. For the constituents sampled in this study, none of the sampling materials presented a risk of contamination. A flow-through chamber with separate probes or a Hydrolab multiparameter instrument with an attached flow-through chamber was used to measure temperature, pH, dissolved oxygen, and specific conductance. Sample-collection methods used for domestic wells are described in table 7 under the "DM" sample type.
Discharge Measurement and Data Collection
Streamflow, wastewater-treatment-plant discharge, and diversion-withdrawal data were collected during the entire period of this study. Records were maintained for seven main-stem Tualatin River sites, four major tributary sites, four wastewater-treatment plants, and three sites where water is diverted from the Tualatin River. Stations with discharge records are listed in tables 11-14. USGS techniques for the computation of stream- flow records (Kennedy, 1983) were used in the preparation of discharge data maintained and computed by the USGS. Discharge data from USA treatment plants and flow measurements by other agencies were maintained and (or) computed using their own equipment and techniques. The USGS consulted and assisted in calibrating and installing the flowmeters used by the TVID and by USA at their treatment facilities. All discharge data presented in the data files are mean daily values and are reported in cubic feet per second (ft /s).
Streamflow Data
Main-stem stations that have continuous discharge for the entire 1991-93 period are Tualatin River near Dilley (RM 58.8), Tualatin River at Farmington (RM 33.3), and Tualatin River at West Linn (RM 1.8). Tualatin River at Springhill Road (RM 55.3) and Tualatin River at LaFollet Road (RM 53.8) stations were discontinued at the end of the low-flow season of 1991, and a new gaging station with continuous record was installed at Tualatin River at Golf Course Road (RM 51.5) in May of 1992. The Tualatin River at Rood Bridge
Road (RM 38.4) gaging station has continuous record from May 1991 through December of 1993. Gage-height record is also measured on the Tualatin River at the Oswego Canal. See table 11 for a list of main-stem Tualatin River sites that have discharge data.
Tributary stations that have continuous discharge record include Scoggins Creek below Henry Hagg Lake and Fanno Creek at Durham. The gage at Scoggins Creek below Henry Hagg Lake is maintained year round and has a complete record for the period of this study; the gage on Fanno Creek was installed in December 1991. The gaging stations at Gales Creek near Forest Grove and Dairy Creek at Highway 8 near Hillsboro are stations where dis charge is measured only during the low-flow period of the year. See table 12 for a list of tributary stations that have discharge data.
Unified Sewerage Agency Wastewater- Treatment-Plant Discharge Data
USA personnel maintain records of effluent discharge rates from the wastewater-treatment plants. The USA wastewater-treatment plant in Forest Grove and the USA treatment plant in Hillsboro release treated effluent into the Tualatin River only during the high-flow periods of the year, generally November through April. During the low-flow periods, the treated effluent from the Forest Grove and Hillsboro wastewater-treatment plants is not discharged to the Tualatin River. Instead, the treated effluent is used for irrigation or piped to the Rock Creek treatment plant. The USA facilities at Rock Creek and Durham discharge treated effluent year round to the Tualatin River. The Rock Creek and Durham treatment plants maintain continuous records of discharged effluent. The quantity of effluent discharged from these USA treatment plants was measured with flowmeters maintained by USA. See table 13 for a list of USA treatment plants for which there is discharge data.
Withdrawal Rates at Major Diversion Points along the Main-Stem Tualatin River
There are three major points where water is diverted from the main-stem Tualatin River (fig. 2): at the Joint Water Commission (JWC) Plant (RM 56.1), operated by the JWC; at the Springhill Pump Plant (also at RM 56.1), operated by the TVID; and at the Oswego Canal (RM 6.7), operated by the Lake
19
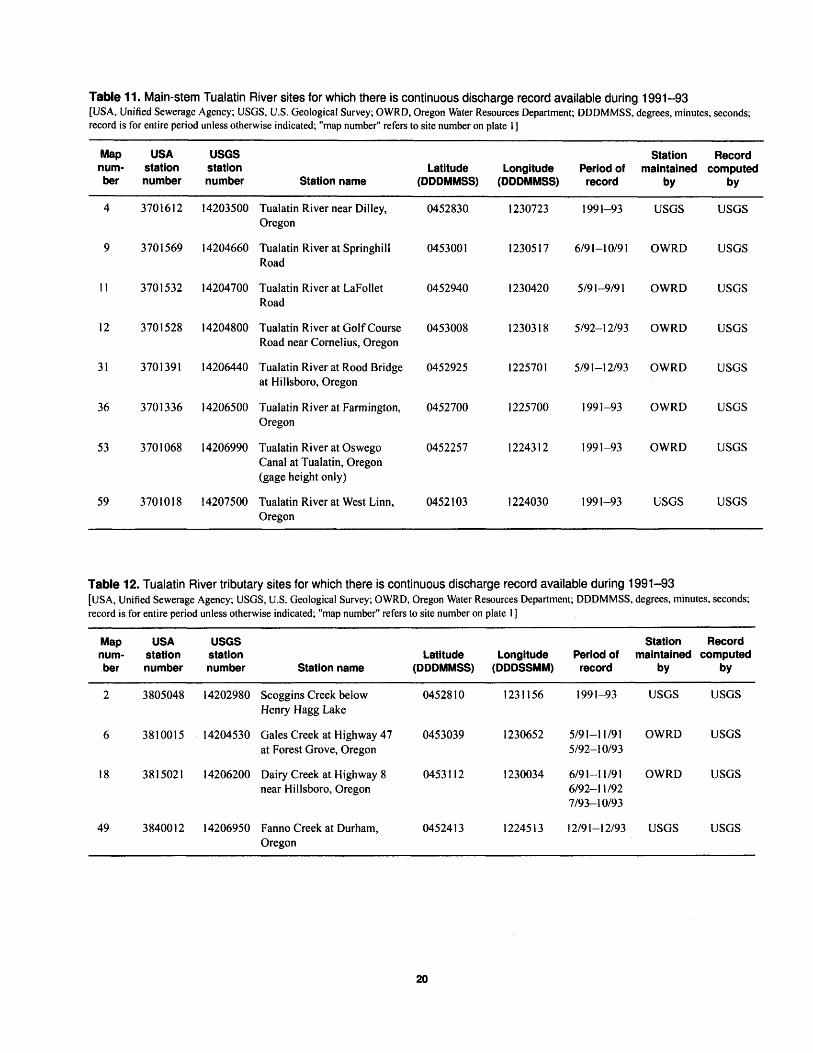
Table 11. Main-stem Tualatin River sites for which there is continuous discharge record available during 1991-93[USA, Unified Sewerage Agency; USGS, U.S. Geological Survey; OWRD, Oregon Water Resources Department; DDDMMSS, degrees, minutes, seconds; record is for entire period unless otherwise indicated; "map number" refers to site number on plate 1]
Map num ber
4
9
11
12
31
36
53
59
USA station number
3701612
3701569
3701532
3701528
3701391
3701336
3701068
3701018
USGS station number
14203500
14204660
14204700
14204800
14206440
14206500
14206990
14207500
Station name
Tualatin River near Dilley, Oregon
Tualatin River at Springhill Road
Tualatin River at LaFollet Road
Tualatin River at Golf Course Road near Cornelius, Oregon
Tualatin River at Rood Bridge at Hillsboro, Oregon
Tualatin River at Farmington, Oregon
Tualatin River at Oswego Canal at Tualatin, Oregon (gage height only)
Tualatin River at West Linn, Oregon
Latitude (DDDMMSS)
0452830
0453001
0452940
0453008
0452925
0452700
0452257
0452103
Longitude (DDDMMSS)
1230723
1230517
1230420
1230318
1225701
1225700
1224312
1224030
Period of record
1991-93
6/91-10/91
5/91-9/91
5/92-12/93
5/91-12/93
1991-93
1991-93
1991-93
Station maintained
by
USGS
OWRD
OWRD
OWRD
OWRD
OWRD
OWRD
USGS
Record computed
by
USGS
USGS
USGS
USGS
USGS
USGS
USGS
USGS
Table 12. Tualatin River tributary sites for which there is continuous discharge record available during 1991-93[USA, Unified Sewerage Agency; USGS, U.S. Geological Survey; OWRD, Oregon Water Resources Department; DDDMMSS, degrees, minutes, seconds; record is for entire period unless otherwise indicated; "map number" refers to site number on plate I ]
Map num ber
2
6
18
49
USA station number
3805048
3810015
3815021
3840012
USGS station number
14202980
14204530
14206200
14206950
Station name
Scoggins Creek below Henry Hagg Lake
Gales Creek at Highway 47 at Forest Grove, Oregon
Dairy Creek at Highway 8 near Hillsboro, Oregon
Fanno Creek at Durham, Oregon
Latitude (DDDMMSS)
0452810
0453039
0453112
0452413
Longitude (DDDSSMM)
1231156
1230652
1230034
1224513
Period of record
1991-93
5/91-11/91 5/92-10/93
6/91-11/91 6/92-11/92 7/93-10/93
12/91-12/93
Station maintained
by
USGS
OWRD
OWRD
USGS
Record computed
by
USGS
USGS
USGS
USGS
20
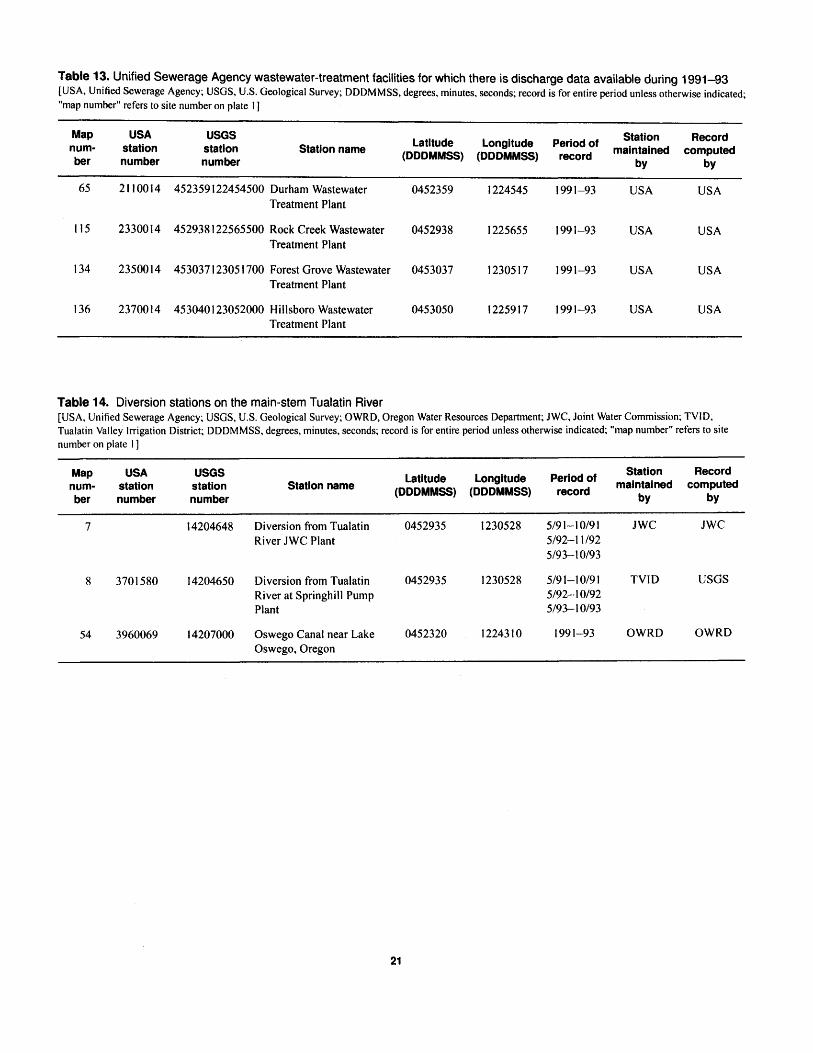
Table 13. Unified Sewerage Agency wastewater-treatment facilities for which there is discharge data available during 1991-93[USA, Unified Sewerage Agency; USGS, U.S. Geological Survey; DDDMMSS, degrees, minutes, seconds; record is for entire period unless otherwise indicated; "map number" refers to site number on plate 1]
Map num ber
65
115
134
136
USA station number
2110014
2330014
2350014
2370014
USGS station number
452359122454500
452938122565500
453037123051700
453040123052000
Station name
Durham WastewaterTreatment Plant
Rock Creek WastewaterTreatment Plant
Forest Grove WastewaterTreatment Plant
Hillsboro WastewaterTreatment Plant
Latitude (DDDMMSS)
0452359
0452938
0453037
0453050
Longitude (DDDMMSS)
1224545
1225655
1230517
1225917
Period of record
1991-93
1991-93
1991-93
1991-93
Station maintained
by
USA
USA
USA
USA
Record computed
by
USA
USA
USA
USA
Table 14. Diversion stations on the main-stem Tualatin River[USA, Unified Sewerage Agency; USGS, U.S. Geological Survey; OWRD, Oregon Water Resources Department; JWC, Joint Water Commission; TVID, Tualatin Valley Irrigation District; DDDMMSS, degrees, minutes, seconds; record is for entire period unless otherwise indicated; "map number" refers to site number on plate I ]
Map num ber
7
8
USA station number
3701580
USGS station number
14204648
14204650
Station name
Diversion from Tualatin River JWC Plant
Diversion from Tualatin River at Springhill Pump Plant
Latitude (DDDMMSS)
0452935
0452935
Longitude (DDDMMSS)
1230528
1230528
Period of record
5/91-10/915/92-11/92 5/93-10/93
5/91-10/91 5/92-10/92 5/93-10/93
Station maintained
by
JWC
TVID
Record computed
by
JWC
USGS
54 3960069 14207000 Oswego Canal near LakeOswego, Oregon
0452320 1224310 1991-93 OWRD OWRD
21
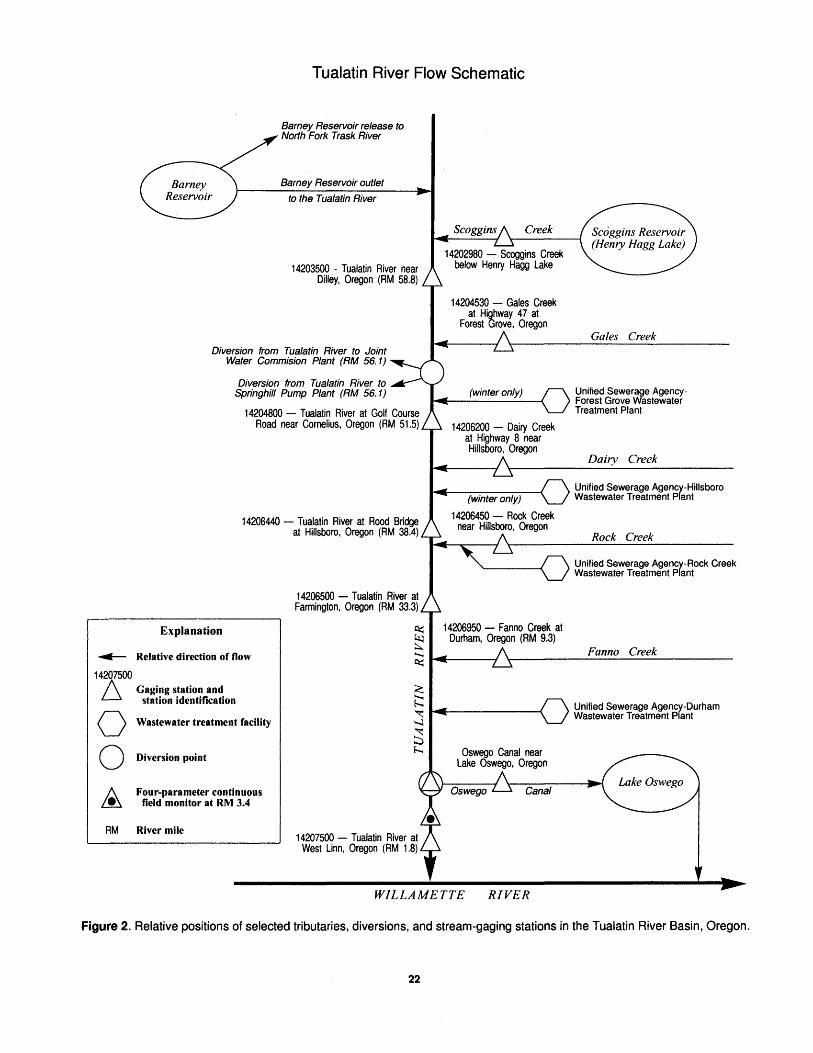
Tualatin River Flow Schematic
Barney Reservoir release to North Fork Trask River
Barney Reservoir outlet
to the Tualatin River
Scoggins/^ Creek
14203500 - Tuaiatin River near /\ Dilley, Oregon (RM 58.8) /\
Diversion from Tualatin River to Joint Water Commision Plant (RM 56.1)
Diversion from Tualatin River to Springhill Pump Plant (RM 56.1)
14204800 Tualatin River at Golf Course Road near Cornelius, Oregon (RM 51.5)
14202980 Scoggins Creek below Henry Hagg Lake
14204530 Gales Creekat Highway 47 at
Forest Grove, OregonA
Scoggins Reservoir (Henry Hagg Lake)
Gales Creek
(winter only) O14206200 Dairy Creek
at Highway 8 nearHillsboro, Oregon
14206440 Tualatin River at Rood Bridge
Unified Sewerage Agency- Forest Grove Wastewater Treatment Plant
Dairy Creek
(winter only)
14206450 Rock CreekO Unified Sewerage Agency-Hi
Wastewater Treatment Plant-Hillsboro
luaiaiiM nivw en nuuu onuye /\ np_. ujiuhnm Orpnnn at Hillsboro, Oregon (RM 38.4)/\ near Hlllsb?ro' OregonRock Creek
X \ O Unified Sewerage Agency-Rock Creek
Wastewater Treatment Plant
14206500 Tualatin River at /\ Farmington, Oregon (RM 33.3) 7 \
Explanation
Relative direction of flow
14207500 7\ Gaging station andL \ ctatinn irtantifirati
OO
station identification
Wastewater treatment facility
Diversion point
A Four-parameter continuous field monitor at RM 3.4
RM River mile
14206950 Fanno Creek atDurham, Oregon (RM 9.3)
f\
"iitied sewerage Agency-Durham Wastewater Treatment Plant
Oswego Canal near Lake Oswego, Oregon
Oswego Canal
14207500 Tualatin River at West Linn, Oregon (RM 1.8)
WILLAMETTE RIVER
Figure 2. Relative positions of selected tributaries, diversions, and stream-gaging stations in the Tualatin River Basin, Oregon.
22
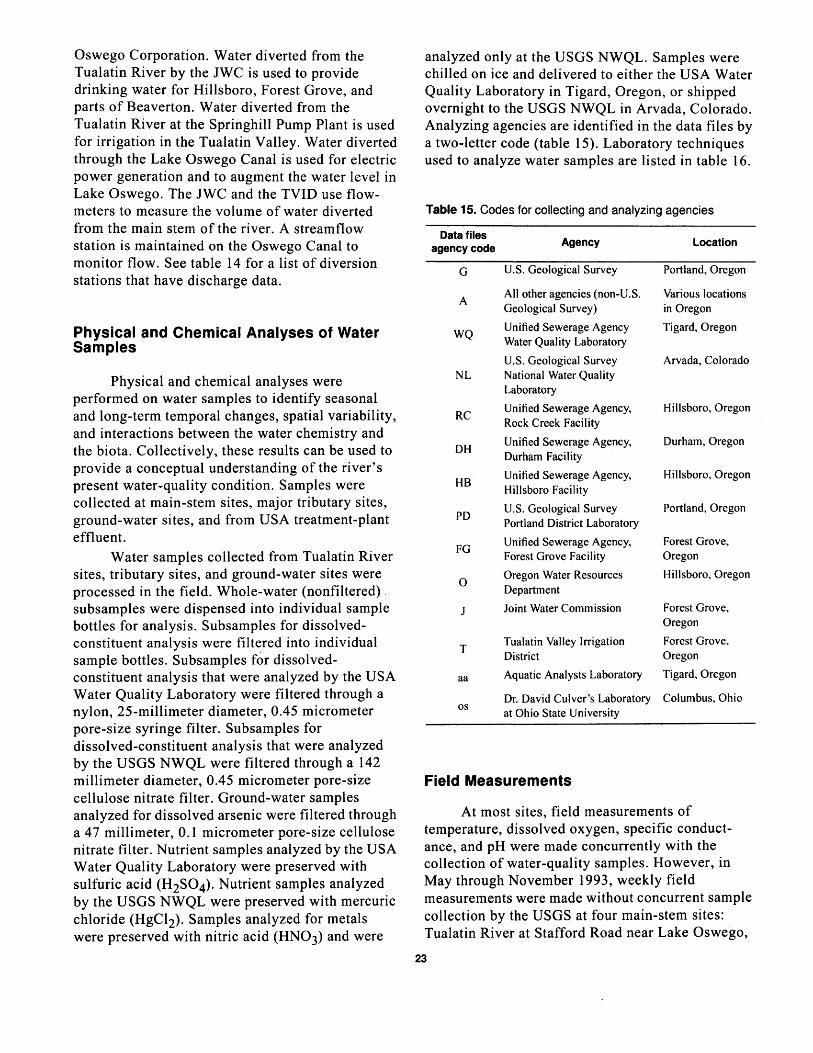
Oswego Corporation. Water diverted from the Tualatin River by the JWC is used to provide drinking water for Hillsboro, Forest Grove, and parts of Beaverton. Water diverted from the Tualatin River at the Springhill Pump Plant is used for irrigation in the Tualatin Valley. Water diverted through the Lake Oswego Canal is used for electric power generation and to augment the water level in Lake Oswego. The JWC and the TVID use flow- meters to measure the volume of water diverted from the main stem of the river. A streamflow station is maintained on the Oswego Canal to monitor flow. See table 14 for a list of diversion stations that have discharge data.
Physical and Chemical Analyses of Water Samples
Physical and chemical analyses were performed on water samples to identify seasonal and long-term temporal changes, spatial variability, and interactions between the water chemistry and the biota. Collectively, these results can be used to provide a conceptual understanding of the river's present water-quality condition. Samples were collected at main-stem sites, major tributary sites, ground-water sites, and from USA treatment-plant effluent.
Water samples collected from Tualatin River sites, tributary sites, and ground-water sites were processed in the field. Whole-water (nonfiltered) subsamples were dispensed into individual sample bottles for analysis. Subsamples for dissolved- constituent analysis were filtered into individual sample bottles. Subsamples for dissolved- constituent analysis that were analyzed by the USA Water Quality Laboratory were filtered through a nylon, 25-millimeter diameter, 0.45 micrometer pore-size syringe filter. Subsamples for dissolved-constituent analysis that were analyzed by the USGS NWQL were filtered through a 142 millimeter diameter, 0.45 micrometer pore-size cellulose nitrate filter. Ground-water samples analyzed for dissolved arsenic were filtered through a 47 millimeter, 0.1 micrometer pore-size cellulose nitrate filter. Nutrient samples analyzed by the USA Water Quality Laboratory were preserved with sulfuric acid (H2SO4). Nutrient samples analyzed by the USGS NWQL were preserved with mercuric chloride (HgC^). Samples analyzed for metals were preserved with nitric acid (HNO3) and were
analyzed only at the USGS NWQL. Samples were chilled on ice and delivered to either the USA Water Quality Laboratory in Tigard, Oregon, or shipped overnight to the USGS NWQL in Arvada, Colorado. Analyzing agencies are identified in the data files by a two-letter code (table 15). Laboratory techniques used to analyze water samples are listed in table 16.
Table 15. Codes for collecting and analyzing agencies
Data files agency code
G
A
WQ
ML
RC
DH
HB
PD
FG
O
J
T
aa
Agency
U.S. Geological Survey
All other agencies (non-U.S. Geological Survey)
Unified Sewerage Agency Water Quality Laboratory
U.S. Geological Survey National Water Quality LaboratoryUnified Sewerage Agency, Rock Creek Facility
Unified Sewerage Agency, Durham FacilityUnified Sewerage Agency, Hillsboro Facility
U.S. Geological Survey Portland District Laboratory
Unified Sewerage Agency, Forest Grove Facility
Oregon Water Resources DepartmentJoint Water Commission
Tualatin Valley Irrigation DistrictAquatic Analysts Laboratory
Location
Portland, Oregon
Various locations in Oregon
Tigard, Oregon
Arvada, Colorado
Hillsboro, Oregon
Durham, Oregon
Hillsboro, Oregon
Portland, Oregon
Forest Grove, Oregon
Hillsboro, Oregon
Forest Grove, Oregon
Forest Grove, OregonTigard, Oregon
OSDr. David Culver's Laboratory Columbus, Ohio at Ohio State University
Field Measurements
At most sites, field measurements of temperature, dissolved oxygen, specific conduct ance, and pH were made concurrently with the collection of water-quality samples. However, in May through November 1993, weekly field measurements were made without concurrent sample collection by the USGS at four main-stem sites: Tualatin River at Stafford Road near Lake Oswego,
23
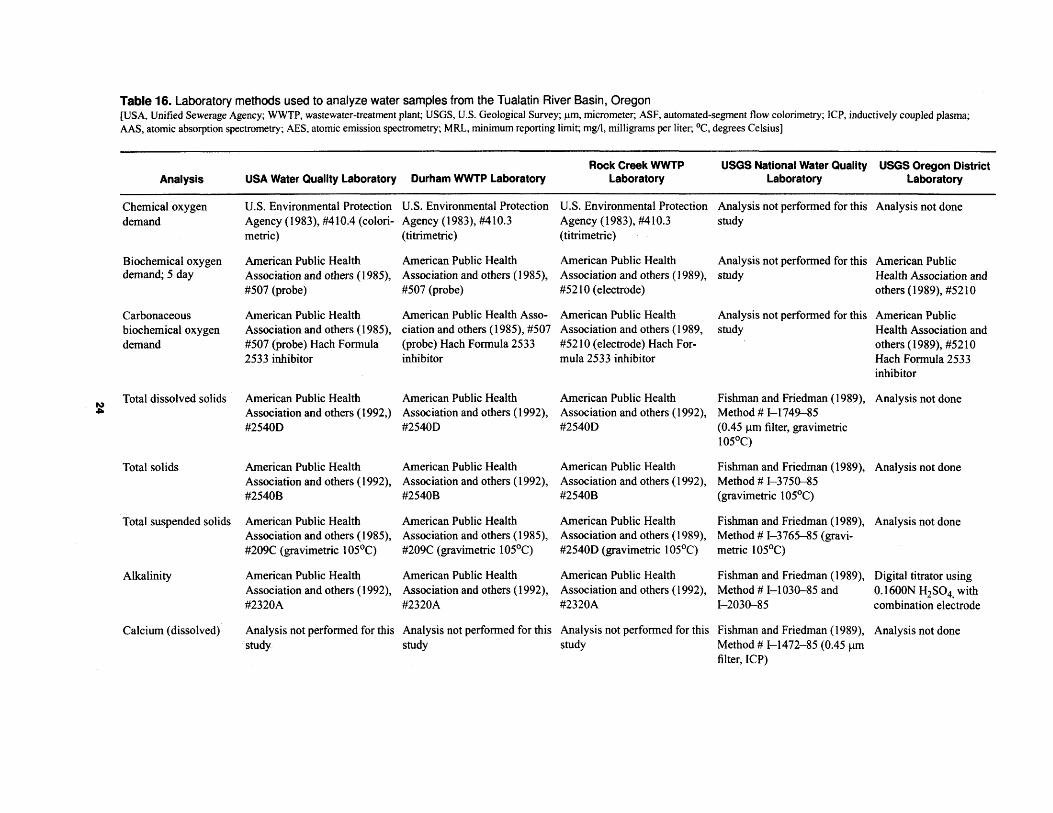
Table 16. Laboratory methods used to analyze water samples from the Tualatin River Basin, Oregon[USA, Unified Sewerage Agency; WWTP, wastewater-treatment plant; USGS, U.S. Geological Survey; urn, micrometer; ASF, automated-segment flow colorimetry; ICP, inductively coupled plasma; AAS, atomic absorption spectrometry; AES, atomic emission spectrometry; MRL, minimum reporting limit; mg/1, milligrams per liter; °C, degrees Celsius]
Analysis USA Water Quality Laboratory Durham WWTP LaboratoryRock Creek WWTP
LaboratoryUSGS National Water Quality
LaboratoryUSGS Oregon District
Laboratory
Chemical oxygen demand
Biochemical oxygen demand; 5 day
Carbonaceous biochemical oxygen demand
Total dissolved solids
Total solids
Total suspended solids
Alkalinity
Calcium (dissolved)
U.S. Environmental Protection U.S. Environmental ProtectionAgency (1983), #410.4 (colori- Agency (1983), #410.3metric) (titrimetric)
American Public Health Association and others (1985),#507 (probe)
American Public Health Association and others (1985),#507 (probe) Hach Formula 2533 inhibitor
American Public Health Association and others (1992,) #2540D
American Public Health Association and others (1992),#2540B
American Public Health Association and others (1985),#209C (gravimetric 105°C)
American Public Health Association and others (1992),#2320A
American Public Health Association and others (1985), #507 (probe)
American Public Health Asso ciation and others (1985), #507 (probe) Hach Formula 2533 inhibitor
American Public Health Association and others (1992), #2540D
American Public Health Association and others (1992),#25408
American Public Health Association and others (1985),#209C (gravimetric 105°C)
American Public Health Association and others (1992),#2320A
U.S. Environmental Protection Agency (1983), #410.3 (titrimetric)
American Public Health Association and others (1989),#5210 (electrode)
American Public Health Association and others (1989,#5210 (electrode) Hach For mula 2533 inhibitor
American Public Health Association and others (1992), #2540D
American Public Health Association and others (1992),#25408
American Public Health Association and others (1989),#2540D (gravimetric 105°C)
American Public Health Association and others (1992),#2320A
Analysis not performed for this Analysis not done study
Analysis not performed for this American Public study Health Association and
others (1989), #5210
Analysis not performed for this American Publicstudy
Fishman and Friedman (1989), Method #1-1749-35 (0.45 jam filter, gravimetric 105°C)
Fishman and Friedman (1989), Method # 1-3750-85 (gravimetric 105°C)
Fishman and Friedman (1989), Method # 1-3765-85 (gravi metric 105°C)
Health Association and others (1989), #5210 Hach Formula 2533 inhibitor
Analysis not done
Analysis not done
Analysis not done
Fishman and Friedman (1989), Digital titrator usingMethod # 1-1030-85 and 0.1600N H2SO4 with1 2030-85 combination electrode
Analysis not performed for this Analysis not performed for this Analysis not performed for this Fishman and Friedman (1989), Analysis not done study study study Method # 1-1472-85 (0.45 jim
filter, ICP)

Table 16. Laboratory methods used to analyze water samples from the Tualatin River Basin, Oregon Continued[USA, Unified Sewerage Agency; WWTP, wastewater-treatment plant; USGS, U.S. Geological Survey; jam, micrometer; ASF, automated-segment flow colorimetry; ICP, inductively coupled plasma; AAS, atomic absorption spectrometry; AES, atomic emission spectrornetry; MRL, minimum reporting limit; mg/1, milligrams per liter; °C, degrees Celsius]
Analysis USA Water Quality Laboratory Durham WWTP LaboratoryRock Creek WWTP
LaboratoryUSGS National Water Quality
LaboratoryUSGS Oregon District
Laboratory
Magnesium (dissolved) Analysis not performed for this Analysis not performed for this study study
Sodium (dissolved)
Silica (dissolved)
Iron (dissolved)
«» Iron (Total)
Manganese (dissolved)
Manganese (Total)
Aluminum (dissolved)
Arsenic (dissolved)
Boron (dissolved)
Analysis not performed for this Analysis not performed for this study study
Analysis not performed for this Analysis not performed for thisstudy study
Analysis not performed for this Analysis not performed for thisstudy study
Analysis not performed for this Analysis not performed for thisstudy study
Analysis not performed for this Analysis not performed for thisstudy study
Analysis not performed for this Analysis not performed for thisstudy study
Analysis not performed for this Analysis not performed for thisstudy study
Analysis not performed for this Analysis not performed for thisstudy study
Analysis not performed for this Analysis not performed for this study study
Analysis not performed for this study
Analysis not performed for this study
Analysis not performed for this study
Analysis not performed for this study
Analysis not performed for this study
Analysis not performed for this study
Analysis not performed for this study
Analysis not performed for this study
Analysis not performed for this study
Analysis not performed for this study
Fishman and Friedman ( 1 989), Analysis not done Method #1-1472-85 (0.45 (am filter, ICP)
Fishman and Friedman ( 1 989), Method #1-1472-85 (0.45 pm filter, ICP)
Fishman and Friedman ( 1 989), Method #1-1472-85 (0.45 urn filter, ICP)
Fishman and Friedman ( 1 989), Method #1-1472-85 (0.45 (am filter, ICP)
Fishman and Friedman ( 1 989), Method, #1-5474-85, AAS
Fishman and Friedman ( 1 989), Method #1-1 472-85 (0.45 (am filter, ICP)
Fishman and Friedman ( 1 989), Method #1-5474-85, AAS
Fishman and Friedman ( 1 989), Method #1-1 05 1-85 (0.45 (am filter, AES)
Fishman and Friedman ( 1 989), Method #1-2062-85 (0.1 ^un filter, AAS)
Fishman and Friedman ( 1 989), Method #1-1 11 4-85 (0.45 jam filter, AES)
Analysis not done
Analysis not done
Analysis not done
Analysis not done
Analysis not done
Analysis not done
Analysis not done
Analysis not done
Analysis not done
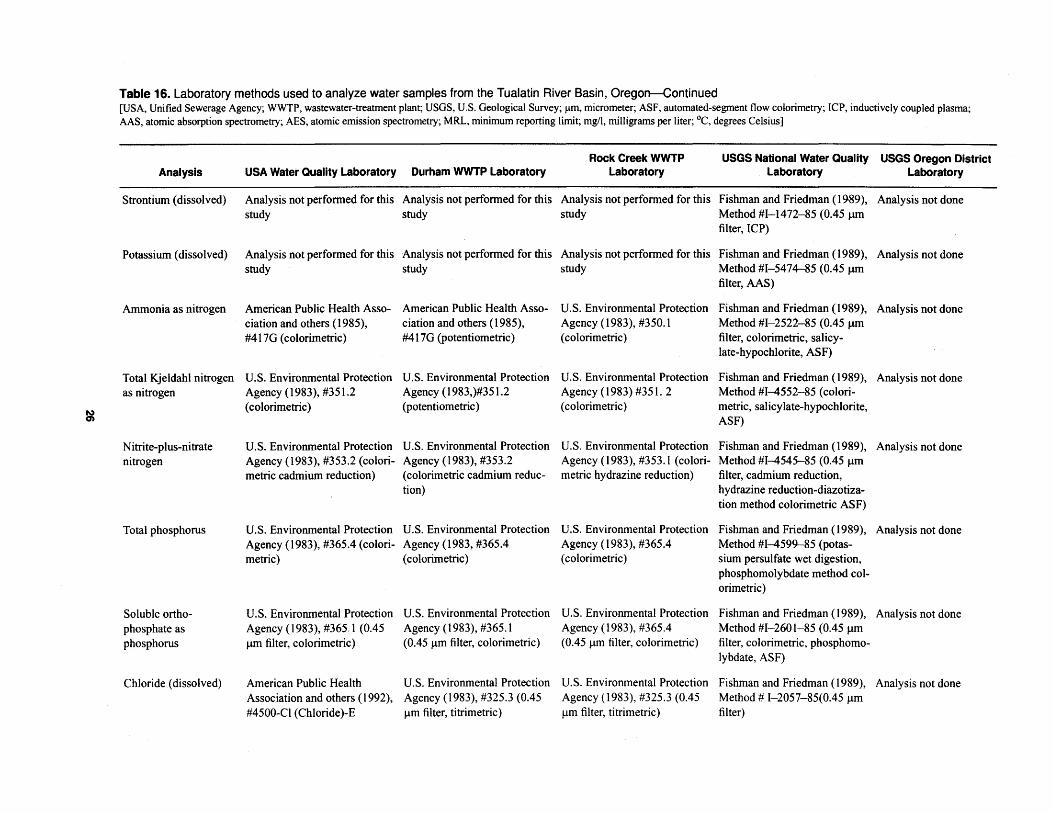
Table 16. Laboratory methods used to analyze water samples from the Tualatin River Basin, Oregon Continued[USA, Unified Sewerage Agency; WWTP, wastewater-treatment plant; USGS, U.S. Geological Survey; urn, micrometer; ASF, automated-segment flow colorimetry; ICP, inductively coupled plasma; AAS, atomic absorption spectrometry; AES, atomic emission specrrometry; MRL, minimum reporting limit; mg/1, milligrams per liter; °C, degrees Celsius]
Analysis USA Water Quality Laboratory Durham WWTP LaboratoryRock Creek WWTP
LaboratoryUSGS Oregon District
Laboratory
Strontium (dissolved)
Potassium (dissolved)
Ammonia as nitrogen
Total Kjeldahl nitrogen as nitrogen
Nitrite-plus-nitrate nitrogen
Total phosphorus
Soluble ortho- phosphate as phosphorus
Chloride (dissolved)
Analysis not performed for this Analysis not performed for this Analysis not performed for this Fishman and Friedman (1989), Analysis not done study study study Method #1-1472-85 (0.45 (am
filter, ICP)
Analysis not performed for this Analysis not performed for this Analysis not performed for this Fishman and Friedman (1989), Analysis not done study study study Method #I-5474-S5 (0.45 (am
filter, AAS)
American Public Health Asso ciation and others (1985), #417G (colorimetric)
U.S. Environmental Protection Agency (1983), #351.2 (colorimetric)
American Public Health Asso ciation and others (1985), #417G (potentiometric)
U.S. Environmental Protection Agency (1983,)#351.2 (potentiometric)
U.S. Environmental Protection U.S. Environmental Protection Agency (1983), #353.2 (colori- Agency (1983), #353.2 metric cadmium reduction) (colorimetric cadmium reduc
tion)
U.S. Environmental Protection U.S. Environmental ProtectionAgency (1983), #365.4 (colori- Agency (1983, #365.4metric) (colorimetric)
U.S. Environmental Protection Agency (1983), #365.1(0.45 Urn filter, colorimetric)
American Public Health Association and others (1992), #4500-C1 (Chloride)-E
U.S. Environmental Protection Agency (1983), #365.1 (0.45 um filter, colorimetric)
U.S. Environmental Protection Agency (1983), #325.3 (0.45 um filter, titrimetric)
U.S. Environmental Protection Agency (1983), #3 50.1 (colorimetric)
U.S. Environmental Protection Agency (1983) #351.2 (colorimetric)
Fishman and Friedman (1989), Method #1-2522-85 (0.45 ^m filter, colorimetric, salicy- late-hypochlorite, ASF)
Fishman and Friedman (1989), Method #1-4552-85 (colori metric, salicylate-hypochlorite, ASF)
Analysis not done
Analysis not done
U.S. Environmental Protection Fishman and Friedman (1989), Analysis not done Agency (1983), #353.1 (colori- Method #1-4545-85 (0.45 urn metric hydrazine reduction) filter, cadmium reduction,
hydrazine reduction-diazotiza- tion method colorimetric ASF)
U.S. Environmental Protection Agency (1983), #365.4 (colorimetric)
U.S. Environmental Protection Agency (1983), #365.4 (0.45 (am filter, colorimetric)
U.S. Environmental Protection Agency (1983), #325.3 (0.45 jam filter, titrimetric)
Fishman and Friedman (1989), Method #1-4599-85 (potas sium persulfate wet digestion, phosphomolybdate method col orimetric)
Fishman and Friedman (1989), Method #1-2601-85 (0.45 um filter, colorimetric, phosphomo lybdate, ASF)
Fishman and Friedman (1989), Method # 1-2057-85(0.45 um filter)
Analysis not done
Analysis not done
Analysis not done
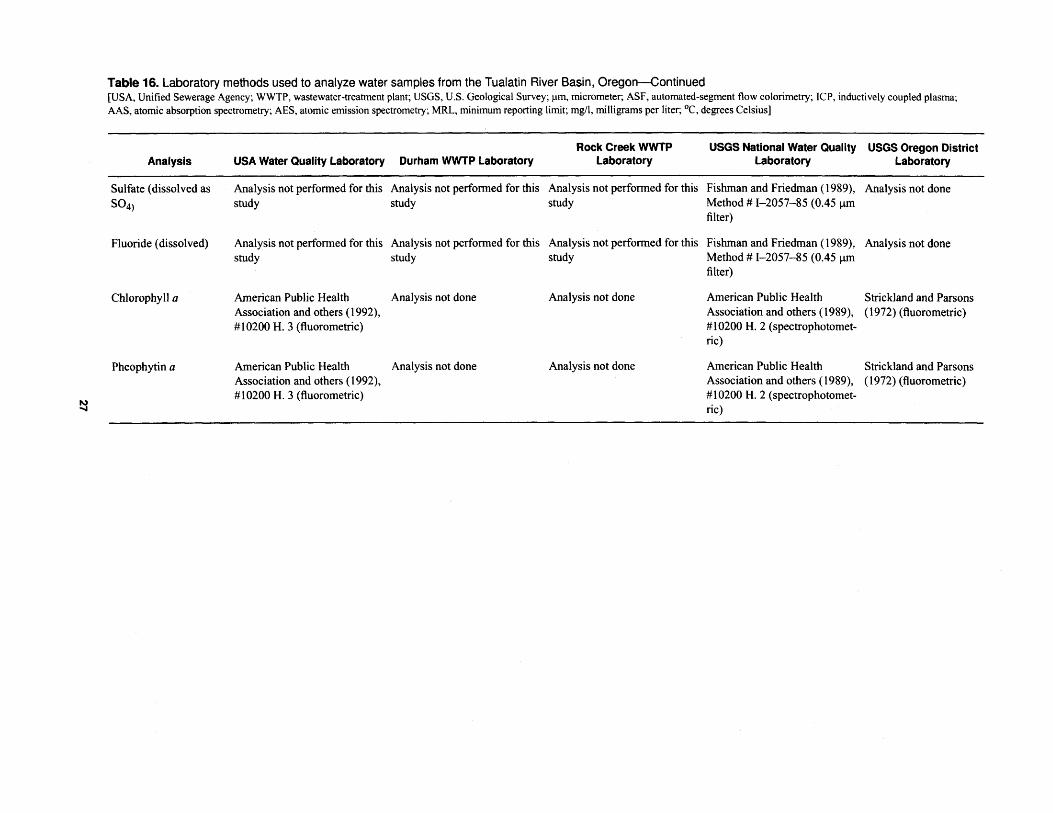
Table 16. Laboratory methods used to analyze water samples from the Tualatin River Basin, Oregon Continued[USA, Unified Sewerage Agency; WWTP, wastewater-treatment plant; USGS, U.S. Geological Survey; urn, micrometer; ASF, automated-segment flow colorimetry; ICP, inductively coupled plasma; AAS, atomic absorption spectrometry; AES, atomic emission spectrometry; MRL, minimum reporting limit; mg/l, milligrams per liter; °C, degrees Celsius]
Analysis USA Water Quality Laboratory Durham WWTP LaboratoryRock Creek WWTP
LaboratoryUSGS National Water Quality
LaboratoryUSGS Oregon District
Laboratory
Sulfate (dissolved as Analysis not performed for this Analysis not performed for thisSC>4) study study
Fluoride (dissolved) Analysis not performed for this Analysis not performed for thisstudy study
Analysis not performed for this Fishman and Friedman (1989), Analysis not done study Method # 1-2057-85 (0.45 um
filter)
Analysis not performed for this Fishman and Friedman (1989), Analysis not doneMethod # 1-2057-85 (0.45 ^m filter)
Chlorophyll a
Pheophytin a
American Public Health Analysis not done Association and others (1992), #10200 H. 3 (fluorometric)
American Public Health Analysis not done Association and others (1992), #10200 H. 3 (fluorometric)
study
Analysis not done
Analysis not done
American Public Health Association and others (1989),#10200 H. 2 (spectrophotomet- ric)
American Public Health Association and others (1989),#10200 H. 2 (spectrophotomet- ric)
Strickland and Parsons (1972) (fluorometric)
Strickland and Parsons (1972) (fluorometric)

Tualatin River at Boones Ferry Road at Tualatin, Tualatin River at Elsner Road near Sherwood, and Tualatin River at Highway 210 Bridge near Scholls. Field measurements made in the main stem below RM 30 were taken in vertical profiles to document thermal stratification and its effects on water quality. Readings were taken at depths of 1-foot, 3-foot, and at subsequent 3-foot intervals. USGS personnel used calibrated Hydrolab multiparameter instruments to obtain field measurements. USA personnel used single parameter meters to obtain field measurements from January 1991 through November 1992. In November 1992, USA per sonnel began using Hydrolab multiparameter instruments to obtain field measurements of temperature, dissolved oxygen, specific conductance, and pH.
Insolation Rates
A continuous-reading LI-CORLI-190SA model quantum sensor was installed on the roof of the Durham wastewater-treatment plant during the low-flow sampling season. The quantum sensor was controlled by a Campbell CR-21 Micrologger. The data were stored in a Campbell SM-192 storage module and later downloaded to a personal com puter. The quantum sensor measured photosyntheti- cally active radiation (PAR) on a flat surface in the 400 to 700 nanometer wavelength range. The data on the CD-ROM are averages of 60 instantaneous measurements taken at 1-minute intervals over the previous hour and are reported in microeinsteins per square meter per second ((aE/[m s]).
Light-Extinction Coefficients
A submersible LI-COR LI-193SA spherical quantum sensor was used to measure the underwater PAR at three main-stem sites on the Tualatin River. The quantum sensor was controlled by a Campbell CR-21 Micrologger. A measurement was taken at the water surface, with the sensor totally submerged, to obtain the initial reading. Subsequent readings were taken at several depths within a vertical profile. The light-extinction coefficient was calculated using Beer's Law:
where
Iz - irradiance at depth z,IQ = irradiance at river surface,e = the irrational number 2.71828k = extinction coefficient, andz = depth distance in meters, (Wetzel, 1983).
Four-Parameter Continuous Field Monitor at River Mile 3.4
A continuous-reading, four-parameter USGS field monitor was installed at RM 3.4. This monitor measured water temperature, pH, dissolved oxygen, and specific conductance on an hourly basis. The electronics unit was housed in a cylindrical water tight container 10 inches high by 10.5 inches in diameter. The probes were mounted in a perforated PVC pipe on the upstream side of the fish ladder at the Oswego Dam (RM 3.4). There is sufficient flow at this location for the probes to be fully submerged even during low-flow periods of the year. The continuous field monitor was controlled by a Campbell CR-21 Micrologger, and the data were stored in a Campbell SM-192 storage module. Data collected by the storage module were later downloaded to a USGS database. Depth of probe deployment was dependent on the water level of the river. Probes were never less than 10 inches below the water surface and were never more than 5 feet below the water surface. The monitor was installed in May 1991 and continually recorded data during the study period.
Meteorological Data from Tualatin Valley Irrigation District Agrimet Weather Station
Meteorological data from the TVID Agrimet Weather Station located in Verboort, Oregon (pi. 1), are included in this report. This weather station measures and records air temperature, dewpoint, windspeed, wind direction, and precipitation (rainfall). The measurements were made at 15-minute intervals over the 24-hour period from 11:00 p.m. to 11:00 p.m. the following day. A total of 96 values, therefore, were used to determine a daily mean value. Recorded maximum and minimum air temperatures are the maximum and minimum readings over the 24-hour period. Dewpoint is calculated from the mean relative humidity for the 24-hour period and the mean daily air temperature for the 24-hour period. Windspeed is reported as a
28

mean velocity determined from the 96 individual windspeed readings during the 24-hour period. Wind direction is a mean value determined from an average of all 96 wind-direction readings over the 24-hour period and is reported in compass degrees, where zero degrees represents true north. Rainfall is reported as a total value for the 24-hour period, measured in inches.
Biological Data
Biological data collected during this study included benthic-macroinvertebrate identification and enumeration, phytoplankton identification and enumeration, and zooplankton identification and enumeration. All biological data were collected by the USGS during the low-flow sampling season (usually from May to November).
Benthic Macroinvertebrates
Benthic-macroinvertebrate samples were collected by the USGS at 10 sites in May 1992 and at 4 sites in November 1992. Samples were acquired by using either an Ekman dredge sampler, a Surber sampler, or by scraping samples from submerged material in the Tualatin River. All samples were preserved in formalin. Macroinvertebrate specimens were separated from associated debris and examined with a dissecting microscope. Specimens were differentiated by functional group and were enumerated and taxonomically classified to order, family, or genus level. Identifications and enumerations are presented in the supplemental data tables 18, 19, and 20 at the back of the report.
Phytoplankton
Phytoplankton samples were collected weekly by the USGS on the Tualatin River during the low-flow season. Samples were subsampled from a USGS churn splitter concurrent with other water-quality samples. Samples were collected in a 250-milliliter brown-opaque plastic bottle with 2.5 milliliters of Lugol's solution added as a preservative (Wetzel and Likens, 1979). Phytoplankton samples preserved in Lugol's solution have a shelf life of more than 1 year. Analyses were performed by Aquatic Analysts Laboratory of Tigard, Oregon.
Slides for identification and enumeration were prepared by filtering an aliquot of sample through a 0.45 micrometer filter. A section of the filter was cut out and placed on a glass slide with immersion oil added to make the filter transparent. A coverslip was placed on top of the slide. Nail polish was applied to the periphery of the coverslip to adhere the coverslip to the slide. By using this method, slides can be archived indefinitely.
Algal units (cells, colonies, or filaments) were counted along a measured transect of the microscope slide. Only algae that were believed to be alive at the time of collection (those with intact chloroplasts) were counted. A minimum of 100 algal units were counted. Abundances are reported in number per milliliter for each species.
Zooplankton
In 1991, zooplankton samples were collected using a 12-inch diameter conical 35-micrometer- mesh tow net. In 1992 and 1993, samples were collected using a 12-inch diameter conical 80-micrometer-mesh tow net. For zooplankton samples collected at Scoggins Creek below Henry Hagg Lake (USGS station number 14202980) and Tualatin River at Dilley (USGS station number 14203500), the net was placed in midchannel for 3 to 5 minutes. Empirical relations between flow and velocity were used to determine the total volume of water filtered. Ideally, 1 cubic meter of water was filtered at each station. At all other zooplankton sample-collection sites, the net was towed along a cross section at an average rate of 0.5 meters per second, but the tow speed was varied somewhat to facilitate vertical integration. Towing distances were premeasured and marked for accuracy. Samples were preserved by using buffered-sugared formalin. Analyses of zooplankton samples were performed by ZP's Taxonomic Services of Keizer, Oregon.
Zooplankton were enumerated by splitting an approximate total subsample size of 400 individuals and counting until 100 individuals of the most abundant species was reached. A minimum of 300 crustaceans were counted if present in a particular sample. If initial sample splits did not achieve the numeric criteria, larger sample splits were used until the criteria were met. Samples were enumerated at 32X magnification. Species identifications were made at higher levels of magnification when necessary. Abundances are reported in number per cubic meter for each species.
29
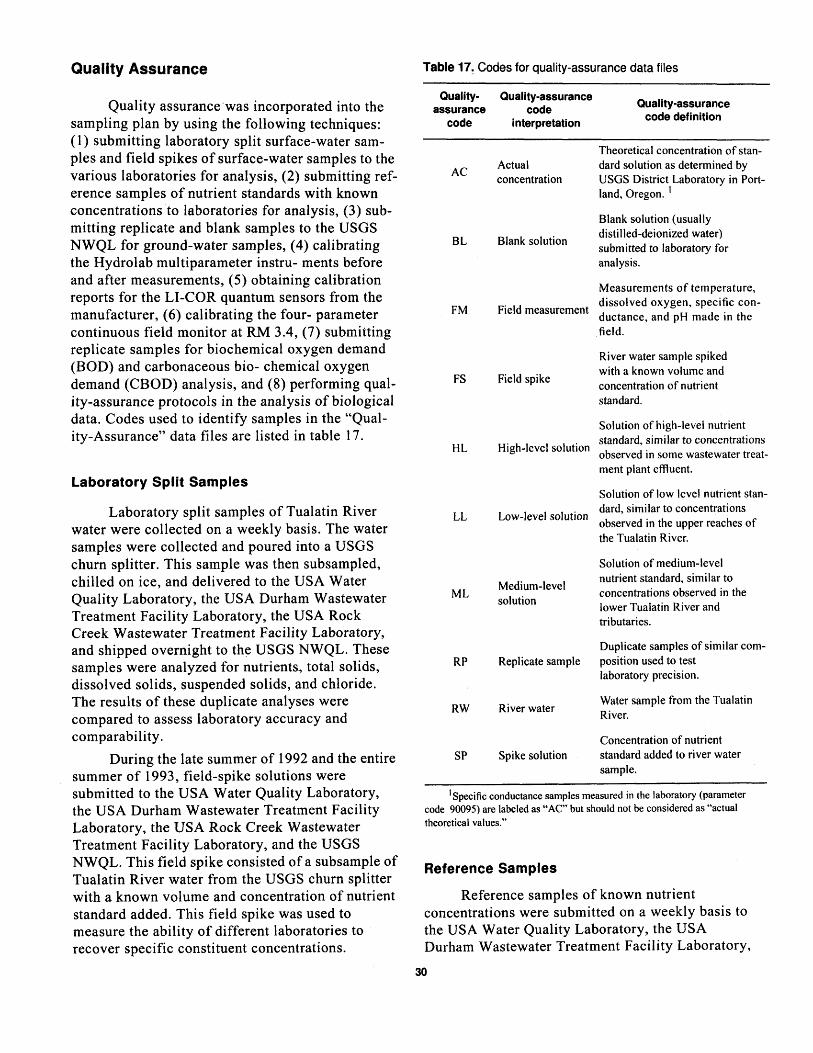
Quality Assurance
Quality assurance was incorporated into the sampling plan by using the following techniques: (1) submitting laboratory split surface-water sam ples and field spikes of surface-water samples to the various laboratories for analysis, (2) submitting ref erence samples of nutrient standards with known concentrations to laboratories for analysis, (3) sub mitting replicate and blank samples to the USGS NWQL for ground-water samples, (4) calibrating the Hydrolab multiparameter instru- ments before and after measurements, (5) obtaining calibration reports for the LI-COR quantum sensors from the manufacturer, (6) calibrating the four- parameter continuous field monitor at RM 3.4, (7) submitting replicate samples for biochemical oxygen demand (BOD) and carbonaceous bio- chemical oxygen demand (CBOD) analysis, and (8) performing qual ity-assurance protocols in the analysis of biological data. Codes used to identify samples in the "Qual ity-Assurance" data files are listed in table 17.
Laboratory Split Samples
Laboratory split samples of Tualatin River water were collected on a weekly basis. The water samples were collected and poured into a USGS churn splitter. This sample was then subsampled, chilled on ice, and delivered to the USA Water Quality Laboratory, the USA Durham Wastewater Treatment Facility Laboratory, the USA Rock Creek Wastewater Treatment Facility Laboratory, and shipped overnight to the USGS NWQL. These samples were analyzed for nutrients, total solids, dissolved solids, suspended solids, and chloride. The results of these duplicate analyses were compared to assess laboratory accuracy and comparability.
During the late summer of 1992 and the entire summer of 1993, field-spike solutions were submitted to the USA Water Quality Laboratory, the USA Durham Wastewater Treatment Facility Laboratory, the USA Rock Creek Wastewater Treatment Facility Laboratory, and the USGS NWQL. This field spike consisted of a subsample of Tualatin River water from the USGS churn splitter with a known volume and concentration of nutrient standard added. This field spike was used to measure the ability of different laboratories to recover specific constituent concentrations.
Table 17. Codes for quality-assurance data files
Quality- assurance
code
Quality-assurancecode
interpretation
Quality-assurance code definition
Theoretical concentration of stan dard solution as determined by USGS District Laboratory in Port land, Oregon. '
Blank solution (usually distilled-deionized water) submitted to laboratory for analysis.
Measurements of temperature, . ,. dissolved oxygen, specific con- Field measurement , A j ,, , . ,, ductance, and pH made in the
field.
AC
BL
FM
FS
HL
LL
ML
RW
Actual concentration
Blank solution
Field spike
High-level solution
Low-level solution
Medium-level solution
RP Replicate sample
River water
SP Spike solution
River water sample spiked with a known volume and concentration of nutrient standard.
Solution of high-level nutrient standard, similar to concentrations observed in some wastewater treat ment plant effluent.
Solution of low level nutrient stan dard, similar to concentrations observed in the upper reaches of the Tualatin River.
Solution of medium-level nutrient standard, similar to concentrations observed in the lower Tualatin River and tributaries.
Duplicate samples of similar com position used to test laboratory precision.
Water sample from the Tualatin River.
Concentration of nutrient standard added to river water sample.
1 Specific conductance samples measured in the laboratory (parameter code 90095) are labeled as "AC" but should not be considered as "actual theoretical values."
Reference Samples
Reference samples of known nutrient concentrations were submitted on a weekly basis to the USA Water Quality Laboratory, the USA Durham Wastewater Treatment Facility Laboratory,
30

the USA Rock Creek Wastewater Treatment Facility Laboratory, and occasionally to the USGS NWQL. Reference solutions were submitted in three concentration levels: (1) a low-level solution, which contained nutrient concentrations similar to those in the upper reaches of the Tualatin River, (2) a medium-level solution, which contained nutrient concentrations similar to those in tributaries and the lower Tualatin River, and (3) a high-level solution, which contained nutrient concentrations similar to those in some wastewater-treatment-plant effluents. A blank solution of distilled-deionized water that was used to prepare the reference solutions was also submitted to the USA Water Quality Laboratory on a weekly basis and on occasion to the USGS NWQL. The blank solution was analyzed to be certain that the distilled- deionized water did not contain detectable nutrient concentrations and was not contaminating nutrient standards with additional concentrations of the target analytes. In addition, the USGS NWQL conducts a blind-sample quality-assurance program to assess laboratory precision. The results from 1991 were reported in Maloney and others (1994). Quality-control practices employed by the USGS NWQL were reported by Pritt and Raese (1992). Results of the blind-sample program are available in the National Water Information System (NWIS) database (Lucey, 1990). These quality-assurance data were used to evaluate sample-collection and processing techniques, water-matrix affects, laboratory accuracy and precision, and the comparability of each laboratory's analytical results.
Quality Assurance of Ground-Water Samples
Ground-water samples were analyzed at the USGS NWQL. Quality assurance of ground-water samples was assessed by submitting replicate sam ples and blank samples to the USGS NWQL. Repli cate samples were collected at a site immediately after the actual sample, and the two were considered to be identical in composition. Replicates are used to assess the consistency of sample-collection and sample-processing tech- niques and analytical pre cision. Blank solutions consisted of distilled-deion ized water that was presumed to contain the target analytes at concen- trations below their detection limits. The distilled- deionized water was pumped through the same sampling apparatus as the ground-water samples. The results of the replicate
and blank-solution analyses are listed in the ground- water quality-assurance section of the data files on CD-ROM (table 1).
Calibration of Multiparameter Water-Quality Field Probes
Hydrolab multiparameter water-quality probes were calibrated immediately before and after use, according to the manufacturer's recommendations. Calibration results were recorded in maintenance logbooks for each instrument. Slight linear shifts were applied to temperature, specific conductance, pH, and dissolved oxygen when calibration differ ences exceeded 0.2 degrees Celsius, 5 percent, 0.2 pH units, and 0.2 milligrams per liter, respectively. USGS techniques for the computation of streamflow records (Kennedy, 1983) were applied to water-qual ity data to shift, develop, and check field-parameter data from these instruments.
Calibration of Quantum Sensors
The quantum sensors used to measure PAR were calibrated by the manufacturer in April 1991 and March 1992. The manufacturer recommended that the sensors be recalibrated every 2 years. Cali bration constants and calibration multipliers were within plus or minus 2 percent for the submersible spherical quantum sensor. Calibration constants and calibration multipliers were within plus or minus 2.2 percent for the quantum sensor placed on the roof of the Durham Wastewater Treatment Facility. The sensors were cleaned regularly during the study period.
Calibration of Four-Parameter Continuous Field Monitor
The four-parameter continuous field monitor installed at RM 3.4 was calibrated on a weekly basis during the low-flow sampling season (May through November) and on a monthly basis during the high-flow periods of the year. Calibration results were recorded in a logbook. When necessary, linear shifts were applied to recorded data according to USGS techniques for the computation of streamflow records (Kennedy, 1983).
31

Quality Assurance for Biochemical Oxygen Demand Samples
BOD and CBOD samples were analyzed at the USGS District Laboratory in Portland, Oregon. DO meters were calibrated before use, and the cali bration was checked after all samples were ana lyzed. Replicate samples were subsampled from the same churn splitter and presumed to be identical in composition. These replicate samples were used to evaluate sample-processing and laboratory analyti cal precision. The BOD and CBOD measurements in the surface-water-quality section of the data files (table 1) are an average of the two replicate analy ses acquired on that date. The BOD and CBOD measurements in the quality-assurance section of the data files include both of the replicate analyses successively.
Quality Assurance for Biological Samples
Quality assurance for the benthic- macroinvertebrate samples was performed by employing a second biologist to perform random checks on enumerations to confirm identifications.
The microscope used to enumerate phytoplankton samples by Aquatic Analysts of Tigard, Oregon, was calibrated by using a standard, concentration of latex spheres provided by the Environmental Protection Agency (EPA). The concentration of these spheres was 12,075 per milliliter. Duplicate preparations of the standard spheres were analyzed; the average result was 11,700 spheres per milliliter (96.9 percent). The computer program used to calculate algal densities was adjusted to compensate for this 3.1 percent error. Slides prepared by Aquatic Analysts from phytoplankton samples were archived and are available for review. In 1993, phytoplankton samples were split and sent to both Aquatic Analysts and to Dr. David Culver's Laboratory at Ohio State University. Dr. Culver's Laboratory used methods of Utermohl (1931).
Quality assurance of zooplankton samples analyzed by ZP's Taxonomic Services of Keizer, Oregon, was performed by recounting between 2 percent and 5 percent of all samples. Taxonomic accuracy was maintained by frequent discussions with other taxonomists and regular reviews of the literature.
REFERENCES CITED
American Public Health Association, American Water Works Association, and Water Pollution Control Federation, 1985, Standard methods for the examination of water and wastewater (16th ed.): Washington, D.C., American Public Health Association [variously paged].
1989, Standard methods for the examination of water and wastewater (17th ed.): Washington, D.C., American Public Health Association [variously paged].
1992, Standard methods for the examination of waterand wastewater (18th ed.): Washington, D.C., American Public Health Association [variously paged].
Edwards, T.K., and Glysson, D.G., 1988, Field methods for measurement of fluvial sediment: U.S. Geological Survey Open-File Report 86-531, 118 p.
Fishman, M.J., and Friedman, L.C., 1989, Methods for the determination of inorganic substances in water and fluvial sediments: U.S. Geological Survey Techniques of Water-Resources Investigations, book 5, chapter Al, 546 p.
Kennedy, E.J., 1983, Computation of continuous records of streamflow: U.S. Geological Survey Techniques of Water-Resources Investigations, book 3, chapter A13, 53 p.
Lucey, K.J., 1990, QADATA User's Manual: An interactive computer program for the retrieval and analysis of the results from the external blind sample quality-assurance project of the U.S. Geological Survey: U.S. Geological Survey Open-File Report 90-162, 53 p.
Maloney, T.J., Ludtke, A.S., and Krizman, T.L., 1994,Quality-assurance results for routine water analysis in U.S. Geological Survey laboratories, water year 1991: U.S. Geological Survey Water-Resources Investigations Report 94-4046, 144 p.
Pritt, J.W., Raese, J.W., eds., 1992, Quality assurance/quality control manual National Water Quality Laboratory: U.S. Geological Survey Open-File Report 92-495, 33 p.
Strickland, J.D.H., and Parsons, T.R., 1972, A practical handbook of seawater analysis (2d ed.): Fisheries Research Board of Canada, Bulletin 167, p. 201-203.
Utermohl, H., 1931, Neue Wege in der quantitativen Erfassung des Planktons. Verhandlungen der Internationale Vereinigung fur theoretische und angewandte: Limnologie, 5, 567 96.
U.S. Environmental Protection Agency, 1983, Methods for chemical analysis of water and wastes: EPA-600/4-79- 020 [variously paged].
Washington County Department of Land Use and Trans portation [n.d.], Washington County at-a-glance: Hillsboro, Oregon, Division of Planning, 6 p.
Wetzel, R.G., 1983, Limnology (2d ed): Philadelphia, Pennsylvania, CBS College Publishing, p. 51-62.
Wetzel, R.G., and Likens, G.E., 1979, Limnological analyses: Philadelphia, Pennsylvania, W.B. Saunders Company, p. 138-139, 158.
32

SUPPLEMENTAL DATA TABLES
33

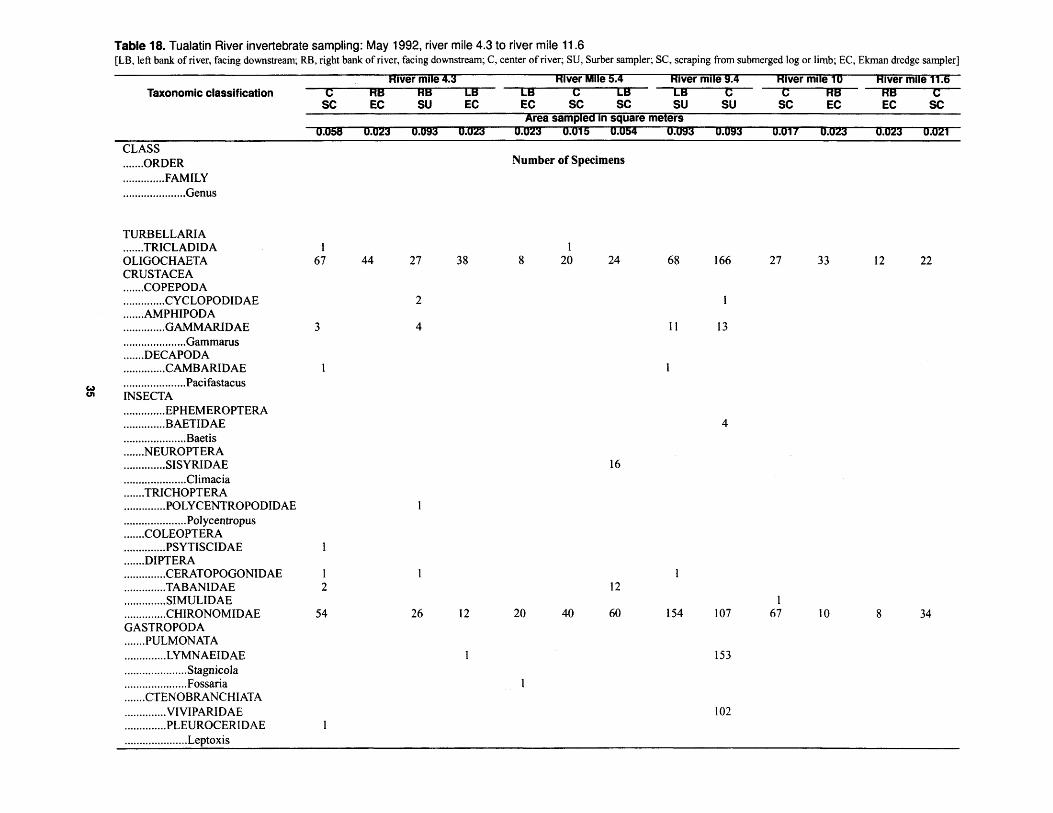
Table 18. Tualatin River invertebrate sampling: May 1992, river mile 4.3 to river mile 11.6[LB, left bank of river, facing downstream; RB, right bank of river, facing downstream; C, center of river; SU, Surber sampler; SC, scraping from submerged log or limb; EC, Ekman dredge sampler]
River mile 4.3 River Mile 5.4 River mile 9.4 River mile 10 River mile 11.6Taxonomic classification C RB RB CBCBC CB CBC C RB RB C
SC EC SU EC____EC SC SC____SU SU____SC EC EC SCArea sampled in square meters
_________________________ 0.058 U.OZ3 Q.U93 U.UZ3 0.023 U.U15 U.054 U.093 0.093 U.017 0.023 Q.UZ3 0.021
CLASS.......ORDER Number of Specimens..............FAMILY.....................Genus
TURBELLARIA.......TRICLADIDA 1 1OLIGOCHAETA 67 44 27 38 8 20 24 68 166 27 33 12 22CRUSTACEA.......COPEPODA..............CYCLOPODIDAE 2 1.......AMPHIPODA..............GAMMARIDAE 3 4 11 13.....................Gammarus.......DECAPODA..............CAMBARIDAE 1 I.....................PacifastacusINSECTA ..............EPHEMEROPTERA..............BAETIDAE 4.....................Baetis.......NEUROPTERA..............SISYRIDAE 16.....................Climacia.......TRICHOPTERA..............POLYCENTROPODIDAE 1.....................Polycentropus.......COLEOPTERA..............PSYTISCIDAE 1.......DIPTERA..............CERATOPOGONIDAE 1 1 1..............TABANIDAE 2 12..............SIMULIDAE 1..............CHIRONOMIDAE 54 26 12 20 40 60 154 107 67 10 8 34GASTROPODA .......PULMONATA..............LYMNAEIDAE 1 153.....................Stagnicola.....................Fossaria 1.......CTENOBRANCHIATA..............VIVIPARIDAE 102..............PLEUROCERIDAE 1.....................Leptoxis __

Table 19. Tualatin River invertebrate sampling: May 1992, river mile 16.3 to river mile 63.9[LB, left bank of river, facing downstream; RB, right bank of river, facing downstream; C, center of river; SU, Surber sampler; SC, scraping from submerged log or limb; EC, Ekman dredge sampler]
River mile 16.3Taxonomic classification C
EC
0.023
LB EC
0.023
C SC
0.027
C SC
River mile 26.9RB LB C C EC EC SC EC
Area sampled in square meters0.014 0.023 0.023 0.014 0.079
River mile 44.4CSC
0.026
RB EC
0.023
C SU
0.093
56.1
SC
0.018
River mile 63.9LBSU
0.093
C SU
0.093
CLASS .......ORDER..............FAMILY.....................Genus Number of Specimens
OLIGOCHAETA 26 14 57 90 51 40 12 32 10 40 4 52 10 4ARACHNOIDEA.......HYDRACARINA 1 4INSECTA ..............PLECOPTERA..............PERLODIDAE 4.....................Isoperla..............CHLOROPERLIDAE 4 4..............NEMOURIDAE 8 5.....................Zapada.......EPHEMEROPTERA..............BAETIDAE 1 2 28 78 12.....................Baetis..............SIPHLONURIDAE 4 1.....................Ameletus..............LEPTOPHLEBHDAE 16..............TRIORYTHIDAE 5..............HEPTAGENIIDAE 16 8.....................Epeorus..............EPHEMERIDAE 2.....................Serratella.......TRICHOPTERA..............HYDROPSYCHIDAE 3.....................Arc topsyche.......COLEOPTERA..............ELMIDAE 18 8..................... Optioserrus.......ODONATA 1.......DIPTERA..............CERATOPOGONIDAE 1 2 18..............SIMULIDAE 31..............CHIRONOMIDAE 28 27 20 22 12 36 27 22 12 88 100 32..............TIPULIDAE 3..............ANTHOMYIIDAE 1GASTROPODA .......PULMONATA..............LYMNAEIDAE 3.....................Stagnicola ________________________________

Table 20. Tualatin River invertebrate sampling: November 1992, river mile 4.3 to river mile 10.0[LB, left bank of river, facing downstream; RB, right bank of river, facing downstream; C, center of river; SU, Surber sampler; SC, scraping from submerged log or limb; EC, Ekman dredge sampler]
River mile 4.3 River mile 5.4Taxonomic classification LB
SULa SC
RB SC
RB EC
LB SU SC SC
RB EC SU SU SU
River mile 10.0 TfB LT5 SC EC
Area sampled in square meters0.093 0.01 0.048 0.023 0.093 0.016 0.024 0.023 0.093 0.093 0.093 0.032 CI.023^
CLASS .......ORDER..............FAMILY.....................Genus
TURBELLARIA.......TRILADIDA 1OLIGOCHAETA 40 29 12 16CRUSTACEA.......COPEPODA 1..............CYCLOPOIDA.......AMPHIPODA..............GAMMARIDAE 44 1.....................GammarusARACHNOIDEA.......HYDRACARINA 4INSECTA .......MEGALOPTERA...............SIALIDAE 4 12.......TRICHOPTERA..............POLYCENTROPODIAE.....................Polycentropus 4 3.......DIPTERA..............CERATOPOGONIDAE..............EMPIDIDAE 12..............CHIRONOMIDAE 112 53 60 32GASTROPODA .......PULMONATA..............LYMNAEIDAE 4.......CTENOBRANCHIA..............VIVIPARIDAEPELECYPODA
Number of Specimens
20 4 5
12
24 152 64 52
52 44 16
4 40
80 92 9 32 28
12
56
80 4
24 70
46


APPENDIXES
39

40
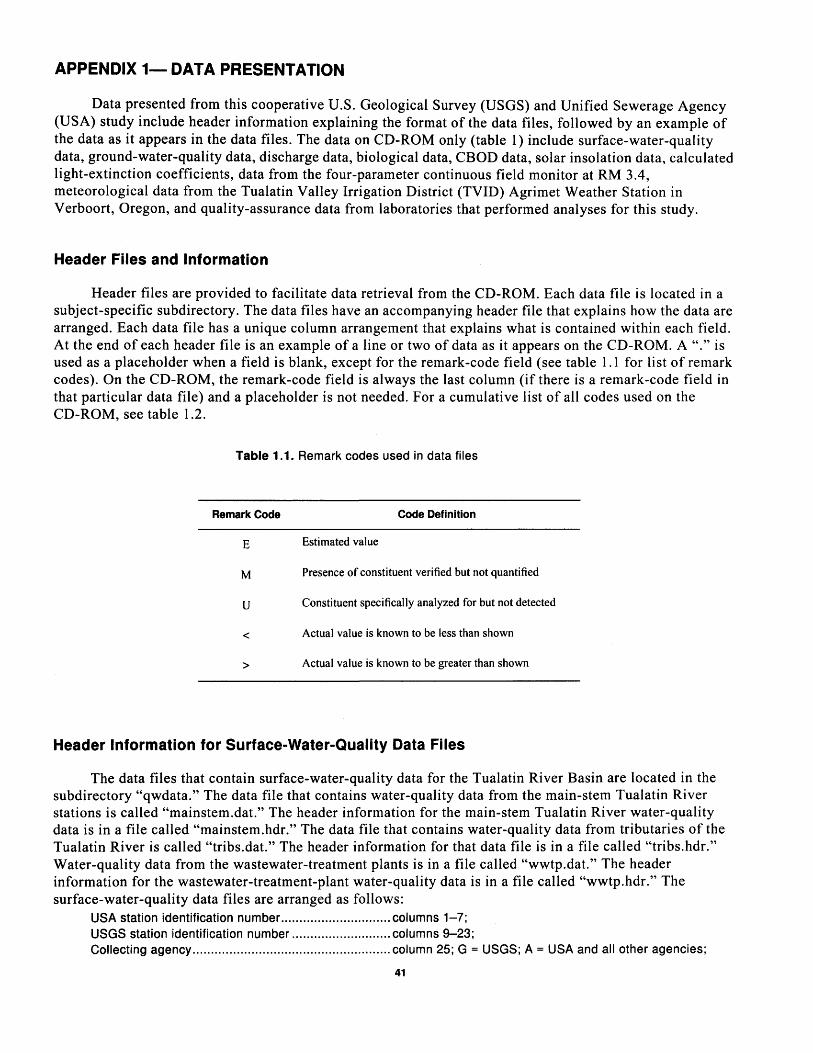
APPENDIX 1 DATA PRESENTATION
Data presented from this cooperative U.S. Geological Survey (USGS) and Unified Sewerage Agency (USA) study include header information explaining the format of the data files, followed by an example of the data as it appears in the data files. The data on CD-ROM only (table 1) include surface-water-quality data, ground-water-quality data, discharge data, biological data, CBOD data, solar insolation data, calculated light-extinction coefficients, data from the four-parameter continuous field monitor at RM 3.4, meteorological data from the Tualatin Valley Irrigation District (TVID) Agrimet Weather Station in Verboort, Oregon, and quality-assurance data from laboratories that performed analyses for this study.
Header Files and Information
Header files are provided to facilitate data retrieval from the CD-ROM. Each data file is located in a subject-specific subdirectory. The data files have an accompanying header file that explains how the data are arranged. Each data file has a unique column arrangement that explains what is contained within each field. At the end of each header file is an example of a line or two of data as it appears on the CD-ROM. A "." is used as a placeholder when a field is blank, except for the remark-code field (see table 1.1 for list of remark codes). On the CD-ROM, the remark-code field is always the last column (if there is a remark-code field in that particular data file) and a placeholder is not needed. For a cumulative list of all codes used on the CD-ROM, see table 1.2.
Table 1.1. Remark codes used in data files
Remark Code Code Definition
g Estimated value
M Presence of constituent verified but not quantified
U Constituent specifically analyzed for but not detected
< Actual value is known to be less than shown
> Actual value is known to be greater than shown
Header Information for Surface-Water-Quality Data Files
The data files that contain surface-water-quality data for the Tualatin River Basin are located in the subdirectory "qwdata." The data file that contains water-quality data from the main-stem Tualatin River stations is called "mainstem.dat." The header information for the main-stem Tualatin River water-quality data is in a file called "mainstem.hdr." The data file that contains water-quality data from tributaries of the Tualatin River is called "tribs.dat." The header information for that data file is in a file called "tribs.hdr." Water-quality data from the wastewater-treatment plants is in a file called "wwtp.dat." The header information for the wastewater-treatment-piant water-quality data is in a file called "wwtp.hdr." The surface-water-quality data files are arranged as follows:
USA station identification number..............................columns 1-7;USGS station identification number...........................columns 9-23;Collecting agency......................................................column 25; G = USGS; A = USA and all other agencies;
41
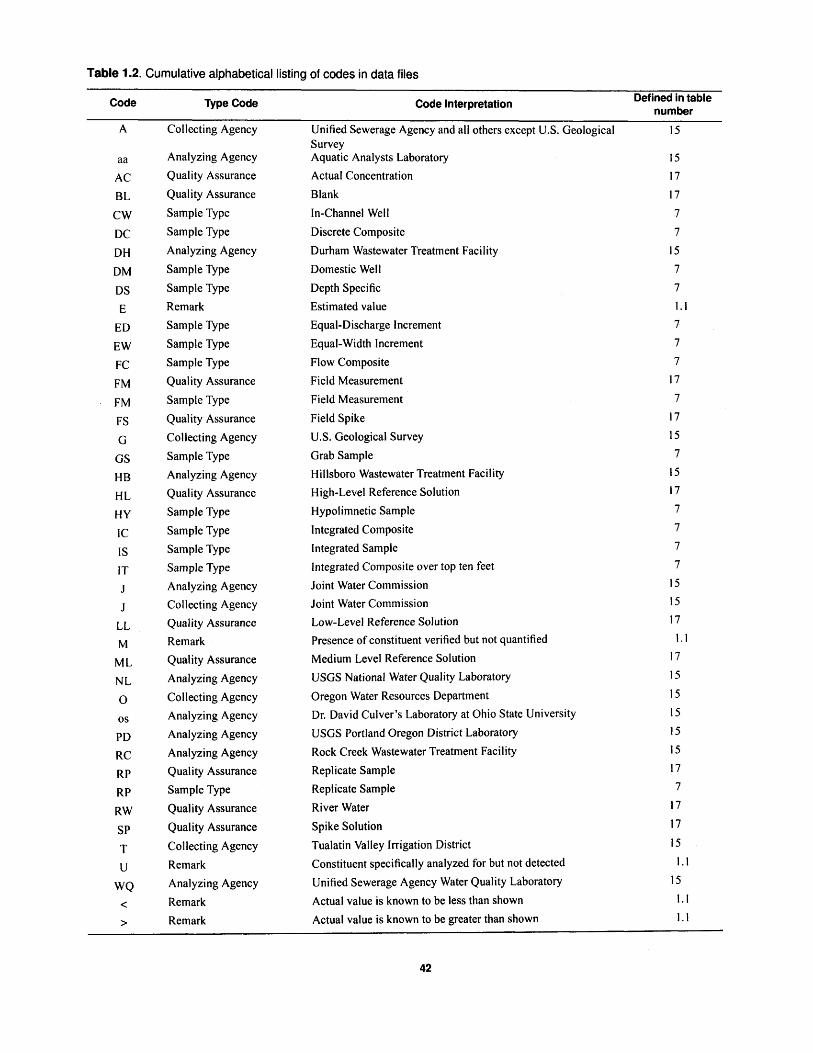
Table 1.2. Cumulative alphabetical listing of codes in data files
Code
A
aa
AC
BL
CW
DC
DH
DM
DS
E
ED
EW
FC
FM
FM
FS
G
GS
HB
HL
HY
IC
IS
IT
J
J
LL
M
ML
NL
O
OS
PD
RC
RP
RP
RW
SP
T
U
WQ<
>
Type Code
Collecting Agency
Analyzing Agency
Quality Assurance
Quality Assurance
Sample Type
Sample Type
Analyzing Agency
Sample Type
Sample Type
Remark
Sample Type
Sample Type
Sample Type
Quality Assurance
Sample Type
Quality Assurance
Collecting Agency
Sample Type
Analyzing Agency
Quality Assurance
Sample Type
Sample Type
Sample Type
Sample Type
Analyzing Agency
Collecting Agency
Quality Assurance
Remark
Quality Assurance
Analyzing Agency
Collecting Agency
Analyzing Agency
Analyzing Agency
Analyzing Agency
Quality Assurance
Sample Type
Quality Assurance
Quality AssuranceCollecting Agency
Remark
Analyzing Agency
Remark
Remark
Code Interpretation
Unified Sewerage Agency and all others except U.S. GeologicalSurveyAquatic Analysts Laboratory
Actual Concentration
Blank
In-Channel Well
Discrete Composite
Durham Wastewater Treatment Facility
Domestic Well
Depth Specific
Estimated value
Equal-Discharge Increment
Equal- Width Increment
Flow Composite
Field Measurement
Field Measurement
Field Spike
U.S. Geological Survey
Grab Sample
Hillsboro Wastewater Treatment Facility
High-Level Reference Solution
Hypolimnetic Sample
Integrated Composite
Integrated Sample
Integrated Composite over top ten feet
Joint Water Commission
Joint Water Commission
Low-Level Reference Solution
Presence of constituent verified but not quantified
Medium Level Reference Solution
USGS National Water Quality Laboratory
Oregon Water Resources Department
Dr. David Culver's Laboratory at Ohio State University
USGS Portland Oregon District Laboratory
Rock Creek Wastewater Treatment Facility
Replicate Sample
Replicate Sample
River Water
Spike Solution
Tualatin Valley Irrigation District
Constituent specifically analyzed for but not detected
Unified Sewerage Agency Water Quality Laboratory
Actual value is known to be less than shown
Actual value is known to be greater than shown
Defined in table number
15
15
17
17
7
7
15
7
7
1.1
7
7
7
17
7
17
15
7
15
17
7
7
7
7
15
15
17
1.1
17
15
15
15
15
15
17
7
17
17
15
1.1
15
1.1
1.1
42

Analyzing agency......................................................columns 28-29; NL= USGS National Water Quality Laboratory;WQ= USA Water Quality Laboratory; FM = field measurement; DH = USA DurhamWastewater Treatment Facility; PD = USGS Portland District Laboratory; RC = USA Rock CreekWastewater Treatment Facility; HB = USA Hillsboro Wastewater Treatment Facility;FG = USA Forest Grove Wastewater Treatment Facility, (see table 15 for additional analyzing agency information);Sample Type.............................................................columns 31-32; GS = grab sample; IS = integrated sample;DS = depth specific; 1C = integrated composite; FC = flow composite; DC = 24 hr composite discrete; IT = integrated composite from top 10 feet of water column; EW = equal-width increments; ED = equal-discharge increments (see table 7 for additional sample-collection-method information); Date..........................................................................columns 34-43; mm/dd/yyyy;Time .........................................................................columns 45-49; hh:mm;WATSTORE code .....................................................columns 51-55 (see table 8);Value........................................................................columns 57-64;Depth (feet................................................................ columns 66-69;Remark codes...........................................................column 71 (see table 1.1 for interpretation of remark codes).Below is an example of a line of data as it appears in the data files: 3701715 14202300 A FM IS 05/23/1991 10:05 61 68.200 3.0 E
Header Information for Ground-Water-Quality Data File
The data file that contains ground-water-quality data for the Tualatin River Basin is located in the subdirectory "qwdata." The data file that contains ground-water data is called "grdwtr.dat." The header information is in a file called "grdwtr.hdr." The data file "grdwtr.dat" is arranged as follows:
Station identification number.....................................columns 1 15;Analyzing agency......................................................columns 17-18; NL = USGS National Water QualityLaboratory; FM = field measurement (see table 15 for additional analyzing agency information);Well type...................................................................columns 20-21; CW = in-channel well;DM = domestic well (see table 7 for additional sample-collection method information);Date..........................................................................columns 23-32; mm/dd/yyyy;Time .........................................................................columns 34-38; hh:mm;WATSTORE code .....................................................columns 40-44 (see table 10);Value........................................................................ columns 46-53;Remark codes...........................................................column 55 (see table 1.1 for interpretation of remark codes).Below is an example of a line of data as it appears in the data file:453129122561401 NL DM 10/12/1990 12:05 1106 10.000 <
Header Information for Streamflow Data File
The data file that contains discharge data for the Tualatin River Basin is located the subdirectory "flow." The file that contains streamflow discharge data is called "flow.dat." The header information is in a file called "flow.hdr." The data file "flow.dat" is arranged as follows:
USA station identification ..........................................columns 1-7;USGS station identification........................................columns 9-16;Collecting agency......................................................column 18; G = USGS; O = Oregon WaterResources Department; T = Tualatin Valley Irrigation District;Analyzing agency......................................................columns 21-22; PD = USGS Portland District Laboratory;O = Oregon Water Resources Department; J = Joint Water Commission (see table 15);Date..........................................................................columns 24 33; mm/dd/yyyy;Value (daily mean value measured incubic feet per second)...............................................columns 35-38;Remark codes...........................................................column 40 (see table 1.1 for interpretation of remark codes).Below is a line of data as it appears in the data file:3805048 14202980 G PD 01/22/1991 290
43

Header Information for Wastewater-Treatment-Plant Discharge Data File
The data file that contains discharge data for the wastewater-treatment plants is located in the subdirectory "flow." Discharge data from the USA wastewater-treatment plants are in a file called "wwtpflow.dat." The header information is in a file called "wwtpflow.hdr." The data file "wwtpflow.dat" is arranged as follows:
USA station identification number..............................columns 1-7;USGS station identification number...........................columns 9-23;Date..........................................................................columns 25-34; mm/dd/yyyy;Value (mean daily value measuredin cubic feet per second) ...........................................columns 36-39Below is a line of data as it appears in the data files:2370014 453040123052000 05/03/1992 6.0
Header Information for Oswego Canal Gage-Height Data File
The data file that contains gage-height data for the Tualatin River at the Oswego Canal is located in the subdirectory "flow." The file that contains these gage-height data (station number "14206990") is called "14206990.dat." The header information is in a file called "14206990.hdr." The data file "14206990.dat" is arranged as follows:
USA station identification ..........................................columns 1-7;USGS station identification........................................columns 9-16;Collecting agency......................................................column 18; G = USGS; O = Oregon Water ResourcesDepartment; T = Tualatin Valley Irrigation District;Analyzing agency......................................................columns 21-22; PD = USGS Portland District Laboratory;O = Oregon Water Resources Department; J = Joint Water Commission (see table 15);Date.......................................................................... columns 24-33; mm/dd/yyyy;Value (gage height in feet) ........................................columns 35-38 (to convert gage height toelevation above mean sea level add 100.20 feet in 1991 and 1992, for 1993 add 100.22 feet);Remark codes...........................................................column 40 (see table 1.1 for interpretation of remark codes).Below is a line of data as it appears in the data file:3701068 14206990 O PD 01/01/1991 1.90
Header Information for Phytoplankton Data File
The data file that contains phytoplankton data for samples collected in the Tualatin River Basin is located in the subdirectory "biodata." The data file that contains phytoplankton data is called "algal.dat." The header information is in a file called "algal.hdr." The file "algal.dat" is arranged as follows:
USA station identification number..............................columns 1-7;USGS station identification number...........................columns 9-23;Date..........................................................................columns 25-34; MM/DD/YYYY;Species code (unique to Aquatic AnalystsLaboratory) ...............................................................columns 36-39;Genus....................................................................... columns 41-54;Species.....................................................................columns 56-67;Abundance (numbers/milliliter) ..................................columns 69-76;Below are two examples of data as they appear in the data file:370105414207050 05/09/1991 NZXX Nitzschia sp. 16.1073701116 14206785 05/09/1991 ACLC Achnanthes lanceolata 8.054
Header Information for Zooplankton Data File
The data file that contains zooplankton data for samples collected in the Tualatin River Basin is located in the subdirectory "biodata." The file that contains zooplankton data is called "zooplank.dat." The header information is in a file called "zooplank.hdr." The file "zooplank.dat" is arranged as follows:
44

USA station identification number..............................columns 1-7;USGS station identification number........................... columns 9-23;Date..........................................................................columns 25-34; MM/DD/YYYY;Species code ............................................................columns 36-40;Genus.......................................................................columns 42-55;Species..................................................................... columns 57-65;Abundance (number/cubic meter).............................. columns 67-74;Below are two examples of data as they appear in the data file: 3805048 14202980 06/27/1991 603.0 Craspedacusta sowerbyi 61.4 3805048 14202980 06/27/1991 611.0 Oligochaeta species 20.5
Header Information for Carbonaceous Biochemical Oxygen Demand (CBOD) Data File
The data files that contain CBOD data for the Tualatin River Basin are located in the subdirectory "qwdata." The file that contains the CBOD data is called "cbod.dat." The header information is in a file called "cbod.hdr." The data file "cbod.dat" is arranged as follows:
USA station identification number..............................columns 1-7;USGS station identification number...........................columns 9-23;Collecting agency......................................................columns 25; G = USGS; A = USA and all other agencies;Analyzing agency......................................................columns 28-29; PD = USGS Portland District Laboratory;Sample type..............................................................columns 31-32; 1C = integrated composite; IS = integratedSample; EW = equal width;Date sample was collected........................................columns 34-43; mm/dd/yyyy;Time sample was collected .......................................columns 45-49; hh:mm;Elapsed days ............................................................columns 51-54;Value (milligrams per liter) ........................................columns 56-61.
Below are two lines of data as they appear in the data file:3701391 14206440 G PD EW 12/04/1991 11:000.00 0.0003701391 14206440 G PD EW 12/04/1991 11:002.00 0.350
Header Information for USA Wastewater-Treatment-Plant Carbonaceous Biochemical Oxygen Demand (CBOD) Data File
The data file that contains CBOD data for the USA wastewater-treatment plants is located in the subdirectory "qwdata." The file that contains the CBOD data from the USA wastewater-treatment-plant samples is called "cbodwwtp.dat." These samples were analyzed at the USGS Portland District Laboratory. The header information is in a file called "cbodwwtp.hdr." The data file "cbodwwtp.dat" is arranged as follows:
USA station identification number..............................columns 1 7;USGS station identification number........................... columns 9-23;Collecting agency......................................................columns 25; G = USGS; A = USA and all other agencies;Analyzing agency......................................................columns 28-29; PD = USGS Portland District Laboratory;Sample type..............................................................columns 31-32; DC = discrete composite;Date analysis began (samples were a 24-hourcomposite from the previous day).............................. columns 34-43; mm/dd/yyyy;Elapsed days ............................................................columns 45-48;Value (milligrams per liter) .........................................columns 50-55.
Below are two lines of data as they appear in the data file:2370014453040123052000 A PD DC 01/08/1992 0.00 0.0002370014453040123052000 A PD DC 01/08/1992 1.00 1.637
45

Header Information for Continuous Quantum Sensor Data File
The data file that contains continuous quantum sensor data collected during this study is located in the subdirectory "cont_dat." The data file that contains the continuous quantum sensor data is called "light.dat." The header information is in a file called "light.hdr." The data file "light.dat" is arranged as follows:
Date..........................................................................columns 1-10; mm/dd/yyyy;Time .........................................................................columns 12-16; hhimm (these data include time changesfrom Pacific Daylight Time to Pacific Standard Time, which occurred from 1:00 a.m. to 2:00 a.m. on 10/25/1992and 1:00 a.m. to 2:00 a.m. on 10/31/1993, data from 1991 are all Pacific Daylight Time); Value (an average of 60instantaneous measurements taken at 1-minute intervals over the previous hour, measured in microeinsteins persquaremeter per second (nE/[m s]) .....................................columns 18-21;Remark codes...........................................................column 23 (see table 1.1 for interpretation of remark codes).Below is a line of data as it appears in the data file:05/20/1991 17:00 613
Header Information for Light-Extinction-Coefficient Data File
The data file that contains light-extinction coefficients calculated for sites in the lower Tualatin River is located in the subdirectory "biodata." The file that contains calculated light-extinction coefficients is called "lightext.dat." The header information is in a file called "lightexthdr." The file "lightext.dat" is arranged as follows:
USA station identification number..............................columns 1-7;USGS station identification number........................... columns 9-23;Date..........................................................................columns 25-34; MM/DD/YYYY;Extinction coefficients ...............................................columns 36-39 (1/meter);Below is an example of two lines line of data as they appear in the data file:3701271 14206690 07/05/1991 1.683701054 14207050 07/08/1991 2.13
Header Information for Four-Parameter Continuous Field Monitor Data File
The file that contains field measurements from the four-parameter continuous field monitor is located in the subdirectory "cont_dat." The data file that contains field measurements from the four-parameter continuous field monitor is called "qwmonitr.dat." The header information is in a file called "qwmonitr.hdr." The file "qwmonitr.dat" is arranged as follows:
Date..........................................................................columns 1-10; mm/dd/yyyy;Time .........................................................................columns 12-16: hh:mm;Water temperature (degrees Celsius)........................columns 18-21;Specific conductance (microsiemens percentimeter at 25 degrees Celsius) .............................columns 23-27;Dissolved oxygen (milligrams per liter) ......................columns 29-32;pH.............................................................................columns 34-37;Below is an example of a line of data as it appears in the data file:05/08/1991 10:00 13.4 164.8 7.9 7.2
Header Information for Meteorological Data File
The file that contains meteorological data for this study period (1991-93) is located in the subdirectory "cont_dat." The file that contains TVID meteorological data for this study is called "meteoro.dat." The header information is in a file called "meteoro.hdr." The data file "meteoro.dat" is arranged as follows:
Date..........................................................................columns 1-10; mm/dd/yyyy;Maximum temperature (degrees Fahrenheit) .............columns 12-14;Minimum temperature (degrees Fahrenheit) ..............columns 16-18;Dewpoint (degrees Fahrenheit) .................................columns 20-22;
46
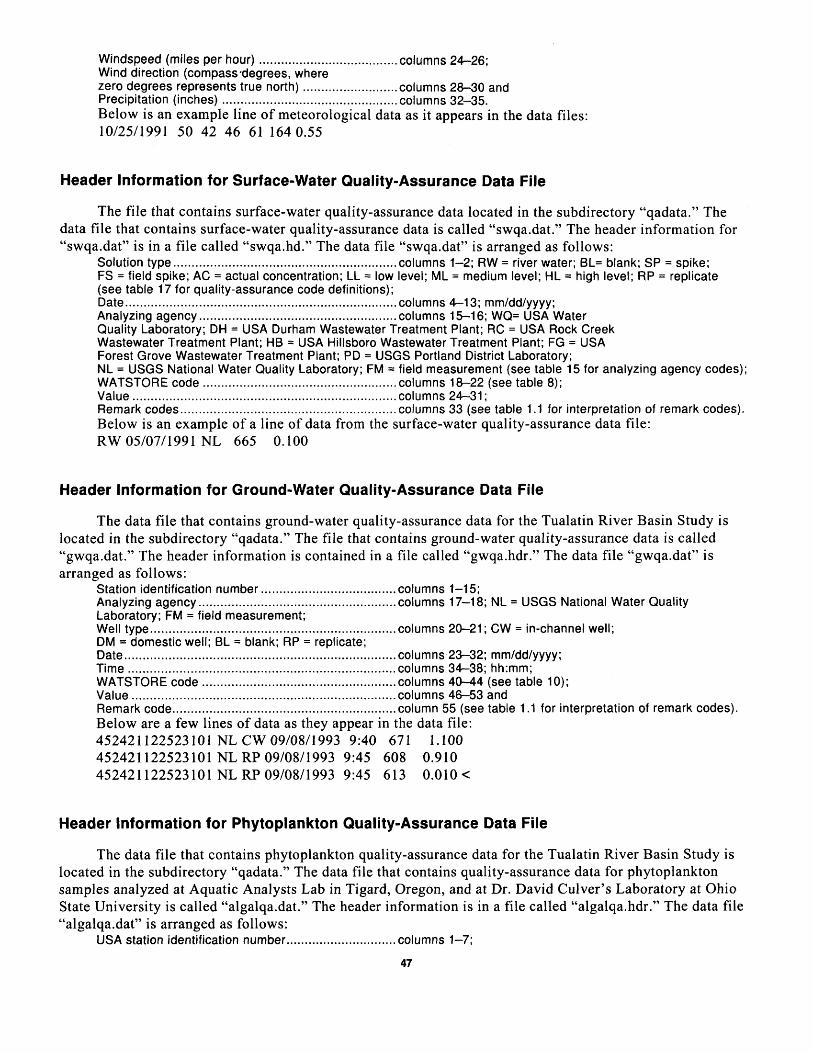
Windspeed (miles per hour) ......................................columns 24-26;Wind direction (compass-degrees, wherezero degrees represents true north) ..........................columns 28-30 andPrecipitation (inches) ................................................columns 32-35.Below is an example line of meteorological data as it appears in the data files: 10/25/1991 50 42 46 61 1640.55
Header Information for Surface-Water Quality-Assurance Data File
The file that contains surface-water quality-assurance data located in the subdirectory "qadata." The data file that contains surface-water quality-assurance data is called "swqa.dat." The header information for "swqa.dat" is in a file called "swqa.hd." The data file "swqa.dat" is arranged as follows:
Solution type.............................................................columns 1-2; RW = river water; BL= blank; SP = spike;FS = field spike; AC = actual concentration; LL = low level; ML = medium level; HL = high level; RP = replicate(see table 17 for quality-assurance code definitions);Date..........................................................................columns 4 13; mm/dd/yyyy;Analyzing agency......................................................columns 15-16; WQ= USA WaterQuality Laboratory; DH = USA Durham Wastewater Treatment Plant; RC = USA Rock CreekWastewater Treatment Plant; HB = USA Hillsboro Wastewater Treatment Plant; FG = USAForest Grove Wastewater Treatment Plant; PD = USGS Portland District Laboratory;NL = USGS National Water Quality Laboratory; FM = field measurement (see table 15 for analyzing agency codes);WATSTORE code .....................................................columns 18-22 (see table 8);Value........................................................................ columns 24 31;Remark codes........................................................... columns 33 (see table 1.1 for interpretation of remark codes).Below is an example of a line of data from the surface-water quality-assurance data file:RW 05/07/1991 NL 665 0.100
Header Information for Ground-Water Quality-Assurance Data File
The data file that contains ground-water quality-assurance data for the Tualatin River Basin Study is located in the subdirectory "qadata." The file that contains ground-water quality-assurance data is called "gwqa.dat." The header information is contained in a file called "gwqa.hdr." The data file "gwqa.dat" is arranged as follows:
Station identification number.....................................columns 1-15;Analyzing agency......................................................columns 17-18; NL = USGS National Water QualityLaboratory; FM = field measurement;Well type...................................................................columns 20-21; CW = in-channel well;DM = domestic well; BL = blank; RP = replicate;Date.......................................................................... columns 23-32; mm/dd/yyyy;Time .........................................................................columns 34 38; hh:mm;WATSTORE code .....................................................columns 40-44 (see table 10);Value ........................................................................columns 46-53 andRemark code.............................................................column 55 (see table 1.1 for interpretation of remark codes).Below are a few lines of data as they appear in the data file:452421122523101 NLCW 09/08/1993 9:40 671 1.100452421122523101 NLRP 09/08/1993 9:45 608 0.910452421122523101 NLRP 09/08/1993 9:45 613 0.010<
Header Information for Phytoplankton Quality-Assurance Data File
The data file that contains phytoplankton quality-assurance data for the Tualatin River Basin Study is located in the subdirectory "qadata." The data file that contains quality-assurance data for phytoplankton samples analyzed at Aquatic Analysts Lab in Tigard, Oregon, and at Dr. David Culver's Laboratory at Ohio State University is called "algalqa.dat." The header information is in a file called "algalqa.hdr." The data file "algalqa.dat" is arranged as follows:
USA station identification number..............................columns 1 7;
47
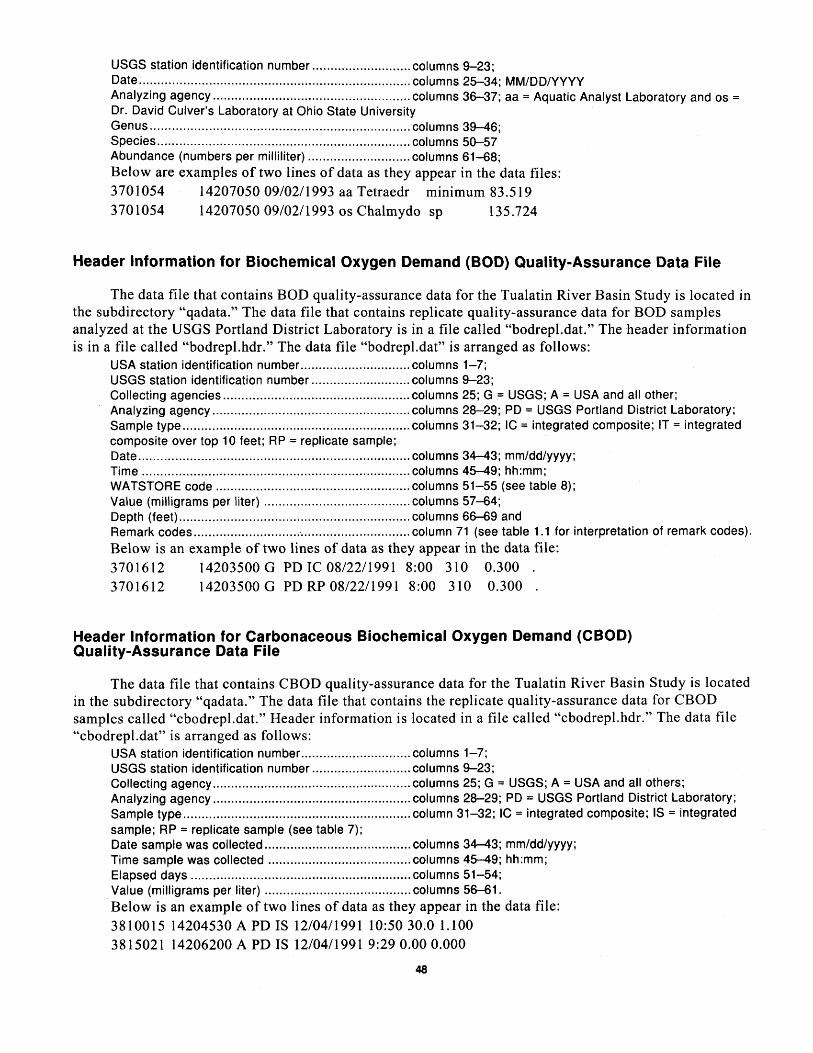
USGS station identification number........................... columns 9-23;Date..........................................................................columns 25-34; MM/DD/YYYYAnalyzing agency......................................................columns 36-37; aa = Aquatic Analyst Laboratory and os =Dr. David Culver's Laboratory at Ohio State UniversityGenus.......................................................................columns 39-46;Species..................................................................... columns 50-57Abundance (numbers per milliliter) ............................columns 61-68;Below are examples of two lines of data as they appear in the data files: 3701054 14207050 09/02/1993 aa Tetraedr minimum 83.519 3701054 14207050 09/02/1993 os Chalmydo sp 135.724
Header Information for Biochemical Oxygen Demand (BOD) Quality-Assurance Data File
The data file that contains BOD quality-assurance data for the Tualatin River Basin Study is located in the subdirectory "qadata." The data file that contains replicate quality-assurance data for BOD samples analyzed at the USGS Portland District Laboratory is in a file called "bodrepl.dat." The header information is in a file called "bodrepl.hdr." The data file "bodrepl.dat" is arranged as follows:
USA station identification number..............................columns 1-7;USGS station identification number...........................columns 9-23;Collecting agencies...................................................columns 25; G = USGS; A = USA and all other;Analyzing agency......................................................columns 28-29; PD = USGS Portland District Laboratory;Sample type..............................................................columns 31-32; 1C = integrated composite; IT = integratedcomposite over top 10 feet; RP = replicate sample;Date..........................................................................columns 34-43; mm/dd/yyyy;Time .........................................................................columns 45-49; hh:mm;WATSTORE code .....................................................columns 51-55 (see table 8);Value (milligrams per liter) ........................................columns 57-64;Depth (feet)...............................................................columns 66-69 andRemark codes...........................................................column 71 (see table 1.1 for interpretation of remark codes).Below is an example of two lines of data as they appear in the data file:3701612 14203500 G PD 1C 08/22/1991 8:00 310 0.300 .3701612 14203500 G PD RP 08/22/1991 8:00 310 0.300 .
Header Information for Carbonaceous Biochemical Oxygen Demand (CBOD) Quality-Assurance Data File
The data file that contains CBOD quality-assurance data for the Tualatin River Basin Study is located in the subdirectory "qadata." The data file that contains the replicate quality-assurance data for CBOD samples called "cbodrepl.dat." Header information is located in a file called "cbodrepl.hdr." The data file "cbodrepl.dat" is arranged as follows:
USA station identification number..............................columns 1-7;USGS station identification number........................... columns 9-23;Collecting agency......................................................columns 25; G = USGS; A = USA and all others;Analyzing agency......................................................columns 28-29; PD = USGS Portland District Laboratory;Sample type..............................................................column 31-32; 1C = integrated composite; IS = integratedsample; RP = replicate sample (see table 7);Date sample was collected........................................columns 34-43; mm/dd/yyyy;Time sample was collected .......................................columns 45-49; hh:mm;Elapsed days ............................................................columns 51-54;Value (milligrams per liter) ........................................columns 56-61.Below is an example of two lines of data as they appear in the data file:3810015 14204530 A PD IS 12/04/1991 10:50 30.0 1.1003815021 14206200 A PD IS 12/04/1991 9:29 0.00 0.000
48
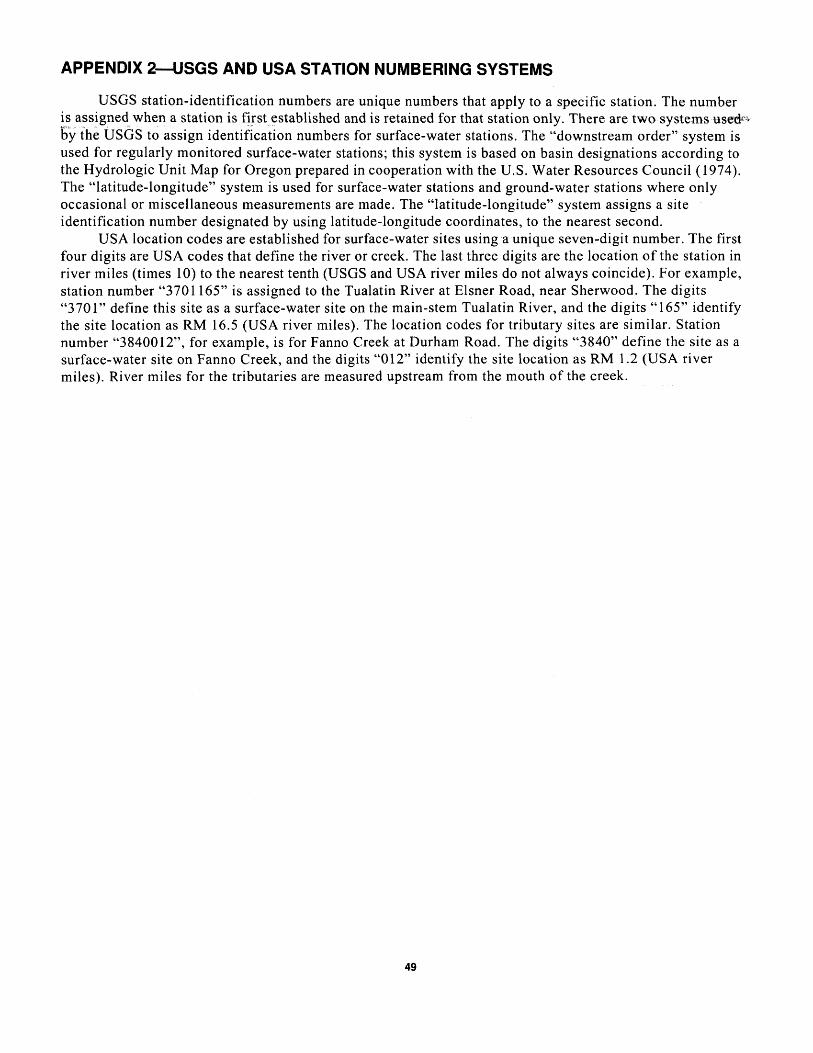
APPENDIX 2 USGS AND USA STATION NUMBERING SYSTEMS
USGS station-identification numbers are unique numbers that apply to a specific station. The number is assigned when a station is first established and is retained for that station only. There are two systems uset by the USGS to assign identification numbers for surface-water stations. The "downstream order" system is used for regularly monitored surface-water stations; this system is based on basin designations according to the Hydrologic Unit Map for Oregon prepared in cooperation with the U.S. Water Resources Council (1974). The "latitude-longitude" system is used for surface-water stations and ground-water stations where only occasional or miscellaneous measurements are made. The "latitude-longitude" system assigns a site identification number designated by using latitude-longitude coordinates, to the nearest second.
USA location codes are established for surface-water sites using a unique seven-digit number. The first four digits are USA codes that define the river or creek. The last three digits are the location of the station in river miles (times 10) to the nearest tenth (USGS and USA river miles do not always coincide). For example, station number "3701165" is assigned to the Tualatin River at Elsner Road, near Sherwood. The digits "3701" define this site as a surface-water site on the main-stem Tualatin River, and the digits "165" identify the site location as RM 16.5 (USA river miles). The location codes for tributary sites are similar. Station number "3840012", for example, is for Fanno Creek at Durham Road. The digits "3840" define the site as a surface-water site on Fanno Creek, and the digits "012" identify the site location as RM 1.2 (USA river miles). River miles for the tributaries are measured upstream from the mouth of the creek.
49