u.s. department of justice 2i¿fhri-xvwlfh3urjudpv revised ... · state corrections expenditures,...
TRANSCRIPT
U.S. Department of JusticeOffice of Justice ProgramsBureau of Justice Statistics
BJS
Bu
lletin
December 2012, NCJ 239672
State Corrections Expenditures, FY 1982-2010Tracey Kyckelhahn, BJS Statistician
Between 1982 and 2001, total state corrections expenditures increased each year, rising from $15.0 billion to $53.5 billion in real dollars.
Between 2002 and 2010, expenditures fluctuated between $53.4 billion and $48.4 billion. Preliminary data from the Census Bureau’s Annual Survey of State Government Finances indicated that states spent $48.5 billion on corrections in 2010, a decline of 5.6% since 2009.
Corrections expenditures fund community supervision, confinement, and rehabilitation of adults and juveniles convicted of offenses, as well as confinement of persons awaiting trial or adjudication. State corrections expenditures also include the costs of operation and employment for prisons, probation and parole offices, pardon proceedings, correctional administration, and intergovernmental transfers.
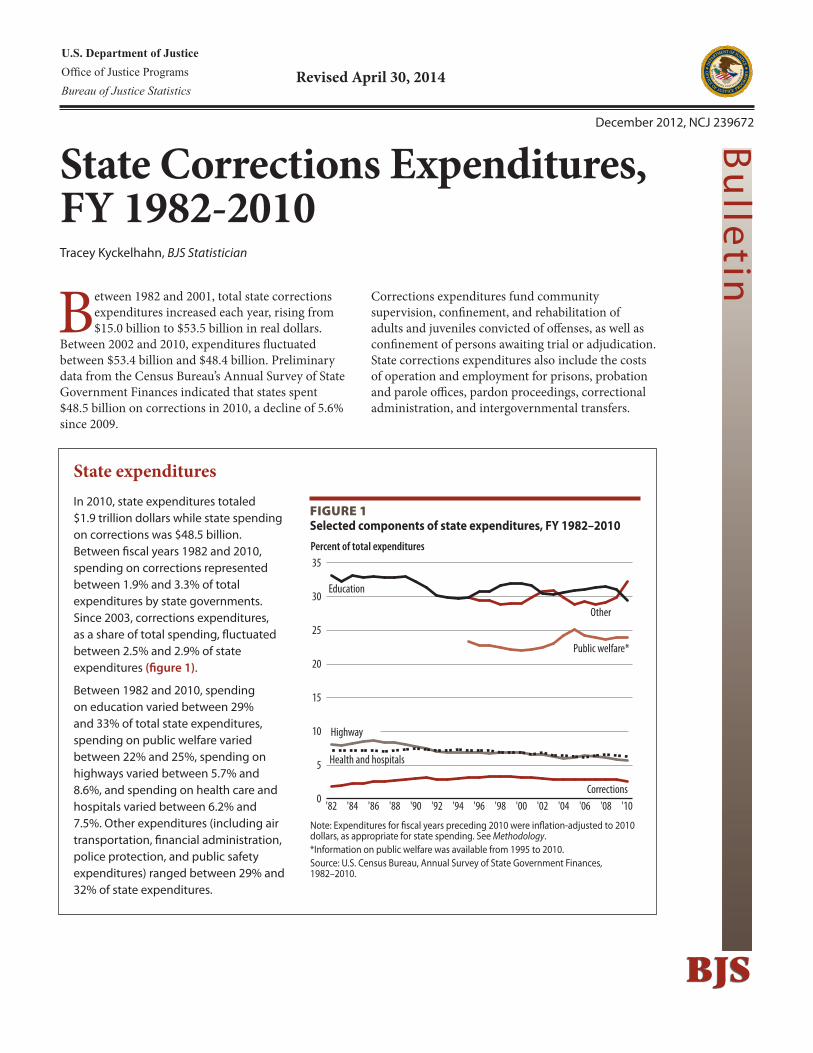
State expendituresIn 2010, state expenditures totaled $1.9 trillion dollars while state spending on corrections was $48.5 billion. Between fiscal years 1982 and 2010, spending on corrections represented between 1.9% and 3.3% of total expenditures by state governments. Since 2003, corrections expenditures, as a share of total spending, fluctuated between 2.5% and 2.9% of state expenditures (figure 1).
Between 1982 and 2010, spending on education varied between 29% and 33% of total state expenditures, spending on public welfare varied between 22% and 25%, spending on highways varied between 5.7% and 8.6%, and spending on health care and hospitals varied between 6.2% and 7.5%. Other expenditures (including air transportation, financial administration, police protection, and public safety expenditures) ranged between 29% and 32% of state expenditures.
0
5
10
15
20
25
30
35
Other
Corrections
Public welfare*
Highway
Education
Health and hospitals
'10'08'06'04'02'00'98'96'94'92'90'88'86'84'82
Percent of total expenditures
Note: Expenditures for fiscal years preceding 2010 were inflation-adjusted to 2010 dollars, as appropriate for state spending. See Methodology.*Information on public welfare was available from 1995 to 2010. Source: U.S. Census Bureau, Annual Survey of State Government Finances, 1982–2010.
Figure 1Selected components of state expenditures, FY 1982–2010
Revised April 30, 2014
S TAT E CO R R E C T I O N S E X P E N D I T U R E S , 1982 - 2010 | D E C E M B E R 2012 2
States spent about three-quarters of the corrections budget on correctional institutions
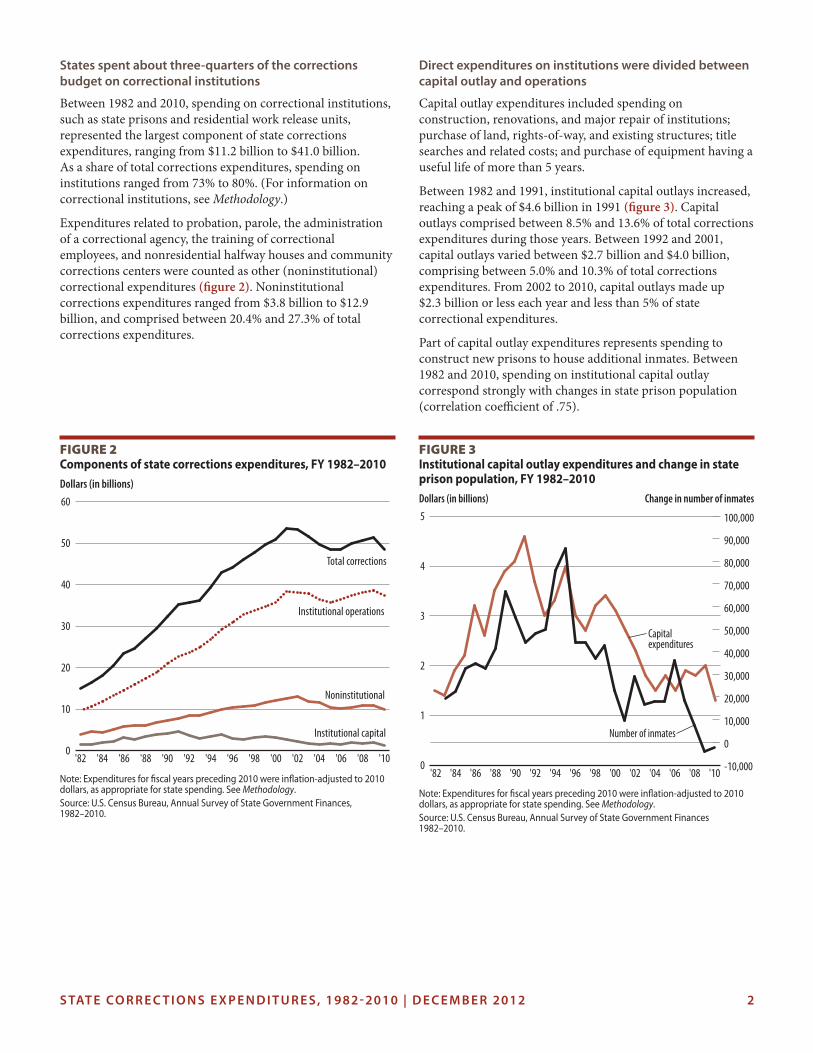
Between 1982 and 2010, spending on correctional institutions, such as state prisons and residential work release units, represented the largest component of state corrections expenditures, ranging from $11.2 billion to $41.0 billion. As a share of total corrections expenditures, spending on institutions ranged from 73% to 80%. (For information on correctional institutions, see Methodology.)
Expenditures related to probation, parole, the administration of a correctional agency, the training of correctional employees, and nonresidential halfway houses and community corrections centers were counted as other (noninstitutional) correctional expenditures (figure 2). Noninstitutional corrections expenditures ranged from $3.8 billion to $12.9 billion, and comprised between 20.4% and 27.3% of total corrections expenditures.
Direct expenditures on institutions were divided between capital outlay and operations
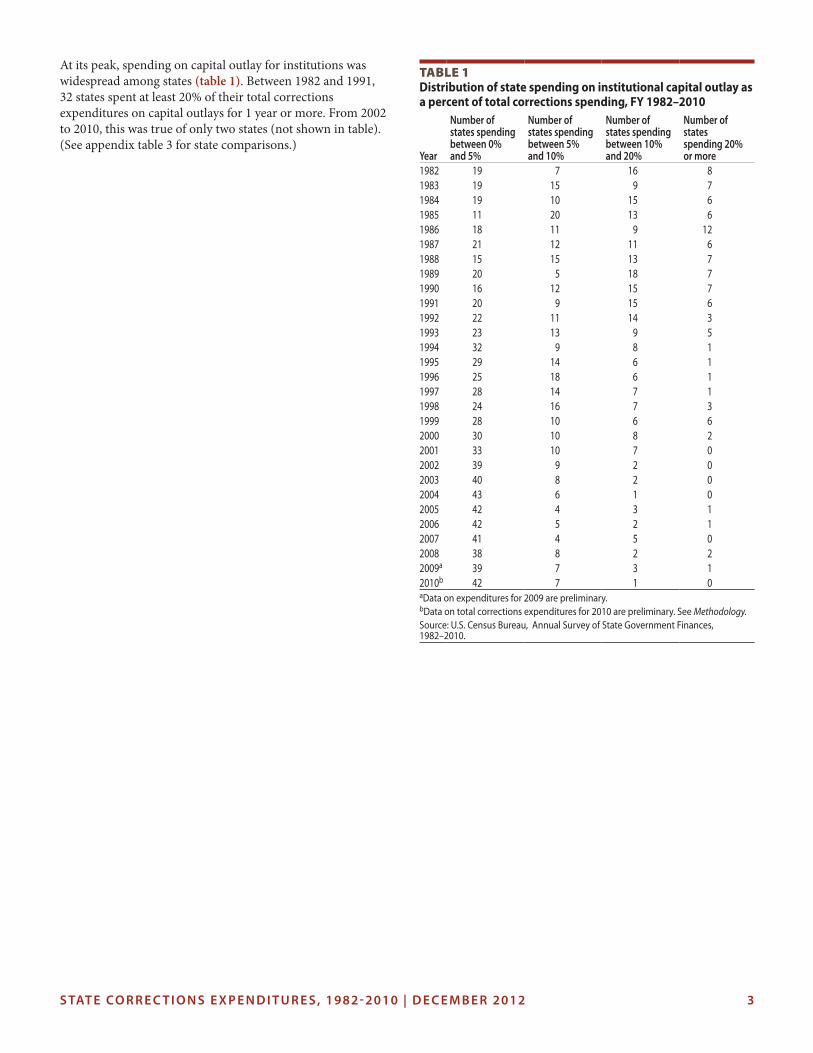
Capital outlay expenditures included spending on construction, renovations, and major repair of institutions; purchase of land, rights-of-way, and existing structures; title searches and related costs; and purchase of equipment having a useful life of more than 5 years.
Between 1982 and 1991, institutional capital outlays increased, reaching a peak of $4.6 billion in 1991 (figure 3). Capital outlays comprised between 8.5% and 13.6% of total corrections expenditures during those years. Between 1992 and 2001, capital outlays varied between $2.7 billion and $4.0 billion, comprising between 5.0% and 10.3% of total corrections expenditures. From 2002 to 2010, capital outlays made up $2.3 billion or less each year and less than 5% of state correctional expenditures.
Part of capital outlay expenditures represents spending to construct new prisons to house additional inmates. Between 1982 and 2010, spending on institutional capital outlay correspond strongly with changes in state prison population (correlation coefficient of .75).
0
10
20
30
40
50
60
Institutional capital
Institutional operations
Total corrections
'10'08'06'04'02'00'98'96'94'92'90'88'86'84'82
Dollars (in billions)
Noninstitutional
Figure 2Components of state corrections expenditures, FY 1982–2010
Note: Expenditures for fiscal years preceding 2010 were inflation-adjusted to 2010 dollars, as appropriate for state spending. See Methodology.Source: U.S. Census Bureau, Annual Survey of State Government Finances, 1982–2010.
0
1
2
3
4
5
Capital expenditures
Dollars (in billions) Change in number of inmates
-10,000
0
10,000
20,000
30,000
40,000
50,000
60,000
70,000
80,000
90,000
100,000
Number of inmates
'10'08'06'04'02'00'98'96'94'92'90'88'86'84'82
Figure 3Institutional capital outlay expenditures and change in state prison population, FY 1982–2010
Note: Expenditures for fiscal years preceding 2010 were inflation-adjusted to 2010 dollars, as appropriate for state spending. See Methodology.Source: U.S. Census Bureau, Annual Survey of State Government Finances 1982–2010.
S TAT E CO R R E C T I O N S E X P E N D I T U R E S , 1982 - 2010 | D E C E M B E R 2012 3
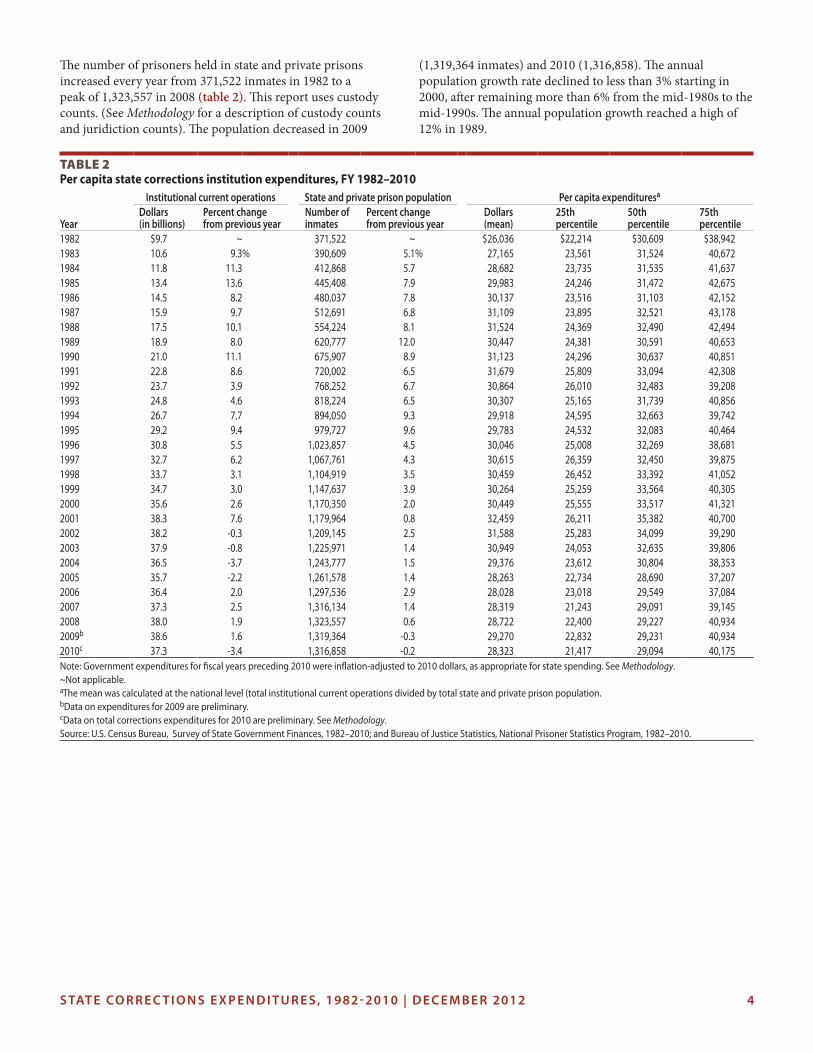
At its peak, spending on capital outlay for institutions was widespread among states (table 1). Between 1982 and 1991, 32 states spent at least 20% of their total corrections expenditures on capital outlays for 1 year or more. From 2002 to 2010, this was true of only two states (not shown in table). (See appendix table 3 for state comparisons.)
Table 1 Distribution of state spending on institutional capital outlay as a percent of total corrections spending, FY 1982–2010
Year
Number of states spending between 0% and 5%
Number of states spending between 5% and 10%
Number of states spending between 10% and 20%
Number of states spending 20% or more
1982 19 7 16 81983 19 15 9 71984 19 10 15 61985 11 20 13 61986 18 11 9 121987 21 12 11 61988 15 15 13 71989 20 5 18 71990 16 12 15 71991 20 9 15 61992 22 11 14 31993 23 13 9 51994 32 9 8 11995 29 14 6 11996 25 18 6 11997 28 14 7 11998 24 16 7 31999 28 10 6 62000 30 10 8 22001 33 10 7 02002 39 9 2 02003 40 8 2 02004 43 6 1 02005 42 4 3 12006 42 5 2 12007 41 4 5 02008 38 8 2 22009a 39 7 3 12010b 42 7 1 0aData on expenditures for 2009 are preliminary.bData on total corrections expenditures for 2010 are preliminary. See Methodology. Source: U.S. Census Bureau, Annual Survey of State Government Finances, 1982–2010.
S TAT E CO R R E C T I O N S E X P E N D I T U R E S , 1982 - 2010 | D E C E M B E R 2012 4
The number of prisoners held in state and private prisons increased every year from 371,522 inmates in 1982 to a peak of 1,323,557 in 2008 (table 2). This report uses custody counts. (See Methodology for a description of custody counts and juridiction counts). The population decreased in 2009
(1,319,364 inmates) and 2010 (1,316,858). The annual population growth rate declined to less than 3% starting in 2000, after remaining more than 6% from the mid-1980s to the mid-1990s. The annual population growth reached a high of 12% in 1989.
Table 2 Per capita state corrections institution expenditures, FY 1982–2010
Institutional current operations State and private prison population Per capita expendituresa
YearDollars (in billions)
Percent change from previous year
Number of inmates
Percent change from previous year
Dollars (mean)
25th percentile
50th percentile
75th percentile
1982 $9.7 ~ 371,522 ~ $26,036 $22,214 $30,609 $38,9421983 10.6 9.3% 390,609 5.1% 27,165 23,561 31,524 40,6721984 11.8 11.3 412,868 5.7 28,682 23,735 31,535 41,6371985 13.4 13.6 445,408 7.9 29,983 24,246 31,472 42,6751986 14.5 8.2 480,037 7.8 30,137 23,516 31,103 42,1521987 15.9 9.7 512,691 6.8 31,109 23,895 32,521 43,1781988 17.5 10.1 554,224 8.1 31,524 24,369 32,490 42,4941989 18.9 8.0 620,777 12.0 30,447 24,381 30,591 40,6531990 21.0 11.1 675,907 8.9 31,123 24,296 30,637 40,8511991 22.8 8.6 720,002 6.5 31,679 25,809 33,094 42,3081992 23.7 3.9 768,252 6.7 30,864 26,010 32,483 39,2081993 24.8 4.6 818,224 6.5 30,307 25,165 31,739 40,8561994 26.7 7.7 894,050 9.3 29,918 24,595 32,663 39,7421995 29.2 9.4 979,727 9.6 29,783 24,532 32,083 40,4641996 30.8 5.5 1,023,857 4.5 30,046 25,008 32,269 38,6811997 32.7 6.2 1,067,761 4.3 30,615 26,359 32,450 39,8751998 33.7 3.1 1,104,919 3.5 30,459 26,452 33,392 41,0521999 34.7 3.0 1,147,637 3.9 30,264 25,259 33,564 40,3052000 35.6 2.6 1,170,350 2.0 30,449 25,555 33,517 41,3212001 38.3 7.6 1,179,964 0.8 32,459 26,211 35,382 40,7002002 38.2 -0.3 1,209,145 2.5 31,588 25,283 34,099 39,2902003 37.9 -0.8 1,225,971 1.4 30,949 24,053 32,635 39,8062004 36.5 -3.7 1,243,777 1.5 29,376 23,612 30,804 38,3532005 35.7 -2.2 1,261,578 1.4 28,263 22,734 28,690 37,2072006 36.4 2.0 1,297,536 2.9 28,028 23,018 29,549 37,0842007 37.3 2.5 1,316,134 1.4 28,319 21,243 29,091 39,1452008 38.0 1.9 1,323,557 0.6 28,722 22,400 29,227 40,9342009b 38.6 1.6 1,319,364 -0.3 29,270 22,832 29,231 40,9342010c 37.3 -3.4 1,316,858 -0.2 28,323 21,417 29,094 40,175Note: Government expenditures for fiscal years preceding 2010 were inflation-adjusted to 2010 dollars, as appropriate for state spending. See Methodology.~Not applicable.aThe mean was calculated at the national level (total institutional current operations divided by total state and private prison population. bData on expenditures for 2009 are preliminary.cData on total corrections expenditures for 2010 are preliminary. See Methodology. Source: U.S. Census Bureau, Survey of State Government Finances, 1982–2010; and Bureau of Justice Statistics, National Prisoner Statistics Program, 1982–2010.
S TAT E CO R R E C T I O N S E X P E N D I T U R E S , 1982 - 2010 | D E C E M B E R 2012 5
Operational expenditures, as a share of total expenditures, grew from 1982 to 2010
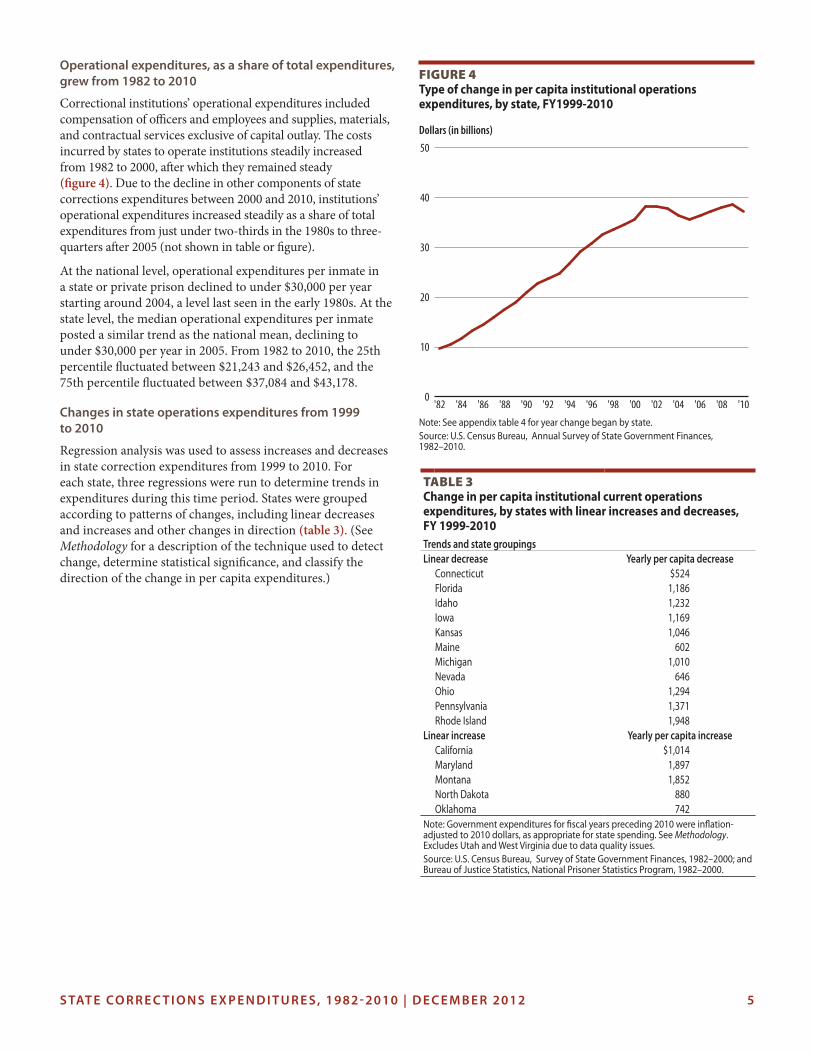
Correctional institutions’ operational expenditures included compensation of officers and employees and supplies, materials, and contractual services exclusive of capital outlay. The costs incurred by states to operate institutions steadily increased from 1982 to 2000, after which they remained steady (figure 4). Due to the decline in other components of state corrections expenditures between 2000 and 2010, institutions’ operational expenditures increased steadily as a share of total expenditures from just under two-thirds in the 1980s to three-quarters after 2005 (not shown in table or figure).
At the national level, operational expenditures per inmate in a state or private prison declined to under $30,000 per year starting around 2004, a level last seen in the early 1980s. At the state level, the median operational expenditures per inmate posted a similar trend as the national mean, declining to under $30,000 per year in 2005. From 1982 to 2010, the 25th percentile fluctuated between $21,243 and $26,452, and the 75th percentile fluctuated between $37,084 and $43,178.
Changes in state operations expenditures from 1999 to 2010
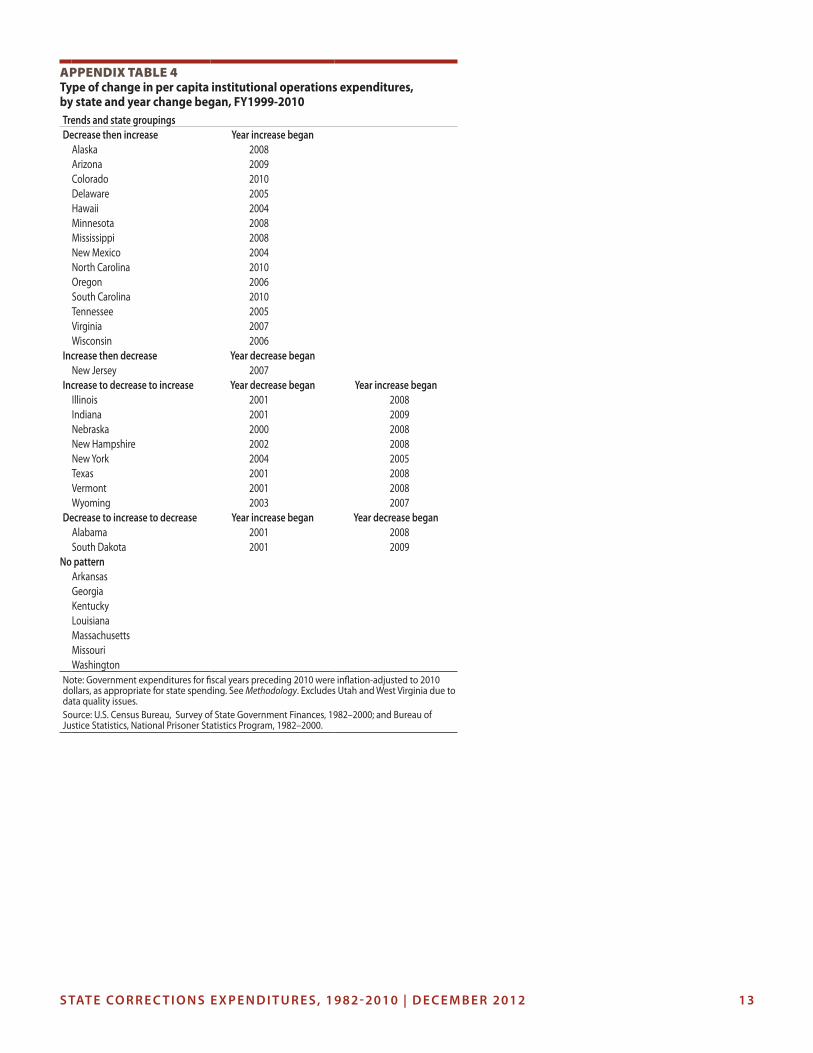
Regression analysis was used to assess increases and decreases in state correction expenditures from 1999 to 2010. For each state, three regressions were run to determine trends in expenditures during this time period. States were grouped according to patterns of changes, including linear decreases and increases and other changes in direction (table 3). (See Methodology for a description of the technique used to detect change, determine statistical significance, and classify the direction of the change in per capita expenditures.)
0
10
20
30
40
50
'10'08'06'04'02'00'98'96'94'92'90'88'86'84'82
Dollars (in billions)
Figure 4Type of change in per capita institutional operations expenditures, by state, FY1999-2010
Note: See appendix table 4 for year change began by state. Source: U.S. Census Bureau, Annual Survey of State Government Finances, 1982–2010.
Table 3Change in per capita institutional current operations expenditures, by states with linear increases and decreases, FY 1999-2010Trends and state groupingsLinear decrease Yearly per capita decrease
Connecticut $524Florida 1,186Idaho 1,232Iowa 1,169Kansas 1,046Maine 602Michigan 1,010Nevada 646Ohio 1,294Pennsylvania 1,371Rhode Island 1,948
Linear increase Yearly per capita increaseCalifornia $1,014Maryland 1,897Montana 1,852North Dakota 880Oklahoma 742
Note: Government expenditures for fiscal years preceding 2010 were inflation-adjusted to 2010 dollars, as appropriate for state spending. See Methodology. Excludes Utah and West Virginia due to data quality issues. Source: U.S. Census Bureau, Survey of State Government Finances, 1982–2000; and Bureau of Justice Statistics, National Prisoner Statistics Program, 1982–2000.
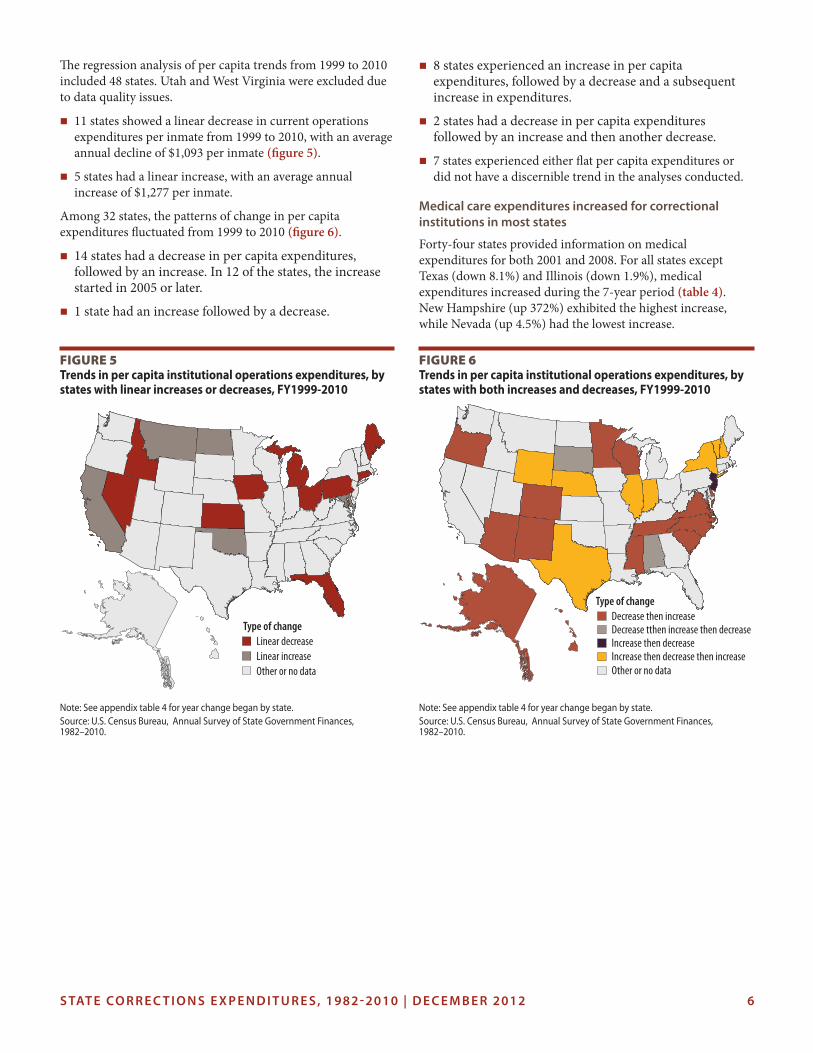
The regression analysis of per capita trends from 1999 to 2010 included 48 states. Utah and West Virginia were excluded due to data quality issues.
� 11 states showed a linear decrease in current operations expenditures per inmate from 1999 to 2010, with an average annual decline of $1,093 per inmate (figure 5).
� 5 states had a linear increase, with an average annual increase of $1,277 per inmate.
Among 32 states, the patterns of change in per capita expenditures fluctuated from 1999 to 2010 (figure 6).
� 14 states had a decrease in per capita expenditures, followed by an increase. In 12 of the states, the increase started in 2005 or later.
� 1 state had an increase followed by a decrease.
� 8 states experienced an increase in per capita expenditures, followed by a decrease and a subsequent increase in expenditures.
� 2 states had a decrease in per capita expenditures followed by an increase and then another decrease.
� 7 states experienced either flat per capita expenditures or did not have a discernible trend in the analyses conducted.
Medical care expenditures increased for correctional institutions in most states
Forty-four states provided information on medical expenditures for both 2001 and 2008. For all states except Texas (down 8.1%) and Illinois (down 1.9%), medical expenditures increased during the 7-year period (table 4). New Hampshire (up 372%) exhibited the highest increase, while Nevada (up 4.5%) had the lowest increase.
S TAT E CO R R E C T I O N S E X P E N D I T U R E S , 1982 - 2010 | D E C E M B E R 2012 6
Figure 5Trends in per capita institutional operations expenditures, by states with linear increases or decreases, FY1999-2010
Note: See appendix table 4 for year change began by state. Source: U.S. Census Bureau, Annual Survey of State Government Finances, 1982–2010.
Type of changeLinear decreaseLinear increaseOther or no data
Figure 6Trends in per capita institutional operations expenditures, by states with both increases and decreases, FY1999-2010
Note: See appendix table 4 for year change began by state. Source: U.S. Census Bureau, Annual Survey of State Government Finances, 1982–2010.
Type of changeDecrease then increaseDecrease tthen increase then decreaseIncrease then decreaseIncrease then decrease then increaseOther or no data
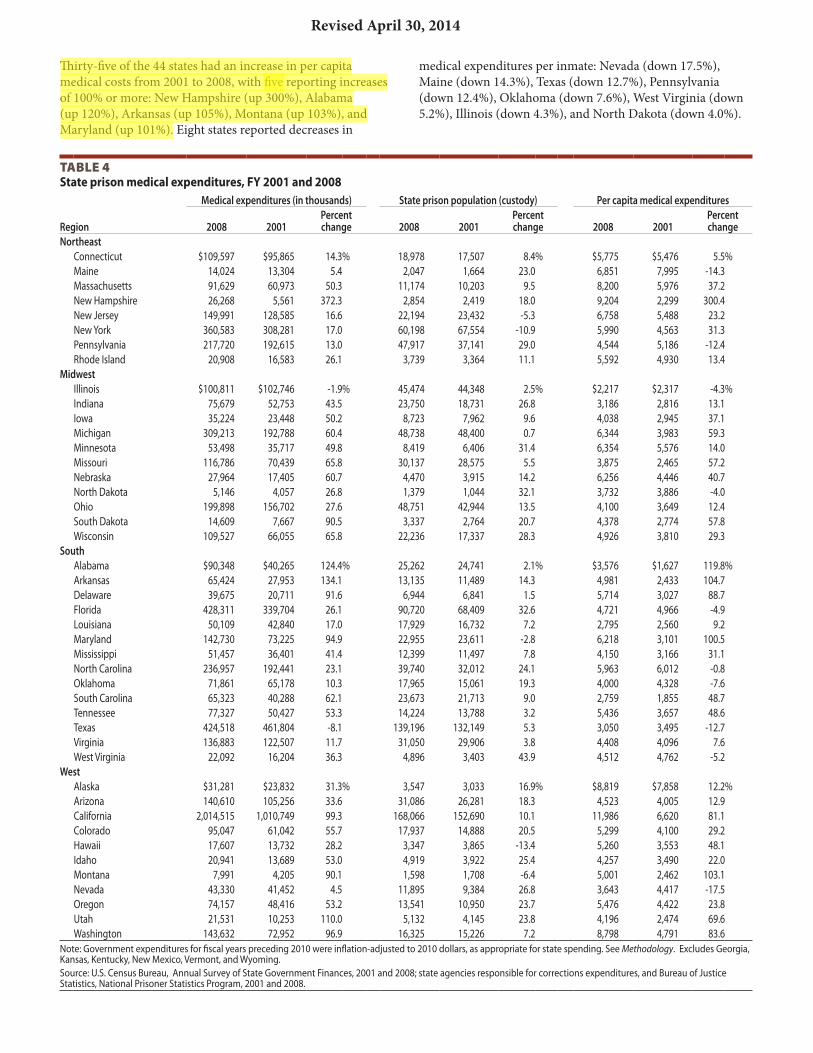
Thirty-five of the 44 states had an increase in per capita medical costs from 2001 to 2008, with five reporting increases of 100% or more: New Hampshire (up 300%), Alabama (up 120%), Arkansas (up 105%), Montana (up 103%), and Maryland (up 101%). Eight states reported decreases in
medical expenditures per inmate: Nevada (down 17.5%), Maine (down 14.3%), Texas (down 12.7%), Pennsylvania (down 12.4%), Oklahoma (down 7.6%), West Virginia (down 5.2%), Illinois (down 4.3%), and North Dakota (down 4.0%).
Table 4State prison medical expenditures, FY 2001 and 2008
Medical expenditures (in thousands) State prison population (custody) Per capita medical expenditures
Region 2008 2001Percent change 2008 2001
Percent change 2008 2001
Percent change
NortheastConnecticut $109,597 $95,865 14.3% 18,978 17,507 8.4% $5,775 $5,476 5.5%Maine 14,024 13,304 5.4 2,047 1,664 23.0 6,851 7,995 -14.3Massachusetts 91,629 60,973 50.3 11,174 10,203 9.5 8,200 5,976 37.2New Hampshire 26,268 5,561 372.3 2,854 2,419 18.0 9,204 2,299 300.4New Jersey 149,991 128,585 16.6 22,194 23,432 -5.3 6,758 5,488 23.2New York 360,583 308,281 17.0 60,198 67,554 -10.9 5,990 4,563 31.3Pennsylvania 217,720 192,615 13.0 47,917 37,141 29.0 4,544 5,186 -12.4Rhode Island 20,908 16,583 26.1 3,739 3,364 11.1 5,592 4,930 13.4
MidwestIllinois $100,811 $102,746 -1.9% 45,474 44,348 2.5% $2,217 $2,317 -4.3%Indiana 75,679 52,753 43.5 23,750 18,731 26.8 3,186 2,816 13.1Iowa 35,224 23,448 50.2 8,723 7,962 9.6 4,038 2,945 37.1Michigan 309,213 192,788 60.4 48,738 48,400 0.7 6,344 3,983 59.3Minnesota 53,498 35,717 49.8 8,419 6,406 31.4 6,354 5,576 14.0Missouri 116,786 70,439 65.8 30,137 28,575 5.5 3,875 2,465 57.2Nebraska 27,964 17,405 60.7 4,470 3,915 14.2 6,256 4,446 40.7North Dakota 5,146 4,057 26.8 1,379 1,044 32.1 3,732 3,886 -4.0Ohio 199,898 156,702 27.6 48,751 42,944 13.5 4,100 3,649 12.4South Dakota 14,609 7,667 90.5 3,337 2,764 20.7 4,378 2,774 57.8Wisconsin 109,527 66,055 65.8 22,236 17,337 28.3 4,926 3,810 29.3
SouthAlabama $90,348 $40,265 124.4% 25,262 24,741 2.1% $3,576 $1,627 119.8%Arkansas 65,424 27,953 134.1 13,135 11,489 14.3 4,981 2,433 104.7Delaware 39,675 20,711 91.6 6,944 6,841 1.5 5,714 3,027 88.7Florida 428,311 339,704 26.1 90,720 68,409 32.6 4,721 4,966 -4.9Louisiana 50,109 42,840 17.0 17,929 16,732 7.2 2,795 2,560 9.2Maryland 142,730 73,225 94.9 22,955 23,611 -2.8 6,218 3,101 100.5Mississippi 51,457 36,401 41.4 12,399 11,497 7.8 4,150 3,166 31.1North Carolina 236,957 192,441 23.1 39,740 32,012 24.1 5,963 6,012 -0.8Oklahoma 71,861 65,178 10.3 17,965 15,061 19.3 4,000 4,328 -7.6South Carolina 65,323 40,288 62.1 23,673 21,713 9.0 2,759 1,855 48.7Tennessee 77,327 50,427 53.3 14,224 13,788 3.2 5,436 3,657 48.6Texas 424,518 461,804 -8.1 139,196 132,149 5.3 3,050 3,495 -12.7Virginia 136,883 122,507 11.7 31,050 29,906 3.8 4,408 4,096 7.6West Virginia 22,092 16,204 36.3 4,896 3,403 43.9 4,512 4,762 -5.2
WestAlaska $31,281 $23,832 31.3% 3,547 3,033 16.9% $8,819 $7,858 12.2%Arizona 140,610 105,256 33.6 31,086 26,281 18.3 4,523 4,005 12.9California 2,014,515 1,010,749 99.3 168,066 152,690 10.1 11,986 6,620 81.1Colorado 95,047 61,042 55.7 17,937 14,888 20.5 5,299 4,100 29.2Hawaii 17,607 13,732 28.2 3,347 3,865 -13.4 5,260 3,553 48.1Idaho 20,941 13,689 53.0 4,919 3,922 25.4 4,257 3,490 22.0Montana 7,991 4,205 90.1 1,598 1,708 -6.4 5,001 2,462 103.1Nevada 43,330 41,452 4.5 11,895 9,384 26.8 3,643 4,417 -17.5Oregon 74,157 48,416 53.2 13,541 10,950 23.7 5,476 4,422 23.8Utah 21,531 10,253 110.0 5,132 4,145 23.8 4,196 2,474 69.6Washington 143,632 72,952 96.9 16,325 15,226 7.2 8,798 4,791 83.6
Note: Government expenditures for fiscal years preceding 2010 were inflation-adjusted to 2010 dollars, as appropriate for state spending. See Methodology. Excludes Georgia, Kansas, Kentucky, New Mexico, Vermont, and Wyoming.Source: U.S. Census Bureau, Annual Survey of State Government Finances, 2001 and 2008; state agencies responsible for corrections expenditures, and Bureau of Justice Statistics, National Prisoner Statistics Program, 2001 and 2008.
Revised April 30, 2014
S TAT E CO R R E C T I O N S E X P E N D I T U R E S , 1982 - 2010 | D E C E M B E R 2012 8
MethodologyExpenditure data were extracted from the U.S. Census Bureau’s Annual Survey of State Government Finances. The survey collects expenditure information for federal, state, and local governments. This report includes state government corrections expenditures and components of those expenditures compiled by U.S. Census Bureau representatives. Data were collected from government audits, budgets, and other financial reports with the advice of state officers and employees. The information from these reports was placed into expenditure categories using the U.S. Census Bureau’s classification system. Data were verified with government officials before being released. Differences in functional responsibilities from state to state may prohibit the comparability of expenditure data across all jurisdictions, and caution should be exercised when comparing government expenditures. The Survey of State Government Finances is available on the U.S. Census Bureau’s website at http://www.census.gov/govs/. For information about the state component of the survey, see http://www.census.gov/govs/state.
Medical expenditures
State medical expenditures for correctional institutions were compiled using state government accounting spreadsheets. The Bureau of Justice Statistics (BJS) categorized all costs associated with medical care, including mental health and dental costs. Medical expenditures included medical personnel costs, contract medical services, operational costs associated with medical units, and capital outlay and supply expenditures related to providing medical care. The categorized expense data were sent to state budget officers twice for verification: once after the initial categorization and again for confirmation before publication.
National Prisoner Statistics
Data on custody and private prison counts were from the National Prisoner Statistics (NPS) series. The NPS began in 1926 under a mandate from Congress and collects annual statistics on prisoners at yearend. State departments of corrections and the Federal Bureau of Prisons voluntarily submit NPS data. The NPS distinguishes between prisoners in custody and prisoners under jurisdiction. The NPS custody counts include all inmates held within a state’s facilities, including inmates housed for other states. The custody counts exclude inmates held in local jails and in other jurisdictions. Therefore, in this report, inmate counts will differ from BJS reports that use jurisdiction counts. The NPS also includes information on private prisoners, which is included with the custody count in the inmate populations used in this report. However, some states are unable to distinguish between custody and jurisdiction. For information on those states, see Jurisdiction notes in the yearly Prisoners series reports located on the BJS website. The NPS has historically included counts of inmates in the combined jail-prison systems of Alaska, Connecticut, Delaware, Hawaii, Rhode Island, and Vermont.
Preliminary data
Preliminary data were used for fiscal years 2009 and 2010. They are subject to change and will be superseded by data released approximately a year from their original publication. Although every effort is made to obtain financial information from state and local government entities, financial statements and completed questionnaires may not be available at the time the Census Bureau closes the processing. Missing data are imputed until complete data can be obtained. See the Census Bureau’s website for updates on release information: http://www.census.gov/govs/state/.
Data from the Census Bureau’s Annual Survey of State Government Finances further detail state governments’ corrections expenditures, including data on capital outlay and current operations expenditures. Data describing government expenditures for fiscal years preceding 2010 were inflation-adjusted to 2010 dollars.
Per capita calculations
Total per capita expenditures were calculated using each state’s institutional current operations expenditures divided by its custody and private prison population. Per capita medical expenditures were calculated using each state’s medical expenditures divided by its custody population. Current operations expenditures pay for the housing of inmates in private prisons and in prisons operated by the state, while intergovernmental expenditures pay for state inmates under a state’s jurisdiction in facilities other than that state’s prisons, such as local jails. Given the inability to determine how much of a state’s intergovernmental expenditures pays for the housing of inmates versus other correctional costs, such as probation and parole, as well as the difficulty in determining the location of all prisoners under a state’s jurisdiction, operational expenditures were calculated only for those inmates in physical custody, including those in private prisons.
To categorize states based on trends in per capita expenditures from 1999 to 2010, three regressions were run for each state: an equation to detect a linear increase or decrease per capita expenditures, an equation with a squared term to detect a single change in expenditure trends (increase to decrease or decrease to increase), and an equation with a cubed term to detect two changes during the time period. Two-tailed significance tests were conducted at the .05 confidence level.
States were then categorized by the equation that had the most number of changes and was significant. For example, if a state was significant for both the linear equation and the squared equation but not the cubed equation, the state was classified by the squared equation. Those states which did not test as significant in any of the three equations either did not have a statistically significant pattern in per capita expenditures or had per capita expenditures that remained flat. Utah and West Virginia were removed from the analyses due to data quality concerns.
S TAT E CO R R E C T I O N S E X P E N D I T U R E S , 1982 - 2010 | D E C E M B E R 2012 9
For those states classified as having a linear trend in per capita expenditures, the linear term provided the annual increase or decrease in expenditures. For those states that had significant squared or cubed equations, the year(s) at which per capita expenditures changed direction was calculated by taking the first derivative of the equation and solving for the year(s).
Adjusting for Inflation
Government expenditures for fiscal years preceding 2010 were inflation adjusted to 2010 dollars, as appropriate for state government spending. Annual chain-type price indices for gross domestic product were employed as divisors, and unadjusted expenditures were employed as dividends to produce inflation adjusted expenditures in 2010 dollars.
The U.S. Department of Commerce, Bureau of Economic Analysis, developed the price indices used in all inflation adjustments, as published in the Economic Report of the President. For more information on price indices, see the Economic Report of the President (2011), Table B-7. Chain-type price indices for gross domestic product, 1962-2010, U.S. Government Printing Office, retrieved from http://www.gpo.gov/fdsys/pkg/ERP-2011/pdf/ERP-2011-table7.pdf.
Terms and Definitions
Correctional institutions—includes facilities, such as prisons, residential work release units, and detention centers, in addition to correctional farms, industrial schools and training schools. Correctional institutions also include the related educational, training, and health care programs for inmates, and some hospitals for the criminally insane.
Corrections—involve the community supervision, confinement, and rehabilitation of adults and juveniles convicted of offenses and the confinement of persons awaiting trial or adjudication.
Education expenditures—include the financing of schools, colleges, and other educational institutions (e.g., for blind, deaf, and other handicapped individuals), and educational programs for adults, veterans, and other special classes. Also included are activities of higher education institutions operated by the state, except for agricultural extension services and experiment stations and hospitals serving the public.
Expenditures—include only external cash payments made from any source of funds, including any payments financed from borrowing, fund balances, intergovernmental revenue, and other current revenue.
Intergovernmental transfers—the sum of payments made from one government entity to another, including grants-in-aid, shared revenues, payments in lieu of taxes, and amounts
for services performed by one government for another on a reimbursable or cost-sharing basis (e.g., payments by one government to another for boarding prisoners). They exclude amounts paid to other governments for purchase of commodities, property, or utility services.
Direct expenditures—all expenditures except those classified as intergovernmental. They include direct current expenditures (e.g., salaries, wages, fees, and commissions and purchases of supplies, materials, and contractual services) and capital outlays (e.g., construction and purchase of equipment, land, and existing structures). Note that capital outlays are included for the year in which the direct expenditure was made, regardless of how the funds were raised (e.g., bond issue) or when they were paid back.
Highway expenditures—include construction, maintenance, and operation of highways, streets, and related structures, including toll highways, bridges, tunnels, ferries, street lighting, and snow and ice removal.
Health expenditures—include outpatient health services; public health administration; research and education; categorical health programs; treatment and immunization clinics; nursing; environmental health activities, such as air and water pollution control; ambulance service, if provided separately from fire protection services; school health services, if provided by health agencies rather than school agencies; and other general public health activities, such as mosquito abatement.
Hospital expenditures—include the financing, construction, acquisition, maintenance, or operation of hospital facilities, provision of hospital care, and support of public and private hospitals. Financing of nursing homes is included if they are directly associated with a government hospital.
Public welfare expenditures—include support of and assistance to persons contingent upon their need, such as cash assistance paid directly to needy persons under the categorical programs (Old Age Assistance, Temporary Assistance for Needy Families (TANF), and other welfare programs; vendor payments made directly to private purveyors for medical care, burials, and other commodities and services provided under welfare programs; and provision and operation by the government of welfare institutions. Other public welfare includes payments to other governments for welfare purposes, amounts for administration, support of private welfare agencies, and other public welfare services.
State custody count—the number of inmates a state holds in its facilities. A state may have custody of a prisoner over whom another state maintains jurisdiction.

S TAT E CO R R E C T I O N S E X P E N D I T U R E S , 1982 - 2010 | D E C E M B E R 2012 10
appendix Table 1 Selected components of state expenditures, FY 1982–2010
Year
Total state expenditures (In billions) Education Public welfarea Health and hospital Highways Corrections Other
1982 $790.7 $262.6 … $56.4 $64.1 $15.0 $392.61983 814.6 262.9 … 57.5 64.5 16.5 413.81984 820.8 271.3 … 58.4 67.4 18.1 405.71985 879.4 289.4 … 62.1 74.6 20.6 432.71986 927.2 306.4 … 65.9 80.1 23.5 451.31987 956.1 314.5 … 67.4 80.3 24.6 469.31988 986.2 324.5 … 71.0 82.8 27.1 480.81989 1,032.6 340.6 … 75.9 84.0 29.5 503.01990 1,075.5 347.5 … 80.2 83.2 32.4 532.21991 1,146.1 358.4 … 83.6 85.7 35.1 583.31992 1,251.7 377.0 … 88.5 87.3 35.8 663.11993 1,294.4 385.8 … 92.8 89.4 36.2 690.21994 1,314.1 390.5 … 95.9 90.6 39.2 697.91995 1,381.9 411.8 $321.7 99.1 94.7 43.0 411.61996 1,389.2 425.9 316.3 100.3 94.2 44.2 408.41997 1,417.9 437.3 322.2 100.2 95.5 46.1 416.61998 1,453.4 460.8 325.0 100.0 99.4 47.8 420.41999 1,506.7 480.8 333.8 102.6 103.1 49.6 436.82000 1,567.7 501.0 345.5 107.9 107.6 50.8 454.92001 1,664.1 525.3 368.6 109.8 110.5 53.5 496.42002 1,762.7 535.1 396.5 121.0 115.5 53.4 541.22003 1,792.7 542.3 414.7 116.9 113.1 51.7 554.02004 1,781.6 545.3 431.6 114.9 107.7 49.7 532.42005 1,755.7 542.0 439.9 109.8 108.6 48.4 507.02006 1,757.9 546.0 426.8 108.7 112.8 48.4 515.22007 1,756.0 551.9 421.7 114.1 110.8 49.9 507.62008 1,764.2 555.9 417.9 116.5 109.1 50.6 514.12009b 1,864.2 578.7 447.3 121.7 109.3 51.4 555.82010c 1,942.8 571.3 462.7 123.6 110.8 48.5 626.4Note: Government expenditures for fiscal years preceding 2010 were inflation-adjusted to 2010 dollars, as appropriate for state spending. See Methodology. …Not available.aData available for 1995 to 2010.bData on expenditures for 2009 are preliminary.cData on total corrections expenditures for 2010 are preliminary. See Methodology for further explanation. Source: U.S. Census Bureau, Annual Survey of State Government Finances, 1982–2010.

S TAT E CO R R E C T I O N S E X P E N D I T U R E S , 1982 - 2010 | D E C E M B E R 2012 11
appendix Table 2 Components of state corrections expenditures, FY 1982–2010
Institutional current operations Institutional capital outlay Other corrections
YearTotal corrections (in billions)
Expenditures (in billions)
Percent of total corrections
Expenditures (in billions)
Percent of total corrections
Expenditures (in billions)
Percent of total corrections
1982 $15.0 $9.7 64.7% $1.5 10.0% $3.8 25.3%1983 16.5 10.6 64.2 1.4 8.5 4.5 27.31984 18.1 11.8 65.6 1.9 10.6 4.3 23.91985 20.6 13.4 65.0 2.2 10.7 5.0 24.31986 23.5 14.5 61.7 3.2 13.6 5.8 24.71987 24.6 15.9 64.6 2.6 10.6 6.1 24.81988 27.1 17.5 64.6 3.5 12.9 6.1 22.51989 29.5 18.9 64.1 3.9 13.2 6.7 22.71990 32.4 21.0 64.8 4.1 12.7 7.3 22.51991 35.1 22.8 65.0 4.6 13.1 7.7 21.91992 35.8 23.7 66.2 3.7 10.3 8.4 23.51993 36.2 24.8 68.5 3.0 8.3 8.4 23.21994 39.2 26.7 68.1 3.3 8.4 9.2 23.51995 43.0 29.2 67.9 4.0 9.3 9.8 22.81996 44.2 30.8 69.7 3.0 6.8 10.4 23.51997 46.1 32.7 70.9 2.7 5.9 10.7 23.21998 47.8 33.7 70.5 3.2 6.7 10.9 22.81999 49.6 34.7 70.0 3.4 6.9 11.5 23.22000 50.8 35.6 70.1 3.1 6.1 12.1 23.82001 53.5 38.3 71.6 2.7 5.0 12.5 23.42002 53.4 38.2 71.5 2.3 4.3 12.9 24.22003 51.7 37.9 73.3 1.8 3.5 12.0 23.22004 49.7 36.5 73.4 1.5 3.0 11.7 23.52005 48.4 35.7 73.8 1.8 3.7 10.9 22.52006 48.4 36.4 75.2 1.5 3.1 10.5 21.72007 49.9 37.3 74.7 1.9 3.8 10.7 21.42008 50.7 38.0 75.0 1.8 3.6 10.9 21.52009a 51.4 38.6 75.1 2.0 3.9 10.8 21.02010b 48.5 37.3 76.9 1.3 2.7 10.0 20.4Note: Government expenditures for fiscal years preceding 2010 were inflation-adjusted to 2010 dollars, as appropriate for state spending. See Methodology. aData on expenditures for 2009 are preliminary.bData on total corrections expenditures for 2010 are preliminary. The categories of corrections expenditures are estimates based on total corrections expenditures and previous years’ expenditures. See Methodology.Source: U.S. Census Bureau, Annual Survey of State Government Finances, 1982–2010.
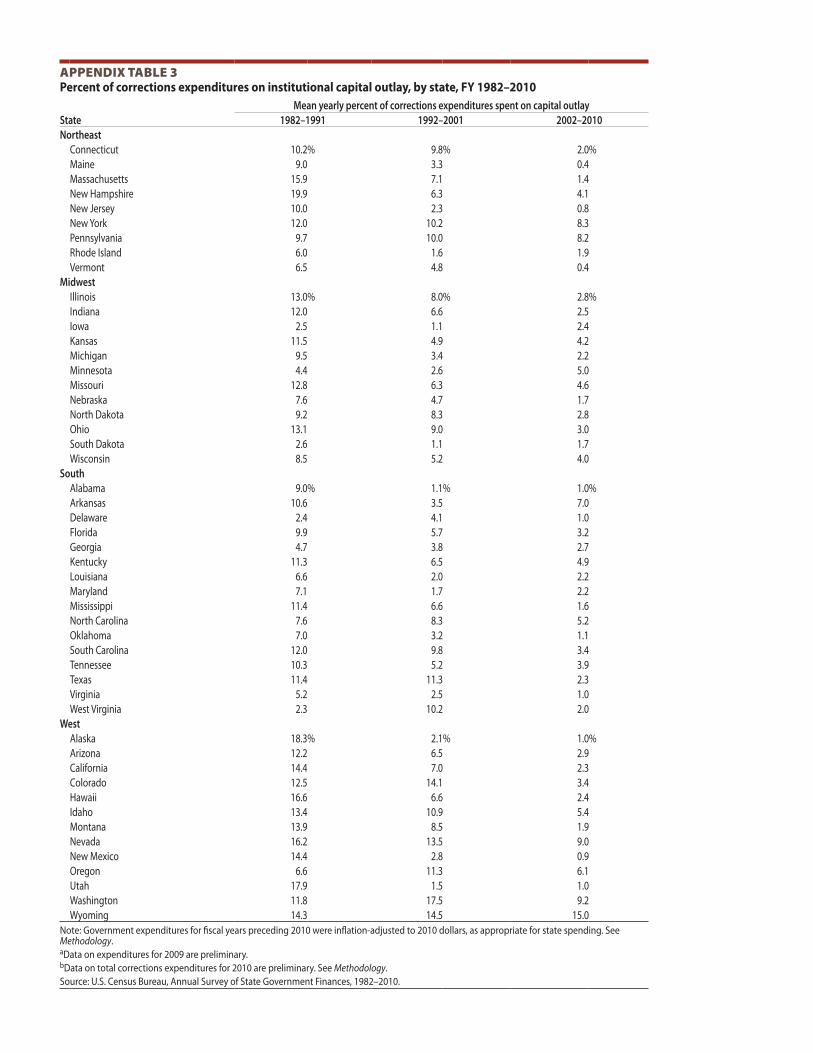
appendix Table 3 Percent of corrections expenditures on institutional capital outlay, by state, FY 1982–2010
StateMean yearly percent of corrections expenditures spent on capital outlay
1982–1991 1992–2001 2002–2010Northeast
Connecticut 10.2% 9.8% 2.0%Maine 9.0 3.3 0.4Massachusetts 15.9 7.1 1.4New Hampshire 19.9 6.3 4.1New Jersey 10.0 2.3 0.8New York 12.0 10.2 8.3Pennsylvania 9.7 10.0 8.2Rhode Island 6.0 1.6 1.9Vermont 6.5 4.8 0.4
MidwestIllinois 13.0% 8.0% 2.8%Indiana 12.0 6.6 2.5Iowa 2.5 1.1 2.4Kansas 11.5 4.9 4.2Michigan 9.5 3.4 2.2Minnesota 4.4 2.6 5.0Missouri 12.8 6.3 4.6Nebraska 7.6 4.7 1.7North Dakota 9.2 8.3 2.8Ohio 13.1 9.0 3.0South Dakota 2.6 1.1 1.7Wisconsin 8.5 5.2 4.0
SouthAlabama 9.0% 1.1% 1.0%Arkansas 10.6 3.5 7.0Delaware 2.4 4.1 1.0Florida 9.9 5.7 3.2Georgia 4.7 3.8 2.7Kentucky 11.3 6.5 4.9Louisiana 6.6 2.0 2.2Maryland 7.1 1.7 2.2Mississippi 11.4 6.6 1.6North Carolina 7.6 8.3 5.2Oklahoma 7.0 3.2 1.1South Carolina 12.0 9.8 3.4Tennessee 10.3 5.2 3.9Texas 11.4 11.3 2.3Virginia 5.2 2.5 1.0West Virginia 2.3 10.2 2.0
WestAlaska 18.3% 2.1% 1.0%Arizona 12.2 6.5 2.9California 14.4 7.0 2.3Colorado 12.5 14.1 3.4Hawaii 16.6 6.6 2.4Idaho 13.4 10.9 5.4Montana 13.9 8.5 1.9Nevada 16.2 13.5 9.0New Mexico 14.4 2.8 0.9Oregon 6.6 11.3 6.1Utah 17.9 1.5 1.0Washington 11.8 17.5 9.2Wyoming 14.3 14.5 15.0
Note: Government expenditures for fiscal years preceding 2010 were inflation-adjusted to 2010 dollars, as appropriate for state spending. See Methodology.aData on expenditures for 2009 are preliminary.bData on total corrections expenditures for 2010 are preliminary. See Methodology. Source: U.S. Census Bureau, Annual Survey of State Government Finances, 1982–2010.
S TAT E CO R R E C T I O N S E X P E N D I T U R E S , 1982 - 2010 | D E C E M B E R 2012 13
appendix Table 4Type of change in per capita institutional operations expenditures, by state and year change began, FY1999-2010Trends and state groupingsDecrease then increase Year increase began
Alaska 2008Arizona 2009Colorado 2010Delaware 2005Hawaii 2004Minnesota 2008Mississippi 2008New Mexico 2004North Carolina 2010Oregon 2006South Carolina 2010Tennessee 2005Virginia 2007Wisconsin 2006
Increase then decrease Year decrease beganNew Jersey 2007
Increase to decrease to increase Year decrease began Year increase beganIllinois 2001 2008Indiana 2001 2009Nebraska 2000 2008New Hampshire 2002 2008New York 2004 2005Texas 2001 2008Vermont 2001 2008Wyoming 2003 2007
Decrease to increase to decrease Year increase began Year decrease beganAlabama 2001 2008South Dakota 2001 2009
No patternArkansasGeorgiaKentuckyLouisianaMassachusettsMissouriWashington
Note: Government expenditures for fiscal years preceding 2010 were inflation-adjusted to 2010 dollars, as appropriate for state spending. See Methodology. Excludes Utah and West Virginia due to data quality issues. Source: U.S. Census Bureau, Survey of State Government Finances, 1982–2000; and Bureau of Justice Statistics, National Prisoner Statistics Program, 1982–2000.
Office of Justice ProgramsInnovation • Partnerships • Safer Neighborhoods
www.ojp.usdoj.gov
NCJ239672
The Bureau of Justice Statistics is the statistical agency of the U.S. Department of Justice. James P. Lynch is director.
This report was written by Tracey Kyckelhahn. Thomas H. Cohen verified the report.
Catherine Bird and Jill Thomas edited the report, and Barbara Quinn produced the report under the supervision of Doris J. James.
December 2012, NCJ 239672