u.s. department of energy fuel cell technology office … · fuel cell technologies office | 1 u.s....
TRANSCRIPT

Fuel Cell Technologies Office | 1
U.S. Department of Energy Fuel Cell Technology Office
Role of Electrolyzers in Grid Services
Rob Hovsapian, Ph.D.Department ManagerPower and Energy SystemsIdaho National Laboratory05/23/2017

Fuel Cell Technologies Office | 2
• DOE Grid Modernization Laboratory Consortium (GMLC) project 1.4.2 “Definitions, Standards and Test Procedures for Grid Services from Devices”
• DOE Fuel Cell Technologies Office (FCTO) project “Dynamic Modeling and Validation of Electrolyzers in Real Time Grid Simulation”
Funding Acknowledgment

Fuel Cell Technologies Office | 3Classes of Devices and Services
Devices (DERs)
Responsive, flexible end-use loads► Water heaters
► Refrigerators
► Air conditioners
► Commercial rooftop units (RTUs)
► Commercial refrigeration
► Commercial lighting
► Electric vehicles (charging only)
► Electrolyzers
Storage► Battery / inverter systems
► Thermal storage systems
► Electric vehicles (full vehicle-to-grid)
Distributed generation► Photovoltaic solar (PV) / inverter systems
► Fuel cells
Grid Services
► Peak load management (capacity)
► Energy market price response (wholesale energy cost)
► Capacity market dispatch (market value)
► Frequency regulation (market value)
► Spinning reserve (market value)
► Ramping (new)
► Artificial inertia (new)
► Distribution voltage management (new; e.g., PV impacts management)

Fuel Cell Technologies Office | 4
• Hydrogen production and storage during excess generation from renewables or traditional energy sources.
• Hydrogen can provide grid services
Motivation

Fuel Cell Technologies Office | 5
• Current activities - role of hydrogen refueling stations in the electricity grid and renewable energy assimilation
• H2@Scale has a longer term vision with potential benefits of hydrogen to the energy nexus
H2@Scale Relevance
5

Fuel Cell Technologies Office | 6
Dynamic Characteristics: Ramp-up and
Ramp-down Test
• Ramp-up Tests– from 25% to: 50%, 75% and
100% of rated power
• Ramp-down Tests– from 100% to: 75%, 50% and
25% of rated power
PEM electrolyzer
Electrical Power 40 kW
Rated Current 155 A per stack
Stack Count 3
Ramp-up and ramp-down response of a PEM electrolyzer [Ref. 1]

Fuel Cell Technologies Office | 7
• Power set-point variation to examine Demand Response– quantification of rate of rapid load change and demand response
– tested with SCADA system – inherent delay of 1 second
Dynamic characteristics – Power Variation
INL & NREL testing of a 120kW electrolyzer

Fuel Cell Technologies Office | 8
• Peak capacity management– deploying fleets of electrolyzers to consistently and reliably reduce critical
peak loads within a defined region or location on the grid
• Energy market price response– fleets of electrolyzers consume energy when prices are low and defer
consumption (set energy free) when prices are high
• Regulation– operating point adjustment counteracts short-term changes in electricity use
that might affect the stability of the power system
• Spinning Reserve– by reducing its power consumption fleets of electrolyzers can support the
event when loss of generation unit in the grid occurs
Identified Grid Services 1

Fuel Cell Technologies Office | 9
• Ramping– analogue to generator, fleets of electrolyzers start and stop on command,
while the “ramp rate” is the rate at which they can increase or decrease consumption
• Artificial inertia– fleets of electrolyzers regulate active power consumption in response
rate of change of frequency
• Distribution voltage management– upon detecting the voltage deviations (self-sensing and/or receipt of external
measurement signals) fleets of electrolyzers adjust the net load in the form of their reactive and/or real power components
• Autonomous grid service responses– additional (high-level) controller enables grid services in “stand-alone” mode
Identified Grid Services 2

Fuel Cell Technologies Office | 10
• Purely resistive load, supplied from a DC source (power converter)
• Very high rate of change and flexibility in setting power operating points
• Capable of sensing deviations in power systems, capable of adjusting their operating points to support the grid (fleets of electrolyzers)
• Frequency and voltage support by reducing/increasing power consumption
Key Capabilities of Electrolyzers

Fuel Cell Technologies Office | 11
• Objective: Validate the benefits of hydrogen electrolyzers through grid services and hydrogen sale to fuel cell vehicles for full-scale deployment. – Characterization of the potential and highest economic value based on the
needs of multiple stakeholders for specific grid regions
– Demonstration of the reliable, fast-reacting performance of hydrogen-producing electrolyzers for at-scale energy storage devices
– Verification of the communications and controls needed for successful participation in electricity markets and DR programs and ancillary services, leading to additional revenue and reduced hydrogen production cost
Role of Electrolyzers in Grid Services

Fuel Cell Technologies Office | 12
Dynamic Modeling and Validation of Electrolyzers in Real Time Grid Simulation
12

Fuel Cell Technologies Office | 13
• High-level controller (Front-end controller)– applies EMS requirements and supports power quality by varying the
electrolyzer’s operating point
– communicates to other FECs to coordinate remedy actions
Controller Requirements

Fuel Cell Technologies Office | 14Front-End Controller Architecture 1
FEC consists of three modules:
1. Communication moduleRealizes data exchange between FEC, utility, and electrolyzer’slow-level controller
2. Optimization module Computes set point for electrolyzer operation that optimizes the revenue of the hydrogen refueling station
3. Interpretation moduleGenerates the reference control signal in order to ensure that the low level controller properly integrates with the FEC

Fuel Cell Technologies Office | 15Front-End Controller Architecture 2
• FEC receives numerous information at input, applies optimization algorithm, and generates reference DC current
• Reference is forwarded to the electrolyzer’s low level controller
• FEC interfaced with Electrolyzer
• DR Signal received from higher level control (EMS/DMS/Aggregator)
• Local sensing of power quality
• Reference operating point (DC-current) sent to power converter

Fuel Cell Technologies Office | 16Electrolyzer Characterization Testing
Types of tests run to achieve 200 hour test results
0.0
50.0
100.0
150.0
200.0
250.0
31-Jan 10-Feb 20-Feb 1-Mar 11-Mar 21-Mar 31-Mar
Test
Hou
rs
Ramp Up, Ramp Down
Load Steps
Utility Demand Response
Random Variations

Fuel Cell Technologies Office | 17Demand Response Testing
Remote electrolyzer operation over 200 hour test period shows electrolyzer’s ability to participate in grid support market
Four distinct profiles were used to characterize the electrolyzer response to remote commands
1. Ramp Up, Ramp Down → variations in increasing or decreasing load steps
2. Load Steps → variations in the size of change
3. Utility Demand Response → expected performance of electrolyzer in grid application
4. Random Variations → variations in the speed of change
Sample utility Demand Response time series data (PG&E E-20 profile) used to remotely control the electrolyzer over ~7 hour window 8 March 2016.
|steady state error| < 1%

Fuel Cell Technologies Office | 18Electrolyzer Characterization Testing: Summary
Fast response time & quick slew rate
PerformanceMetric
Ramp-up & Ramp-down
Load Steps DR Random Variationin Load
Response Time < 1seconds < 1seconds < 1seconds < 1seconds
Settling Time < 1seconds < 1seconds < 1seconds < 1seconds
Slew Rate +1 kW/second-1 kW/second
(Other rates were 0.5 and 2
kW/second)
Predetermined load values at variable
times
10 kW, 20 kW, 30kW, 40 kW, 50 kW, 118 kW, & E-20 DR (PG&E) at 2, 5, and 10 minutes interval
Random set-points between 13 & 118
kW per second
Operational Limits
13 kW to 118 kW 13 kW to 118 kW 13 kW to 118 kW 13 kW to 118 kW
Startup and Shutdown Time
30 seconds and < 1 second
30 seconds and < 1 second
30 seconds and< 1 second
30 seconds and < 1 second

Fuel Cell Technologies Office | 19
• Demonstration of reduction in transients created from faults with electrolyzers in the grid
Impacts on Power System Transient Stability
Resistive Capabilities and Impacts on the Grid

Fuel Cell Technologies Office | 20Real-Time Model of PG&E Network
Real-time grid model of Pacific Gas & Electric that covers hydrogen refueling station interconnections
• Network synthesis and modeling in real-time simulator at INL, represents the PG&E infrastructure
• Electrolyzer connected as Hardware-In-the-Loop
• Served as a testbed for testing grid services and stability of connecting electrolyzers– Centralized and distributed electrolysis
is assessed under varying conditions
– Fault conditions within the grid• Balanced and unbalanced faults
• Step load changes in the grid
• Voltage and frequency variations
– Demand response signals and response of the electrolyzer

Fuel Cell Technologies Office | 21Frequency Support by Centralized Electrolysis
Electrolyzers controlled by FEC can enhance grid stability by limiting frequency excursions
Electrolyzer Response without FEC
59.986
59.9714
59.981
59.986
59.985
59.984
Electrolyzer Response with FEC

Fuel Cell Technologies Office | 22Voltage Support by Centralized Electrolysis
Electrolyzers controlled by FEC can enhance grid stability by limiting voltage excursions
0.985
0.9980.996
0.995
0.973
0.995
0.9961.003
Electrolyzer Response without FEC Electrolyzer Response with FEC

Fuel Cell Technologies Office | 23
Frequency Support by Multiple Electrolyzers with
FEC
Multiple electrolyzers controlled by FEC can enhance overall grid stability by limiting frequency excursions
59.992
59.979
Fault location: Node 39Fault type: Three phase balanceFault duration: 0.1 seconds
59.992
59.992
59.979
59.979
59.996
59.996
59.997
59.992
59.992
59.992
Loca
l Fre
quen
cy (H
z)
NODE 39
NODE 40
NODE 32
Fuel Cell Technologies Office | 24
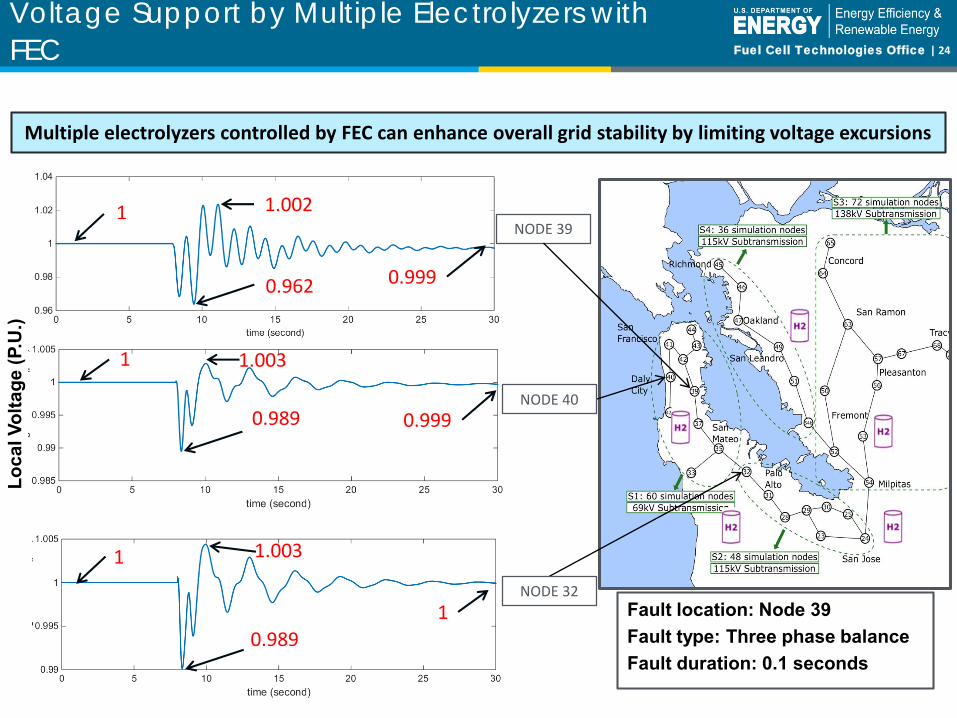
Voltage Support by Multiple Electrolyzers with
FEC
Multiple electrolyzers controlled by FEC can enhance overall grid stability by limiting voltage excursions
0.989
NODE 39
Fault location: Node 39Fault type: Three phase balanceFault duration: 0.1 seconds
0.962
0.989
1
1
1
1.003
1.003
1.002
0.999
0.999
1
Loca
l Vol
tage
(P.U
.)
NODE 40
NODE 32

Fuel Cell Technologies Office | 25
25
Variability of Renewable / Hydrogen Refueling Stations
• Renewable Energy sources such as wind and solar demonstrate high degree of time dependent variability i.e., seconds to minutes to days…
• Electrolyzers have an innate capability to respond in seconds to follow control set points
• How can electrolyzers offset the variability observed by the power?
– Grids expected predictable and non-varying generation sources
– Hydrogen demands per day for different years are used as a constraint

Fuel Cell Technologies Office | 26
26
• Objective: Offset time-dependent, aggregated variability of solar and wind power using electrolysis
• Total of 13 MW electrolyzer plant is used for this example
• 2018 test case projections from ARB on vehicle fuel use to generate 1,800 kg/day of hydrogen for 7,200 FCEVs
• Approximate fuel dispensed in Santa Clara, Sacramento, San Francisco, Marin, Contra Cost and Alameda county
• Total energy consumed to generate this hydrogen demand 90.28 MWh/day
0
2
4
6
8
10
12
14
0 5 10 15 20
Re
al P
ow
er
in M
W
Time of the day
Total Wind and Solar Generation
2018 Case with 7,200 FCEVs

Fuel Cell Technologies Office | 27Wind, Solar, and Electrolysis
• Advanced control of a 13 MW electrolysis plant to offset variability of wind and solar power
• A fixed and predictable power injected into the grid from solar and wind plant due to coordinated operation with electrolyzers
0
2
4
6
8
10
12
0 5 10 15 20
Re
al P
ow
er
in M
W
Time of the day
Electrolyzer performance to produce 1800 kg/day
0
0.5
1
1.5
2
2.5
3
0 5 10 15 20
Re
al P
ow
er
in M
W
Time of the day
Aggregate Feed into the Grid (2018)

Fuel Cell Technologies Office | 282022 Case with 43,600 FCEVs
• Objective: Offset time-dependent, aggregated variability of solar and wind power using electrolysis
• Total of 45 MW electrolyzer plant is used for this example
• Typical efficiency of PV ~20-30%
• 2022 test case is used as reference to generate 7,575 kg/day of hydrogen for 43,600 FCEVs
• Approximate fuel dispensed in Santa Clara, Sacramento, San Francisco, Marin, Contra Cost and Alameda county
• Total energy consumed to generate 330 MWh/day
0
10
20
30
40
50
60
0 5 10 15 20
Po
we
r in
MW
Time of the day
Total wind and solar generation

Fuel Cell Technologies Office | 29Wind, Solar, and Electrolysis
• Advanced control of a 45 MW electrolysis plant to offset variability of wind and solar power
• A fixed power injected into the grid from solar and wind plant due to coordinated operation with electrolyzers
0
1
2
3
4
5
6
7
8
9
0 5 10 15 20
Po
we
r in
MW
Time of the day
Total feed in the grid (2022)
0
5
10
15
20
25
30
35
40
45
50
0 5 10 15 20 25 30
Po
we
r in
MW
Time of the day
Electrolyzer performance to generate 7,575 kg/day of hydrogen (2022)

Fuel Cell Technologies Office | 30
• Fleets of electrolyzers (hydrogen refueling stations)– grid support by reducing voltage and frequency excursions
• Enhanced revenue and reduced H2 cost of production by participating in power grid services
• FEC– is a vendor-neutral controller that is compatible with the existing
electrolyzer’s (low level) controllers
– can receive and interpret communication signals coming from & going to EMS/DMS/Aggregator
– enhances electrolyzer’s basic purpose to produce hydrogen by providing grid services
– allows cohesive response of fleets of electrolyzers
– enables autonomous grid service responses
– allows H2 operator choice to participate in grid services (or not to)
Lessons learned

Fuel Cell Technologies Office | 31DoE – National Labs Real Time Super Lab connectivity
31
31
LaboratoryLocation
Full Name AcronymIdaho National Laboratory INL Idaho Falls, Idaho
National Renewable Energy Laboratory NREL Golden, ColoradoSandia National Laboratory SNL Albuquerque, New MexicoColorado State University
Advanced Power Engineering Laboratory CSU-APEL Fort Collins, Colorado
Florida State University Center for Advanced Power Systems FSU-CAPS Tallahassee, Florida
University of South Carolina USC Columbia, South CarolinaPolytechnic University of Turin POLITO Turin, Italy
RWTH Aachen University Institute for Automation of Complex Power Systems RWTH-ACS Aachen, Germany

Fuel Cell Technologies Office | 32Multi-Lab Co-simulation and (P)HIL- Current Status
32
Western System Coordinating Council (WSCC)9-bus system approximation
European HV transmission network benchmark (CIGRÉ)
MMC-based MVDC Test Bed
22
0 k
V
22
kV
22
kV
22
kV
63
M
VA
55
M
VA
63
M
VA
Distribution system –a portion of Turin City, Italy
Controller-In-the-Loop

Fuel Cell Technologies Office | 33Q&A

Fuel Cell Technologies Office | 34
1. J. Eichman, K. Harrison, and M. Peters, “Novel Electrolyzer Applications: Providing More Than Just Hydrogen”, NREL, September 2014
2. E. Zoulias, E. Varkaraki, N. Lymberopoulos, C.N. Christodoulou, G.N. Karagiorgis, “A Review On Water Electrolysis”, Centre for Renewable Energy Sources (CRES) and Frederick Research Center (FRC), Greece, 2006
3. M. Carmo, D.L. Fritz, J. Mergel, D. Stolten, “A comprehensive review on PEM water electrolysis.” International Journal of Hydrogen Energy (38:12), 2013; pp. 4901-4934
4. G. Zini, P. Tartarini, “Solar Hydrogen Energy Systems – Science and Technology for the Hydrogen Economy”, Springer, Italy, 2012
5. Joonas Koponen, “Review of water electrolysis technologies and design of renewable hydrogen production systems”, Master’s Thesis, Lappeenranta University of Technology, Finland, 2015
6. Jennifer Kurtz, Kevin Harrison, Rob Hovsapian, Manish Mohanpurkar, “Dynamic Modeling and Validation of Electrolyzers in Real Time Grid Simulation”, Intermountain Energy Summit, August 9, 2016
7. Ruth, M. Current (2009) State-of-the-Art Hydrogen Production Cost Estimate Using Water Electrolysis: Independent Review. NREL/BK-6A1-46676. Golden, CO: National Renewable Energy Laboratory, 2009
References

Fuel Cell Technologies Office | 35
Thank youRob Hovsapian