u.s. department of energy - advanced vehicle testing activity
TRANSCRIPT

U.S. Department of Energy -Advanced Vehicle Testing ActivityPHEV Battery Charging Profile and Life Studies, and Field Testing and Demonstration Activities
PHEV Lab Coordination Meeting@ Sentech, November 2007Jim Francfort (INL)

2
Presentation• INL and AVTA Background and goals• PHEV Battery Charging Profile Studies• PHEV Battery End-of-Life Studies• PHEV Field Testing and Demonstration Studies• Above includes ongoing activities, testing results,
and activities being initiated

3
AVTA Background & Goal• The Advanced Vehicle Testing Activity (AVTA) is part
of the U.S. Department of Energy’s Office of Vehicle Technologies
• The AVTA is primarily conducted by the Idaho National Laboratory (INL) and Electric Transportation Applications (ETA - Phoenix, AZ), with Argonne National Laboratory performing dynamometer testing
• AVTA Goal– Provide benchmark data to technology modelers,
and research and development programs – Assist fleet managers in making informed vehicle
purchase, deployment and operating decisions

4
PHEV Battery Charging Profile Studies

5
PHEV Battery Charging Profile Studies• Document charging profiles in vehicles, both in the lab
and in fleets, including:– Power and energy demands– Human impacts (the third PHEV dimension) on time
and length of charging • Document battery charging profiles for all PHEVs
obtained for laboratory and fleet testing• Document charging profiles in real-world V2Grid use• Document V2Grid feasibility and battery life impacts• Document operational and economic life-cycles of
chargers, batteries and vehicles in various scenarios• Provide real-world microscopic data to ORNL and PNL
to feed their macroscopic models of grid impacts• Partner with state and regional governmental entities,
and electric utilities to leverage funding

6
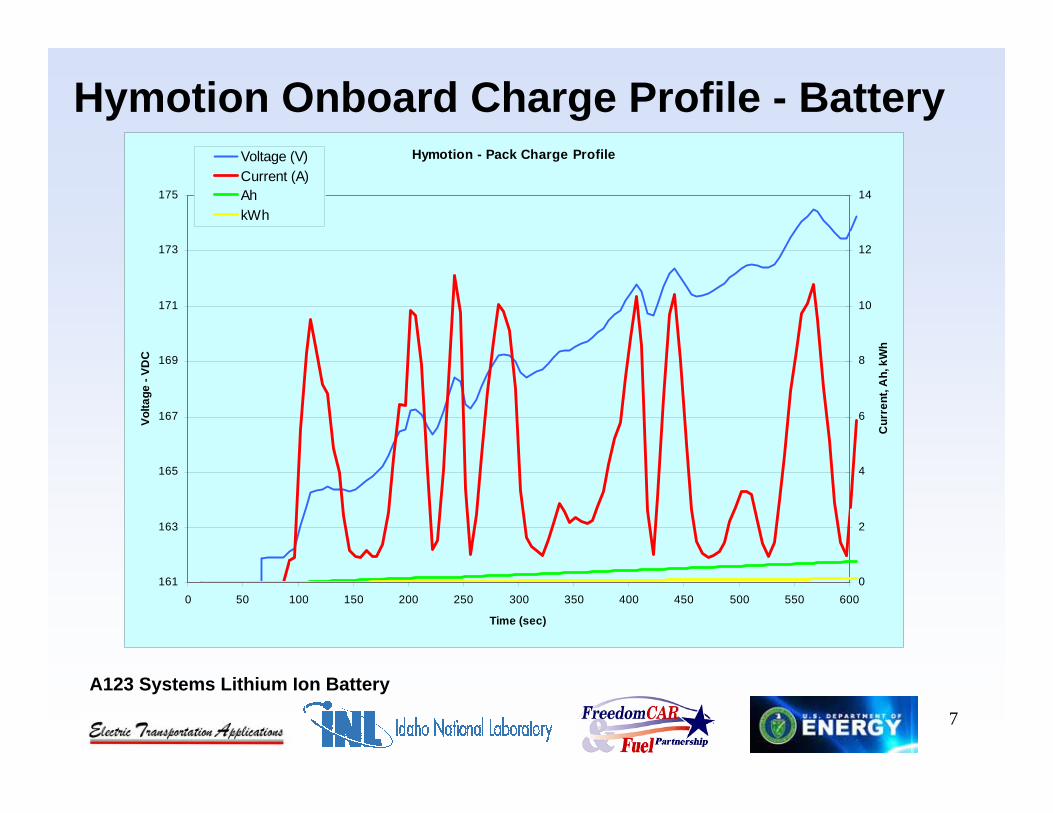
Hymotion Onboard Charge Profile - Battery
A123 Systems Lithium Ion Battery
Hymotion - Pack Charge Profile
196.95
24.26
4.62
0
50
100
150
200
250
0 2000 4000 6000 8000 10000 12000 14000 16000 18000
Time (sec)
Volta
ge -
VDC
0
5
10
15
20
25
Curr
ent,
Ah,
kW
h
Voltage (V)Current (A)AhkWh
7
Hymotion Onboard Charge Profile - Battery
A123 Systems Lithium Ion Battery
Hymotion - Pack Charge Profile
161
163
165
167
169
171
173
175
0 50 100 150 200 250 300 350 400 450 500 550 600
Time (sec)
Volta
ge -
VDC
0
2
4
6
8
10
12
14
Cur
rent
, Ah,
kW
h
Voltage (V)Current (A)AhkWh

8
Hymotion Onboard Charge Profile – Cell
A123 Systems Lithium Ion Battery
Hymotion - Cell Charge Profile
3.50
2.20
7.49
0
0.5
1
1.5
2
2.5
3
3.5
4
0 2000 4000 6000 8000 10000 12000 14000 16000 18000
Time (sec)
Volta
ge V
DC
0
1
2
3
4
5
6
7
8
Curr
ent,
Wh,
Ah
Voltage per Cell(V)
Current per Cell (A)
Ah per Cell (Ah)
Wh per Cell (Wh)

9
EnergyCS Onboard Charge Profile - Battery
Valence Lithium Ion Battery
EnergyCS - Pack Charge Profile
245.54
4.62
20.77
5.04
0
50
100
150
200
250
0 5000 10000 15000 20000 25000
Time (sec)
Vol
tage
- VD
C
0
5
10
15
20
25
Cur
rent
, Ah,
kW
h
Voltage (V)Current (A)AhkWh

10
EnergyCS Onboard Charge Profile - Battery
Valence Lithium Ion Battery
EnergyCS - Pack Charge Profile
4.62
241
242
243
244
245
246
247
248
16000 16050 16100 16150 16200 16250 16300 16350 16400 16450 16500 16550 16600
Time (sec)
Volta
ge -
VDC
0
2
4
6
8
10
12
14
Cur
rent
, Ah,
kW
h
Voltage (V)Current (A)AhkWh

11
EnergyCS Onboard Charge Profile – Cell
Valence Lithium Ion Battery
EnergyCS - Cell Charge Profile
3.41
0.14
0.63
2.12
0
1
2
3
4
5
6
7
8
9
10
0 5000 10000 15000 20000 25000
Time (sec)
Vol
tage
- VD
C
0.0
0.5
1.0
1.5
2.0
2.5
Cur
rent
, Ah,
Wh
Voltage per Cell (V)Current per Cell (A)Ah per Cell (Ah)Wh per Cell (Wh)

12
• Identify 3 locations with suitable PHEV charging mass • Measure charging profile impacts on facilities by using:
– Wireless piggy-backing of building meter– Wireless kWh meter on charging branch(s)
• Examine timing and magnitude of facility peak demand and charging profile peak demand
• Document charging profile impacts on facility demand• Project out if 30 to 50+ PHEVs charged onsite• How will charging profiles impact demand and cost as
well as electrical infrastructure requirements
Field Charging Profile Studies

13
V2Grid & Charging Profile Study• Already identified partners and a remote (isolated)
Western U.S. town as full-scale V2Grid test bed– 150 electric meters– 200 kW hydroelectric plant main generation– 3 small diesel generators used for peaking load– Brief (seconds) periods of peak load requires diesel
generators to run 15 minutes or longer– Located in National Park Service unit
• A single PHEV may meet 5% of peak load• Avoids need for thousands of PHEVs to test V2Grid
concept on a large electrical grid• Documents charging profiles in real-world V2Grid use
14
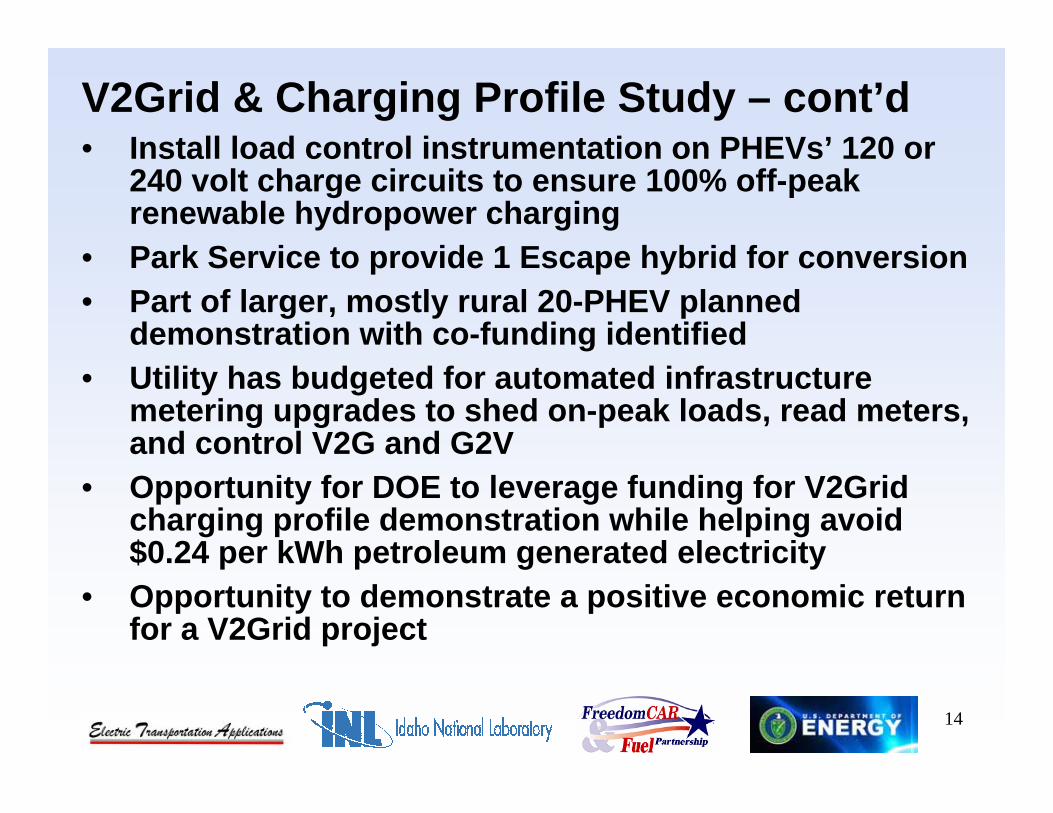
V2Grid & Charging Profile Study – cont’d• Install load control instrumentation on PHEVs’ 120 or
240 volt charge circuits to ensure 100% off-peak renewable hydropower charging
• Park Service to provide 1 Escape hybrid for conversion• Part of larger, mostly rural 20-PHEV planned
demonstration with co-funding identified• Utility has budgeted for automated infrastructure
metering upgrades to shed on-peak loads, read meters, and control V2G and G2V
• Opportunity for DOE to leverage funding for V2Grid charging profile demonstration while helping avoid $0.24 per kWh petroleum generated electricity
• Opportunity to demonstrate a positive economic return for a V2Grid project

15
PHEV Battery End-of-Life Studies

16
PHEV Battery End-of-Life Studies• End of life (EoL) for PHEV batteries in vehicles is
unknown and influenced by:– Time?– Miles?– Potholes?– Charge cycles?– Temperature ranges and swings?– Charging patterns: SOC at charging start, partial
charges, and number of charges• Desire to test PHEV batteries when new and at EoL, is
balanced against need for healthy batteries in order to test PHEV concept, petroleum reduction, V2Grid, and measure charging profiles
• Experience testing HEV batteries when new and at 160,000 miles

17
PHEV Battery End-of-Life Studies – cont’d• AVTA will conduct initial battery testing after 5,440
miles of accelerated testing• Retest batteries at 25,000 and 50,000 miles, and ? miles • Identifying vehicle missions that maximize battery
discharge for each drive/charge cycle yet economizes on daily number of miles
• Use FreedomCAR Plug-in Hybrid Electric Battery Test Manual, but two-battery designs may require unique battery test plans
• Evaluate batteries in PHEVs to EoL under various conditions:– Full discharge cycle with full recharge– Partial discharge cycle with full recharge– Partial discharge cycle with partial recharge

18
PHEV Battery End-of-Life Studies – cont’d• Demonstrate PHEV fast (or just faster) charging
– Modify PHEV and operate in fleet - charge/discharge– Perform Level 2 charging (6 kW for a 1 hour charge)– Perform Level 3 charging (15 kW or a 20 minute
charge) • Build a PHEV mule to allow testing of various batteries
and charging profiles– Possibly Tahoe two-mode PHEV– Test large format lithium batteries– Advanced lead acid batteries (400,000 cycles in lab)– Other battery chemistries, construction designs
• At battery EoL, determine battery life-cycle costs

19
PHEV Field Testing and Demonstration Studies

20
Field Testing & Demonstration Objectives• Independent testing of PHEVs in track, laboratory and
onroad environments• Demonstrate vehicles in regionally diverse fleets• Collect onboard vehicle operations data• Collect gasoline and electricity consumption • Collect vehicle maintenance costs• Document human influences on fuel use and refueling
patterns • Document requirements and costs of charging and
operating PHEVs in real-world environments• Determine real-world PHEV life-cycle costs

21
• Initial track testing conducted by ETA near Phoenix– Testing includes coastdown (determination of
dynamometer coefficients), acceleration, top speed, charging, & durability
• Five day dynamometer testing regime performed at Argonne– Testing includes at least 26 drive cycle tests– Charge depleting & sustaining test cycles– UDDS, HWFEDs & US06 cycles– Includes air conditioning (AC) off & on cycles
Baseline Performance Testing

22
• If vehicle option, conduct Rechargeable Energy Storage System (RESS) only testing with & without the air conditioning: – Day 1, RESS Only mode – A/C off
• UDDS, UDDS, HWFEDS, HWFEDS• UDDS, UDDS, HWFEDS, HWFEDS• Repeat as able, than charge traction battery
– Day 2, RESS Only mode – A/C on • UDDS, UDDS, HWFEDS, HWFEDS• UDDS, UDDS, HWFEDS, HWFEDS• Repeat as able
Baseline Performance Testing – cont’d

23
Baseline Performance Testing Results

24
EnergyCS Prius – UDDS Fuel Use• 9 kWh Valence lithium pack – A/C kWh
EnergyCS PHEV Prius MPG & kWh - UDDS Testing
0
1020
30
4050
60
7080
90
100110
120
130140
150
160170
180
7 15 22 30 37 45 52 60 67 75 82 90 97 105 112 120 127 135 142 150
Each Bar = 1 UDDS Test Cycle. Labeled by Cumulative Miles
MPG
0
0.51
1.5
22.5
3
3.54
4.5
55.5
6
6.57
7.5
88.5
9
kWh
Drive Cycle MPG Cumulative AC kWh Cumulative MPG

25
EnergyCS Prius – HWFET Fuel Use• 9 kWh Valence lithium pack – A/C kWh
EnergyCS PHEV Prius MPG & kWh - HWFET Testing
0
1020
3040
50
6070
8090
100
110120
130
140150
160170
180
10 21 31 41 51 62 72 82 92 103 113 123 133 144 154
Each Bar = 1 HWFET Test Cycle. Labeled by Cumulative Miles
MP
G
0
0.51
1.52
2.5
33.5
44.5
5
5.56
6.5
77.5
88.5
9
kWh
Drive Cycle MPG Cumulative AC kWh Cumulative MPG
26
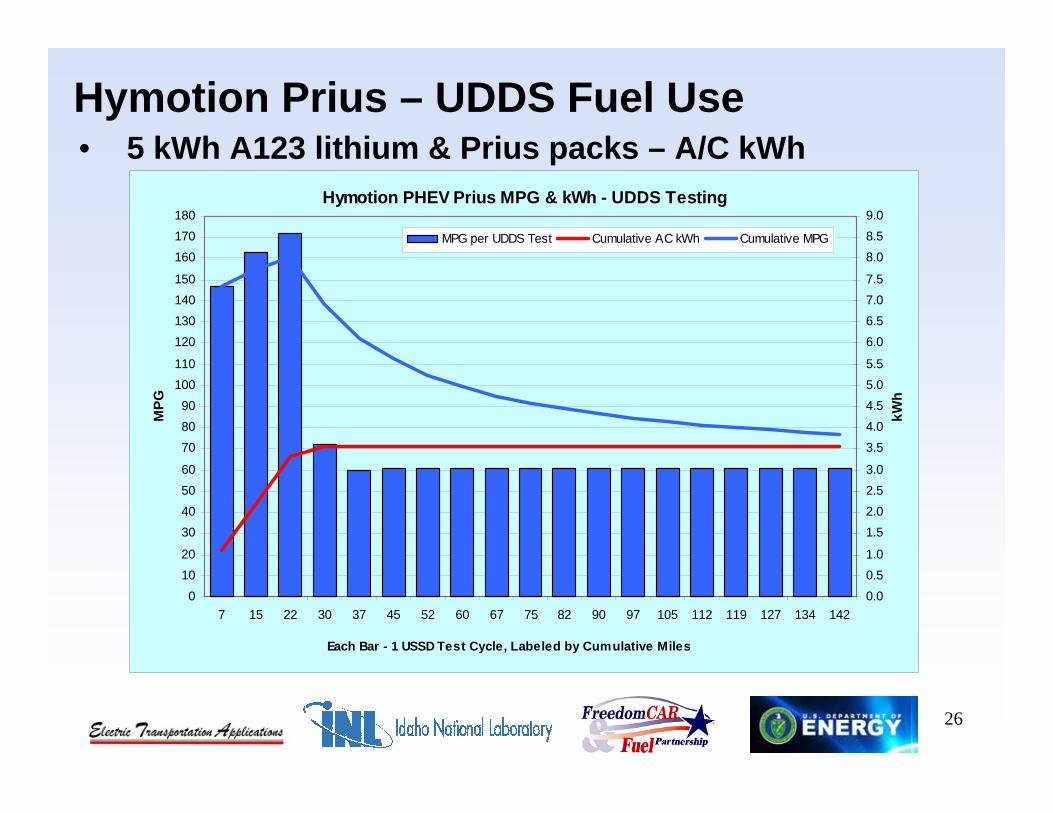
Hymotion Prius – UDDS Fuel Use• 5 kWh A123 lithium & Prius packs – A/C kWh
Hymotion PHEV Prius MPG & kWh - UDDS Testing
01020
30405060
708090
100110
120130140150
160170180
7 15 22 30 37 45 52 60 67 75 82 90 97 105 112 119 127 134 142
MPG
0.00.51.0
1.52.02.53.0
3.54.04.55.05.5
6.06.57.07.5
8.08.59.0
Each Bar - 1 USSD Test Cycle, Labeled by Cumulative Miles
kWh
MPG per UDDS Test Cumulative AC kWh Cumulative MPG

27
Hymotion Prius – HWFET Fuel Use• 5 kWh A123 lithium & Prius packs – A/C kWh
Hymotion PHEV Prius MPG & kWh - HWFET Testing
0102030405060708090
100110120130140150160170180
10 21 31 41 51 62 72 82 92 103 113 123 133 144 154
MPG
0.00.51.01.52.02.53.03.54.04.55.05.56.06.57.07.58.08.59.0
Each Bar - 1 HWFET Test Cycle, Labeled by Cumulative Miles
kWh
MPG per FWHET Test Cumulative MPG Cumulative AC kWh

28
EnergyCS Prius – Fuel CostsEnergyCS PHEV Prius UDDS & HWFET Fuel Cost per Mile
$0.000
$0.005
$0.010
$0.015
$0.020
$0.025
$0.030
$0.035
$0.040
$0.045
$0.050
$0.055
$0.060
1 2 3 4 5 6 7 8 9 10 11 12 13 14 15 16 17 18 19 20
Each Data Pioint Labeled by HWFET and UDDS Tests, uneven miles. Gas $3.25 gallon & kWh $0.10
Fuel
Cos
t per
Mile
ECS UDDS $ per Mile Gas
ECS UDDS $ per Mile kWh
ECS HWY $ per Mile Gas
ECS HWY $ per Mile kWh
ECS UDDS Combined $$ PER MILE
ECS HWY Combined $$ PER MILE

29
Hymotion Prius – Fuel CostsHymotion PHEV Prius UDDS & FWHET Fuel Cost per Mile
$0.000
$0.005
$0.010
$0.015
$0.020
$0.025
$0.030
$0.035
$0.040
$0.045
$0.050
$0.055
$0.060
1 2 3 4 5 6 7 8 9 10 11 12 13 14 15 16 17 18 19 20
Each Data Pioint Labeled by HWFET and UDDS Tests, uneven miles. Gas $3.25 gallon & kWh $0.10
Fuel
Cos
t per
Mile
HYM UDDS $ per Mile Gas
HYM UDDS $ per Mile kWh
HYM HWY $ per Mile Gas
HYM HWY $ per Mile kWh
HYM UDDS Combined $$ PER MILE
HYM HWY Combined $$ PER MILE

30
• Uses dedicated drivers• Predetermined and repeatable drive cycles• Combinations of urban and highway loops• 5,440 total onroad test miles per PHEV model• 162 drive and charging cycles that include 1,344 hours
of charging - can not economically be performed on a dynamometer
• Not as controlled as dynamometer, but compliments controlled dynamometer testing by allowing a broader view of fuel use over many more miles and charging events
• Gives PHEV conversions extended opportunity to fail before being placed into fleets
Accelerated Onroad Testing

31
PHEV Accelerated Testing
188.357%43%Average5,4401621,3443,1002,340Total
11%2%60031218220011%4%6006128210012%5%640812628011%6%6001012426011%9%6001512404011%9%6001512224011%9%6001512044011%19%600308112011%37%6006040110(%)(%)(mi)(N)(hr)(10 mi)(10 mi)(mi)
MilesRepsTotalRepsChargeHighwayUrbanCycle
• Accelerated testing in Phoenix over 5,440 miles• GPS units track distance, average & maximum speeds
32
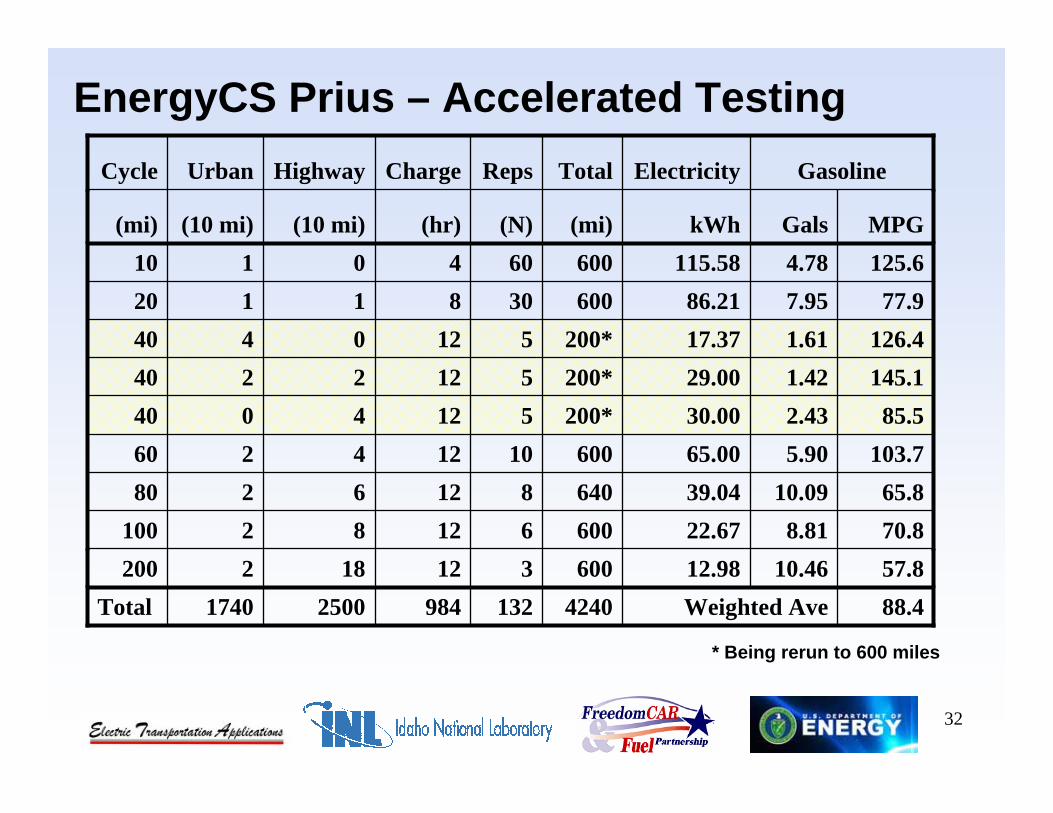
EnergyCS Prius – Accelerated Testing
125.64.78115.586006040110
88.4 Weighted Ave424013298425001740Total57.810.4612.9860031218220070.88.8122.676006128210065.810.0939.046408126280
103.75.9065.006001012426085.52.4330.00200*5124040
145.11.4229.00200*5122240126.41.6117.37200*512044077.9 7.95 86.216003081120
MPGGalskWh(mi)(N)(hr)(10 mi)(10 mi)(mi)
GasolineElectricityTotalRepsChargeHighwayUrbanCycle
* Being rerun to 600 miles

33
EnergyCS Prius – Accelerated TestingAverage & Maximum Speed for EnergyCS Accelerated Testing
0 5 10 15 20 25 30 35 40 45 50 55 60 65 70 75 80 85 90
10 mi. 1U
20 mi. 1U 1H
40 mi. 4U
40 mi. 2U 2H
40 mi. 4H
60 mi. 2U 4H
80 mi. 2U 6H
100 mi. 2U 8H
200 mi. 2U 18H
Miles per Hour
Maximum Speed Average Speed
U = 10. urban loop, H = 10 mi. highw ay loop
34
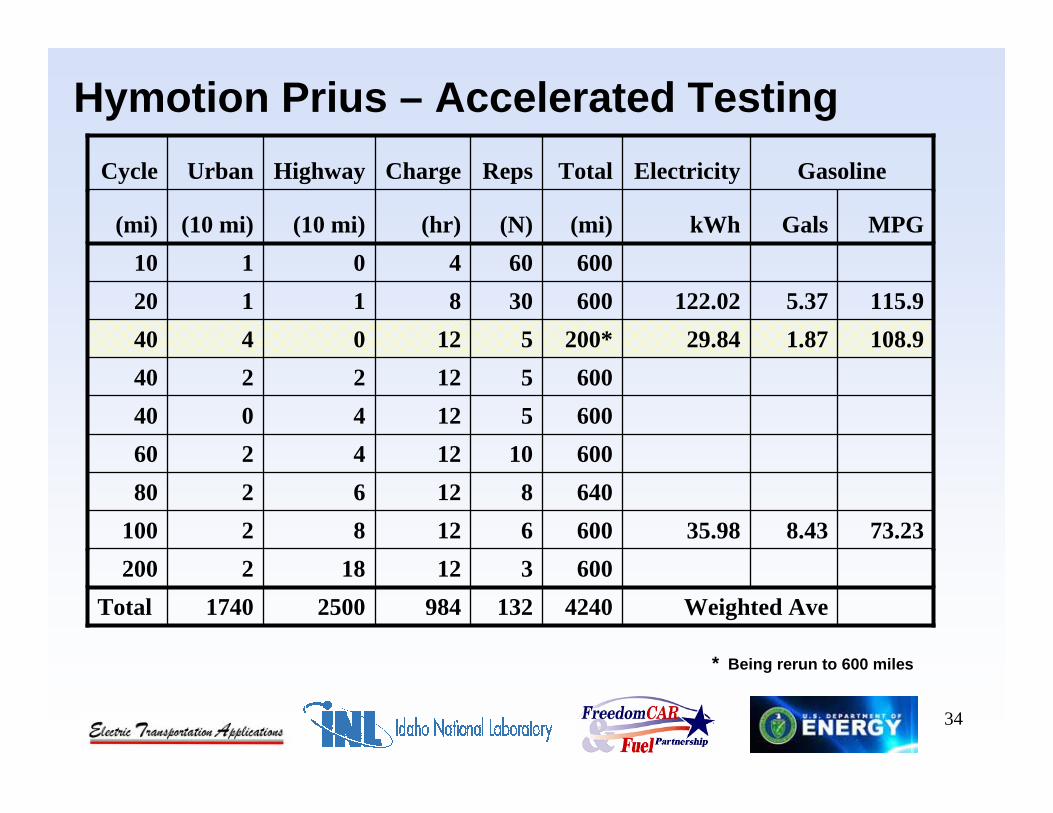
Hymotion Prius – Accelerated Testing
Weighted Ave424013298425001740Total600312182200
73.238.4335.986006128210064081262806001012426060051240406005122240
108.91.8729.84200*5120440115.9 5.37122.026003081120
6006040110MPGGalskWh(mi)(N)(hr)(10 mi)(10 mi)(mi)
GasolineElectricityTotalRepsChargeHighwayUrbanCycle
* Being rerun to 600 miles

35
Combined ECS & Hymotion Fuel CostsFuel Cost per Mile - Hymotion, EnergyCS (UDDS & HWFET) & Other Vehicles
$0.03
$0.04
$0.05
$0.06
$0.07
$0.08
$0.09
$0.10
$0.11
$0.12
$0.13
$0.14
$0.15
$0.16
$0.17
1 2 3 4 5 6 7 8 9 10 11 12 13 14 15 16 17 18 19 20
Each Data Point Labeled by HWFET and UDDS Tests, Uneven Miles. Gas $3.25 gallon & kWh - $0.10
Fuel
Cos
t per
Mile
ECS UDDS Combined $$ PER MILE
ECS HWY Combined $$ PER MILE
HYM UDDS Combined $$ PER MILE
HYM HWY Combined $$ PER MILE
PHEV Prius 45 MPG
ICE Gas 30 MPG
ICE Gas 20 MPG
ECS Prius Accelerated Testing

36
Kangoo – Test Results
40.90.042Battery & Gas Hot HWFET
0.48160 Battery Only 10-mile Accelerated Cycles
0.271Battery Only @ Constant 45 mpg
0.110
0.144
0.155
0.268
A/C kWh per Mile
39.4Battery & Gas Hot UDDS
42.3Battery & Gas Cold UDDS
Battery Only - HWFET
Battery Only - UDDS
Miles per GallonTest Cycle
• Renault Kangoo – Series hybrid with 9.6 kWh (usable) NiCad pack & 650cc gasoline engine

37
Hymotion• Data loggers installed on most of 50 PHEVs in 25 North
America locations, with plans to actively collect data on 100 vehicles during 2008
• New battery version available in 1st quarter 2008, is in crash testing and will have SULEV certification
• Testing will include charging and driving profiles as well as charging infrastructure analysis
• The AVTA signed agreement with Hymotion and is initiating Hymotion fleet testing support by:– On a monthly basis, collecting data from fleets via
an ftp site or regular mail– Performing DOE, operating fleet, and Hymotion
required data reduction, and analysis– Reporting testing results monthly

38
EnergyCS• The AVTA and EnergyCS have signed and initiated a
data collection, dissemination and reporting agreement• EnergyCS has provided historical PHEV operations
onboard data for 7 vehicles operating in fleets in Canada, Arizona, and California
• Data collection methods being modified to allow the AVTA to collect fleet operators data directly and to handle all aspects of PHEV onboard data collection

39
EnergyCS Onboard DataEnergyCS Prius - 678 Miles of Several Drives and Charging Events
0
500
1000
1500
2000
2500
3000
3500
4000
4500
5000
1 836 1671 2506 3341 4176 5011 5846 6681 7516 8351 9186 10021 10856 11691 12526 13361 14196 15031 15866 16701 17536
RPM
, Ah
In a
nd A
h O
out
0
50
100
150
200
250
300
350
400
450
500
Volta
ge a
nd S
peed
(mph
)
RPM Ahi Aho Speed Voltage

40
NYSERDA• The AVTA is testing all 6 (probably 5) of the New York
State Energy Research and Development Agency’s PHEV conversions. Models and test statuses:
Delivered once, sent backHybridsPlus Escape
4 deliveries requiredAfter baselineStartingElectovaya Escape
After baselineStartingHymotion Escape
Not yet deliveredHymotion Civic
ongoingCompletedHymotion Prius
Near completionCompletedEnergyCS Prius
Delivery StatusAccelerated TestingBaseline TestingModel
41
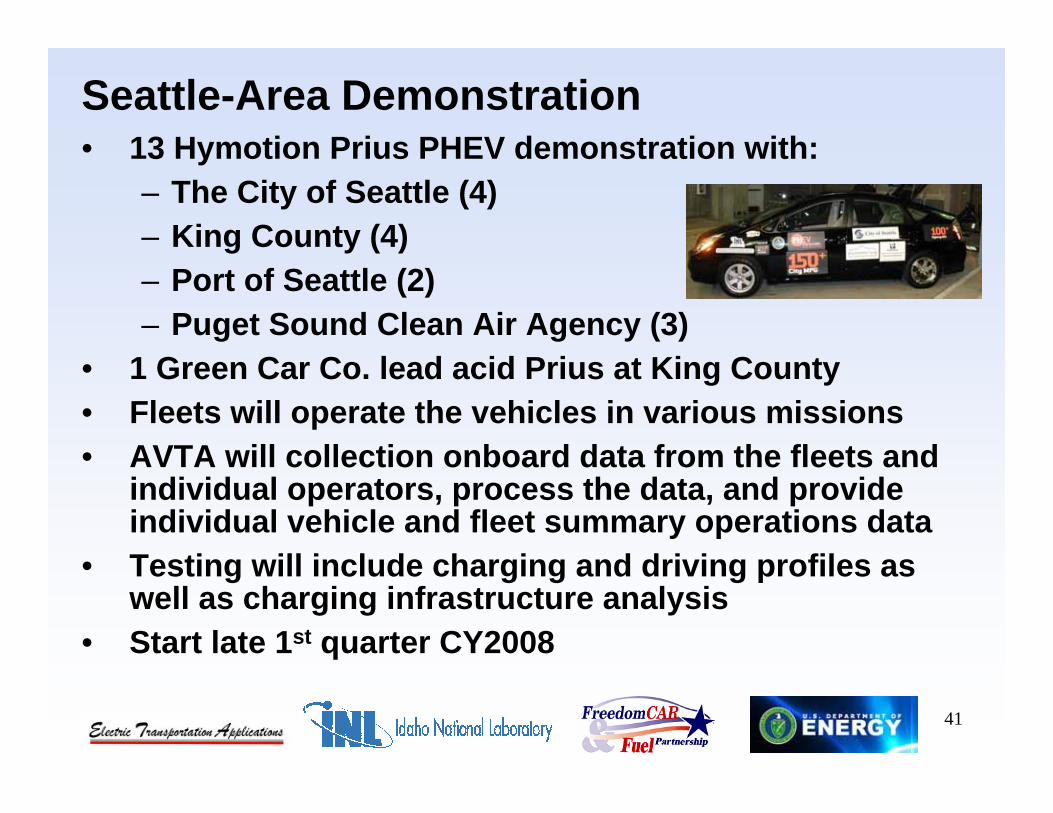
Seattle-Area Demonstration• 13 Hymotion Prius PHEV demonstration with:
– The City of Seattle (4)– King County (4)– Port of Seattle (2)– Puget Sound Clean Air Agency (3)
• 1 Green Car Co. lead acid Prius at King County• Fleets will operate the vehicles in various missions• AVTA will collection onboard data from the fleets and
individual operators, process the data, and provide individual vehicle and fleet summary operations data
• Testing will include charging and driving profiles as well as charging infrastructure analysis
• Start late 1st quarter CY2008

42
City of Tacoma• The City of Tacoma has obtained 1 lead acid battery
Prius PHEV from the Green Car Company with 1 more on order, and 1 Hymotion Prius is on order
• Tacoma and the AVTA to conduct cooperative testing of vehicles and charging infrastructure– Tacoma is following the NEC for PHEV charging– Each branch circuit is metered
• Lead acid PHEVs are supposed to be the first PHEVs deployed with an all-electric range of 10 to 15 miles
• Testing will include charging and driving profiles as well as charging infrastructure analysis
• Considering swapping PHEV for lead acid PHEV baseline performance testing
• Started 4th quarter CY2007
43
National Rural Electric Cooperative Association (NRECA) • Developing PHEV data collection effort between the
AVTA and the NRECA• Total of 7 Prius and Escape PHEVs from Hymotion,
EnergyCS, and HybridsPlus will be operated by rural electric coop utilities in Florida, Georgia, Indiana, Minnesota, North Carolina, Oregon, and South Carolina
• The AVTA will collection and process onboard data from the fleets, and provide individual vehicle and fleet operations data
• Testing will include charging and driving profiles as well as charging infrastructure analysis

44
Southern California Edison (SCE) • The Idaho National Lab (INL) and SCE have jointly
conducted vehicle testing for 20+ years• INL and SCE have been negotiating PHEV cooperative
testing, as the AVTA was invited by SCE to partner in the Ford/SCE Escape PHEV demonstration
• Twenty Ford PHEV Escapes planned for demonstration, with first one starting very late 2007
• Testing will include charging and driving profiles as well as charging infrastructure analysis, as SCE has significant interest in PHEVs providing at-home backup power
• AVTA will obtain a SCE Escape for baseline performance testing

45
International Truck Cooperative Testing• Conduct baseline performance testing of 40-foot PHEV
school bus from International Truck with lithium pack• Perform coastdown and dynamometer testing • No specific PHEV bus testing protocol exists. Likely
use either or both the Manhattan driving cycle or the Orange County cycle
• With PHEV option on, 1st day of testing will include:– Cold start in charge deleting mode– Followed by hot starts in charge depleting modes– Followed by at least 2 hot starts in charge
sustaining modes• In diesel engine only mode, 2nd day of testing will
include 1 cold start, followed by several hot starts• Three dynamometer testing facilities being considered

46
Accessory Load Study for PHEV Modelers• Prius and Escape HEV accessory load testing to
provide exact power levels to PHEV modelers• Power steering with no steering input and at lock stop• Air conditioning at full compressor load and defrost
compressor load• DC/DC converter
– All optional accessories off at idle with engine running (initial condition)
– Initial condition plus maximum blower speed– Initial condition plus all optional accessory loads– Initial condition plus power window operation– Initial condition plus service brake operation
• Engine start

47
Data Logger Testing• Document data logger selections in order to respond to
“inquires”– Use Hymotion’s Kvaser Memorator data logger on
Hymotion ~50 Prius PHEVs – Use EnergyCS logger on seven EnergyCS PHEVs– Testing V2Green cellular data logger on an
EnergyCS Prius. Will likely use on at least some of the PHEVs in the Tacoma and Seattle fleets, and possibly other remote locations
– Supported ARDAQ testing– Have used HEM Data’s Drewtech Cardeq on HEVs,
may use on PHEVs with no integrated sensors• Ideally use a single data logger

48
AcknowledgementThis work is supported by DOE’s
FreedomCAR and Vehicle Technologies ProgramVehicle Systems Team Leader, Tien Duong
AVTA DOE Lead, Lee Slezak
http://avt.inl.gov or
http://www1.eere.energy.gov/vehiclesandfuels/avta/
Additional Information
INL/CON-07-13005