u.s. department of energy 2007 solar america showcase … · city of san jose, california story...
TRANSCRIPT

F ina l Repor t
U.S. Department of Energy
2007 Solar America Showcase
City of San Jose, California Story Road Landfill
Solar Site Evaluation
San Jose, California
Prepared for
U.S. Department of Energy
December 2008


BAO\080250002 iii
U.S. Department of Energy 2007 Solar America Showcase
City of San Jose, California Story Road Landfill Solar Site Evaluation
December 2008
This document was prepared under the direction of:
Doug Landfear, P.E. Project Engineer
This document was reviewed and approved by:
John Hoffner, P.E. Senior Project Manager
This document was reviewed by:
Vipin Gupta Tiger Team Lead


BAO\080250002 v
Contents
Section Page
Acronyms and Abbreviations ......................................................................................................vii
1.0 Introduction ......................................................................................................................... 1-1 1.1 Sites.............................................................................................................................. 1-1 1.2 Purpose and Scope .................................................................................................... 1-1
2.0 Solar Site Evaluation .......................................................................................................... 2-1 2.1 Site Description and Operations.............................................................................. 2-1 2.2 Current Electrical Usage........................................................................................... 2-2 2.3 Site Orientation and Shading Analysis................................................................... 2-2 2.4 Appropriate Solar Technology ................................................................................ 2-4
2.4.1 Solar Photovoltaics.......................................................................................... 2-4 2.4.2 Concentrator Solar Photovoltaic Systems.................................................... 2-8 2.4.3 Concentrating Solar Power .......................................................................... 2-10 2.4.4 Micro-CSP Systems ....................................................................................... 2-12
2.5 Conceptual PV System Layout .............................................................................. 2-13 2.6 Electrical Interconnection ....................................................................................... 2-15 2.7 Estimated Cost ......................................................................................................... 2-17 2.8 Estimated Electrical Production and Energy Cost Savings ............................... 2-19 2.9 Financing Options ................................................................................................... 2-21
2.9.1 Public Sector Solar Projects .......................................................................... 2-21
3.0 Findings ................................................................................................................................ 3-1
4.0 References............................................................................................................................. 4-1

CONTENTS
vi BAO\080250002
Tables Table 1 Comparison of Fixed-tilt vs. Tracking PV systems in San Jose, California Table 2 Estimated Number of Modules and Approximate System Capacity - PV Table 3 Approximate System Capacity – CPV and Micro-CSP Table 4 Estimated Power Output and Capital Costs for Various Solar Technologies Table 5 Estimated Power Output and First Year Savings for Conceptual Solar
Systems
Figures Figure 1 Aerial Photograph of Story Road Landfill Figure 2 View From the Top of Story Road Landfill Figure 3 View of the Hill Slope at Story Road Landfill Figure 4 Solar “Sunflower” Figure 5 Single-axis tracking solar array (14.2 MW) at Nellis Air Force Base in Nevada Figure 6 Side view of single-axis tracker at 20° tilt Figure 7 Single axis tracking system (1 MW) installed at the Semitropic Water Storage
District in California Figure 8 Conceptual CPV system by GreenVolts Figure 9 SolFocus CPV system on a Pole Mount Figure 10 Direct Normal Insolation Map of the U.S. Southwest Figure 11 Parabolic Trough Receivers Figure 12 Parabolic Trough CSP Plant Figure 13 Sopogy Micro-CSP Conceptual System Figure 14 Technical data for Sopogy Micro-CSP system Figure 15 Available land areas suitable for solar energy at the San Jose/Story Road
Landfill Figure 16 Electricity meter for the Site Figure 17 Overhead electrical lines Figure 18 Electrical meter location at Story Road Landfill Figure 19 Commercial-scale 500 kW PV Inverter
Appendices Appendix A Solar Area Analysis Appendix B Concentrated Solar Power Prospects of California

BAO\080250002 vii
Acronyms and Abbreviations
BOS balance of system
City City of San Jose, California
CPV concentrator photovoltaic
CSP concentrating solar power
DC direct current
DNI direct normal insolation
DOE United States Department of Energy
EPW Energy Plus Weather
kW kilowatt
kWh kilowatt-hour
kWh/m2/day kilowatt-hour per square meter per day
kWh/yr kilowatt-hours per year
MW megawatt
MWe megawatt electric
NREL National Renewable Energy Laboratory
O&M operations and maintenance
PG&E Pacific Gas and Electric Company
PPA power purchase agreement
PV photovoltaic
SAM Solar Advisor Model

BAO\080250002 1-1
1.0 Introduction
This report describes the findings of a solar site evaluation conducted at the Story Road Landfill (Site) in the City of San Jose, California (City). This evaluation was conducted as part of a larger study to assess solar potential at multiple public facilities within the City. The U.S. Department of Energy (DOE) Tiger Team, including staff from CH2M HILL, Sandia National Labs, and New Mexico State University, conducted the evaluations in partnership with, and on behalf of, the DOE as part of the Solar America Initiative, a multi-year program aimed at accelerating demand and development of solar technologies among key end-use market sectors. Through the Solar America Showcase, DOE provides technical assistance to large-scale (in excess of 100 kilowatt [kW]), high-visibility solar installation projects that have the ability to impact the market for solar technologies through large project size, use of a novel solar technology, and/or use of a novel application for a solar technology. The City of San Jose was one of three locations awarded a Solar America Showcase award in May 2007.
1.1 Sites
Based on a list provided by the City of San Jose and in the Technical Assistance Statement of Work, the following sites were evaluated as part of this study:
• City of San Jose 4th Street Parking Garage
• Children’s Discovery Museum
• HP Pavilion at San Jose
• San Jose Convention Center
• Story Road Landfill
• Las Plumas EcoPark
• Central Service Yard
• San Jose/Santa Clara Water Pollution Control Plant
The Tiger Team conducted the site evaluations on April 1-3, 2008.
1.2 Purpose and Scope
The purpose of the study was to evaluate the potential and cost-benefits for placing solar technologies on multiple public facilities within the City. The scope of the study was to provide the City with the following:
1) Determination of appropriate solar technology and size at each facility
2) Conceptual layout of a solar system for each facility

1.0 INTRODUCTION
1-2 BAO\080250002
3) Estimated system cost
4) Electricity production potential and annual energy savings estimate for each facility
5) A simplified financial analysis for the highest-priority facilities.
As part of the study, the San Jose Showcase Tiger Team reviewed available data for each facility including current electrical usage, utility rate structure, site operations, and site drawings. During the site evaluations, the Tiger Team conducted an assessment of site conditions and collected relevant site data including facility orientation, roof type, potential shading, and location/availability of potential electrical interconnections.
For this analysis, the Tiger Team used publicly-available solar resource data, solar screening tools, and vendor-supplied information to assess the potential for installing a PV and/or a concentrating solar thermal electric system at the site. The solar resource data were downloaded from the National Renewable Energy Laboratory (NREL) website (www.nrel.gov) and are based on actual solar measurements and modeled values incorporating cloud cover data and satellite imagery. The Tiger Team used the PVWATTs and/or the Solar Advisor Model (SAM) screening tools (also available from the NREL website) to estimate annual energy production from the solar electric system. It is important to note that PVWatts and SAM are first-order screening tools that provide estimates of the potential peak output and energy production from a solar electric system at a particular location. The model uses the generalized capacity of the solar electric system and does not take into account design considerations such as the layout of series and parallel array strings. Further refinement of the proposed solar electric system would involve engineering design to size wiring and fuses, and determine the actual strings of modules required to create the proper input voltages and currents to the inverter. The detailed design will take into account local, state, and federal building and electric codes and will ensure that proper safety protocols are followed for interconnecting with the electric utility grid. Detailed design is beyond the scope of the current assessment.
The following sections present the findings of this study for the Story Road Landfill. Section 2 presents a brief analysis of the key data for the site along with a conceptual layout, size, and specification for a potential solar system at the site. Section 3 presents the conclusions and findings from this study. Section 4 presents the references used during this study.

BAO\080250002 2-1
2.0 Solar Site Evaluation
This section presents the key information used to develop the solar evaluation for the Site. The following data is presented:
• Site description and operations
• Current electrical usage and utility rate structure
• Site orientation and shading analysis
• Conceptual solar system layout
• Appropriate solar technology
• Potential electrical interconnection points
• Estimated cost
• Estimated electrical production and annual energy cost savings
Where appropriate, additional site-specific information collected during the site visit is also presented below.
2.1 Site Description and Operations
The Site is located on Story Road in close proximity to US Highway 101 and Highway 280, less than 2 miles east of downtown San Jose. The Site is a landfill, owned and operated by the city. The landfill is no longer an active disposal site, and available land at the facility could potentially be used for a solar energy plant. Figure 1 presents an aerial photograph of the Site.

2.0 SOLAR SITE EVALUATION
2-2 BAO\080250002
Figure 1 – Aerial Photograph of Story Road Landfill
2.2 Current Electrical Usage
The Site has one electrical meter. The current electrical demand at the facility is very small, and appears to be related to operation of a groundwater remediation system. It is likely that a small solar electric system could be installed to completely offset this load.
Given the large amount of available land, it may be possible to utilize the Site for a solar energy installation that would produce more electricity than the current demand. The excess electricity could be transferred to the grid for sale to the utility at wholesale rates. However, since wholesale electricity rates are significantly lower than retail rates, this option would likely not be financially viable.
Alternatively, excess electricity could be applied to other City facilities through net aggregate metering. In October 2008, California Governor Arnold Schwarzenegger signed Assembly Bill (AB) 2466 which permits local government agencies to generate excess renewable energy at one facility and receive an electricity bill credit towards the consumption of energy at another site. AB 2466 provides an incentive for local agencies with multiple facilities to generate renewable energy that equals the total electricity demand at all of its facilities. This legislation will allow the City of San Jose to benefit from the excess electricity produced at City facilities, and may provide an incentive to construct relatively large solar energy plants up to 1 megawatt (MW) per site at locations with available land area (such as Story Road Landfill) so that excess electricity can be used to meet City-wide goals for renewable energy production.
2.3 Site Orientation and Shading Analysis
The Site is located at 37° 19’ 40.06” North latitude and 121° 51’ 39.54” West longitude. The Site is largely vacant and the land is well-suited for fixed, south-facing solar arrays or single- or double-axis tracking systems. There are no large buildings or other natural features shading any of the major potential solar areas. Figures 2 and 3 present two views of the site.

2.0 SOLAR SITE EVALUATION
BAO\080250002 2-3
Figure 2 – View from the top of Story Road Landfill
Figure 3 - View of the hill slope at Story Road Landfill
The back side of the solar panels would likely be visible to motorists on Highway 280. This aesthetic factor should be considered when designing a solar energy system for the site. At least two different approaches can be taken. Either the land directly adjacent to the highway could be used as a public art corridor to conceal the view of the back side of the solar panels, or the back side of the solar plant could be made as invisible or non-descriptive as possible to avoid diverting the attention of motorists and slowing down traffic. Creation of visual renderings of the solar plant using the view fields of eastbound and westbound motorists would be a useful tool for developing the conceptual plant design.

2.0 SOLAR SITE EVALUATION
2-4 BAO\080250002
2.4 Appropriate Solar Technology
There are several solar technologies that could potentially be used at the Site, including photovoltaics (PV), concentrator photovoltaics (CPV), concentrating solar power (CSP) plants, or micro-CSP systems. However, in some areas there are natural features of the land such as slopes, waterways, and vegetation that could affect the choice of technology and the design and installation of a renewable energy system. In general, a ground slope of less than 3% is desirable for solar power plants, and therefore some areas of the Site would likely have to be cleared and graded as part of project development. A comprehensive geotechnical survey would also be required prior to development at the facility to ensure that the landfill cover is suitable for plant construction.
2.4.1 Solar Photovoltaics
Solar PV technologies include high-efficiency (13%-18%) monocrystalline solar cells, average efficiency (7%-14%) monocrystalline or multicrystalline solar cells, and lower-efficiency (4%-10%) thin-film solar cells. High-efficiency solar cells are typically used in areas that are space-constrained. Average-efficiency crystalline and thin-film solar cells are typically used where cost rather than space is the driving factor. Because thin-film solar cells are generally half as efficient as crystalline silicon solar cells, solar systems based on thin-film solar modules typically require about twice as much area to supply a given amount of power as solar systems based on crystalline silicon solar modules. Given the large amount of land available at the Site, however, lower-cost, lower-efficiency thin-film PV modules may be suitable.
Given the available land area, the City could install a large ground-mounted PV system at the site. Ground-mount technologies include pole-mounted systems and ballasted systems. Pole mounts use a heavy-gauge steel pipe that is driven deep into the ground and cemented in place. Ballasted systems use heavy concrete ballasts to support and anchor a steel rack frame, and utilize the weight of the ballast to resist wind and seismic forces. There are no penetrations required for ballasted systems, and as such ballasted systems are typically cheaper than pole-mounted systems. A geotechnical and structural analysis would be required to determine the most appropriate mounting system for the Site.
Given that a significant amount of acreage on the site consists of steep hill slopes, a solar installation suitable to this terrain might be considered here. One such solar technology on the market is a pole-mounted “sunflower”. Figure 4 presents a photograph of multiple sunflowers installed at Applied Material’s Austin, Texas campus. The sunflower design incorporates 16 solar modules with an aluminum (non-PV) center. The solar modules are fixed at a set tilt and do not track the sun.

2.0 SOLAR SITE EVALUATION
BAO\080250002 2-5
Figure 4 - Solar “Sunflower”
Single-axis tracking systems increase the annual energy production of a solar electric system compared to fixed-tilt systems. As a general rule, single-axis tracking systems increase annual output by 20% to 29% compared to fixed-tilt systems, depending on location. There are several packaged, single axis tracking systems available from various U.S. and foreign manufacturers. One example is the T20 single-axis tracking system manufactured by SunPower Corporation. Figure 5 shows a PV system at Nellis Air Force Base in Nevada which utilizes the T20 tracking system. Each array is mounted on a concrete ballast and a single motor controls the movement of multiple panels. Figure 6 shows a side view of a T20 single-axis tracker at a 20° tilt. One advantage of the T20 system is that it is tilted up from horizontal, which further increases annual energy production. Most single-axis tracking systems rotate around an axis that is horizontal (or at a 0º tilt). Figure 7 shows an example of this type of tracking system at the Semitropic Water Storage District in Wasco, California. The electricity from this 1 MW system is used to run the water facility. One motor drive typically rotates several of the long rows of solar modules that are orientated in a north-south axis. The rows track the sun from east to west on a daily basis.

2.0 SOLAR SITE EVALUATION
2-6 BAO\080250002
Figure 5 - Single-axis tracking solar array (14.2 MW) at Nellis Air Force Base in Nevada
Figure 6 - Side view of single-axis tracker at 20° tilt
2.0 SOLAR SITE EVALUATION
BAO\080250002 2-7
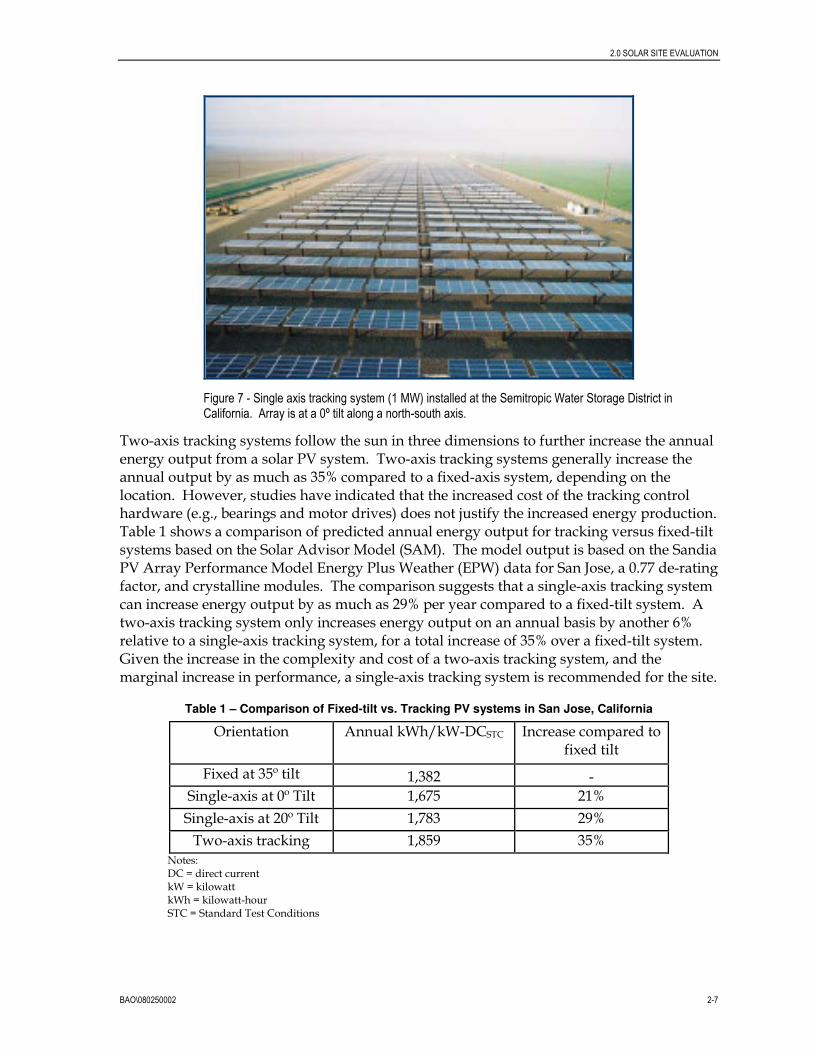
Figure 7 - Single axis tracking system (1 MW) installed at the Semitropic Water Storage District in California. Array is at a 0º tilt along a north-south axis.
Two-axis tracking systems follow the sun in three dimensions to further increase the annual energy output from a solar PV system. Two-axis tracking systems generally increase the annual output by as much as 35% compared to a fixed-axis system, depending on the location. However, studies have indicated that the increased cost of the tracking control hardware (e.g., bearings and motor drives) does not justify the increased energy production. Table 1 shows a comparison of predicted annual energy output for tracking versus fixed-tilt systems based on the Solar Advisor Model (SAM). The model output is based on the Sandia PV Array Performance Model Energy Plus Weather (EPW) data for San Jose, a 0.77 de-rating factor, and crystalline modules. The comparison suggests that a single-axis tracking system can increase energy output by as much as 29% per year compared to a fixed-tilt system. A two-axis tracking system only increases energy output on an annual basis by another 6% relative to a single-axis tracking system, for a total increase of 35% over a fixed-tilt system. Given the increase in the complexity and cost of a two-axis tracking system, and the marginal increase in performance, a single-axis tracking system is recommended for the site.
Table 1 – Comparison of Fixed-tilt vs. Tracking PV systems in San Jose, California
Orientation Annual kWh/kW-DCSTC Increase compared to fixed tilt
Fixed at 35º tilt 1,382 -
Single-axis at 0º Tilt 1,675 21%
Single-axis at 20º Tilt 1,783 29%
Two-axis tracking 1,859 35% Notes: DC = direct current kW = kilowatt kWh = kilowatt-hour STC = Standard Test Conditions

2.0 SOLAR SITE EVALUATION
2-8 BAO\080250002
2.4.2 Concentrator Solar Photovoltaic Systems
A number of manufacturers are developing concentrator photovoltaic (CPV) systems. These systems utilize a number of different technologies to focus sunlight onto high-efficiency PV cells. CPV systems utilizing Fresnel lenses, mirrors, troughs, or a combination of lenses and tubes have been developed.
Two different types of CPV systems are being developed by local companies GreenVolts and SolFocus. The GreenVolts system utilizes mirrors to concentrate the sunlight on high-efficiency PV cells (Figure 8). The cells are cooled passively, thus water requirements are minimized. The GreenVolts system is ballasted and does not require ground penetrations. The SolFocus system, as shown in Figure 9, focuses light using innovative mirrors and optics on a pole-mounted, two-axis tracking system. The high concentration ratio (500 to 1) optics focus the light on high efficiency (30-40%), multi-junction PV cells.
Figure 8 – Conceptual CPV system by GreenVolts

2.0 SOLAR SITE EVALUATION
BAO\080250002 2-9
Figure 9 - SolFocus CPV system on a pole mount
The direct normal insolation (DNI) at a site is a critical parameter for plant design and project economics. While flat-plate PV systems can take advantage of diffuse or indirect light, concentrating solar systems (both thermal and PV) require DNI to operate. Only direct radiation can be focused on a target; diffuse, indirect, and scattered light cannot be focused using concentrating lenses. Concentrating solar systems are typically designed to track the sun to maximize exposure to DNI. Because concentrating systems typically cost more than regular PV systems, they are best suited for areas of the country with high levels of DNI, such as the U.S. Southwest. Figure 10 shows the DNI map for the Southwest; regions of red and dark red are considered to be suitable locations for concentrated solar power development.

2.0 SOLAR SITE EVALUATION
2-10 BAO\080250002
Figure 10 - Direct Normal Insolation Map of the U.S. Southwest
Based on discussions with concentrating solar power experts at NREL, project developers typically look for an average DNI of greater than 6.75 kilowatt-hours per square meter per day (kWh/m2/day) when selecting sites for concentrating solar development. The average DNI for San Jose is 5.34 kWh/m2/day, and therefore San Jose would only be suitable if the transmission advantages of distributed wholesale electricity generation compensated for the lower DNI in this municipal area. Appendix B presents additional information about prospective concentrating solar power sites in California and the DNI level for San Jose, CA.
2.4.3 Concentrating Solar Power
Concentrating solar power (CSP) systems utilize parabolic troughs or heliostats to focus sunlight onto receivers to heat a working fluid. The thermal energy from the working fluid is then converted into electrical energy through a conventional steam turbine power block. Nine CSP plants (collectively referred to as the Solar Energy Generating System [SEGS]) with a cumulative capacity of 354 megawatts electric (MWe) were built in Southern California in the late 1980s. A 64-MWe CSP plant (Nevada Solar One) was commissioned in 2007 in Nevada. Figure 11 shows a parabolic trough receiver. Figure 12 shows rows of parabolic troughs and the conventional power block. One advantage of CSP technology is that thermal storage units can be added to the CSP plant to improve the dispatchability of the plant to meet peak utility demand loads.

2.0 SOLAR SITE EVALUATION
BAO\080250002 2-11
Figure 11 – Parabolic trough receiver
Figure 12 – Parabolic trough CSP plant
eSolar is a local technology vendor developing modular CSP systems. The eSolar concept utilizes heliostats and multiple small central receiver towers connected to a common power block to create a modular 33 MWe power system. The modular 33MWe system requires 160 acres of land. Given that the largest area at the Site is 4.5 acres, and considering the relatively small power requirements at the Site, the eSolar system would only be suitable for the site in a scaled-down form for technology demonstration.
BrightSource Energy is another local provider of CSP systems using scalable central receiver technology. BrightSource Energy has recently entered into agreements with Pacific Gas & Electric (PG&E) to supply up to 900 MWe worth of solar energy utilizing their central receiver system. As with the eSolar system, however, the BrightSource Energy system requires significant land area and high DNI levels and is not suitable for the Site in its full scaled-up form.

2.0 SOLAR SITE EVALUATION
2-12 BAO\080250002
2.4.4 Micro-CSP Systems
Micro-CSP systems are a category of CSP systems in the 250 kWe to 20 MWe range. Micro-CSP systems can be used with a smaller power block using an organic working fluid with a low temperature boiling point rather than steam. Several companies offer modular micro-CSP that can be combined to create larger (up to 100 MW) systems.
Sopogy is a micro-CSP provider targeting a market of < 20 MW size systems, and areas with a DNI level of approximately 5 kWh/m2/day, which happens to be the approximate DNI level for San Jose. Figure 13 shows a conceptual rendering of the Sopogy micro-CSP system. Figure 14 presents technical data for a Sopogy Soponova 4.0 system, including the land area required to achieve various capacity levels (Sopogy, 2008).
Figure 13 - Sopogy Micro-CSP Conceptual System
Figure 14 – Technical data for Sopogy Micro-CSP system. These calculations assume 850 W/m2 of solar radiation.
Based on information presented in Figure 14, a land area of 5.49 acres (239,170 square feet) is needed to achieve 1,000 kW or 1 MW capacity. The expected energy output is 934 kilowatt-hours (kWh) per panel per year. Sopogy estimates an annual output of approximately 1,825,036 kWh of electricity from a 1,000 kW system, assuming 850 W/m2 of solar energy supplied to 1,954 panels. Further analysis would be required to determine the likely output from a micro-CSP system installed in San Jose.
2.0 SOLAR SITE EVALUATION
BAO\080250002 2-13
Micro CSP systems could potentially be combined with thermal storage units to create a generation profile which matches grid demand. Such a system would better meet the needs of the grid and could potentially provide energy at peak times when electricity prices are the highest.
Micro CSP systems could potentially provide a reasonable renewable power solution for the Site. Further evaluation of site-specific characteristics and the expected energy production and commercial pricing would be required to develop an economic assessment of the technology. It might be possible for the City to solicit bids from project developers or vendors to install a pilot or demonstration micro-CSP system at the Site.
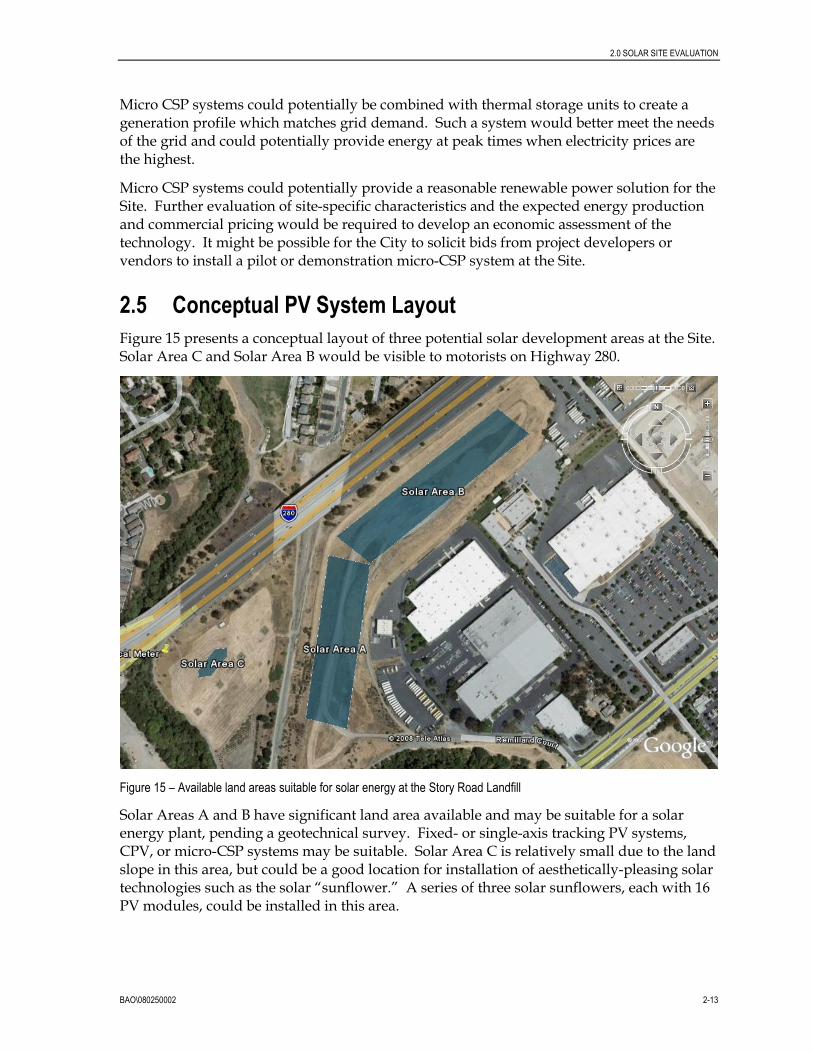
2.5 Conceptual PV System Layout
Figure 15 presents a conceptual layout of three potential solar development areas at the Site. Solar Area C and Solar Area B would be visible to motorists on Highway 280.
Figure 15 – Available land areas suitable for solar energy at the Story Road Landfill
Solar Areas A and B have significant land area available and may be suitable for a solar energy plant, pending a geotechnical survey. Fixed- or single-axis tracking PV systems, CPV, or micro-CSP systems may be suitable. Solar Area C is relatively small due to the land slope in this area, but could be a good location for installation of aesthetically-pleasing solar technologies such as the solar “sunflower.” A series of three solar sunflowers, each with 16 PV modules, could be installed in this area.
2.0 SOLAR SITE EVALUATION
2-14 BAO\080250002
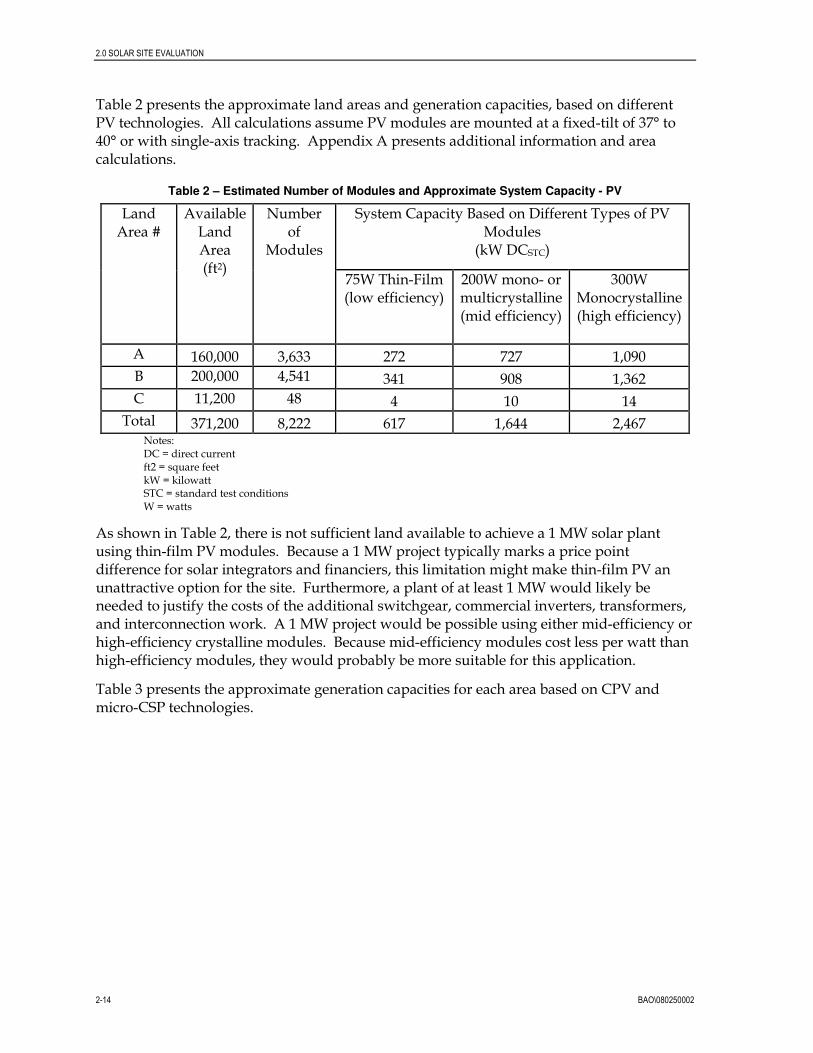
Table 2 presents the approximate land areas and generation capacities, based on different PV technologies. All calculations assume PV modules are mounted at a fixed-tilt of 37° to 40° or with single-axis tracking. Appendix A presents additional information and area calculations.
Table 2 – Estimated Number of Modules and Approximate System Capacity - PV
System Capacity Based on Different Types of PV Modules (kW DCSTC)
Land Area #
Available Land Area (ft2)
Number of
Modules
75W Thin-Film (low efficiency)
200W mono- or multicrystalline (mid efficiency)
300W Monocrystalline (high efficiency)
A 160,000 3,633 272 727 1,090
B 200,000 4,541 341 908 1,362
C 11,200 48 4 10 14
Total 371,200 8,222 617 1,644 2,467 Notes: DC = direct current ft2 = square feet kW = kilowatt STC = standard test conditions W = watts
As shown in Table 2, there is not sufficient land available to achieve a 1 MW solar plant using thin-film PV modules. Because a 1 MW project typically marks a price point difference for solar integrators and financiers, this limitation might make thin-film PV an unattractive option for the site. Furthermore, a plant of at least 1 MW would likely be needed to justify the costs of the additional switchgear, commercial inverters, transformers, and interconnection work. A 1 MW project would be possible using either mid-efficiency or high-efficiency crystalline modules. Because mid-efficiency modules cost less per watt than high-efficiency modules, they would probably be more suitable for this application.
Table 3 presents the approximate generation capacities for each area based on CPV and micro-CSP technologies.

2.0 SOLAR SITE EVALUATION
BAO\080250002 2-15
Table 3 –Approximate System Capacity – CPV and Micro-CSP
Land Area #
Available Land Area (ft2)
CPV (1) (kW)
Micro-CSP (kW)
A 160,000 918 669
B 200,000 1,148 836
C 11,200 - -
Total 371,200 2,066 1,505 Notes: (1) Capacities derived from vendor estimate ft2 = square feet kW = kilowatt
The approximate CPV capacity is based on an estimate provided by a representative from GreenVolts, who estimated that the approximately 8-acre site could support approximately 2 MW of capacity. The micro-CSP potential is derived from the Sopogy design specifications presented in Section 2.4.4.
2.6 Electrical Interconnection
The current electrical service consists of a single meter and a service panel with single-phase 240V service, as shown in Figure 16. This service feeds a groundwater remediation system which extracts groundwater to prevent contamination of the nearby creek.
Figure 16 - Electricity meter for the Site
Electrical distribution lines were present in the western portion of the site near Highway 280, as shown on Figure 17.

2.0 SOLAR SITE EVALUATION
2-16 BAO\080250002
Figure 17 - Overhead electrical lines
Figure 18 shows the approximate location of the electrical meter and electrical distribution lines at the Site.
Figure 18 – Electrical meter location at Story Road Landfill

2.0 SOLAR SITE EVALUATION
BAO\080250002 2-17
If a large-scale plant is constructed at the site, one or more commercial-scale inverters would likely be mounted outside on a concrete slab, in close proximity to the distribution lines. Figure 19 shows an example of a commercial 500kW inverter.
Figure 19 - Commercial-scale 500 kW PV Inverter (Xantrex model GT- 500E)
Evaluation of the existing electrical system and the upgrades required are beyond the scope of this report. Further studies would be required to assess the interconnection requirements for the Site.
2.7 Estimated Cost
Based on a large number of PV projects installed in California, staff at the National Renewable Energy Laboratory (NREL) have estimated installation, operation and maintenance (O&M), and balance of system (BOS) costs for PV projects (NREL, 2008). The data suggest an average installed cost of approximately $6.87/watt for PV systems greater than 100 kW in size. A likely range would be $6.00/watt to $7.00/watt. However, this cost does not include materials and construction of the mounting structure, and does not include the cost for a single-axis tracking control system.
An estimated cost for installing a PV system with a single-axis tracking system in California would be $7.50/watt to $8.50/watt. This estimate assumes an additional cost of $1.00/watt to $1.50/watt for the single-axis tracking system for crystalline-based solar PV systems.
High-efficiency solar systems typically cost about $0.50/watt to $1.00/watt more than average-efficiency solar systems. Installed prices for high-efficiency systems above 100kW in size would be expected to be between $6.50/watt and $7.50/watt. A custom installation such a solar “sunflower” would likely be significantly higher due to the mounting and construction requirements and relatively small system size. The estimated system cost for a custom solar sunflower is between $10.00/watt and $11.00/watt.
The price of thin-film solar modules relative to crystalline solar modules depends on several factors, including worldwide silicon supply, panel efficiencies, supply chain efficiencies,

2.0 SOLAR SITE EVALUATION
2-18 BAO\080250002
manufacturing economics, racking systems, and other factors. An estimated cost of installing 617 kW of thin-film modules at this site would likely be in the range of $5.50/watt to $8.00/watt, based on the system size of less than 1 MW, and potentially higher depending on the costs of interconnection onto the grid. The cost for installing a single-axis tracking system for thin-film solar would be higher than for crystalline silicon, because of the greater number of modules (roughly 2.5 times greater) that would be required. Based on an estimated cost of $1.50/watt for a single-axis tracking system utilizing crystalline silicon modules, a tracking system for a comparable thin-film module tracking systems might be as much as $3.75/watt. Based on this estimate, a single-axis tracking thin-film solar system would be expected to cost in the range of $9.25/watt to $11.75/watt.
Further evaluation would be required to estimate the costs of a CPV system or a micro-CSP system. No pricing information was available for CPV systems since the technology is still relatively immature and cost information is confidential. Based on SAM, the cost of a 1 MWe CSP trough system with an Ormat 1 MW generator would be $6,879,531, or approximately $6.88/watt). In general a micro-CSP system might be expected to cost between $6.80/watt and $10.00/watt.
Table 4 provides estimates for several different solar technologies, including crystalline silicon PV, thin-film PV, CPV, and micro-CSP. The costs shown below are illustrative and may not be representative of the actual costs that would be offered to the City during a formal procurement effort.

2.0 SOLAR SITE EVALUATION
BAO\080250002 2-19
Table 4 – Estimated Power Output and Capital Costs for Various Solar Technologies
Technology Estimated Installed Cost per kW-DCSTC
SAM-modeled Annual Output (kWh/kW-DCSTC)
Approximate 30-year Lifetime Cost per kWh (1)
Crystalline fixed-tilt at 35° $6,000 - $7,000 1,382 $0.14 - $0.17
Crystalline single axis tracking at 0° $7,500 - $8,500 1,675 $0.15 - $0.17
Crystalline single axis tracking at 20° $7,500 - $8,500 1,783 $0.14 - $0.16
Thin-film fixed tilt at 35° $5,500 - $8,000 1,486 $0.12 - $0.18
Thin-film single-axis tracking at 0° $9,250 - $11,750 1,792 $0.17 - $0.22
Thin-film single-axis tracking at 20° $9,250 - $11,750 1,899 $0.16 - $0.21
High efficiency solar sunflower at 35° $10,000 - $11,000 1,382 $0.24 - $0.27
CPV (2-axis tracking) N/A 1,450 (2) N/A
Micro-CSP $6,800 - $9,000 1,460 - 1,825 $0.11 - $0.21
Notes: (1) Calculation assumes 30-year system lifetime with constant annual output (2) Per vendor estimate (not based on SAM) DC = direct current kW = kilowatt kWh = kilowatt hour N/A = Not available STC = standard test conditions
2.8 Estimated Electrical Production and Energy Cost Savings
Table 5 presents estimates of capital costs and projected electrical production based on different scenarios created using the Solar Advisor Model.

2.0 SOLAR SITE EVALUATION
2-20 BAO\080250002
Table 5 – Estimated Power Output and First Year Savings for Conceptual Solar Systems
Area
Est. system size (kW-DCSTC)
Technology
SAM-modeled Annual output
(kWh/kW-DCSTC)
Estimated Installation
Cost
Estimated 1st Year kWh
production
Estimated 1st Year
Savings at $0.12/kWh
A 727
Crystalline PV with single-axis tracking @ 20°
1,783 $5,452,500 based on estimated $7.50 per watt
1,296,641 $155,597
B 908
Crystalline PV with single-axis tracking @ 20°
1,783 $6,810,000 based on $7.50 per
watt 1,618,964 $194,276
A 918 CPV 1,450 (1) N/A 1,331,100 N/A
B 1,148 CPV 1,450 (1) N/A 1,664,600 N/A
A 669 Micro-CSP 1,460 – 1,825(2)
$4,549,200 based on estimated $6.80 per watt
976,740 – 1,220,925
$117,209 - $146, 511
B 836 Micro-CSP 1,460 – 1,825(2)
$5,684,800 based on estimated $6.80 per watt
1,220,560 – 1,525,700
$146,467 - $183,084
C 14
High efficiency, fixed-tilt crystalline PV
1,382
$140,000 - $154,000 based on estimated $10.00 - $11.00 per watt
19,348 $2,322
Notes: 1) Based on vendor estimate for a CPV system installed in San Jose, California. 2) The estimate of 1,825 kWh/kW is taken from vendor literature. The relatively low DNI for San Jose would
likely decrease this production amount by as much as 20%. The estimate of 1460 kWh/kW is calculated based on a 20% reduction from the value in the vendor literature.
DC = direct current kW = kilowatt kWh = kilowatt hour MW = Megawatt N/A = Not available SAM = Solar Advisor Model (NREL)
2.0 SOLAR SITE EVALUATION
BAO\080250002 2-21
2.9 Financing Options
2.9.1 Public Sector Solar Projects
There are several different structures available to finance public sector PV projects. Unfortunately, as a non-taxpaying entity, the City is at a disadvantage vis-à-vis corporate entities in terms of its ability to take advantage of state and federal tax incentives. This is significant since tax incentives are a key factor in making the economic case for solar. San Jose can purchase a PV system outright using the proceeds from tax-exempt municipal bond issuances similar to how it may finance other capital improvements. The City can also enter into a tax-exempt municipal lease to acquire the system, financing it over the term of the lease. However, since ownership and use of the system traditionally reside with the City in both the bond-financed and lease options, neither of these structures can take full advantage of the available tax incentives for solar. Both options also impose operations and maintenance responsibilities on the City. Alternatively, San Jose can finance PV projects through a third party using a Power Purchase Agreement (PPA) model which does incorporate the tax benefits to the benefit of the City. Similar to the lease option, no up-front capital is required on the part of the City, which makes this model more attractive for municipal entities.
Under the third-party PPA model, a solar developer finances, installs, owns, and maintains the PV system on the customer’s roof. The customer (i.e., the City) would sign a long term contract (the PPA) and agree to purchase 100% of the electricity produced by the PV system. The initial cost of electricity in a PPA is typically competitive with current utility electricity rates and will typically escalate over the life of the contract at a fixed annual percentage (e.g., 2-3% per year). The solar developer and its financial backers can take full advantage of the Federal investment tax credit, accelerated depreciation, and any available state incentives. Third party maintenance is another attractive feature of the PPA model.
However, there are caveats to the third party PPA model. As the City is not the owner of the system, it does not automatically own the environmental attributes of the system. This means that the City can not claim to be “solar powered” if a separate entity owns the rights to claim the solar attributes of the system. Instead, the correct terminology is that the building is “hosting” solar panels. However, the City could bolster its sustainable credentials by retaining or purchasing renewable energy credits in the amount equal to the production of the PV system. A second caveat is that the City must agree to third-party access to the PV system located on a city rooftop or on city land. Third, transaction costs are high given the number of parties and contracts involved. Finally, there may be contractual barriers within the City’s charter or within the local regulatory environment that might limit the ability to enter into long-term, third-party contracts for electricity.
The third party PPA option can be structured so that the City can purchase the system prior to the end of the contract. At the end of the PPA, there will likely be three options available to the City. There will be the option for the City to purchase the system, to renew the PPA, or request that the system be removed.
In accordance with the City of San Jose’s recently-adopted technology demonstration partnership policy, San Jose can also negotiate a variety of financial terms and conditions with solar companies that would like the City to host the demonstration of newly-

2.0 SOLAR SITE EVALUATION
2-22 BAO\080250002
introduced technologies. These financial options could range from the provision of rent-free land with a PPA in exchange for free or wholesale electricity, to market-rate rent and provision of electricity at a market rate. If City policy permits, an equity stake in the prospective solar company could also be part of the terms and conditions of the arrangement.

BAO\080250002 3-1
3.0 Findings
The Story Road Landfill has available land area that could potentially be utilized for a solar energy installation. Although there is not a significant electrical load at the facility, the recent authorization of net aggregate metering legislation (AB2466) makes it possible for entities such as the City of San Jose to generate excess renewable energy at one facility and receive an electricity bill credit towards the consumption of energy at another site on the same rate schedule. For this reason, the case for solar energy at the Story Road Landfill becomes more compelling. Furthermore, the high-visibility location near Highway 280 makes this site attractive from a solar marketing perspective.
Based on the conceptual land areas shown in Figure 15, an estimated 1.649 MW solar plant could be installed at the site using single-axis tracking PV at 20° in Solar Areas A and B and a small number of high-efficiency solar sunflowers in Area C. The estimated cost would be approximately $12.4 million, and the expected electrical output would be approximately 2.93 million kilowatt-hours per year (kWh/yr) based on SAM modeling and using San Jose weather data.
An estimated 2 MW solar plant could be installed at the site using CPV technology in Solar Areas A and B. The expected electrical output would be approximately 3 million kWh/yr, based on a vendor estimate for the San Jose area. No pricing information was available for this technology.
Similarly, an estimated 1.5 MW solar plant could be installed at the site using micro-CSP technology in Solar Areas A and B and high-efficiency solar sunflowers in Area C. The estimated cost would be approximately $10.4 million, and the expected electrical output would be between 2.2 million kWh/yr and 2.7 million kWh/yr, based on SAM and using San Jose weather data.
There are several obstacles potentially limiting the viability of a solar energy installation at the site. First, the soil may not be suitable for construction of a solar plant, and may require significant compaction, grading, and other site preparation prior to construction. A thorough geotechnical survey would be required to evaluate site soils. Secondly, the existing electrical distribution system at the site would probably require significant upgrades which could add significantly to the project cost.
When evaluating solar options for the Site, the City should consider that solar integrators typically provide price point advantages at systems greater than 1 MW DCSTC. It is estimated that the installed cost at this site would be between $5.50/watt for a fixed-tilt thin-film system to $7.50/watt for a crystalline silicon PV system using a single-axis tracking design.
Based on the estimated cost and the available land area, micro-CSP, CPV, thin-film, or single-axis tracking PV at 20° tilt appear to be the most suitable technologies for the Site. However, the City should consider accepting bids from solar developers for all technologies and determine which option provides the highest amount of solar production at the lowest cost.

3.0 FINDINGS
3-2 BAO\080250002
The Site is not suitable for installation of a large CSP system due to the low levels of direct sunlight and the lack of sufficient land area (a minimum of 150 to 200 acres would be required). However, it might be reasonable to allow for a small demonstration CSP plant to test the suitability of micro-CSP systems for the San Jose area. A 1.5 MW micro-CSP plant could be possible at this site, based on the available land area.

BAO\080250002 4-1
4.0 References
National Renewable Energy Laboratory (NREL), 2008. “Installed PV Costs_Summary”. Data collated by Jesse Dean of NREL. March.
SOPOGY. (2008). Micro CSP: A Scalable Solar Solution for Distributed Generation, Process Heat & Air Conditioning. Available at: http://www.sopogy.com/pdf/contentmgmt/SopogyWhitePaperFINAL.pdf.


BAO\080250002 4-1
Appendix A Solar Area Analysis


APPENDIX A SOLAR AREA ANALYSIS
BAO\080250002 4-1
The calculation for the approximate number of modules, and the expected DCSTC output is found using the following methodology:
1) Calculate the available roof area via physical measurements and/or an estimate using satellite imagery.
Potential Area A: 800’ X 200’ = 160,000 ft2 available area
2) Area Shape Factor for imperfect areas, odd angles, and incomplete rows.
Area A will have a shape factor of 1.0 (no odd angles or incomplete rows)
3) Use the Ground Cover Ratio (GCR) chart from PVWatts to calculate the GCR factor to allow proper spacing between modules based on tilt, shading, and spacing between modules.
For Area A in the Story Road Landfill, use single-axis tracking, or a fixed system at a 37° tilt for maximum electric output. Assume 2.5% shading, or a Shading Derate Factor of 0.975. The GCR is estimated at 0.4, based on the corresponding curves in the chart below. Of the 160,000 ft2 of area, only 40% will be solar panels from an overhead, or satellite view.
Source : PVWatts
4) Find the solar panel area by multiplying the available roof area by the GCR factor and the Area Shape Factor.
Ex: 160,000 ft2 * .40 * 1.0 = 64,000 ft2 solar panel area
5) Use a commonly available module size of 65” x 39” to estimate the number of modules available for this installation.
Ex: One module = 5.42’ X 3.25’ = 17.615 ft2
APPENDIX A SOLAR AREA ANALYSIS
4-2 SFO\DOE SAC_SJ_STORYRD_LANDFILL_2008_FINAL.DOC
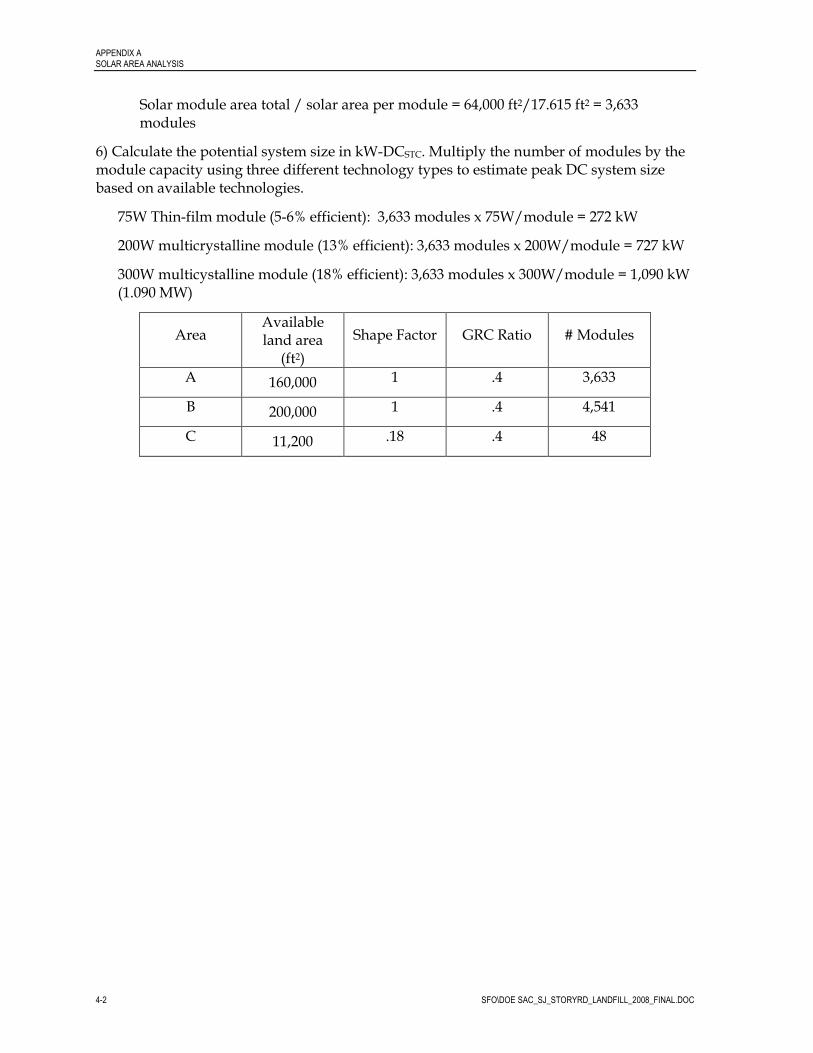
Solar module area total / solar area per module = 64,000 ft2/17.615 ft2 = 3,633 modules
6) Calculate the potential system size in kW-DCSTC. Multiply the number of modules by the module capacity using three different technology types to estimate peak DC system size based on available technologies.
75W Thin-film module (5-6% efficient): 3,633 modules x 75W/module = 272 kW
200W multicrystalline module (13% efficient): 3,633 modules x 200W/module = 727 kW
300W multicystalline module (18% efficient): 3,633 modules x 300W/module = 1,090 kW (1.090 MW)
Area Available land area (ft2)
Shape Factor GRC Ratio # Modules
A 160,000 1 .4 3,633
B 200,000 1 .4 4,541
C 11,200 .18 .4 48

BAO\080250002 F-1
Appendix B Concentrating Solar Power Prospects of
California

APPENDIX B CONCENTRATING SOLAR POWER PROSPECTS OF CALIFORNIA
F-2 BAO\080250002
The graph below shows areas in California that may be suitable for CSP development based on DNI levels, ground slope, and distance from urban areas, water features, and sensitive lands.1
1 National Renewable Energy Laboratory. (2007). Concentrating Solar Power Prospects of California. Available: http://www.nrel.gov/csp/images/1pct_csp_ca.jpg.
BAO\080250002 F-3
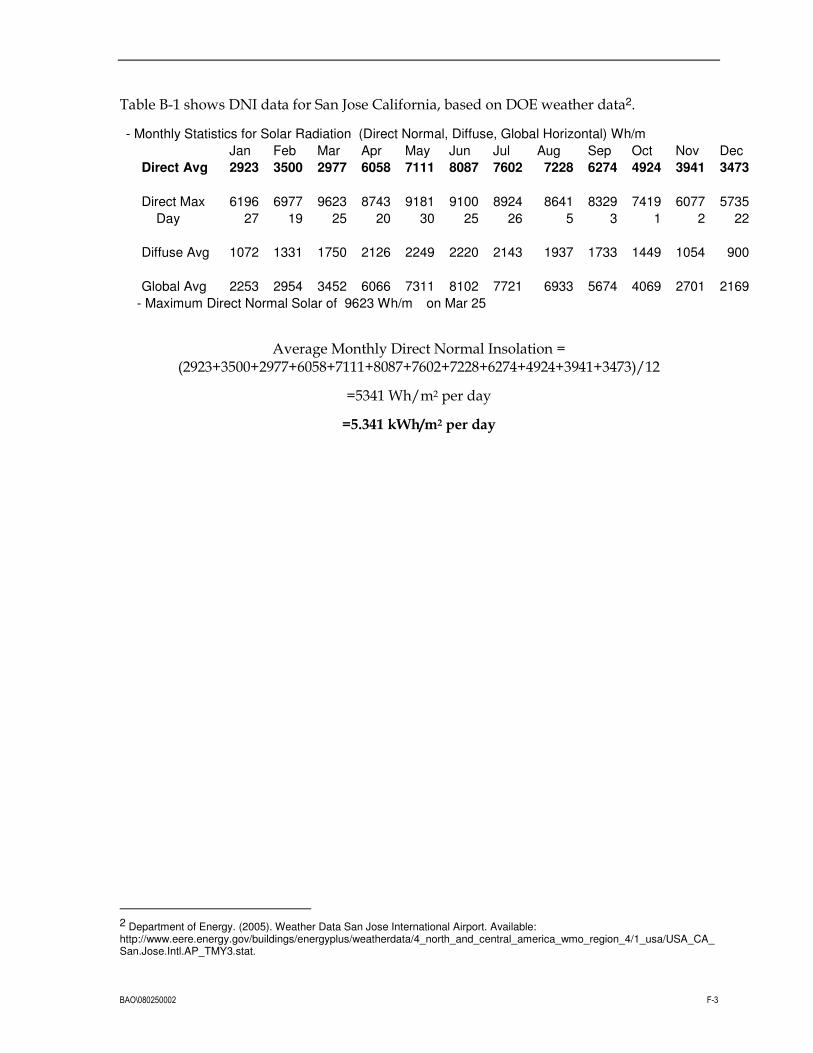
Table B-1 shows DNI data for San Jose California, based on DOE weather data2.
- Monthly Statistics for Solar Radiation (Direct Normal, Diffuse, Global Horizontal) Wh/m�
Jan Feb Mar Apr May Jun Jul Aug Sep Oct Nov Dec
Direct Avg 2923 3500 2977 6058 7111 8087 7602 7228 6274 4924 3941 3473
Direct Max 6196 6977 9623 8743 9181 9100 8924 8641 8329 7419 6077 5735
Day 27 19 25 20 30 25 26 5 3 1 2 22
Diffuse Avg 1072 1331 1750 2126 2249 2220 2143 1937 1733 1449 1054 900
Global Avg 2253 2954 3452 6066 7311 8102 7721 6933 5674 4069 2701 2169
- Maximum Direct Normal Solar of 9623 Wh/m� on Mar 25
Average Monthly Direct Normal Insolation = (2923+3500+2977+6058+7111+8087+7602+7228+6274+4924+3941+3473)/12
=5341 Wh/m2 per day
=5.341 kWh/m2 per day
2 Department of Energy. (2005). Weather Data San Jose International Airport. Available: http://www.eere.energy.gov/buildings/energyplus/weatherdata/4_north_and_central_america_wmo_region_4/1_usa/USA_CA_San.Jose.Intl.AP_TMY3.stat.