u.s. current account debate with japan then, with …web.pdx.edu/~ito/hiro ito us current acct...
TRANSCRIPT

U.S. Current Account Debate
With Japan then, with China Now
By
Hiro Ito* Portland State University
First Draft: August 5, 2008 Second Draft: September 14, 2008
Third Draft: February 6, 2009
Abstract This paper examines two U.S. current account deficit episodes, one in the 1980s and the other in the current 2000s, in which Japan and China, respectively, are the current account surplus countries that are criticized for contributing to the deficits. In both periods, U.S. policy makers pointed out the underdeveloped and closed financial markets of the current account surplus countries and advocated for these countries to fix the deficiencies, a position akin to the current “saving glut” argument. In both episodes, the current account surplus countries have criticized the United States for its low saving, especially public saving (the “Twin Deficit” argument). This paper presents empirical findings that are consistent with the Twin Deficit hypothesis; A one percentage point increase in the budget balance raises the current account balance by 0.10-0.49 percentage point for industrialized countries. The saving glut argument seems to be applicable only for countries with highly-developed legal systems and open financial markets. While the United States has been experiencing a savings drought in both episodes, the Japanese current account surplus was driven by underinvestment in the 1980s and by over-saving during the 2000s. Furthermore, although the current Chinese current account surplus is driven by its oversaving, there is no evidence of excess domestic saving in the Asian emerging market countries; rather, they seem to have suffered from depressed investment in the wake of the 1997 financial crises. Keywords: Current account; savings glut; Twin Deficit hypothesis; panel regressions; capital flows; financial development; China; Japan. JEL Classification Nos.: F32, F41 Acknowledgements: This paper is prepared for the conference “Asian Economic Integration in a Global Context,” organized by the American Committee for Asian Economic Studies (ACAES) and the Rimini Centre for Economic Analysis (RCEA) and held in Rimini, Italy on August 29-31, 2008. The previous version of this paper was presented at the conference “Repositioning Japan in the Global Political Economy,” Philadelphia on September 15–16, 2006. I would like to thank conference organizers and participants for organizing the conference as well as for valuable comments. The financial support of faculty research funds of Portland State University is acknowledged. I would like to thank Erica Clower and Lakin Garth for excellent research assistance. * Ito: Department of Economics, Portland State University, 1721 SW Broadway, Portland, OR 97201. Email: [email protected]

1
1. Introduction
For the last few years, the issue of “global imbalances”–persistent and enormous current account deficit by the United States matched by surpluses in emerging market countries, especially in China–has been the topic of intense debate in academic and policy circles. The outbreak of the current global financial crisis has not wiped away the debate. In fact, many international economists blame it on the global imbalances; capital exported by current account surplus countries, they argue, fed American profligacy with cheep credit and caused the housing bubble. As shown in Figure 1, global capital flows seem to have been lopsided in the last decade. The U.S. current account reached 5.4 percent as a ratio to GDP in 2007 after leveling off from 6.2 percent in 2006. On the other side of the Pacific Ocean, Japan’s current account surplus increased to 4.9 percent and that of emerging market economies in East Asia to 8.7 percent. China’s surplus has risen to an astonishing 11 percent, tripling its size as of 2004.1
One interesting characteristic of the current global imbalances is that the countries running current account surpluses hold a massive amount of international reserves. As Figure 2 shows, while China has expanded its current account surplus for the last few years, it has also increased its holding of international reserves. As of the end of 2007, it held $1.5 trillion of reserves, or 46% of its GDP, after surpassing Japan, the long-time largest holder of international reserves ($0.9 trillion). In addition to China and Japan, the 10 biggest international reserve holders include six emerging market economies in Asia, totaling $1 trillion of reserves.2 These eight economies in total hold $3 trillion of international reserves, accounting for 60% of total world reserves.
Even before the outbreak of the crisis, many economists had been warning the distortive effects of the global imbalances on the world economy. They argue that the high volume of international reserve holdings by current account surplus countries reflects massive foreign exchange interventions to maintain their currencies at undervalued, competitive values. However, their intervention efforts also increased liquidity in their economies and created and exported high inflation in commodities and goods while planting seeds for asset market bubbles with low
1 After peaking in 2006, the U.S. current account deficit started leveling off in 2007 due to then dollar depreciation and oil price increases. The IMF estimates that the current crisis will considerably weaken the country’s domestic absorption and thereby improve the current account significantly in the years to come. China, on the other hand, has experienced its exports hit by the crisis, but its imports have fallen even further since the end of 2008 due to weakening domestic demand. Hence, China’s surplus is expected to remain at a relatively high level, though not as high as the 2007 peak – around 9%. It must be noted that oil exporting countries also experienced a rapid rise in their current account surpluses due to the rapid rises in oil prices in recent years. The (weighted) average of the size of current account surpluses for this group of countries is expected to be 18 percent of GDP in 2007, almost tripling from the beginning of the millennium. Figure 1 omits this group for presentation purposes. These imbalances remain at unprecedentedly high levels. For a review on the historical levels of current account imbalances, refer to Edwards (2005). 2 The six economies are Taiwan, South Korea, India, Singapore, Hong Kong, and Malaysia.
2
real interest rates.3 The seeds of easy credit also flew to the U.S. economy. That is, the central banks of the
current account surplus countries have invested a large portion of the reserves in U.S. government bonds, thereby feeding American profligacy by providing easy credit for the government and home buyers. From this view, called the “saving glut” argument, widening current account deficits are a foreign-born issue while fiscal profligacy and the housing market bubble are its by-products. Therefore, the U.S. external imbalance can be solved only if China and other East Asian emerging market countries mitigate their excess savings. More specifically, only if these surplus countries develop and liberalize financial markets further, will the influx of capital to the United States be alleviated (Bernanke, 2005, Clarida, 2005a,b, Greenspan, 2005, and Hubbard, 2005).
This view is clearly different from the rather traditional “Twin Deficit” argument: the main cause of the U.S. current account deficit is American profligacy or low saving typically exemplified as the federal government budget deficits.4 Figure 3 allows one to casually observe strong (unconditional) correlations between current account and budget balances (though with some time lag) especially during the 1980s and the 2000s. In this view, the U.S. running current account deficit is quite natural since the lack of saving in the government and personal sectors must be complemented by foreign saving, that is, capital inflow.
As the debate intensifies over the Sino-U.S. current account imbalances, many observers cannot help but think of the current policy debate as a déjà vu of the current account imbalance debate during the 1980s, in which Japan was the alleged main contributor to U.S. current account deficits. In fact, there are many parallels in the policy debate exchanges between Japan and the United States during the 1980s and that between China and the U.S. presently. Currently, the U.S. claims that China manipulates its currency value and maintains it at undervalued levels so that it can keep exporting competitively to U.S. markets. Therefore, China needs to change its policy and revalue the currency. Otherwise, as some U.S. Congressmen argue, trade sanctions need to be implemented to make up for the competitive prices of Chinese imports due to undervaluation. Also, it has been argued that China needs to develop and liberalize its financial markets so that its excessively high level of saving (about 55% of GDP as of 2007) will fall and be used more effectively locally and regionally instead of flowing to the United States.
In the previous statement, if the word “China” is replaced with “Japan,” it would sound exactly like the demands made by the United States against Japan in the midst of trade disputes 3 Roubini (2008) argues that commodity and goods inflation caused by current account surplus countries will lead to a collapse of the “Bretton Woods II Regime”—in which emerging market economies fix or heavily manage their currency values with U.S. dollars--as was the case in the original Bretton Woods system. Glick and Hutchison (2008) maintain that China’s intervention efforts seem to have started losing their effectiveness in sterilizing interventions and controlling inflation. 4 See Chinn (2005) for more on the Twin Deficit hypothesis.

3
in the 1980s, especially before the Plaza Accord of 1985. This paper compares these two U.S. current account deficit episodes, one with Japan and
the other with China. Of course, Japan during the early 1980s and China during the 2000s are completely different economies with different levels of economic development, placed in different international economic and geopolitical environments. However, comparing the two episodes should yield interesting insights and additions to the current debate on the global imbalances and the interdependent relationship, not just trade but more importantly financial one, between the United States and China, Japan, and other East Asian economies.
This paper first reviews the similarities and differences between Japan during the early 1980s and China at present in terms of these countries’ economic relations with the United States, and also of macroeconomic characteristics. Second, a formal panel regression analysis is conducted to examine the dynamics of current account determination of the United States, Japan, China, and other East Asian countries in a cross-country context. Third, using the estimation results, a closer look will be taken at the saving-investment determination of the countries of interest. Lastly, concluding remarks will be presented. 2. Comparison between Japan during the 1980s and China during the 2000s
2.1 Similarities in Economic Relations with the U.S. Japan During the 1980s
The current account imbalance between the United States and Japan began to arise in the early 1980s. In 1982, the United States started running a current account deficit, and in three years, the deficit increased to three percent of its GDP and peaked at 3.4 percent in 1987 (See Figure 1). Japan, on the other hand, started running a current account surplus in 1981, and by 1986, the surplus rapidly increased to 4.3 percent, the highest level until 2006. This time period coincided with the time when some U.S. key industries such as steel, home electronics, and automobiles were experiencing structural slumps, and partially being replaced by imports from Japan. Therefore, the current account imbalances inevitably became a politicized issue, intensifying criticism against Japan.
In the first half of the 1980s, while the White House tried to maintain its laissez faire attitude toward international trade, Congress intensified protectionism toward Japanese exports. In fact, protectionism by Congress was not something new as of the beginning of the 1980s. Starting with measures to restrain Japanese textiles during the 1960s, the U.S. Congress has since implemented or attempted to implement a number of protectionist measures against Japanese imports. The targeted industries include: machinery tools, home electronics, steel, automobile, motorcycle, semiconductor, supercomputer, telecommunications, agricultural products (such as
4
orange, beef, and rice), and financial services industries.5 When the U.S. Federal Reserve Board tightened monetary policy in the beginning of the
1980s, the resultant high interest rates caused dollar appreciation, especially against the Japanese yen, and this led some observers to claim that the yen was manipulatively undervalued.6 They also argued that Japanese financial markets were underdeveloped and closed, mainly due to protectionist and meddling administration by the Ministry of Finance (MOF), so that the lack of attractiveness or accessibility of Japanese financial markets had made people save more as self-insurance and made Japanese markets less attractive as an investment destination for both domestic and foreign investors. Hence, personal saving tended to remain high while investment was not as high as it could have been (given the robust economy then), causing excess net domestic saving or current account surplus.7 Therefore, unless Japanese financial markets became more developed and open, it was claimed, Japan would continue to experience excess domestic saving, thereby current account surplus, and the dollar-yen value would not be corrected. Although Japan did not have a fixed exchange rate system during the period – it was aborted when the country left the Bretton Woods system in 1973 – the United States criticized Japan for its financial administration policy as an effort to manipulate the currency value.
Against these criticisms, Japan responded to the United States by pointing out that the main reason for the rise in U.S. current account deficit was due to a reduction in the country’s domestic saving, especially public saving. In fact, as a result of Reaganomics tax policy and Cold War-related military spending increased, the budget deficit increased in the 1980s (see Figure 3), as did the current account deficit. Pointing out that this “Twin Deficit” hypothesis was also argued domestically, Japan claimed that the United States was merely using Japan as a scapegoat for its own mismanagement of economic policy.
In 1985, the tension between the United States and Japan over trade relations peaked when the U.S. Senate passed a resolution condemning Japan for unfair trade practices and urged a retaliation with 20% tariffs imposed uniformly on all Japanese imports (to remove the effect of undervalued currency) if Japan did not make efforts to alter currency policy and improve trade imbalances (Gephardt resolution). This threat, in retrospect, became a strong motive for the White House to convince the G5 countries to agree on the Plaza Accord in September 1985. In the agreement, the party countries agreed to jointly intervene the foreign exchange markets to 5 For the overview on the U.S.-Japan trade disputes, refer to Bergsten and Noland (1993). 6 The Economic Report of the President in 1983, for example, estimated that the U.S. dollar is overvalued against the Japanese yen by more than 30 percent. 7 In 1983, the U.S. and Japanese governments set up the Yen-Dollar Committee to discuss what these countries needed to do to “correct” the undervaluation of the Japanese yen and to enhance further financial deregulation and financial liberalization. As a result of the discussions in this committee, Japan liberalized capital account transactions in 1984 and started a series of domestic financial deregulation policy in the late 1980s. For the details on the U.S. exchange rate policy during the 1980s, refer to Frankel (1994), and on Japanese financial liberalization/deregulation efforts, refer to Nakamura (1994).

5
guide the U.S. dollar to depreciate against the Japanese yen and Deutsche Mark. As a result, the yen appreciated considerably in the following years, that is, by 50% by 1989.8 Two years after the agreement, the Japanese current account surplus finally started shrinking and reduced to 1.5% of GDP in 1990, though it did not lead to its reversal.
In retrospect, the Plaza Accord left a significant impact on the international financial environment, not just for Japan, but for the entire Asian region. The yen-dollar exchange rate continued to appreciate against the U.S. dollar and eventually marked the highest value of $1 = 79 yen in April 1995. To the rapid yen appreciation in the immediate aftermath of the Accord, Japan’s monetary policy reacted by lowering the interest rate, which eventually led to the creation of the bubble economy in the last few years of the 1980s.9 The high yen also caused Japanese firms to offshore production bases through foreign direct investment (FDI) to avoid increased production costs in the domestic market, eventually changing the map of capital flows within the Asian region significantly. China in the 2000s
In the 2000s, China has essentially become the world’s manufacturer and rapidly and persistently widened current account surplus while the U.S. current account deficit has grown rapidly (Figures 1 and 2). Between 2000 and 2006, China’s exports have quintupled, and surpassed U.S. exports (in terms of trade volume) in 2007, becoming the world’s second largest after Germany’s. Already in 2000, China had become the largest contributor to the U.S. trade deficit, replacing the long-time leading contributor, Japan. In 2007, the U.S. trade deficit with China was $256 billion (32% of total), about triple Japan’s figure ($83 billion).
China’s strong presence in world trade and penetration into U.S. markets has not always been welcomed by the United States, which is similar to the case with Japan during the 1980s. Since 2003, about three dozen bills have been created in the U.S. Congress to challenge alleged Chinese unfair trade practices (Hufbauer and Brunel, 2008).
Furthermore, China has been accused of manipulating its currency value to maintain competitive prices in its exports.10 Although it officially ended its fixed exchange rate policy in 8 In fact, in the beginning of 1985, the Japanese yen had already started showing some sign of trend reversal toward appreciation. Hence, the joint intervention is not the sole contributor to the yen appreciation in the late 1980s, though there is no question that the Accord exacerbated the appreciation trend by signaling the market. I thank the editor for pointing this out. 9 The bubble economy was exacerbated by financial deregulation and the government’s efforts to stimulate domestic absorption, both of which were closely related to U.S.-Japan economic relations. Financial deregulation and liberalization policies implemented in the mid-1980s, partially as a response from the U.S. pressure, led to reckless lending by banks that fiercely tried to compensate for thinned profit margins. In the late 1980s, the Japanese government also tried to stimulate domestic absorption as a means to correct current account imbalances, which had pro-cyclical nature in the midst of the bubble economy. 10 See the U.S. Congressional Budget Office’s testimony on April 14, 2005. It is also noteworthy that Tim Geithner, U.S. Treasury Secretary of the new Obama administration, has insisted, since his testimony in the confirmation

6
July 2005, China actively intervenes in the currency market and tries to prevent rapid appreciation.11 As of July 2008, the renminbi has appreciated by 17% since the 2007 revaluation, but on a real trade-weighted basis, the degree of appreciation is merely 8%. During the same time period, the U.S. dollar depreciated by 15% on a real trade-weighted basis, indicating that the yuan’s appreciation is minimal at best.12 In short, China essentially maintains a fixed exchange rate system. This can be easily evidenced by the rapid rise in the country’s international reserves holdings in the last few years (Figure 2). As of the end of June 2008, it held $1.8 trillion of international reserves (equivalent to 50% of the size of the economy), which could pay for about a year and half’s worth of the country’s imports and is five times the size of the country’s foreign debt (as of end-2007). By any standards, the size of international reserves holding is massive and possibly excessive.13 In any case, the massive international reserves holdings is regarded as circumstantial evidence of China’s efforts to “manipulate” its currency value at undervalued levels.14
Against this backdrop, the U.S. Congress has attempted to take some protectionist actions against China. Although they have been already aborted, the two bills proposed, one by Senators Charles Schumer (D-NY) and Lindsey Graham (R-SC) in February 2005 and the other by Senators Charles Grassley (R-Iowa) and Max Baucus (D-MT) in March 2006, exemplify the protectionist movement in the U.S. Congress. The Schumer-Graham bill proposed an imposition of a 27.5% tariff on all goods from China unless the currency is revalued in such a way as to correct the trade imbalances: 27.5% is their back-of-envelope estimate of the degree of undervaluation of the renminbi. The Grassley-Baucus bill proposed that the Treasury Department work with the IMF to fix the value of the Chinese currency.15 hearing, that China has been manipulating its currency, suggesting that the administration take a more confrontational approach toward the country than the previous administration. 11 China fixed its exchange rate at 8.28 yuan to the dollar from 1994 to 2005. On July 21, 2005, the reminbi was revalued by 2.1%, and the exchange rate has since been pegged to a basket of foreign currencies and allowed to fluctuate within a narrow band (0.3% per trading day, later extended to 0.5%) around the central parity. 12 These are based on the effective exchange rate data published by the Bank of International Settlements (BIS). 13 On whether or not China’s holding of international reserves is excessive, refer to Cheung and Ito (2007) and Jeanne and Ranciere (2006). 14 The debate on whether and how much the renminbi is undervalued is far from settled. Dunaway, et al. (2006) estimate the degree of undervaluation ranging from zero to 50%. Cheung et al. (2007) find little statistical evidence that the RMB is undervalued. Cline and Williamson (2008) survey and compare studies on the degree of renminbi’s undervaluation. In a more recent paper, by using updated World Bank’s price surveys, Cheung et al. (2009) estimate the extent of RMB undervaluation to be at most 10% as of 2006. 15 After the abortion of these bills, similar measures have been proposed by Timothy Ryan (D-OH) and Duncan Hunter (R-CA) in the House, jointly by Senators Schumer, Grassley, Graham, and Baucus, and by Senators Christopher Dodd (D-CT) and Richard Shelby (R-AL). Unlike the previous bills, these proposals, except for the Dodd-Shelby bill, do not claim China manipulates its currency value, but instead that the currency value is “fundamentally misaligned.” Also, these bills stipulate the necessity of corrective actions within the framework of the WTO system instead of unilateral actions. As of the writing of this paper, none of these bills have been voted on yet mainly because the current financial crisis has been top priorities in both houses of Congress, though the recession and the democrats-ruled Congress may reignite the policy discussion. For the review of the newly

7
Like in the United States-Japan case, the White House has been, or at least the George W. Bush administration was, hesitant to appear protectionist and appears to be more cautious about diplomatic relations. In an effort to fend off protectionist pressure from Congress, the Bush administration launched cabinet-level meetings between the U.S. and Chinese governments known as the Strategic Economic Dialog (SED). The topics in the meetings include broad economic issues between the two countries, not confined to the currency issue, ranging from market access and intellectual property issues to China’s energy and environmental policies and the country’s role in the global economy.16
Against fierce pressure from the United States to correct the imbalanced trade relationship, China has also criticized U.S. economic management, especially the latter’s low saving rate as Japan did in the 1980s. As Figure 3 shows, the current account imbalance in the 2000s coincides with the deterioration of the budgetary situation since George W. Bush’s administration increased deficit spending in 2002, resulting from, e.g., tax cuts, the “war against terrorism”, and the Iraq war (See Figure 3). As was in the case with the 1980s Japan, the Twin Deficit argument has been revived.
Currently, since commodity inflation became a big global issue between the summers of 2007 and 2008 and the world economy started looking gloomier since then, China’s macroeconomic management started receiving criticism as the main contributor to these global issues as previously mentioned.17 In addition to its currency policy, Prasad (2008) argues that the country’s “repressed” financial system helps keep the real interest rate stuck at low levels which keeps feeding inefficient banks with ample funds and keeps them from developing proper risk and profitability management. Hence, more saving floods to speculative asset market activities and leaves the financial system more exposed to bubble-burst cycles.18 In this view, the lack of financial development combined with the quasi-fixed exchange rate system can be detrimental to not just China but also the world economy.
proposed bills and political development on United States-China trade relations, refer to Hufbauer and Brunel (2008). 16 Although its coverage is not as broad as SED, the U.S. and Japan had a series of high-level comprehensive negotiations in 1989-90 under the “Structural Impediment Initiatives (SII).” The issues discussed in SII include both countries’ saving and investment patterns including the necessity for Japan to expand domestic absorption, market access and deregulation policies in Japan, and government procurement policies in both countries. 17 Roubini (2008) compares the oil shock of 2007-08 with that of the 1970s and argues that in both cases, even before the oil shocks occur, inflationary environment was already created by current account surplus economies that actively intervenes in the currency markets but fail to completely sterilize the interventions. 18 Prasad also argues that China’s quasi-fixed exchange rate system rids the country of the ability to implement appropriate interest rate policy and achieve price stability. In this system, financial markets continue to be exposed to the risk of asset price bubbles and possible deflation as a result of their bursts. Hence, contrary to the oft-heard argument that China cannot adopt a flexible exchange rate system because of the lack of financial development, he argues that the lack of flexibility in the exchange rate hinders financial development in China.

8
2.2 Differences in the Economic Structures
We have seen that the arguments against Japan on the current account imbalances during the 1980s are similar to what China is experiencing at present. However, clearly, these two economies are different, especially in terms of the stage of economic development. Therefore, one must be careful in comparing these two economies.
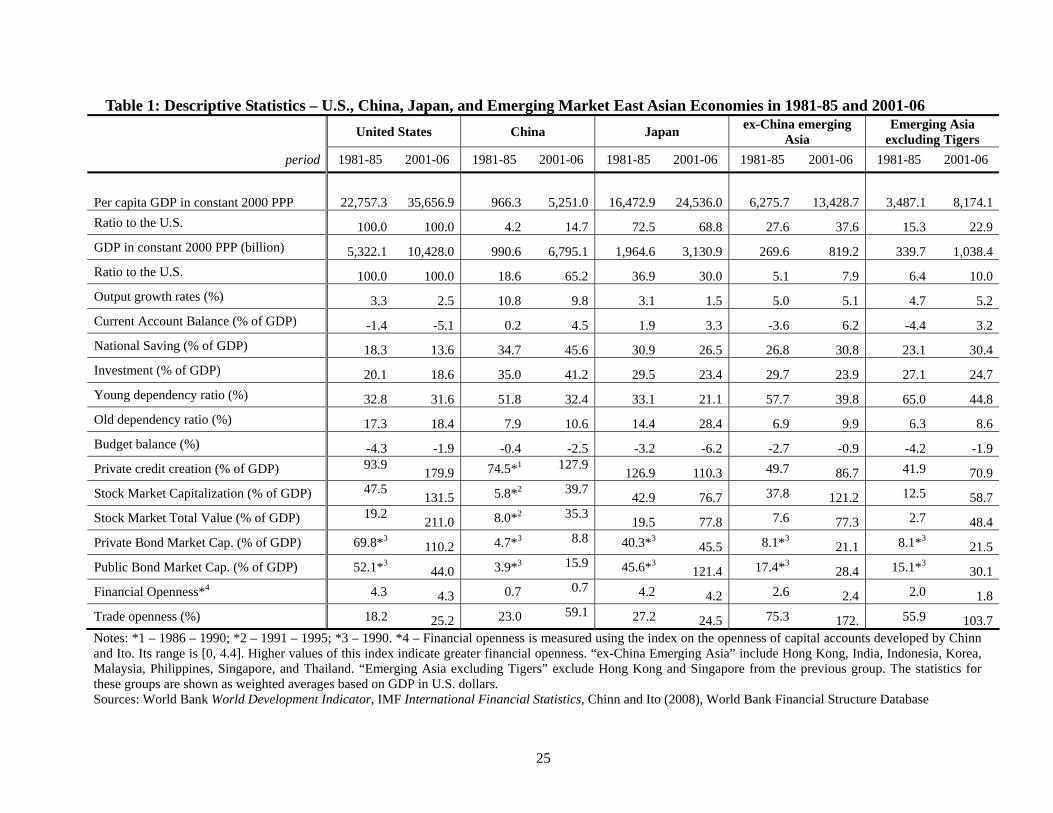
Table 1 presents descriptive statistics of the United States, China, Japan, and other East Asian economies for two time periods, 1981-85 and 2001-06. This table contains the variables that can especially affect the current account, or saving-investment, determination (see Appendix). Let us focus on comparing the economic structure of Japan in 1981-85 with that of China in the 2000s.19
Unsurprisingly, although the size of the Chinese economy in the 2000s is much bigger than that of the Japanese economy during the early 1980s, China is still much less developed on a per capita basis than Japan was in the early 1980s. The output growth rate is quite impressive for the Chinese economy since the 1980s, recalling Japan’s high growth period during the 1960s. In both national saving and investment ratios, the Chinese economy surpasses Japan. The Chinese young-dependency ratio is about the same as that of Japan during the early 1980s, but the current Chinese old-dependency ratio is not close to Japan’s either in the 1980s or at present. However, Feng and Mason (2005) among others point out that China is expected to experience a rapidly aging population.20 Furthermore, Chinese public finance is currently relatively healthy, but is expected to worsen in the near future given the necessity to stimulate its economy out of the current crisis, and more importantly, to develop safety net systems for the economically disadvantaged as well as for the aging population.21
Interestingly, the size of the banking sector, measured by private credit creation (PCGDP) as a ratio to GDP, and that of the equity sector, measured by the stock market capitalization ratio (SMKC), both appear to be about the same between the two economies.22 However, the most important difference between the economies’ financial systems is that China’s banking system is still heavily dominated by state-owned institutions and thereby extremely inefficient because of the long-time government direct control of the industry, whereas Japan’s system was relatively 19 The first half of the decade is chosen for Japan because this is the time before rapid appreciation of the yen starts in 1986. 20 Feng and Mason estimate that the share of population over 64 years old will reach 20 percent among Chinese urban population by 2023. 21 In November 2008, the government announced that it will implement a 4 trillion yuan ($585 billion) stimulus package, followed by another announcement in January 2009 of additional 850 billion yuan to extend the coverage of health insurance over the next three years. 22 However, these statistics need to be observed with a grain of salt. That is, countries in the world have experienced upward-trending development of financial markets over years. The world (weighted) averages of PCGDP and SMKC in 1981-85 are 75.9% and 31.7%, respectively, whereas those in 2001-06 are 120.9% and 89.9%. Therefore, even if the figures are close to each other, it is clear that Japan in the 1980s is more financially developed than China in the current period.

9
healthy and had strong financial markets (especially in terms of capital adequacy) during the 1980s. It has been also claimed that most of the state-owned banks are loaded with high volumes of non-performing loans (NPLs).23
Figure 4-a compares the level of financial development among China, Japan, emerging market economies in East Asia excluding China, and Latin American countries. The measure for financial development is the sum of private credit creation and stock market capitalization (both as ratios to GDP, and we call the variable for the sum SIZE) and is shown as the relative size compared to the United States. The figure shows, again, China’s level of financial development is about the same as Japan’s. However, if the measure of financial development is adjusted for the ratios of government ownership of banks by following the procedure outlined by Bekaert et al. (2006), the size of financial markets, shown as “Adjusted SIZE” in Figure 4-b, for China is merely 12.7% that of the United States in the 2001-06 period, confirming that China still has a long road to financial development.24,25
Lastly, Table 1 also shows that Chinese financial markets are closed as shown by the index for financial openness developed by Chinn and Ito (2006). The index measures how open financial markets are to capital account transactions (ranging from 0 to 4.3); high values indicate more financial openness. According to the index, China has had closed financial markets throughout the time periods, even compared to other emerging market countries in East Asia. Japan, on the other hand, had achieved a relatively high level of financial openness already in the early 1980s. China’s closed financial markets stand out especially considering its high level of trade openness. 3. A Regression Analysis
Although the above section summarized the similarities and differences between Japan during the early 1980s and China at present, many other factors, naturally including those of the United States, affect the current account balances of these countries. Given the complexity of the
23 The volume of NPLs disclosed by Chinese authorities is less than 10% of GDP, but the figure is not well-trusted by western economists, many of whom estimate it to be 30 to 40%. At least, the size of NPLs is argued to be greater than that of Japan during the late 1990s or the U.S. during the S&L crisis (during both of which, the size was around eight to ten percent of GDP). 24 Bekaert et al. take the La Porta et al. (2002) estimates of the ratios of government ownership of banks provided for 92 developed and developing countries for 1970 and 1995. Following Bekaert et al’s method, the “Adjusted SIZE” variable is created by interpolating the ratios of government bank ownership; adjusting the PCGDP variable over the sample period for the government ownership ratios; and reconstructing the SIZE variable. Obviously, this method is not perfect; efforts of privatization are often discrete (e.g., after experiencing a crisis) and also are not necessarily monotonic in movement. 25 Small bond markets can be also seen as evidence for underdevelopment of Chinese financial markets. Chinese bond markets, either private or public, are much more underdeveloped compared to those of Japan during the early 1980s (Table 1). Considering that bond markets development requires higher levels of banking and equity sectors, the Chinese financial markets are still at an earlier stage of development.

10
dynamics of current account balances and saving and investment determination, it is most appropriate and effective to conduct regression analysis, which I am about to do in the following, with focus on investigating whether the Twin Deficit hypothesis or the savings glut hypothesis is more applicable.
The dataset that covers a large and heterogeneous group of countries, 19 industrial countries and 70 developing countries, over the last three decades is used.26 With this dataset, the panel analysis is conducted as below:
( ) ( ) ( )(1)
,,
,,7,,6,,5
,4,3,2,1,
titi
titititititi
tititititi
uXFDKAOPENKAOPENLEGALLEGALFD
KAOPENLEGALFDBudBy
+Γ+
×+×+×+
++++=
βββββββα
where yi,t is either the current account balance, national saving, or investment, all expressed as a share of GDP. BudBi,t is budget balances (as a share of GDP) while FDi,t, LEGALi,t, and KAOPENi,t are measures of financial development, legal and institutional development, and the level of capital account openness. Xi,t contains other control variables of “usual suspects” for current account balances, such as net foreign assets, per capita income, its square, income growth, terms of trade volatility, young- and old-dependency ratios, trade openness, and GDP growth rates. The model is based on Chinn and Prasad (2003) and other theoretical and empirical literature. More careful explanations of these explanatory variables are provided in the Appendix.
Since the primary interest here is medium-term rather than short-term variations in the current account balances, national saving, and investment, the panel contains non-overlapping five-year averages of the explanatory variables for each country (except for net foreign asset that is sampled from the initial year of each five-year period).27 Using a panel of five-year averages can also mitigate the possibility of significant measurement error in annual data, which can be problematic especially with developing-country data.
All the variables to be included in the estimation, except for net foreign assets to GDP, are converted into the deviations from the GDP-weighted world mean before being calculated into the five-year averages. This conversion is made to prevent trends apparent in some of the variables from affecting the estimation, and also to make the estimation consistent with open macro theory that only relative performance of the variables across different markets matters for the determination of cross-border capital flows.
Furthermore, interaction terms, specifically, those between the financial development and
26 The data are drawn from a number of sources, primarily the World Bank’s World Development Indicators, the IMF’s International Financial Statistics, and the databases associated with Beck, et al. (2001). See the Appendix. 27 The 2001-04 period has been compressed into one observation, and so represents only four years instead of the standard five.

11
legal variables (PCGDP times LEGAL), those between the financial development and financial openness variables (PCGDP times KAOPEN), and those between legal development and financial openness (LEGAL times KAOPEN), are included in the estimation. The financial and legal interaction effect is motivated by the conjecture that deepening financial markets might lead to higher saving rates, but the effect might be magnified under conditions of better developed legal institutions. Alternatively, if greater financial deepening leads to a lower saving rate or a lower investment rate, that effect could be mitigated when financial markets are equipped with highly developed legal systems. A similar argument can be applied to the effect of financial openness on current account balances.
Table 2 reports the estimation results for the regressions with the current account, national saving, and investment as dependent variables and for industrialized countries (IDC), less-developed countries (LDC), and emerging market countries (EMG) for each. Only the estimated coefficients of the variables of our focus are reported to conserve space.28
Interestingly, a significantly positive relationship between current account and government budget balances is detected for all the sample groups, bolstering the prediction of the Twin Deficit hypothesis. A one percentage point increase (above the world GDP-weighted average) in the budget balance would lead to a 0.15 percentage point increase in the current account balance for industrialized countries (IDC), 0.17 and 0.23 percentage points for less developed and emerging market countries, respectively.
The national saving regression (Columns 4 through 6) shows that a one percentage point increase in the budget balance leads to a 0.23 percentage point increase in the national saving rate for industrialized countries and a 0.20 percentage point increase for emerging market countries, a contrast with the less-developed countries groups, which yields much smaller and insignificant coefficients.29 With these results, we can surmise that for the IDC and EMG groups, the government budget balance has a non-Ricardian effect on the national saving rate, whereas for the LDC, that is not the case.
One can examine whether the above results are not just driven by cross-country differences, but also by variations within countries’ time series by applying a fixed effects specification. Interestingly, when a fixed effects model is used, the estimated coefficient on the government budget balance rises to 0.38, 0.19, and 0.24 for industrial countries, less-developed countries, and emerging market countries, respectively (all significant at the 1% significance level). The estimated coefficient of the budget balance variable in the national savings regression
28 Estimation results for other variables are available from the author upon request. 29 It is also found that Singapore functions as an outlier for the EMG group, especially for the current account and national saving regressions. When this country is removed from the sample, the magnitude of the estimated coefficient becomes smaller, though not as small as those for the LDC.
12
also rises in both magnitude and statistical significance for both developed and emerging market countries.
One can also suspect simultaneity bias that can arise the possible feedback of the current account balance on government budget balances. To guard against this possibility, a two stage least squares (2SLS) estimation is implemented by instrumenting the budget balance variable with selected variables that are theoretically and empirically considered to be the determinants of the budget balances.30 Furthermore, to mitigate the effect of business cycles, HP-detrended annual series of the variables that exhibit business-cycle variation – namely, the budget balance, net foreign asset, relative income, output growth, and financial deepening (PCGDP) – are also tested using different model specifications such as fixed effects modes and General Least Squares. When these different models with or without different data samples are compared to the results from the above OLS estimation, the magnitudes of the estimates are mostly larger while the degree of statistical significance remains essentially unchanged, or greater. These different models show that a one percent point increase in the budget balance is found to lead to a 0.10 to 0.49 percentage point increase in the current account balances, and a 0.17 to 0.81 percentage point increase in national saving. Thus, we can safely conclude that an improvement in the government budget balance does improve current account balances, especially for industrialized countries, and that the improvement is mainly achieved through an improvement in national saving.
The results on the young- and old-dependency ratios are consistent with the predictions of the life-cycle income hypothesis; the working population saves while the youth and senior population dissave. It is interesting to see that the estimated coefficient on the old dependency ratio is larger in absolute values for developing countries than industrialized countries. Japan’s speed of aging was faster than the world average change in the old-dependency ratio by 3.7 percentage points between the 1991-95 and 2001-04 period (in each five-year period on average).31 This change in the old-dependency ratio alone means a fall in the national saving rate by 1.1 percentage points. However, if China experienced the same speed of aging in a
30 The instruments include the dummy for the left-wing government (LEFT); military spending as a ratio to GDP (MILEXP); yearly changes in unemployment rates (D_U); the interaction term between LEFT and D_U, and regional dummies. While other variables are also tested such as the dummy for countries with plural political systems; government fragmentation (from the Database of Political Institutions by Beck et al. 2001); political constraint, or democracy, index (from Henisz, 2000); and the standard deviation of tax revenues (following Talvi and Vegh, 2005), the variables that turned out to be insignificant in the first-stage regression are dropped from the estimation. The rationale for using these instruments follows the past literature on the determinants of budget balances such as Roubini (1991), Roubini and Sachs (1989a, b), Persson and Tabellini (2001), and Braconier and Holden (2004). 31 Japan’s ratio of the old population change in the two periods, so did the world (weighted) average of it change. Hence, if Japan had changed its old dependency ratio at the same rate as the world average, it would have had no effect on the saving determination. However, in fact, the deviation of the old dependency ratio from the world average increased by 7.3 percentage points between the two periods.

13
five-year period, it would worsen national saving by 2.4 percentage points. Although the effect may not sound too significant given the current high saving rate of China (about 50%), since old dependency does not have a significant impact on investment, the effect on current account can be big. Using the estimates from the current account regression, the same pace of aging alone could deteriorate China’s current account by 1.96 percentage points, which is a significant figure considering the current account surplus level is 4.5% of GDP in the 2001-06 period.
The effect of financial development on saving and investment is noteworthy as well. The saving regression results show that financial development alone may affect national saving significantly and positively for industrialized countries, but insignificantly and negatively for developing countries. In the investment regressions, on the other hand, financial development seems to affect investment positively and uniformly for developed and developing countries, suggesting that further financial deepening may alleviate credit constraints.
Since the financial development variable (PCGDP) is interacted with other institutional variables (LEGAL and KAOPEN), however, we must be careful about the interpretation of the effect of financial development. Panels A in Table 3 shows the total effect on the current account if the level of private credit creation (PCGDP) rises by 10% points above the world weighted average conditional on the levels of LEGAL and KAOPEN, whether their levels are low 10 percentile, mean, or high 10 percentile in each subsample.32,33 For example, the panel for the group of industrialized countries shows that when an industrialized country equipped with both legal development and financial openness levels above the high 10 percentile (i.e., the southeast cell in the matrix) experiences a 10% (relative) increase in financial development, PCGDP, its current account as a ratio to GDP would worsen by a 0.35 percentage point. From this panel, we can generalize that only industrialized countries with low levels of legal development would experience a current account improvement when their financial markets develop regardless of the levels of financial openness. The bottom table reports the total effect of financial development for emerging market countries. For this group of countries, the effect of financial development tends to be bigger for those countries with less open capital accounts and lower levels of legal development. As far as the EMG group is concerned, further financial development would lead to current account deterioration only if a country is equipped with high levels of legal development or with high levels of financial openness (but not with the low 10 percentile level of legal development).
Panels B and C repeat the same exercise for national saving and investment, respectively.
32 The KAOPEN variable is included in the calculation as the average of the 1996-2004 period. 33 Between the 1991-1995 and 2001-2004 time periods, the (five-year average of relative) PCGDP level increased by 20.6 percentage points for industrialized countries, 3.7 percentage points for less developed countries, 8.2 percentage points for Asian emerging market countries, and remarkable 32.4 percentage points for China. Given these figures, a 10% point increase (above the world weighted average) in PCGDP is a plausible scenario.

14
Although the total effects of financial development on saving and investment shown in Panels B and C do not add up strictly to those on current accounts (Panel A) unlike theoretical identity, examining the effects of financial development on national saving and investment and the net effect of the two as a proxy to the effect on current account is insightful.34
Panel B shows that, for less-developed and emerging market countries, the effect of financial development on national saving is smaller for economies with higher levels of legal development and more open financial markets. Especially for those countries with underdeveloped institutional infrastructure where it can be presumed that credit constraints and rationing are severe, the positive impact of further financial deepening on national saving seems to be considerable. However, it also appears that in order for further financial deepening to lead to an increase in investment among developing countries through improved financial intermediation, it is better for countries to be equipped with better legal systems and institutions (Panel C). Interestingly, Bernanke’s prediction that the more developed financial markets are, the less saving a country undertakes seems to be validated only by industrialized countries with high levels of legal development regardless of the openness of financial markets, or emerging market countries with high levels of legal development and financial openness. These results seem to bolster Bernanke’s argument that more financial development will solve the issue of the savings glut in emerging market countries with high levels of both legal development and financial openness. Now, is this finding applicable to emerging market Asian countries?
Panel D of Table 3 categorizes emerging market countries in East Asia depending on the level of legal development and financial openness. The matrix shows that only Hong Kong and Singapore are categorized as countries with highest 10 percentile legal development and highest 10 percentile financial openness, while many Asian emerging market countries are categorized in the groups with the middle or lower level of legal development and financial openness. Figure 5 reports the total effects of a 10 percentage point increase in PCGDP on current account, national savings, and investment for Asian emerging market countries and three industrialized countries, Japan, Germany, and the United Kingdom using actual values for each country’s legal development and financial openness measures.35 According to Figure 5, Hong Kong and Singapore are the only countries for which financial development will cause a negative impact on national saving. Other countries will experience an increase in the ratio of national saving to
34 At least, two issues can be pointed out as the reason for the failure of the identity for the estimated coefficients. First, while the current account regressions account for the covariance of national savings and investment, simply adding two coefficients does not. Second, the data for current account, based on the Balance of Payments accounting definition, and those for national saving and investment, based on the National Income and Product Accounts definition, can be defined in different ways in some countries, making the original current account data not necessarily equal to the difference between national saving and investment. 35 All of the three IDCs belong to the category of middle-level legal development and most open financial markets in the matrix for the industrialized countries (not reported).

15
GDP if financial markets develop further. Interestingly, for all countries, financial development leads to the expansion of investment, presumably because of improved credit conditions and financial intermediation. Furthermore, in terms of the effect on net saving–not necessarily the same as that on the current account–all countries except for Indonesia and the Philippines will experience worsening of net saving as a result of further financial deepening because the magnitude of the effect on investment exceeds that on national saving. China experienced a stunning 32.4 percentage point increase in private credit creation (net of change in the world weighted average). This financial development alone led to an increase in national saving by 1.7 percentage points, but also an increase in investment by 2.4 percentage points, suggesting a negative effect of financial development on net saving, not through a reduction in saving, but through a higher increase in investment than that in saving. Armed with these results, I conclude that financial development reduces the level of current account balances, especially for Asian emerging market countries, but that effect is achieved, not through a reduction in saving rates, but through increased levels of investment.
4. Are the Current Account Imbalances Atypical in the early 1980s and/or the 2000s? What Drives the Imbalances?
We next ask how the patterns of current account imbalances are compared to what can be predicted by the model. Especially, we ask whether the current external imbalances were atypical in the two periods of our interest. And if so, what was driving them? Are they driven by deviations in national saving or investment?
First, we ask these questions for the 1980s episode. For that, out-of-sample predictions are made for the two five-year periods after 1980, using the model employed in the previous section and the data up to 1980.36 This exercise allows us to observe how much the actual current account balances in the post-1980 period differ from what could be predicted using the relationships that were obtained up to 1980. Figure 6 compares the actual values of current account balances, national saving, and investment all as a proportion of GDP with the predicted values of each for the United States and Japan.37
From the figures in the top row, we can observe that for the 1981-85 and 1986-90 periods, the U.S. experienced worse current account balances than is predicted by the model. The unpredicted current account deficit is mainly driven by deterioration of national saving in these
36 Since the time fixed effects for the post-1980 periods are not available, the average of the time effects for the 1971-1980 period is used. Generally, when we examine a subsample, the predicted values will be based on the estimation for that sample group. For example, the predicted values for the group of industrialized countries will be based on the estimation results from the regressions for the subsample, and the predictions for non-industrialized countries will be based on the estimation for EMG subsample, etc. 37 The same exercise is not conducted for China due to data unavailability.

16
periods; although both national saving and investment are lower than was predicted by the model, the underperformance of national saving appears to be more severe than that of investment. Japan, on the other hand, experienced unpredictably better current account balances throughout the post-1980 period. However, the rise in current account surplus during the 1980s is driven mainly by underperformance of investment, rather than over-saving. This finding is consistent with the claim by the United States that Japan did not have enough investment opportunities, though over-saving seems to be more of an issue in the 1991-95 period.
The same exercise is repeated for the 1996-2000 and 2001-04 periods for the United States, Japan, China, and Emerging Asia excluding China, using the estimated coefficients from the regressions implemented over the 1971-95 time periods.
Figure 7 presents a little different picture from Figure 6 for the United States. The actual U.S. current account deficit of the 2001-04 period turns out to be worse than the model prediction by 2.4%. The figures for U.S. national saving and investment show that while the U.S. current account deficit is driven by more-than-expected performance in investment in the 1996-2000 period, the deficit during the 2001-04 period is driven more by “saving drought,” rather than “investment boom.” In the case of Japan (whose figure is omitted to conserve space), as was in the case with the 1980s, Japan kept experiencing larger current account surpluses than was predicted by the model in the post-1995 period. However, unlike the previous case, the over-performance of current account balances in the post-1995 period is attributed to over-saving.38
Over-performance of current account balances is much more apparent for China in the post-1995 period as shown in the bottom of Figure 7. While its investment performed better than was predicted by the model, the outperformance of national saving is much more significant, indicating that the country’s current account surplus is clearly driven by over-saving. Hence, the cause of China’s current account surplus in the 2000s is clearly different from that of Japan’s during the 1980s.
Interestingly, however, the over performance of current account balances for the Asian emerging market group excluding China is a result of the collapse of investment in the aftermath of the Asian crisis. The Asian emerging market countries’ level of national saving is about the same as what is predicted by the model predicts in the post-1995 period, countering the global saving glut argument, but the investment rate for this region has been lower than predicted (by three to four percentage points), especially in the 1996-2000 period, suggesting that East Asia is undergoing an investment drought presumably as a result of the Asian crisis of 1997-98.39 38 Japan’s investment is better than the model prediction in both the 1996-2000 and 2001-04 periods, but its national saving outperformed the model prediction by a much larger degree. 39 This finding is consistent with that of Higgins (2005).

17
5. Concluding Remarks
This paper examined the two U.S. current account deficit episodes, one in the 1980s and the other in the current 2000s, and compared the countries that contributed most to U.S. trade deficits in the two time periods, Japan and China, respectively. Many similarities are found between Japan in the early 1980s and China at present in terms of the way some U.S. policy makers politicize the issue and criticize the surplus countries. In both episodes, U.S. policy makers pointed out the lack of financial development and the closed nature of the financial systems of the current account surplus countries. In return, the current surplus countries criticized the United States for its low saving, particularly, public saving. Hence, both episodes witnessed the debate between the saving glut hypothesis and the twin deficit hypothesis. This paper also found the differences between the two economies in the level of financial development and financial openness; China is expected to experience further financial development and financial opening in the future.
A regression analysis is conducted to examine the medium-term determinants of the current account using a model that controls for institutional factors, such as financial openness and legal development, with a focus on the United States and emerging market countries in Asia.
The regression analysis confirms that budget balances play an important role in the determination of current account balances. Among industrialized countries, a one percentage point increase in the budget balance is found to raise the current account balance by 0.15 percentage point, and this significant effect is also detected for less-developed countries and emerging market countries. Furthermore, this study found evidence that the oft-cited argument about the effect of financial and legal development as well as financial liberalization is only applicable to a group of countries with high levels of legal development and financial openness, such as industrialized countries and high income emerging market economies such as Hong Kong and Singapore. This suggests that the policy recommendations made by the global saving glut proponents have only a tenuous empirical basis insofar as they relate to East Asia.
It was also found that the Japanese current account surplus in the early 1980s was not driven by over-saving, contrary to the argument presented at the time, but by underperformance of investment whereas the country’s current account surplus in the 2000s was found to be driven by over-saving. The United States has been experiencing a saving drought throughout the last two decades, and that is the main reason for its current account deficit. Although the recent current Chinese current account surplus is driven by its over-saving, among the East Asian emerging market countries (excluding China), saving is not found to be excessive. Rather, these countries have experienced a shortfall in investment in the post-Asian crisis period.
So, what do all these findings mean? First, as was spelled out in the APEC Finance Ministers Joint Ministerial Statement in September 2006, it is a “shared responsibility” of the

18
countries on both sides of the Pacific Ocean, i.e., the United States and East Asian economies, to take “joint action towards an orderly readjustment of global imbalances”; while East Asian economies can develop financial infrastructure in the region, it is necessary for the United States to do its own homework, i.e., reduce the budget deficit. This study showed that improving the budget balance can affect current account balances.40
Second, when China, and other East Asian countries experience further financial development and financial opening, it cannot be expected that these countries will experience a decline in the saving rate. As we show, financial development will lead these countries to experience a further rise in the saving rate, not a decline as discussed by the saving glut proponents.
Third, while further financial development cannot be expected to lead to an decrease in the saving rate or current account, it will lead to more investment, which would contribute to a decline in the current account surplus for these countries. The shared work on the Asian side should also include encouragement for absorption, namely more consumption and investment in the region. For China, which already has high levels of investment, this means that the country needs to invest more in education, improvements in infrastructure and sanitary conditions in the rural areas, and safety nets for the economically disadvantaged and for the aging population. For other East Asian countries, they need to regain the investment that has plunged since the Asian crisis. Investment expansion in the Asian region could lead to establishment of the recycling system for the region’s current account surpluses, especially those of China.
Lastly, the United States and Japan need to be prepared for the significant change in the direction of capital flows in the region. Correcting global imbalances for the United States means that capital inflows to the country will most likely decline, which can have a significant impact on U.S. financial markets. On the other side of the Pacific Ocean, China may experience what Japan experienced in the aftermath of the Plaza Accord of 1985. That is, further appreciation of the renminbi is most likely to raise Chinese labor costs, and along with financial development and financial opening, that can lead to China’s capital flowing to the rest of the Asian region (just as Japanese FDI increased in the rest of Asia). This trend will be supported as China’s industrial structure becomes more capital- and/or technology-intensive, while increasingly outsourcing labor-intensive industries abroad. Furthermore, Japan’s demographical change and further financial opening and development may also lead the country to become a capital importer. At the very least, policy makers in these countries need to be prepared for tidal changes in the
40 In fact, in June 2006, the IMF has launched the Multilateral Consultation on Global Imbalances to provide a platform for the countries that are a direct party to the existing global imbalances to discuss corrective measures fort the global imbalances. Five countries and regions are the participants: China, the euro area, Japan, Saudi Arabia (to represent oil exporting countries), and the United States. The progress made by the participant countries is occasionally reported by the IMF.

19
regional capital flows.

20
Appendix: Determinants of Current Account Balances, National Saving, and Investment Macroeconomic Factors
Net foreign assets: From an intertemporal perspective, the stock of net foreign assets (NFA) serves as an important initial condition, given that the current account is the sum of the trade balance and the return on a country’s stock of NFA (or payment on its net foreign liabilities position). Alternatively, from a buffer stock savings perspective, higher levels of initial net foreign assets should be associated with subsequent lower current account balances.
Government budget balances: A variety of models predict a positive relationship between government budget balances and current accounts over the medium term. In the absence of a full Ricardian offset via private saving, an increase in the government budget balance could lead to an increase in national saving. In developing economies, where a greater proportion of agents may be liquidity constrained, this relationship might be expected to be more pronounced.
Relative income: The “stages of development” hypothesis for the balance of payments suggests that countries, as they move from a low to an intermediate stage of development, typically import capital and, therefore, run current account deficits. As they reach an advanced stage of development, countries run current account surpluses in order to pay off accumulated external liabilities and also to export capital to less advanced economies.
Demographics: Based on the life-cycle income hypothesis, working population is the savers while the youth and senior population is dissavers. Masson et al. (1998) and among many others show that the dependency ratio is one of the key determinants of private saving.
Uncertainty: Terms of trade volatility is another potential determinant of medium-term fluctuations in current accounts. Agents in economies that face more volatile terms of trade might save more for precautionary reasons in order to smooth their consumption streams in the face of volatile income flows.
Trade Openness: Country characteristics that reflect macroeconomic policies could also be relevant for current account determination. The degree of openness to international trade could reflect policy choices, including tariff regimes.
Growth Rates: Countries with high labor productivity growth may attract more capital inflows with higher expected rates of returns in their asset markets, as has been argued to be the case with the U.S. whose buoyant labor productivity growth may have been the main cause of the recent rise in current account deficits. Real output growth rates can be used as a proxy to productivity growth in a regression exercise.
These macro data are drawn primarily from the World Bank’s World Development Indicators, the IMF’s International Financial Statistics and the World Economic Outlook database. The measure of net foreign asset is extracted from Lane and Milesi-Ferretti (2006). Institutional Factors
Financial Development/Deepening: There are at least two conflicting predictions on the effect of financial development on saving. One is the “financial deepening” argument, and the other is the precautionary saving argument. The financial deepening argument [emphasized by Edwards (1996)] is that further financial development, often proxied by the ratio of a monetary aggregate such as M2 to GDP, also means the depth and sophistication of the financial system so that financial deepening could induce more saving. The precautionary saving

21
argument is that more developed financial markets lessen the need for precautionary saving, and thereby lower the savings rate. The global savings glut argument presented by Bernanke (2005) and Clarida (2005) is based on this view; less sophisticated financial markets motivate people to save for precautionary reasons. Conversely, the sophisticated equity markets in the U.S. absorb excess saving from all over the world, leading to higher current account deficits. For the measure of financial development, private credit to GDP (PCGDP) from the World Bank’s Financial Structure Dataset (Beck, et al., 2001 and subsequent updates) is used primarily for data availability reasons.
Financial Openness: The degree of a country’s capital account openness should also affect capital flows across countries, and therefore the current account. Countries with open financial markets could allow agents to export excess saving to or import it from countries with developed financial markets such as the U.S. Thus, the openness of financial markets should influence countries’ current account balances via the impact on saving and investment decisions. The Chinn-Ito (2006) index (KAOPEN) is used to measure the degree of financial openness. This index is the first principle component of the binary variables pertaining to cross-border financial transactions based upon the IMF’s Annual Report on Exchange Arrangements and Exchange Restrictions (AREAER). Higher values of this index indicate greater financial openness. Greater detail about the construction of this index can be found in Chinn and Ito (2008). The data are available at http://web.pdx.edu/~ito/.
Legal/Institutional Development: A society’s legal foundations and institutions define the context wherein financial transactions and economic decisions are made. Whether the legal system clearly establishes law and order, minimizes corruption, or whether the administrative branch of the government protects property rights efficiently are all important determinants of the incentives to save and invest. Decisions by foreign residents will also be affected. The variable LEGAL is used to incorporate the effect of legal and institutional development, which is the first principal component of law and order (LAO), anti-corruption measures (CORRUPT), and bureaucracy quality (BQ). Higher values indicate better conditions. The data series are available from ICRG for the period of 1984 through 2004, but are included in the regression as the period-average.

22
References
Asia-Pacific Economic Cooperation (APEC), 2006. 13th APEC Finance Ministers' Meeting Joint Ministerial Statement, September 7-8, Ha Noi, Viet Nam.
Beck, T., Clarke, G., Groff, A., Keefer, P., Walsh, P., 2001, New Tools in Comparative Political Economy: The Database of Political Institutions. The World Bank Economic Review Vol. 15, No. 1 p.165-176.
Beck, T., A. Demirgüc-Kunt, and R. Levine, 2001. “A new database on financial development and structure” in Demirgüc-Kunt, A., and Levine, R. (Eds.) Financial Structure and Economic Growth: A Cross-Country Comparison of Banks, Markets, and Development, Cambridge, MA: MIT Press.
Bekaert, G., Harvey, C. R., Lundblad, C. 2006. “Financial Openness and the Chinese Growth Experience.” mimeo.
Bergsten, F. and M. Noland, 1993. Reconcilable Differences? United States-Japan Economic Conflict, Washington, D.C.: Peterson Institute for International Economics.
Bernanke, B., 2005. “The Global Saving Glut and the U.S. Current Account,” Remarks at the Sandridge Lecture, Virginia Association of Economics, Richmond, VA, March 10.
Braconier, H. Holden, S., 2004. Fiscal Policy in the OECD: Measurement and Cyclical Adjustment, mimeo.
Cheung, Y.W. and H. Ito, 2007. “Cross-sectional analysis on the determinants of international reserves accumulation.” Mimeo, University of California, Santa Cruz.
Cheung, Y.W., M. D. Chinn, and E. Fujii, 2009. “China’s Current Account and Exchange Rate.” NBER Working Paper #14673 (January).
Cheung, Y.W., M. D. Chinn, and E. Fujii, 2007. “The Overvaluation of Renminbi Undervaluation,” Journal of International Money and Finance. Volume 26, Issue 5, September, p. 762-785.
Chinn, M. D., 2005. “Getting Serious about the Twin Deficits,” Council Special Reports No. 8. Chinn, M. Prasad, E. 2003. Medium-Term Determinants of Current Accounts in Industrial and
Developing Countries: An Empirical Exploration. Journal of International Economics 59(1) (January): 47-76. Also NBER Working Paper #7581 (March 2000).
Chinn, M. D. and H. Ito, 2006, “What Matters for Financial Development? Capital Controls, Institutions, and Interactions,” Journal of Development Economics, Vol. 82, p. 163 – 192, also NBER Working Paper #11370 (November 2005).
Clarida, R. 2005a. “Japan, China, and the U.S. Current account deficit,” CATO Journal, Vol. 25, No. 1 (Winter)
Clarida, R., 2005b. “Some Thoughts on ‘The Sustainability and Adjustment of Global Current Account Imbalances,’” speech given at the Council on Foreign Relations, March 28.
Cline, W. R. and J. Williamson, 2008. “Estimates of the Equilibrium Exchange Rate of the Renminbi: Is There a Consensus and If Not, Why Not?” In Goldstein, M. and N. R. Lardy, Eds. Debating China’s Exchange Rate Policy, Washington, D.C.: Peterson Institute for International Economics.
Congressional Budget Office, 2005. “Economic Relationships between the United States and China – Before the Committee on Ways and Means, U.S. House of Representatives,” April 14.
Dunaway, S. L. Leigh, and X. Li, 2006. “How Robust Are Estimates of Equilibrium Real

23
Exchange Rate for China?” IMF Working Paper 06/220 (October). Washington, D.C.: International Monetary Fund.
Edwards, S., 2005. “Is the U.S. Current Account Deficit Sustainable? And if not, How Costly Is Adjustment Likely to be?” NBER Working Paper #11541 (August).
____________ , 1996. “Why Are Latin America’s Saving Rates So Low: An International Comparative Analysis,” Journal of Development Economics, Vol. 51.
Feng, W. and A. Mason, 2005. “Population Aging in China: Challenges, Opportunities, and Institutions,” Population in China at the Beginning of the 21st Century, edited by Zhongwei Zhao, Oxford University Press.
Frankel, J., 1994. “The Making of Exchange Rate Policy in the 1980s,” in American Economic Policy in the 1980s, edited by Martin Feldstein, University of Chicago Press, Chicago, 1994, pp. 293-341.
Glick, R. and M. Hutchison, 2008. “Navigating the Trilemma: Capital Flows and Monetary Policy in China,” mimeo, University of California, Santa Cruz.
Greenspan, A., 2005. “Current Account,” at Advancing Enterprise 2005 Conference, London, England, February 4.
Henisz, W., 2000. The Institutional Environment for Economic Growth. Economics and Politics, 12(1): p. 1 – 31.
Higgins, M., 2005. “The Global Investment Slump and the U.S. Current Account Deficit,” mimeo (NY: Federal Reserve Bank of New York, August).
Hubbard, R. G., 2005. “A Paradox of Interest,” Wall Street Journal, June 23. Hufbauer, G. C. and C. Brunel, 2008. “The U.S. Congress and the Chinese Renminbi,” In
Goldstein, M. and N. R. Lardy, Eds. Debating China’s Exchange Rate Policy, Washington, D.C.: Peterson Institute for International Economics.
International Monetary Fund, 2005. “Chapter 2: Global Imbalances: A Saving and Investment Perspective,” World Economic Outlook (Washington, DC: IMF, September).
Jeanne , O. and R. Ranciere. 2006. “The Optimal Level of International Reserves for Emerging
Market Economies: Formulas and Applications,” IMF Working Paper WP/06/229.
La Porta, R., Lopez-de-Silanes, F., Shleifer, A. 2002. “Government Ownership of Banks.” Journal of Finance, Vol. 57, No. 1 (February), p. 265-301.
Lane, P., Milesi-Ferretti, G. M. 2006. The External Wealth of Nations Mark II: Revised and Extended Estimates of Foreign Assets and Liabilities, 1970 - 2004. IMF Working Paper, WP/06/69.
Masson, P., T. Bayoumi and H. Samiei, 1998. “International Evidence on the Determinants of Private Saving”, The World Bank Economic Review, Vol. 12, No. 3: p. 483 – 501.
Nakamura, T., 1994. Lectures on Modern Japanese Economic History 1926 – 1994, Tokyo: LTCB International Library Selection.
Persson, T. Tabellini, G., 2001. Political Institutions and Policy Outcomes: What are the Stylized Facts? CESifo Working Paper Series No. 459, April.
Prasad, E. S., 2008. “Monetary Policy Independence, the Currency Regime, and the Capital Account in China. In Goldstein, M. and N. R. Lardy, Eds. Debating China’s Exchange Rate Policy, Washington, D.C.: Peterson Institute for International Economics.

24
Roubini, Nouriel. 2008. “Will the Bretton Woods (BW2) Regime Collapse Like the Original Bretton Woods Regime Did? The Coming End Game of BW2. mimeo. RGE Monitor (July 6).
Roubini, N., 1991. Economic and Political Determinants of Budget Deficits in Developing Countries. Journal of International Money and Finance, Vol. 10, S49-S72.
Roubini, N. Sachs, J. D., 1989a. Political and Economic Determinants of Budget Deficits in the Industrial Democracies. European Economic Review, Vol. 33, 903-938.
Roubini, N. Sachs, J. D. 1989b. Government Spending and Budget Deficits in the Industrial Countries. Economic Policy, Vol. 8, 99-132.
Talvi, E. Vegh, C., 2005. Tax Base Variability and Procylicality of Fiscal Policy. Journal of Development Economics, 78 (2005):156–90.
25
Table 1: Descriptive Statistics – U.S., China, Japan, and Emerging Market East Asian Economies in 1981-85 and 2001-06 United States China Japan ex-China emerging
Asia Emerging Asia
excluding Tigers period 1981-85 2001-06 1981-85 2001-06 1981-85 2001-06 1981-85 2001-06 1981-85 2001-06
Per capita GDP in constant 2000 PPP 22,757.3 35,656.9 966.3 5,251.0 16,472.9 24,536.0 6,275.7 13,428.7 3,487.1 8,174.1 Ratio to the U.S. 100.0 100.0 4.2 14.7 72.5 68.8 27.6 37.6 15.3 22.9 GDP in constant 2000 PPP (billion) 5,322.1 10,428.0 990.6 6,795.1 1,964.6 3,130.9 269.6 819.2 339.7 1,038.4 Ratio to the U.S. 100.0 100.0 18.6 65.2 36.9 30.0 5.1 7.9 6.4 10.0 Output growth rates (%) 3.3 2.5 10.8 9.8 3.1 1.5 5.0 5.1 4.7 5.2 Current Account Balance (% of GDP) -1.4 -5.1 0.2 4.5 1.9 3.3 -3.6 6.2 -4.4 3.2 National Saving (% of GDP) 18.3 13.6 34.7 45.6 30.9 26.5 26.8 30.8 23.1 30.4 Investment (% of GDP) 20.1 18.6 35.0 41.2 29.5 23.4 29.7 23.9 27.1 24.7 Young dependency ratio (%) 32.8 31.6 51.8 32.4 33.1 21.1 57.7 39.8 65.0 44.8 Old dependency ratio (%) 17.3 18.4 7.9 10.6 14.4 28.4 6.9 9.9 6.3 8.6 Budget balance (%) -4.3 -1.9 -0.4 -2.5 -3.2 -6.2 -2.7 -0.9 -4.2 -1.9 Private credit creation (% of GDP) 93.9 179.9 74.5*1 127.9 126.9 110.3 49.7 86.7 41.9 70.9 Stock Market Capitalization (% of GDP) 47.5 131.5 5.8*2 39.7 42.9 76.7 37.8 121.2 12.5 58.7 Stock Market Total Value (% of GDP) 19.2 211.0 8.0*2 35.3 19.5 77.8 7.6 77.3 2.7 48.4 Private Bond Market Cap. (% of GDP) 69.8*3
110.2 4.7*3 8.8 40.3*345.5 8.1*3
21.1 8.1*3 21.5 Public Bond Market Cap. (% of GDP) 52.1*3
44.0 3.9*3 15.9 45.6*3121.4 17.4*3
28.4 15.1*3 30.1 Financial Openness*4 4.3 4.3 0.7 0.7 4.2 4.2 2.6 2.4 2.0 1.8 Trade openness (%) 18.2 25.2 23.0 59.1 27.2 24.5 75.3 172. 55.9 103.7 Notes: *1 – 1986 – 1990; *2 – 1991 – 1995; *3 – 1990. *4 – Financial openness is measured using the index on the openness of capital accounts developed by Chinn and Ito. Its range is [0, 4.4]. Higher values of this index indicate greater financial openness. “ex-China Emerging Asia” include Hong Kong, India, Indonesia, Korea, Malaysia, Philippines, Singapore, and Thailand. “Emerging Asia excluding Tigers” exclude Hong Kong and Singapore from the previous group. The statistics for these groups are shown as weighted averages based on GDP in U.S. dollars. Sources: World Bank World Development Indicator, IMF International Financial Statistics, Chinn and Ito (2008), World Bank Financial Structure Database

26
Table 2: Current Account, National Saving, and Investment Regressions, 1971 – 2004
Dependent variable: Five-year average of Current Account (% of GDP)
Five-year average of National Saving (% of GDP)
Five-year average of Investment (% of GDP)
(1) (2) (3) (4) (5) (6) (7) (8) (9) IDC LDC EMG IDC LDC EMG IDC LDC EMG Gov’t budget balance 0.154 0.168 0.23 0.233 0.094 0.204 0.093 -0.082 -0.137 [0.095]* [0.079]** [0.075]*** [0.096]** [0.062] [0.079]** [0.081] [0.049]* [0.063]** Net foreign assets (initial) 0.069 0.047 0.041 0.059 0.054 0.052 0.004 -0.005 -0.001 [0.011]*** [0.005]*** [0.009]*** [0.011]*** [0.007]*** [0.010]*** [0.007] [0.004] [0.009] Young dependency ratio -0.027 -0.076 -0.044 -0.365 -0.173 -0.108 -0.393 -0.046 -0.062 [0.082] [0.022]*** [0.023]* [0.076]*** [0.025]*** [0.028]*** [0.062]*** [0.021]** [0.026]** Old dependency ratio 0.099 -0.368 -0.529 -0.305 -0.793 -0.668 -0.419 -0.245 -0.111 [0.098] [0.096]*** [0.127]*** [0.100]*** [0.122]*** [0.173]*** [0.071]*** [0.106]** [0.135] Financial Develop. (PCGDP) 0.01 -0.043 -0.082 0.041 -0.02 -0.027 0.041 0.067 0.054 [0.012] [0.032] [0.038]** [0.015]*** [0.042] [0.043] [0.008]*** [0.034]** [0.038] Legal development (LEGAL) 0.002 -0.017 -0.018 0.006 -0.03 -0.027 0.001 0.009 -0.01 [0.007] [0.008]** [0.010]* [0.007] [0.010]*** [0.015]* [0.005] [0.009] [0.014] PCGDP x LEGAL -0.035 -0.021 -0.037 -0.04 -0.032 -0.037 -0.016 0.018 0.002 [0.015]** [0.011]* [0.016]** [0.016]** [0.015]** [0.020]* [0.010] [0.012] [0.018] Financial open. (KAOPEN) -0.002 0.002 0.008 -0.015 -0.01 0.006 -0.01 -0.016 -0.01 [0.003] [0.007] [0.010] [0.004]*** [0.008] [0.011] [0.003]*** [0.007]** [0.008] KAOPEN x LEGAL 0.012 0.002 0.005 0.011 -0.002 0.001 -0.006 -0.002 -0.004 [0.003]*** [0.002] [0.003] [0.003]*** [0.003] [0.004] [0.003]** [0.002] [0.003] KAOPEN x PCGDP 0.002 0 -0.002 0.007 -0.004 -0.002 -0.005 -0.017 -0.008 [0.009] [0.007] [0.009] [0.011] [0.008] [0.011] [0.008] [0.007]** [0.009] Observations 126 345 203 126 344 203 126 344 203 Adjusted R-squared 0.55 0.46 0.51 0.66 0.67 0.67 0.75 0.55 0.65 Robust standard errors in brackets, * significant at 10%; ** significant at 5%; *** significant at 1% The estimated coefficients for the other variables including the time-fixed dummies and constant are not shown.

27
Table 3: Total Effects of a 10% increase in Financial Development (PCGDP) conditional on legal development and financial openness
A. Current Account KAOPEN [0, 4.38]
Industrialized countries Low 10 percentile
(3.55)
Mean (4.22)
High 10 percentile
(4.38) Low
10 percentile (4.37) 0.365 0.379 0.382
Mean (5.69) -0.095 -0.082 -0.079
LEGAL [0, 6.51]
High 10 percentile (6.47) -0.370 -0.357 -0.354
KAOPEN [0, 4.38]
Less developed countries Low 10 percentile
(0.66)
Mean (1.82)
High 10 percentile
(4.08) Low
10 percentile (1.15) 0.408 0.408 0.408
Mean (2.48) 0.127 0.127 0.127
LEGAL [0, 6.51]
High 10 percentile (3.89) -0.167 -0.167 -0.167
KAOPEN [0, 4.38]
Emerging market countries Low 10 percentile
(0.66)
Mean (1.90)
High 10 percentile
(3.96) Low
10 percentile (1.66) 0.528 0.503 0.462
Mean (2.96) 0.058 0.033 -0.008
LEGAL [0, 6.51]
High 10 percentile (4.50) -0.523 -0.548 -0.589
NOTE: The tables show the total effect on current account (Panel A) and national saving (Panel B) if the level of PCGDP rises by 10% points (above the world weighted average) conditional on whether the levels of LEGAL and KAOPEN are low 10 percentile, mean, or high 10 percentile in each subsample.
B. National Saving KAOPEN [0, 4.38]
Industrialized countries Low 10 percentile
(3.55)
Mean (4.22)
High 10 percentile
(4.38) Low
10 percentile (4.37) 0.606 0.653 0.664
Mean (5.69) 0.079 0.127 0.137
LEGAL [0, 6.51]
High 10 percentile (6.47) -0.235 -0.187 -0.177
KAOPEN [0, 4.38]
Less developed countries Low 10 percentile
(0.66)
Mean (1.82)
High 10 percentile
(4.08) Low
10 percentile (1.15) 1.257 1.210 1.120
Mean (2.48) 0.828 0.782 0.691
LEGAL [0, 6.51]
High 10 percentile (3.89) 0.380 0.333 0.243
KAOPEN [0, 4.38]
Emerging market countries Low 10 percentile
(0.66)
Mean (1.90)
High 10 percentile
(3.96) Low
10 percentile (1.66) 1.106 1.081 1.040
Mean (2.96) 0.636 0.611 0.570
LEGAL [0, 6.51]
High 10 percentile (4.50) 0.055 0.031 -0.011

28
(continued) C. Investment
KAOPEN [0, 4.38] Industrialized countries Low
10 percentile (3.55)
Mean (4.22)
High 10 percentile
(4.38) Low
10 percentile (4.37) 0.612 0.579 0.571
Mean (5.69) 0.402 0.368 0.360
LEGAL [0, 6.51]
High 10 percentile (6.47) 0.276 0.242 0.235
KAOPEN [0, 4.38]
Less developed countries Low 10 percentile
(0.66)
Mean (1.82)
High 10 percentile
(4.08) Low
10 percentile (1.15) 0.713 0.515 0.131
Mean (2.48) 0.954 0.756 0.372
LEGAL [0, 6.51]
High 10 percentile (3.89) 1.206 1.009 0.624
KAOPEN [0, 4.38]
Emerging market countries Low 10 percentile
(0.66)
Mean (1.90)
High 10 percentile
(3.96) Low
10 percentile (1.66) 0.829 0.729 0.565
Mean (2.96) 0.854 0.755 0.590
LEGAL [0, 6.51]
High 10 percentile (4.50) 0.886 0.786 0.621
NOTE: The tables show the total effect on investment if the level of PCGDP rises by 10% points (above the world weighted average) conditional on whether the levels of LEGAL and KAOPEN are low 10 percentile, mean, or high 10 percentile in each subsample.
D: Matrix for Emerging Asia KAOPEN
Low 10 percentile
(0.66)
Mean (1.90)
High 10 percentile
(3.96)
Low 10 percentile
(1.66) Bangladesh
Indonesia, Philippines, Sri Lanka
Mean (2.93) China
India, Korea, Malaysia, Thailand,
ex-China EA
LEGAL
High 10 percentile
(4.50)
Hong Kong,Singapore
NOTE: The panel categorizes emerging market countries in East Asia depending on the level of legal development and financial openness.

29
Figure 1: Current Account Balances for U.S. and Major Countries and Region
1980 – 2007 -.1
-.05
0.0
5.1
1980 1985 1990 1995 2000 2005Year
U.S. ChinaJapan EURO countriesEmerging Asia, ex-China
Note: Group averages are weighted based on US-dollar GDP
Current Account Balances (% of GDP)
Sources: International Financial Statistics, World Development Indicator, author calculation
Figure 2: Current Account Balances and International Reserve Holdings: Japan and China, 1980 – 2007
Sources: International Financial Statistics, World Development Indicator
-6-4-202468
1012
1980 1985 1990 1995 2000 2005
02004006008001,0001,2001,4001,6001,800
China Total reserves (includes gold, current US$) Japan Total reserves (includes gold, current US$)China Current account balance (% of GDP) Japan Current account balance (% of GDP)
% of GDP $ Billion

30
Figure 3: U.S. Budget Balances and Current Account Balances (% of GDP), 1980 – 2007
Sources: World Economic Outlook, International Financial Statistics
-7
-6
-5
-4
-3
-2
-1
0
1
2
3
1980 1985 1990 1995 2000 2005
budget balanceCA balance
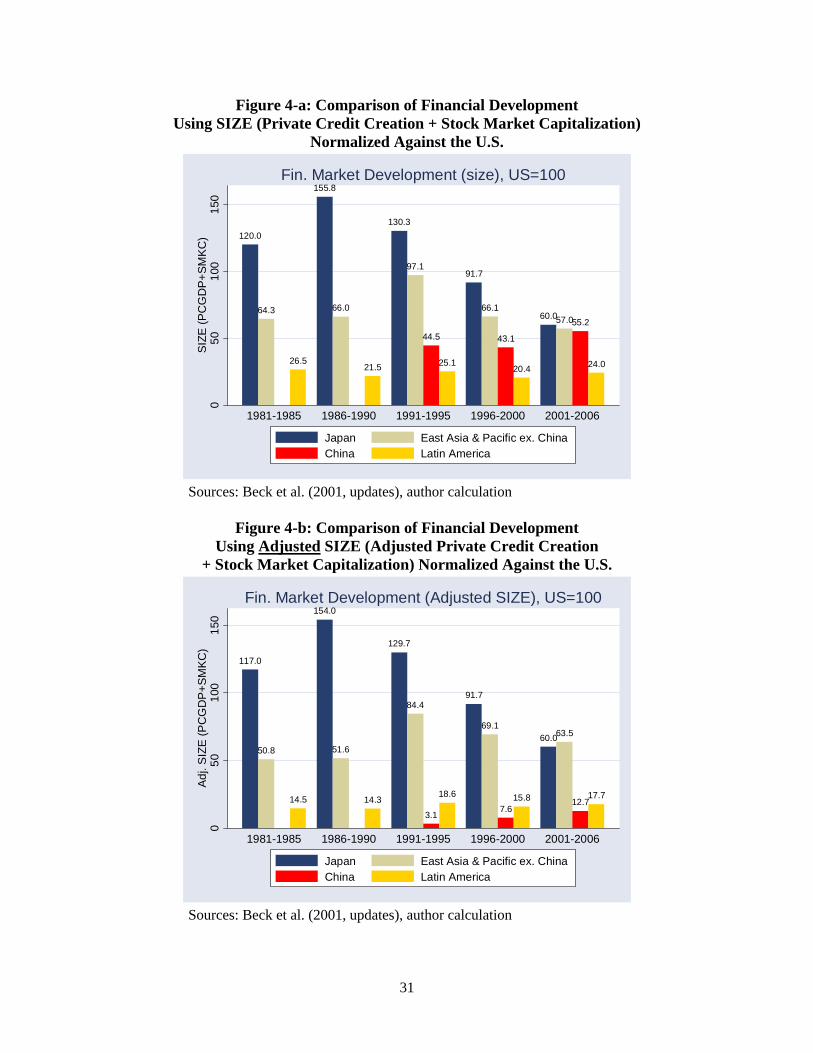
31
Figure 4-a: Comparison of Financial Development Using SIZE (Private Credit Creation + Stock Market Capitalization)
Normalized Against the U.S.
120.0
64.3
26.5
155.8
66.0
21.5
130.3
97.1
44.5
25.1
91.7
66.1
43.1
20.4
60.057.055.2
24.0
050
100
150
SIZ
E (P
CG
DP
+SM
KC
)
1981-1985 1986-1990 1991-1995 1996-2000 2001-2006
Fin. Market Development (size), US=100
Japan East Asia & Pacific ex. ChinaChina Latin America
Sources: Beck et al. (2001, updates), author calculation
Figure 4-b: Comparison of Financial Development
Using Adjusted SIZE (Adjusted Private Credit Creation + Stock Market Capitalization) Normalized Against the U.S.
117.0
50.8
14.5
154.0
51.6
14.3
129.7
84.4
3.1
18.6
91.7
69.1
7.615.8
60.063.5
12.717.7
050
100
150
Adj
. SIZ
E (P
CG
DP
+SM
KC
)
1981-1985 1986-1990 1991-1995 1996-2000 2001-2006
Fin. Market Development (Adjusted SIZE), US=100
Japan East Asia & Pacific ex. ChinaChina Latin America
Sources: Beck et al. (2001, updates), author calculation

32
Figure 5: Effects of a 10% Change in Financial Development (PCGDP) on Current Accounts, Saving, and Investment, IDC and Emerging Asia
-1.00
-0.50
0.00
0.50
1.00
1.50
Effect on CA Effect on NS Effect on I
Effect on CA -0.12 0.02 -0.13 -0.03 0.01 -0.66 0.04 0.61 -0.20 -0.26 0.52 -0.91 -0.12 0.04
Effect on NS 0.20 0.35 0.18 0.29 0.53 -0.11 0.56 1.15 0.33 0.27 1.04 -0.36 0.40 0.56
Effect on I 0.27 0.34 0.27 0.32 0.74 0.48 0.73 0.51 0.71 0.65 0.61 0.51 0.67 0.67
Germany
Japan U.K.ex-G3IDC
ChinaHongKong
IndiaIndonesi
aKorea
Malaysia
Philippines
Singapore
Thailandex-
ChinaAsian
Source: author calculation

33
Figure 6: Out-of-sample Predictions of Current Accounts, using the Estimates based on the Data up to 1980
(a) United States
-.06
-.05
-.04
-.03
-.02
-.01
0.0
1.0
2
1971-1975 1976-1980 1981-1985 1986-1990 1991-1995period
Current Account % of GDP Predicted Current Account(%)
U.S. Current Account
.1
2.1
3.1
4.1
5.1
6.1
7.1
8.1
9.2
.21
.22
1971-1975 1976-1980 1981-1985 1986-1990 1991-1995period
Nat'l Saving % of GDP Predicted Nat'l Saving (%)
U.S. National Saving
.14
.15
.16
.17
.18
.19
.2.2
1.2
2.2
3.2
4
1971-1975 1976-1980 1981-1985 1986-1990 1991-1995period
Investment % of GDP Pred. Investment(%)
U.S. Investment
(b) Japan
-.05
-.04-
.03-
.02-
.01
0.0
1.0
2.0
3.0
4.0
5
1971-1975 1976-1980 1981-1985 1986-1990 1991-1995period
Current Account % of GDP Predicted Current Account(%)
Japan's Current Account
.28
.29
.3.3
1.3
2.3
3.3
4.3
5.3
6.3
7.3
8
1971-1975 1976-1980 1981-1985 1986-1990 1991-1995period
Nat'l Saving % of GDP Predicted Nat'l Saving (%)
Japan's National Saving
.28
.29
.3.3
1.3
2.3
3.3
4.3
5.3
6.3
7.3
8
1971-1975 1976-1980 1981-1985 1986-1990 1991-1995period
Investment % of GDP Pred. Investment(%)
Japan's Investment
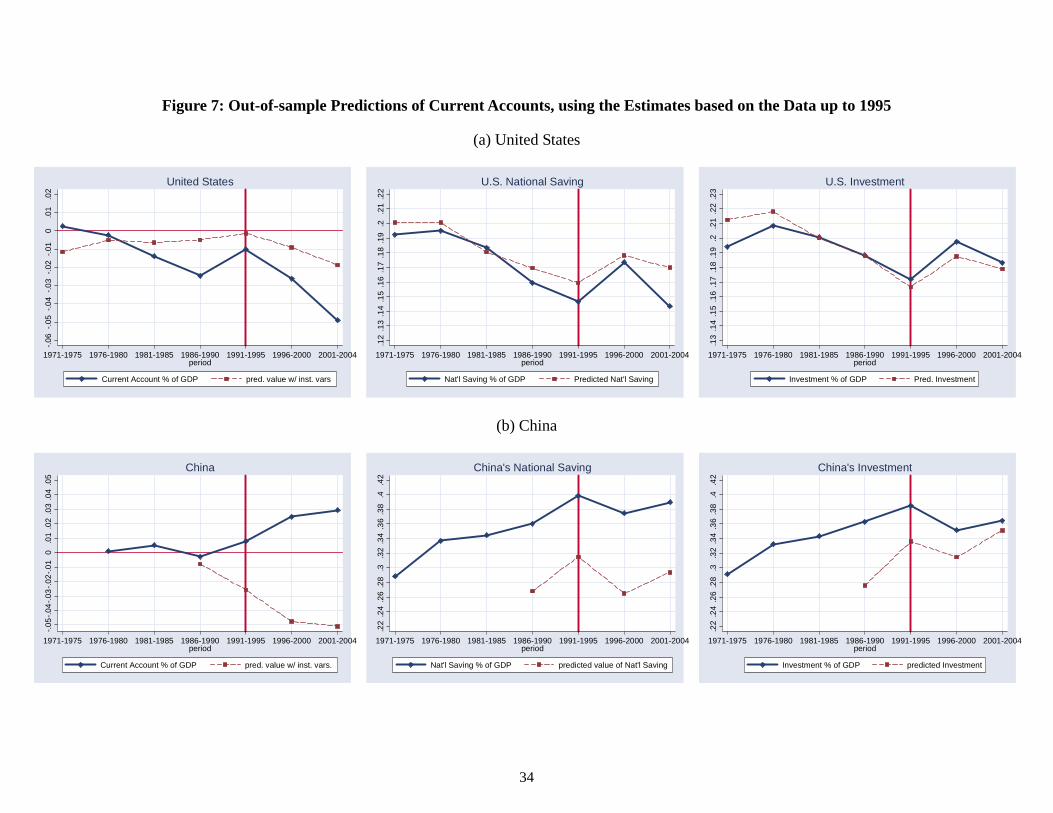
34
Figure 7: Out-of-sample Predictions of Current Accounts, using the Estimates based on the Data up to 1995
(a) United States
-.06
-.05
-.04
-.03
-.02
-.01
0.0
1.0
2
1971-1975 1976-1980 1981-1985 1986-1990 1991-1995 1996-2000 2001-2004period
Current Account % of GDP pred. value w/ inst. vars
United States
.1
2.1
3.1
4.1
5.1
6.1
7.1
8.1
9.2
.21
.22
1971-1975 1976-1980 1981-1985 1986-1990 1991-1995 1996-2000 2001-2004period
Nat'l Saving % of GDP Predicted Nat'l Saving
U.S. National Saving
.13
.14
.15
.16
.17
.18
.19
.2.2
1.2
2.2
3
1971-1975 1976-1980 1981-1985 1986-1990 1991-1995 1996-2000 2001-2004period
Investment % of GDP Pred. Investment
U.S. Investment
(b) China
-.05-
.04-
.03-
.02-
.01
0.0
1.0
2.0
3.0
4.0
5
1971-1975 1976-1980 1981-1985 1986-1990 1991-1995 1996-2000 2001-2004period
Current Account % of GDP pred. value w/ inst. vars.
China
.22
.24
.26
.28
.3.3
2.3
4.3
6.3
8.4
.42
1971-1975 1976-1980 1981-1985 1986-1990 1991-1995 1996-2000 2001-2004period
Nat'l Saving % of GDP predicted value of Nat'l Saving
China's National Saving
.22
.24
.26
.28
.3.3
2.3
4.3
6.3
8.4
.42
1971-1975 1976-1980 1981-1985 1986-1990 1991-1995 1996-2000 2001-2004period
Investment % of GDP predicted Investment
China's Investment

35