us bank tower
TRANSCRIPT
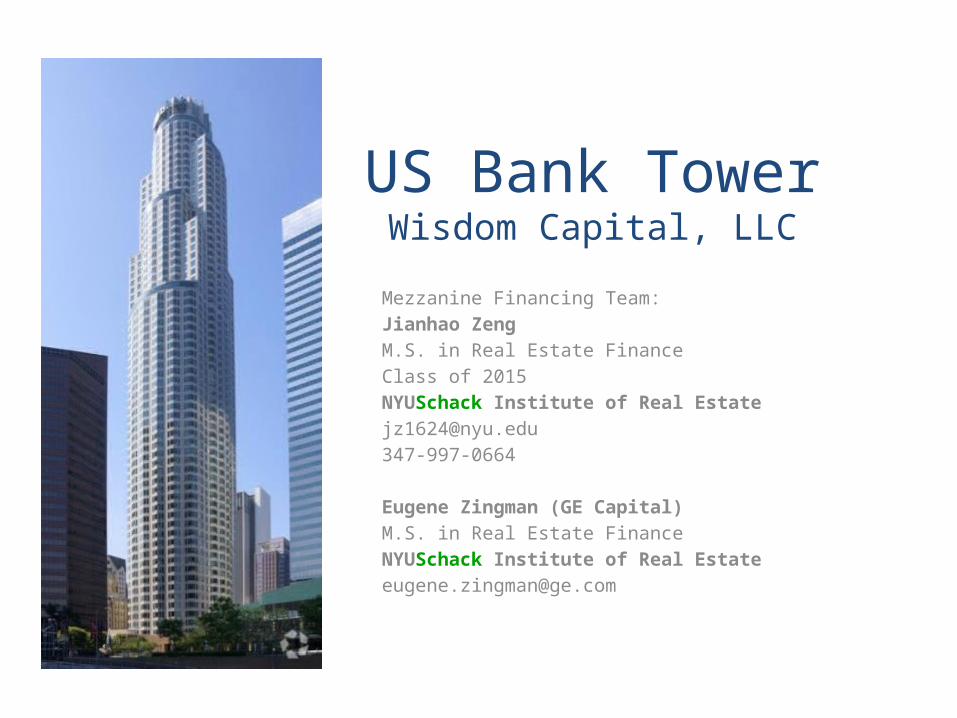
US Bank TowerWisdom Capital, LLC
Mezzanine Financing Team:Jianhao Zeng M.S. in Real Estate FinanceClass of 2015NYUSchack Institute of Real [email protected]
Eugene Zingman (GE Capital)M.S. in Real Estate FinanceNYUSchack Institute of Real [email protected]
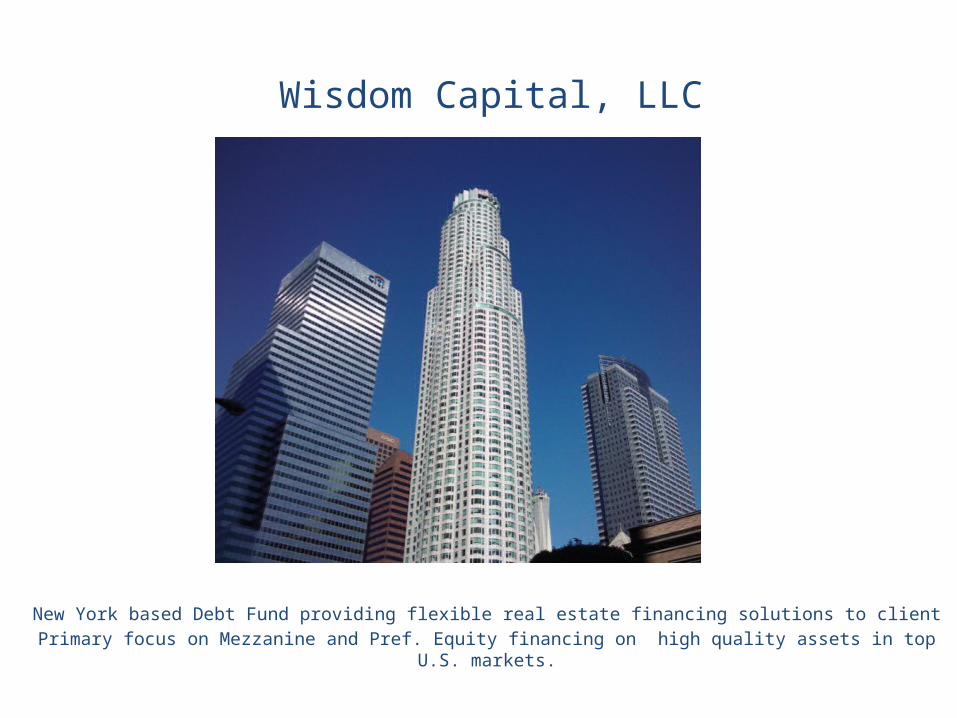
New York based Debt Fund providing flexible real estate financing solutions to clientPrimary focus on Mezzanine and Pref. Equity financing on high quality assets in top U.S. markets.
Wisdom Capital, LLC

Wisdom Capital, LLC
Property&
Market Information
Wisdom Capital, LLC
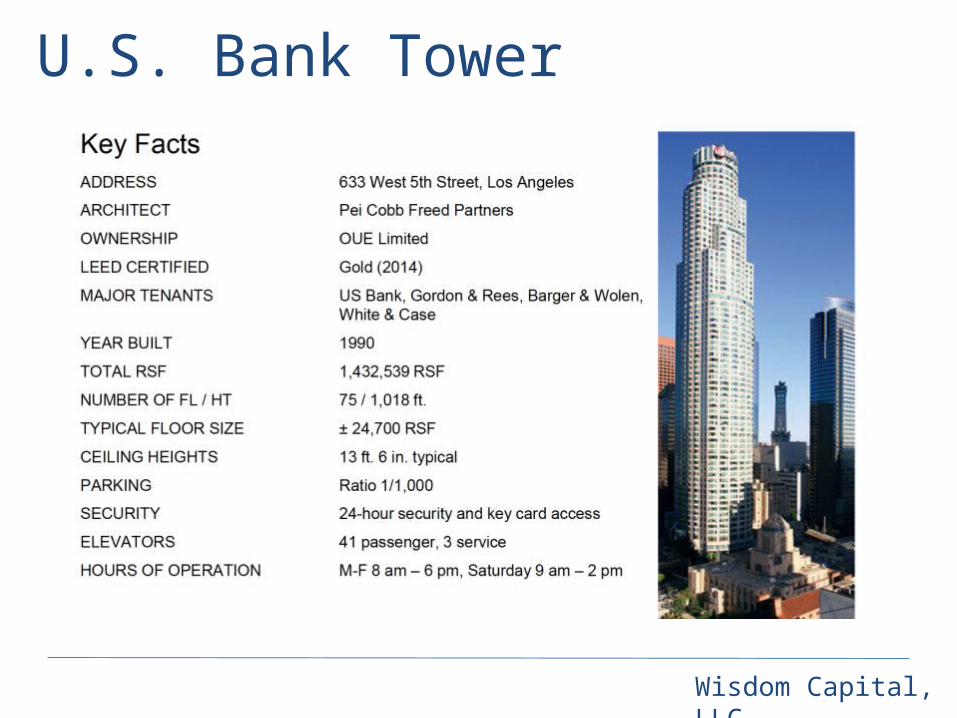
U.S. Bank Tower
Wisdom Capital, LLC
LA Population & Unemployment
Jan 2005 Sep 2005May 2006 Jan 2007 Sep 2007May 2008 Jan 2009 Sep 2009May 2010 Jan 2011 Sep 2011May 2012 Jan 2013 Sep 2013May 2014%
2%
4%
6%
8%
10%
12%
14%
Unemployment Rate - Montly dataBefore Seasonal adjustment
Los Angeles Metro U.S. Average New York Metro
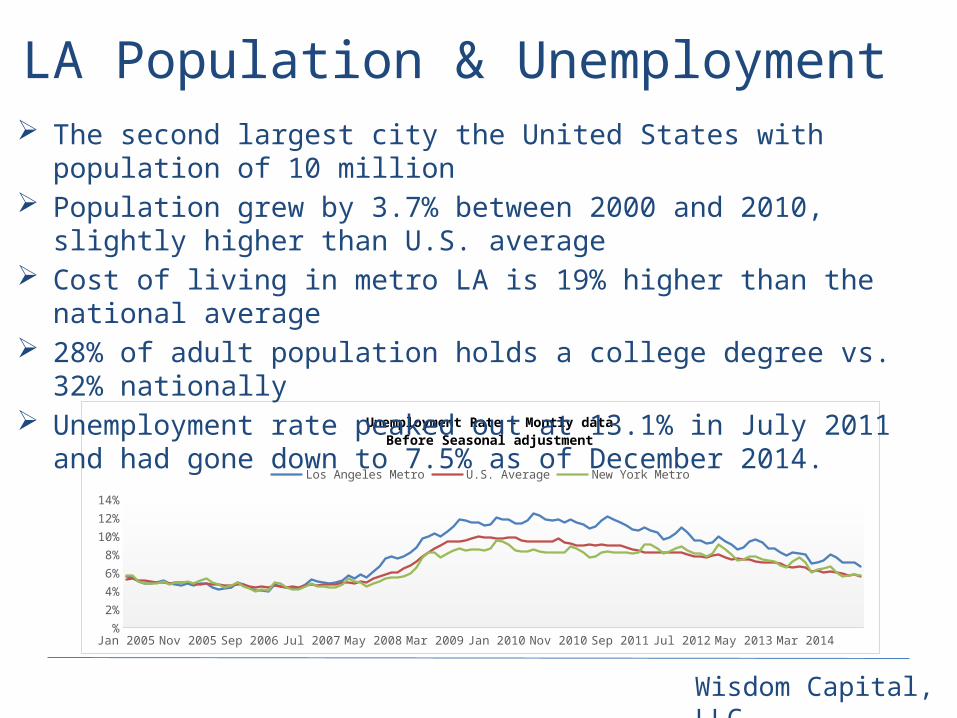
The second largest city the United States with population of 10 million Population grew by 3.7% between 2000 and 2010, slightly higher than U.S.
average Cost of living in metro LA is 19% higher than the national average 28% of adult population holds a college degree vs. 32% nationally Unemployment rate peaked out at 13.1% in July 2011 and had gone down to
7.5% as of December 2014.
Wisdom Capital, LLC
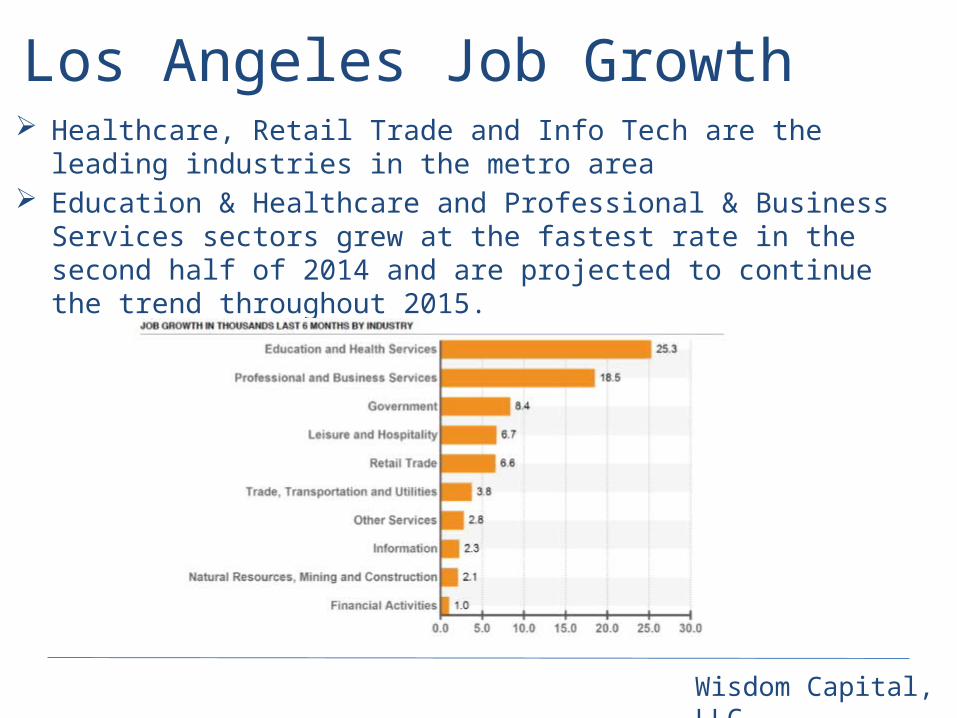
Los Angeles Job Growth Healthcare, Retail Trade and Info Tech are the leading industries in the metro
area Education & Healthcare and Professional & Business Services sectors grew at
the fastest rate in the second half of 2014 and are projected to continue the trend throughout 2015.

Wisdom Capital, LLC
Los Angeles Employment Data
Unemployment Rate
9.1% in 2013
7.9% in 2014
Education & Health 17%
Government 13%
Leisure & Hosp 11%
Retail Trade & Consumer 14%
Prof & Business
14%
Finance 5%
Information 5%
Wholesale 5%
Construc, Trans &Util 7%
Manufacturing 9%
Employment Data Employment By Sectors
Wisdom Capital, LLC
LA Office Inventory - Submarket
SFV - West 7%West LA
6%Century City 5%
Mid-Wilshire 8%
LAX/El Segundo 8%
Downtown 18%
Other 48%
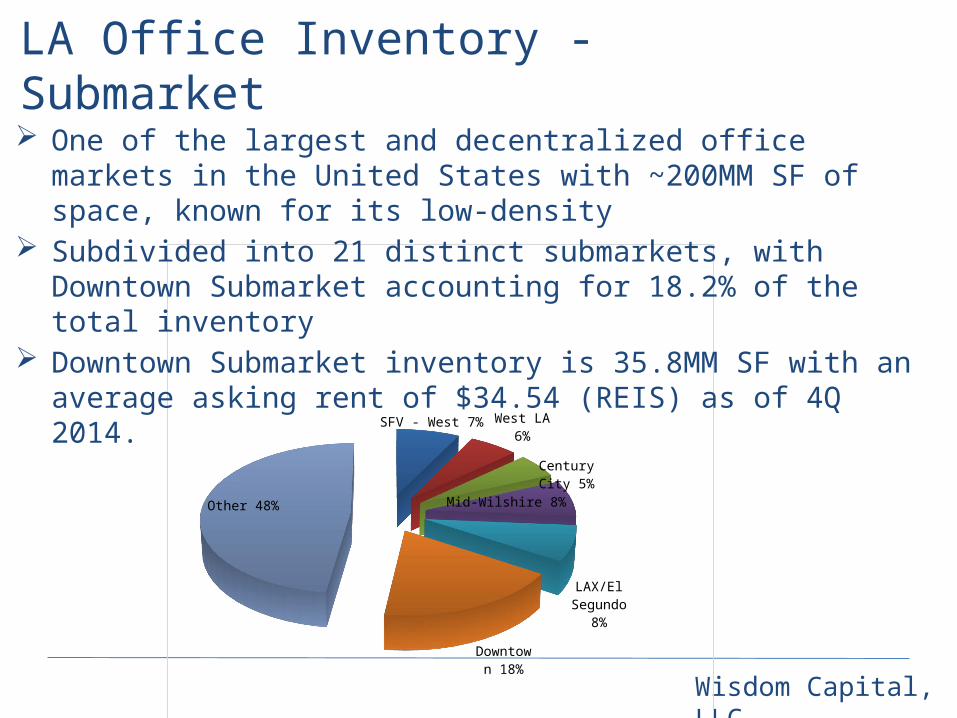
One of the largest and decentralized office markets in the United States with ~200MM SF of space, known for its low-density
Subdivided into 21 distinct submarkets, with Downtown Submarket accounting for 18.2% of the total inventory
Downtown Submarket inventory is 35.8MM SF with an average asking rent of $34.54 (REIS) as of 4Q 2014.

Wisdom Capital, LLC
Downtown Submarket Overview Downtown LA has been a slow-growth / low-volatility submarket Historically a major hub for government tenants, TAMI, healthcare and financial
services industries started to relocate here. Submarket provides great access to transportation and talented employee base Class A inventory practically unchanged since 2000 at ~23MM SF and projected
to remain the same through 2016. ~400,000 SF of new space is coming to market in 2017 (Wilshire Grand).
Per REIS, net absorption is projected at average 200,000 SF in 2015 and 2016. New inventory is expected to be easily absorbed in 2017, with vacancy rate remaining in 12%-13% range.
Wisdom Capital, LLC
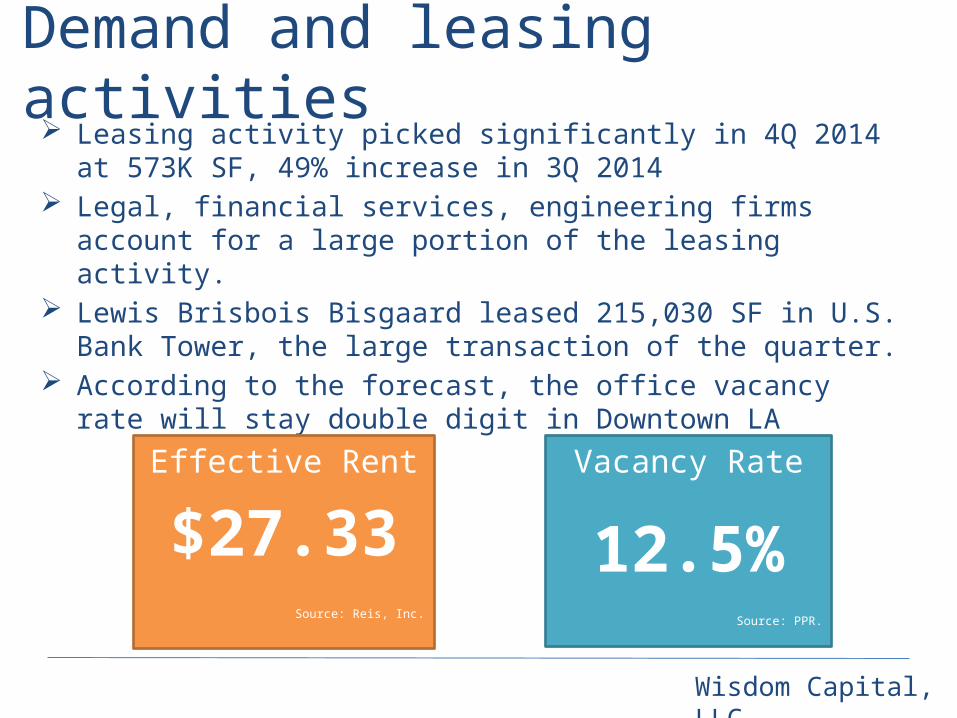
Demand and leasing activities Leasing activity picked significantly in 4Q 2014 at 573K SF, 49% increase in
3Q 2014 Legal, financial services, engineering firms account for a large portion of
the leasing activity. Lewis Brisbois Bisgaard leased 215,030 SF in U.S. Bank Tower, the large
transaction of the quarter. According to the forecast, the office vacancy rate will stay double digit in
Downtown LA
Effective Rent
$27.33Source: Reis, Inc.
Vacancy Rate
12.5%Source: PPR.
Wisdom Capital, LLC
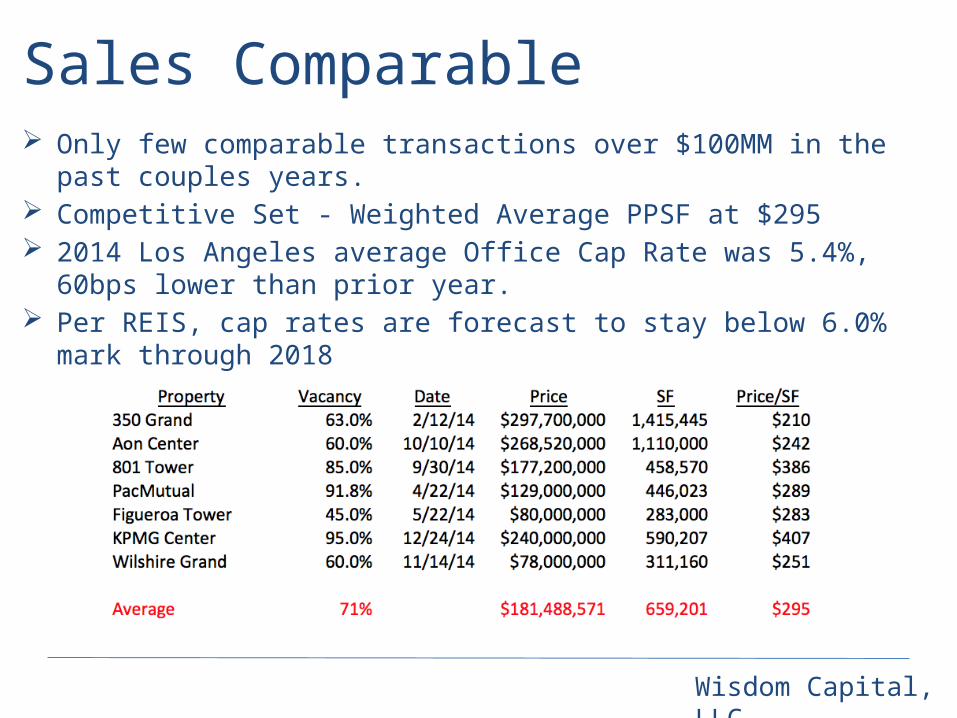
Sales Comparable Only few comparable transactions over $100MM in the past couples years. Competitive Set - Weighted Average PPSF at $295 2014 Los Angeles average Office Cap Rate was 5.4%, 60bps lower than prior
year. Per REIS, cap rates are forecast to stay below 6.0% mark through 2018
Wisdom Capital, LLC
LenderProperty Valuation
Wisdom Capital, LLC
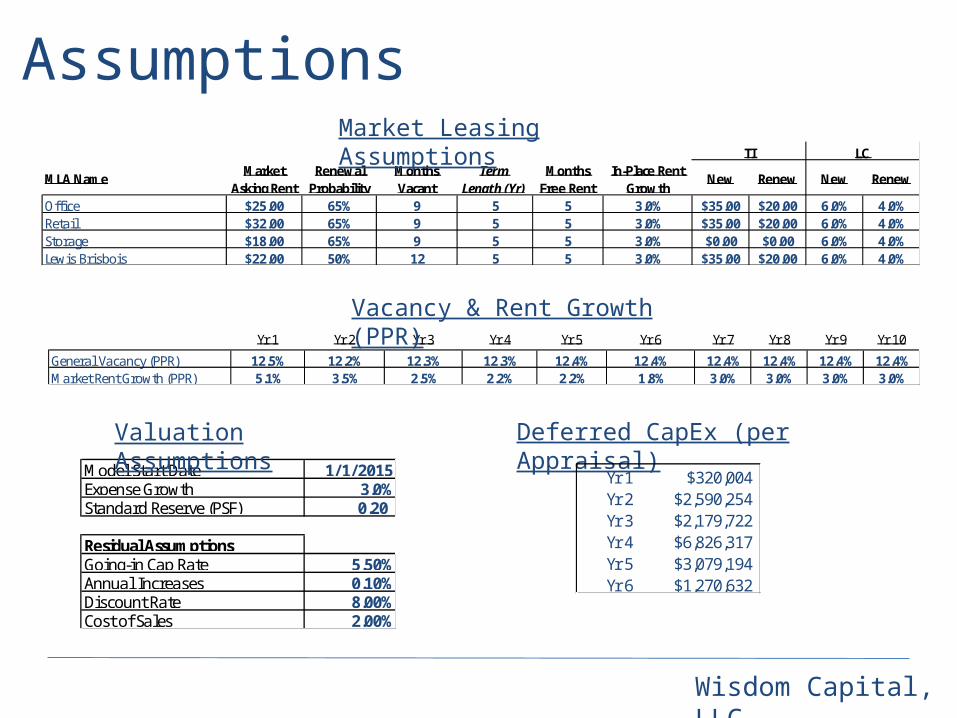
AssumptionsTI LC Market Rent Growth (Source: PPR)
MLA Name Market Asking Rent
Renewal Probability
Months Vacant
Term Length (Yr)
Months Free Rent
In-Place Rent Growth
New Renew New Renew
Office $25.00 65% 9 5 5 3.0% $35.00 $20.00 6.0% 4.0%Retail $32.00 65% 9 5 5 3.0% $35.00 $20.00 6.0% 4.0%Storage $18.00 65% 9 5 5 3.0% $0.00 $0.00 6.0% 4.0%Lewis Brisbois $22.00 50% 12 5 5 3.0% $35.00 $20.00 6.0% 4.0%
Market Leasing Assumptions
Yr 1 Yr 2 Yr 3 Yr 4 Yr 5 Yr 6 Yr 7 Yr 8 Yr 9 Yr 10
General Vacancy (PPR) 12.5% 12.2% 12.3% 12.3% 12.4% 12.4% 12.4% 12.4% 12.4% 12.4%Market Rent Growth (PPR) 5.1% 3.5% 2.5% 2.2% 2.2% 1.8% 3.0% 3.0% 3.0% 3.0%
Vacancy & Rent Growth (PPR)
Model Start Date 1/1/2015Expense Growth 3.0%Standard Reserve (PSF) 0.20
Residual AssumptionsGoing-in Cap Rate 5.50%Annual Increases 0.10%Discount Rate 8.00%Cost of Sales 2.00%
Valuation Assumptions Deferred CapEx (per Appraisal)Yr 1 $320,004Yr 2 $2,590,254Yr 3 $2,179,722Yr 4 $6,826,317Yr 5 $3,079,194Yr 6 $1,270,632
Wisdom Capital, LLC
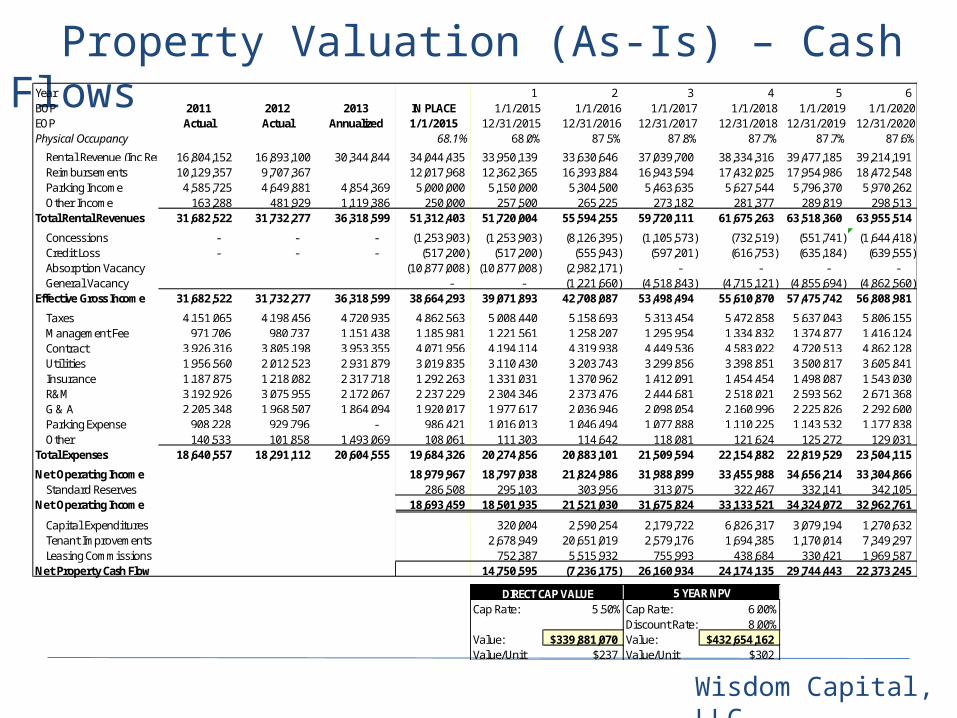
Property Valuation (As-Is) – Cash FlowsYear 1 2 3 4 5 6 BOP 2011 2012 2013 IN PLACE 1/1/2015 1/1/2016 1/1/2017 1/1/2018 1/1/2019 1/1/2020EOP Actual Actual Annualized 1/1/2015 12/31/2015 12/31/2016 12/31/2017 12/31/2018 12/31/2019 12/31/2020Physical Occupancy 68.1% 68.0% 87.5% 87.8% 87.7% 87.7% 87.6%
Rental Revenue (Inc Rent Steps)16,804,152 16,893,100 30,344,844 34,044,435 33,950,139 33,630,646 37,039,700 38,334,316 39,477,185 39,214,191 Reimbursements 10,129,357 9,707,367 12,017,968 12,362,365 16,393,884 16,943,594 17,432,025 17,954,986 18,472,548 Parking Income 4,585,725 4,649,881 4,854,369 5,000,000 5,150,000 5,304,500 5,463,635 5,627,544 5,796,370 5,970,262 Other Income 163,288 481,929 1,119,386 250,000 257,500 265,225 273,182 281,377 289,819 298,513
Total Rental Revenues 31,682,522 31,732,277 36,318,599 51,312,403 51,720,004 55,594,255 59,720,111 61,675,263 63,518,360 63,955,514
Concessions - - - (1,253,903) (1,253,903) (8,126,395) (1,105,573) (732,519) (551,741) (1,644,418) Credit Loss - - - (517,200) (517,200) (555,943) (597,201) (616,753) (635,184) (639,555) Absorption Vacancy (10,877,008) (10,877,008) (2,982,171) - - - - General Vacancy - - (1,221,660) (4,518,843) (4,715,121) (4,855,694) (4,862,560)
Effective Gross Income 31,682,522 31,732,277 36,318,599 38,664,293 39,071,893 42,708,087 53,498,494 55,610,870 57,475,742 56,808,981
Taxes 4,151,065 4,198,456 4,720,935 4,862,563 5,008,440 5,158,693 5,313,454 5,472,858 5,637,043 5,806,155 Management Fee 971,706 980,737 1,151,438 1,185,981 1,221,561 1,258,207 1,295,954 1,334,832 1,374,877 1,416,124 Contract 3,926,316 3,805,198 3,953,355 4,071,956 4,194,114 4,319,938 4,449,536 4,583,022 4,720,513 4,862,128 Utilities 1,956,560 2,012,523 2,931,879 3,019,835 3,110,430 3,203,743 3,299,856 3,398,851 3,500,817 3,605,841 Insurance 1,187,875 1,218,082 2,317,718 1,292,263 1,331,031 1,370,962 1,412,091 1,454,454 1,498,087 1,543,030 R&M 3,192,926 3,075,955 2,172,067 2,237,229 2,304,346 2,373,476 2,444,681 2,518,021 2,593,562 2,671,368 G & A 2,205,348 1,968,507 1,864,094 1,920,017 1,977,617 2,036,946 2,098,054 2,160,996 2,225,826 2,292,600 Parking Expense 908,228 929,796 - 986,421 1,016,013 1,046,494 1,077,888 1,110,225 1,143,532 1,177,838 Other 140,533 101,858 1,493,069 108,061 111,303 114,642 118,081 121,624 125,272 129,031
Total Expenses 18,640,557 18,291,112 20,604,555 19,684,326 20,274,856 20,883,101 21,509,594 22,154,882 22,819,529 23,504,115
Net Operating Income 18,979,967 18,797,038 21,824,986 31,988,899 33,455,988 34,656,214 33,304,866 Standard Reserves 286,508 295,103 303,956 313,075 322,467 332,141 342,105
Net Operating Income 18,693,459 18,501,935 21,521,030 31,675,824 33,133,521 34,324,072 32,962,761
Capital Expenditures 320,004 2,590,254 2,179,722 6,826,317 3,079,194 1,270,632 Tenant Improvements 2,678,949 20,651,019 2,579,176 1,694,385 1,170,014 7,349,297 Leasing Commissions 752,387 5,515,932 755,993 438,684 330,421 1,969,587
Net Property Cash Flow 14,750,595 (7,236,175) 26,160,934 24,174,135 29,744,443 22,373,245
DIRECT CAP VALUECap Rate: 5.50% Cap Rate: 6.00%
Discount Rate: 8.00%Value: $339,881,070 Value: $432,654,162Value/Unit $237 Value/Unit $302
5 YEAR NPV
Wisdom Capital, LLC
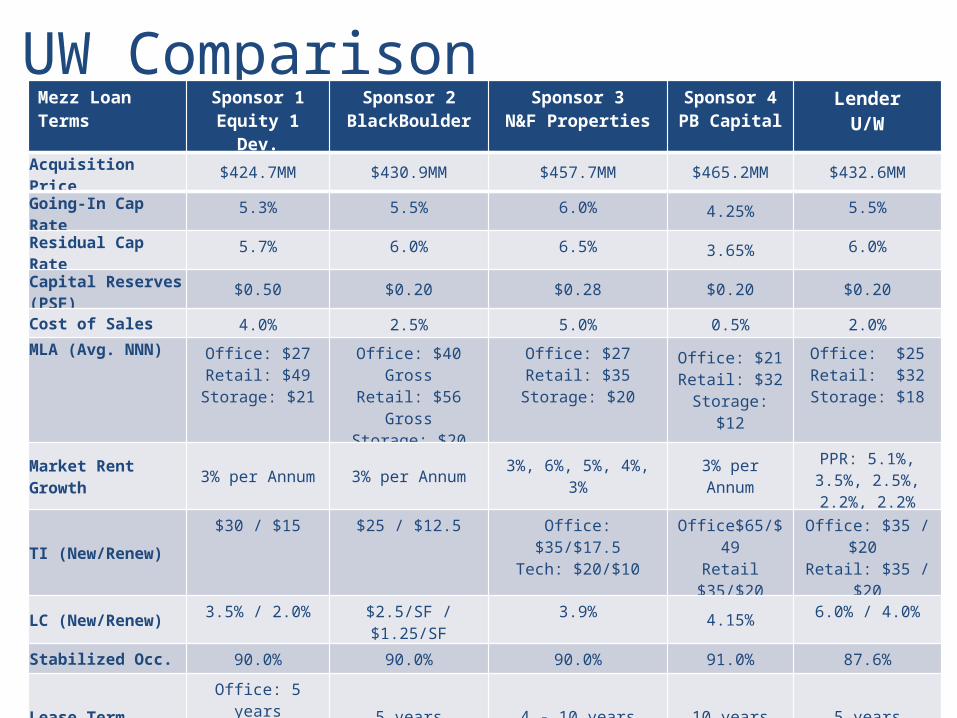
UW ComparisonMezz Loan Terms
Sponsor 1Equity 1
Dev.
Sponsor 2BlackBoulder
Sponsor 3N&F Properties
Sponsor 4PB Capital
LenderU/W
Acquisition Price $424.7MM $430.9MM $457.7MM $465.2MM $432.6MMGoing-In Cap Rate
5.3% 5.5% 6.0% 4.25% 5.5%
Residual Cap Rate
5.7% 6.0% 6.5% 3.65% 6.0%
Capital Reserves (PSF) $0.50 $0.20 $0.28 $0.20 $0.20
Cost of Sales 4.0% 2.5% 5.0% 0.5% 2.0%MLA (Avg. NNN) Office: $27
Retail: $49Storage: $21
Office: $40 GrossRetail: $56 Gross
Storage: $20
Office: $27Retail: $35
Storage: $20
Office: $21Retail: $32
Storage: $12
Office: $25Retail: $32
Storage: $18
Market Rent Growth 3% per Annum 3% per Annum 3%, 6%, 5%, 4%,
3%3% per Annum
PPR: 5.1%, 3.5%, 2.5%, 2.2%, 2.2%
TI (New/Renew) $30 / $15 $25 / $12.5 Office: $35/$17.5
Tech: $20/$10Office$65/$4
9Retail
$35/$20
Office: $35 / $20
Retail: $35 / $20
LC (New/Renew) 3.5% / 2.0% $2.5/SF / $1.25/SF
3.9% 4.15% 6.0% / 4.0%
Stabilized Occ. 90.0% 90.0% 90.0% 91.0% 87.6%
Lease TermOffice: 5 years
Retail: 10 years
5 years 4 - 10 years 10 years 5 years
Renewal Prob. 70% 70% 60% - 70% 75% 65%Downtime 6 months 4 months 5 months N/A 9 months
Rent AbatementOffice: 5 months
Retail: 12 months
2 months 3-7 months 1-12 months 5 months
Wisdom Capital, LLC
Lender Strategy
Wisdom Capital, LLC
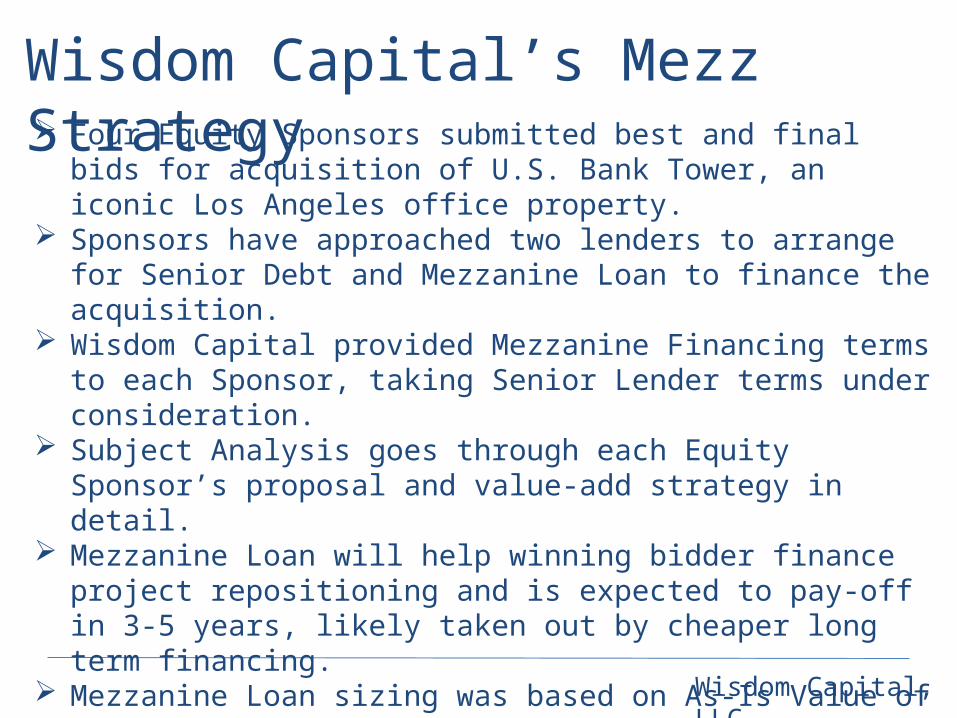
Wisdom Capital’s Mezz Strategy Four Equity Sponsors submitted best and final bids for acquisition of U.S.
Bank Tower, an iconic Los Angeles office property. Sponsors have approached two lenders to arrange for Senior Debt and
Mezzanine Loan to finance the acquisition. Wisdom Capital provided Mezzanine Financing terms to each Sponsor,
taking Senior Lender terms under consideration. Subject Analysis goes through each Equity Sponsor’s proposal and value-
add strategy in detail. Mezzanine Loan will help winning bidder finance project repositioning
and is expected to pay-off in 3-5 years, likely taken out by cheaper long term financing.
Mezzanine Loan sizing was based on As-Is Value of the subject Lender analysis focused on stability of cash flows during the loan term
and successful exit at maturity.
Wisdom Capital, LLC
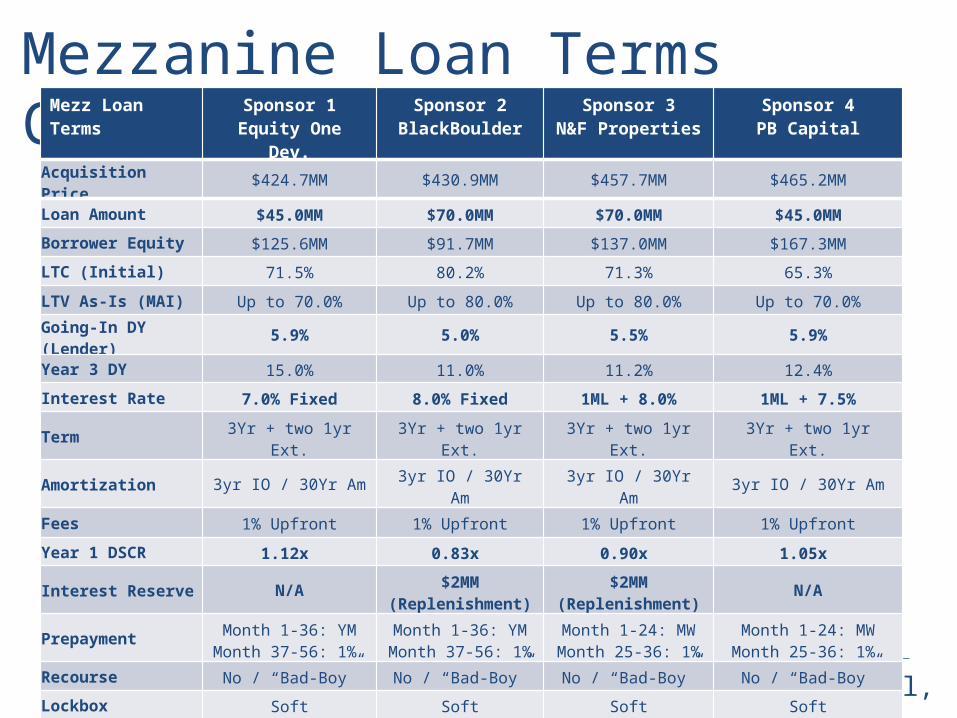
Mezzanine Loan Terms ComparisonMezz Loan Terms
Sponsor 1Equity One
Dev.
Sponsor 2BlackBoulder
Sponsor 3N&F Properties
Sponsor 4PB Capital
Acquisition Price $424.7MM $430.9MM $457.7MM $465.2MMLoan Amount $45.0MM $70.0MM $70.0MM $45.0MMBorrower Equity $125.6MM $91.7MM $137.0MM $167.3MMLTC (Initial) 71.5% 80.2% 71.3% 65.3%LTV As-Is (MAI) Up to 70.0% Up to 80.0% Up to 80.0% Up to 70.0%Going-In DY (Lender) 5.9% 5.0% 5.5% 5.9%
Year 3 DY 15.0% 11.0% 11.2% 12.4%Interest Rate 7.0% Fixed 8.0% Fixed 1ML + 8.0% 1ML + 7.5%Term 3Yr + two 1yr Ext. 3Yr + two 1yr Ext. 3Yr + two 1yr Ext. 3Yr + two 1yr Ext.Amortization 3yr IO / 30Yr Am 3yr IO / 30Yr Am 3yr IO / 30Yr Am 3yr IO / 30Yr AmFees 1% Upfront 1% Upfront 1% Upfront 1% UpfrontYear 1 DSCR 1.12x 0.83x 0.90x 1.05x
Interest Reserve N/A$2MM
(Replenishment)
$2MM(Replenishment) N/A
Prepayment Month 1-36: YMMonth 37-56: 1%
Month 1-36: YMMonth 37-56: 1%
Month 1-24: MWMonth 25-36: 1%
Month 1-24: MWMonth 25-36: 1%
Recourse No / “Bad-Boy” No / “Bad-Boy” No / “Bad-Boy” No / “Bad-Boy”Lockbox Soft Soft Soft Soft
Wisdom Capital, LLC
Equity Team 1
Equity One Development Partners
Wisdom Capital, LLC
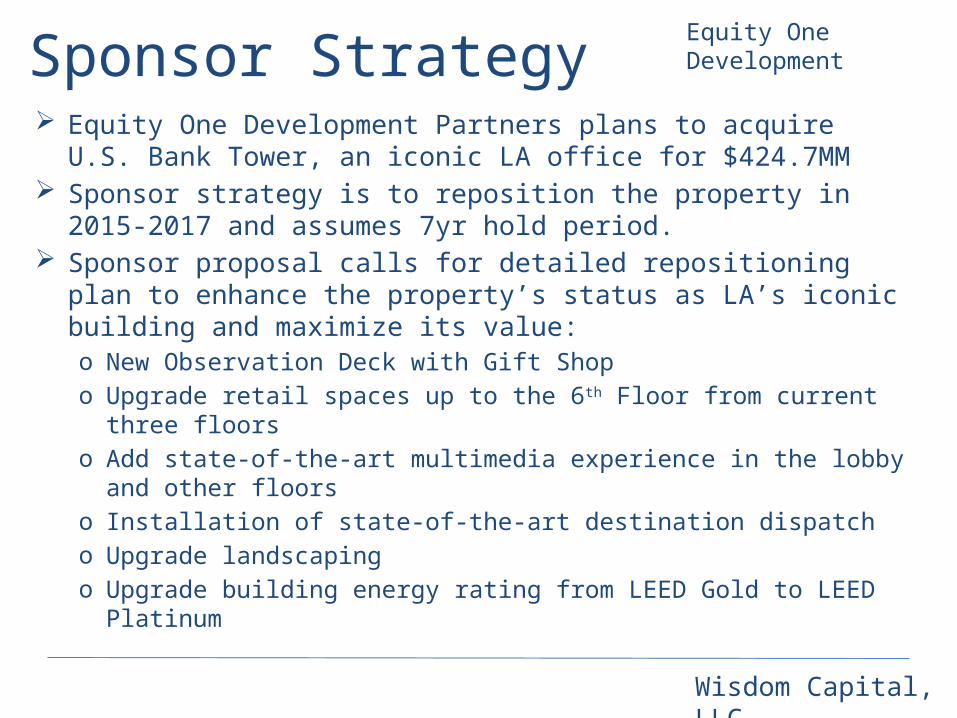
Sponsor Strategy Equity One Development Partners plans to acquire U.S. Bank Tower, an
iconic LA office for $424.7MM Sponsor strategy is to reposition the property in 2015-2017 and
assumes 7yr hold period. Sponsor proposal calls for detailed repositioning plan to enhance the
property’s status as LA’s iconic building and maximize its value:o New Observation Deck with Gift Shopo Upgrade retail spaces up to the 6th Floor from current three floorso Add state-of-the-art multimedia experience in the lobby and other floorso Installation of state-of-the-art destination dispatcho Upgrade landscapingo Upgrade building energy rating from LEED Gold to LEED Platinum
Equity One Development
Wisdom Capital, LLC
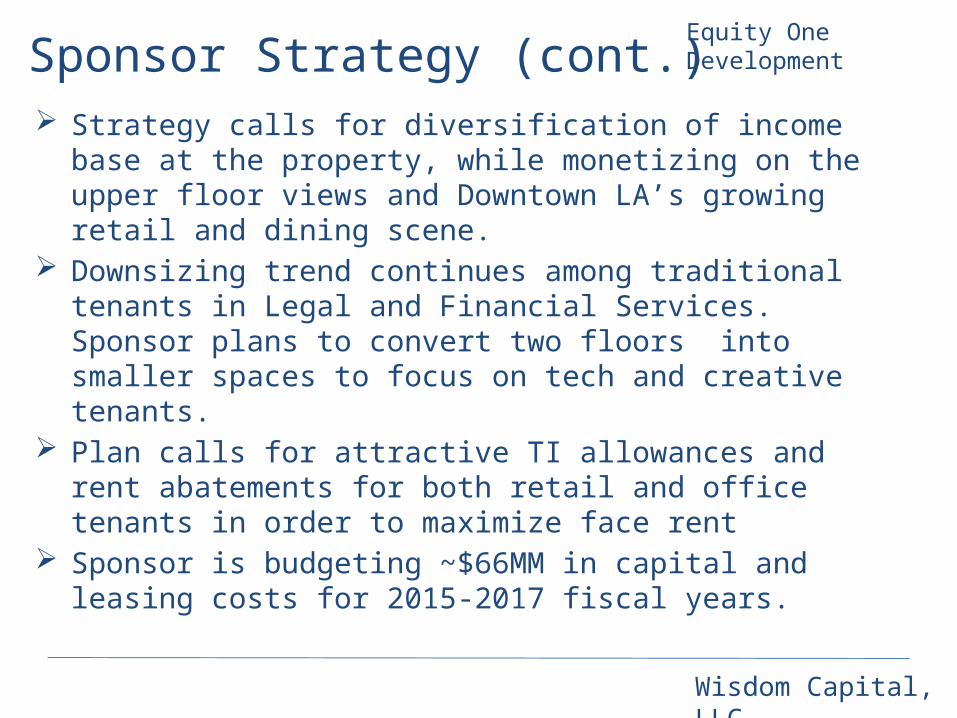
Sponsor Strategy (cont.) Strategy calls for diversification of income base at the property, while
monetizing on the upper floor views and Downtown LA’s growing retail and dining scene.
Downsizing trend continues among traditional tenants in Legal and Financial Services. Sponsor plans to convert two floors into smaller spaces to focus on tech and creative tenants.
Plan calls for attractive TI allowances and rent abatements for both retail and office tenants in order to maximize face rent
Sponsor is budgeting ~$66MM in capital and leasing costs for 2015-2017 fiscal years.
Equity One Development
Wisdom Capital, LLC
Sources & UsesEquity One Development
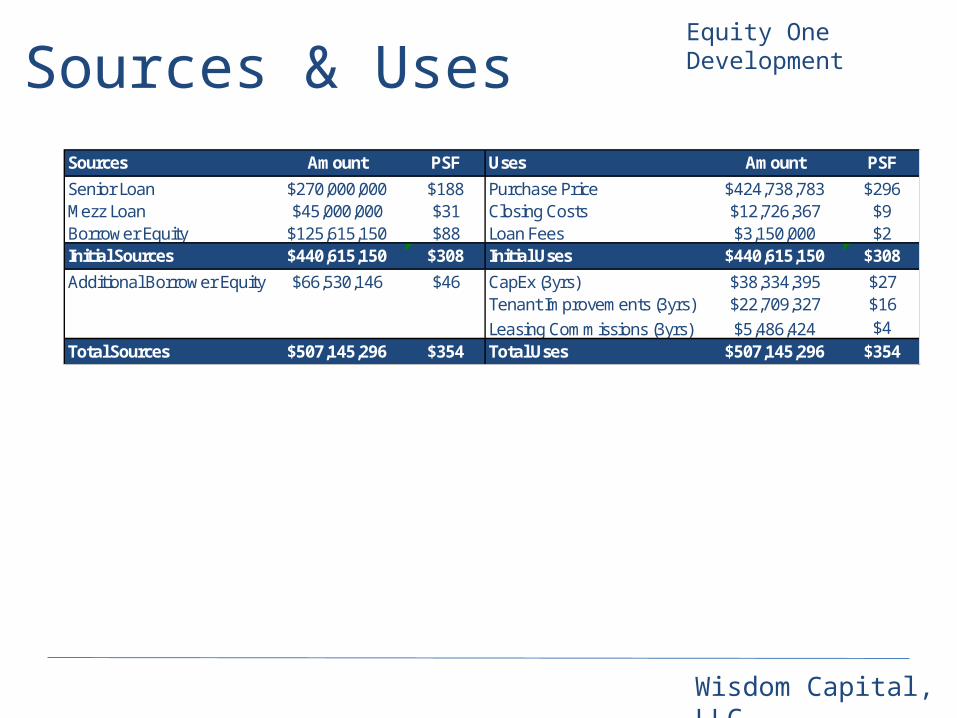
Sources Amount PSF Uses Amount PSFSenior Loan $270,000,000 $188 Purchase Price $424,738,783 $296Mezz Loan $45,000,000 $31 Closing Costs $12,726,367 $9Borrower Equity $125,615,150 $88 Loan Fees $3,150,000 $2Initial Sources $440,615,150 $308 Initial Uses $440,615,150 $308Additional Borrower Equity $66,530,146 $46 CapEx (3yrs) $38,334,395 $27
Tenant Improvements (3yrs) $22,709,327 $16Leasing Commissions (3yrs) $5,486,424 $4
Total Sources $507,145,296 $354 Total Uses $507,145,296 $354
Wisdom Capital, LLC
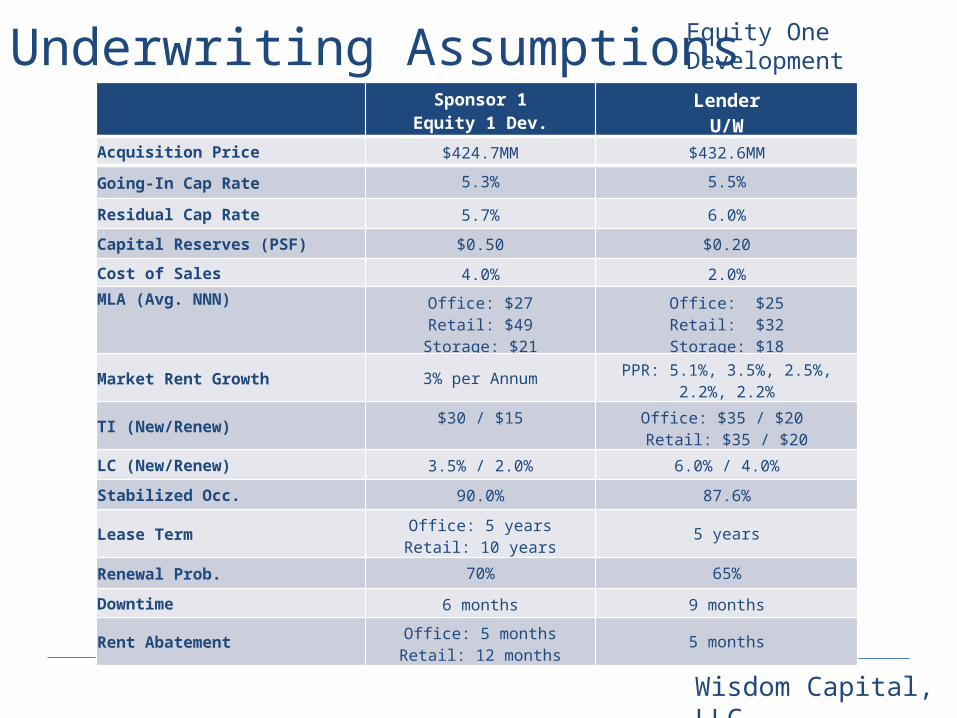
Underwriting Assumptions Equity One Development
Sponsor 1Equity 1 Dev.
LenderU/W
Acquisition Price $424.7MM $432.6MMGoing-In Cap Rate 5.3% 5.5%
Residual Cap Rate 5.7% 6.0%Capital Reserves (PSF) $0.50 $0.20Cost of Sales 4.0% 2.0%MLA (Avg. NNN) Office: $27
Retail: $49Storage: $21
Office: $25Retail: $32
Storage: $18
Market Rent Growth 3% per Annum PPR: 5.1%, 3.5%, 2.5%, 2.2%, 2.2%
TI (New/Renew) $30 / $15 Office: $35 / $20 Retail: $35 / $20
LC (New/Renew) 3.5% / 2.0% 6.0% / 4.0%Stabilized Occ. 90.0% 87.6%
Lease Term Office: 5 yearsRetail: 10 years 5 years
Renewal Prob. 70% 65%Downtime 6 months 9 months
Rent Abatement Office: 5 monthsRetail: 12 months 5 months
Wisdom Capital, LLC
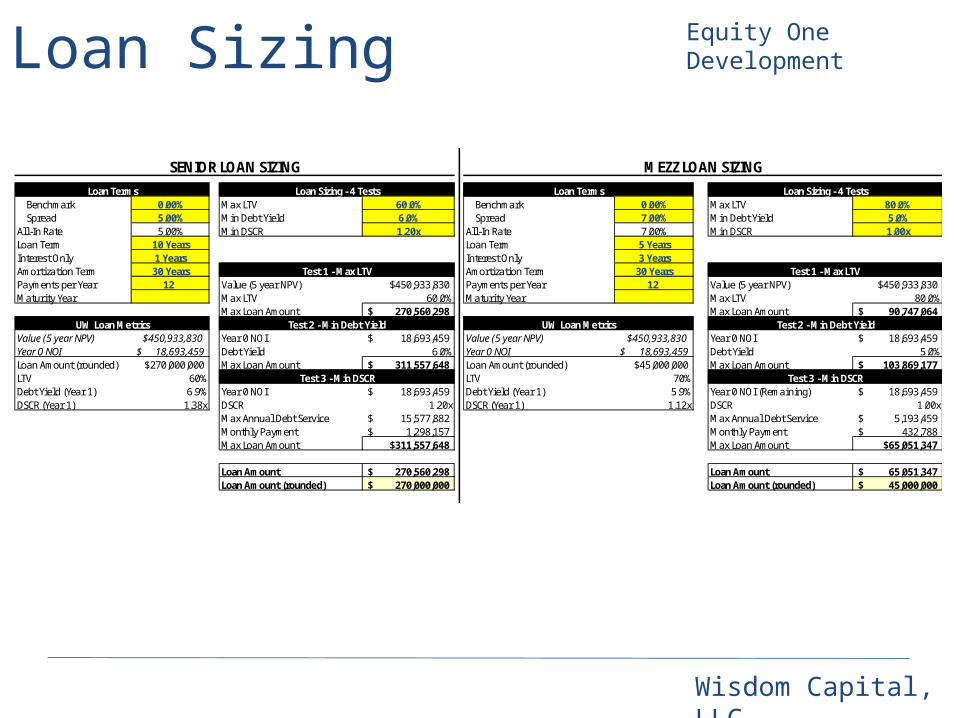
Loan Sizing Equity One Development
SENIOR LOAN SIZING MEZZ LOAN SIZINGLoan Terms Loan Sizing - 4 Tests Loan Terms Loan Sizing - 4 Tests
Benchmark 0.00% Max LTV 60.0% Benchmark 0.00% Max LTV 80.0%Spread 5.00% Min Debt Yield 6.0% Spread 7.00% Min Debt Yield 5.0%
All-In Rate 5.00% Min DSCR 1.20x All-In Rate 7.00% Min DSCR 1.00xLoan Term 10 Years Loan Term 5 YearsInterest Only 1 Years Interest Only 3 YearsAmortization Term 30 Years Test 1 - Max LTV Amortization Term 30 Years Test 1 - Max LTVPayments per Year 12 Value (5 year NPV) $450,933,830 Payments per Year 12 Value (5 year NPV) $450,933,830Maturity Year Max LTV 60.0% Maturity Year Max LTV 80.0%
Max Loan Amount 270,560,298$ Max Loan Amount 90,747,064$ UW Loan Metrics Test 2 - Min Debt Yield UW Loan Metrics Test 2 - Min Debt Yield
Value (5 year NPV) $450,933,830 Year 0 NOI 18,693,459$ Value (5 year NPV) $450,933,830 Year 0 NOI 18,693,459$ Year 0 NOI 18,693,459$ Debt Yield 6.0% Year 0 NOI 18,693,459$ Debt Yield 5.0%Loan Amount (rounded) $270,000,000 Max Loan Amount 311,557,648$ Loan Amount (rounded) $45,000,000 Max Loan Amount 103,869,177$ LTV 60% Test 3 - Min DSCR LTV 70% Test 3 - Min DSCRDebt Yield (Year 1) 6.9% Year 0 NOI 18,693,459$ Debt Yield (Year 1) 5.9% Year 0 NOI (Remaining) 18,693,459$ DSCR (Year 1) 1.38x DSCR 1.20x DSCR (Year 1) 1.12x DSCR 1.00x
Max Annual Debt Service 15,577,882$ Max Annual Debt Service 5,193,459$ Monthly Payment 1,298,157$ Monthly Payment 432,788$ Max Loan Amount $311,557,648 Max Loan Amount $65,051,347
Loan Amount 270,560,298$ Loan Amount 65,051,347$ Loan Amount (rounded) 270,000,000$ Loan Amount (rounded) 45,000,000$
Wisdom Capital, LLC
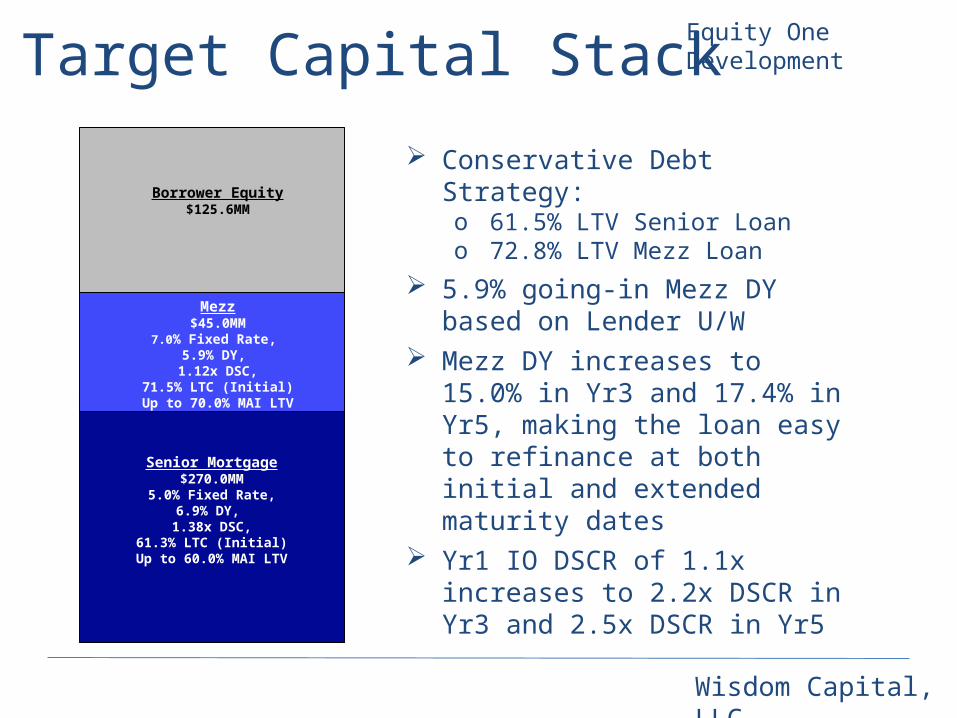
Target Capital Stack Conservative Debt Strategy:
o 61.5% LTV Senior Loano 72.8% LTV Mezz Loan
5.9% going-in Mezz DY based on Lender U/W
Mezz DY increases to 15.0% in Yr3 and 17.4% in Yr5, making the loan easy to refinance at both initial and extended maturity dates
Yr1 IO DSCR of 1.1x increases to 2.2x DSCR in Yr3 and 2.5x DSCR in Yr5
Mezz$45.0MM
7.0% Fixed Rate, 5.9% DY,
1.12x DSC,71.5% LTC (Initial)
Up to 70.0% MAI LTV
Senior Mortgage$270.0MM
5.0% Fixed Rate,6.9% DY,
1.38x DSC,61.3% LTC (Initial)
Up to 60.0% MAI LTV
Borrower Equity$125.6MM
Equity One Development
Wisdom Capital, LLC
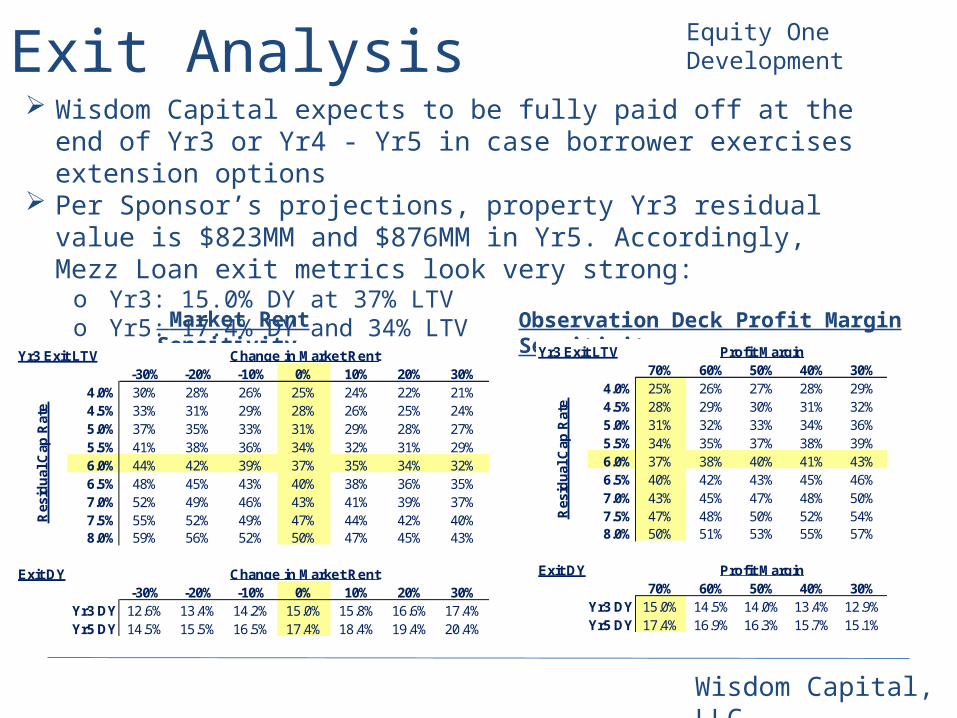
Exit Analysis
Market Rent Sensitivity
Wisdom Capital expects to be fully paid off at the end of Yr3 or Yr4 - Yr5 in case borrower exercises extension options
Per Sponsor’s projections, property Yr3 residual value is $823MM and $876MM in Yr5. Accordingly, Mezz Loan exit metrics look very strong:o Yr3: 15.0% DY at 37% LTVo Yr5: 17.4% DY and 34% LTV
Observation Deck Profit Margin Sensitivity
Equity One Development
Yr3 Exit LTV-30% -20% -10% 0% 10% 20% 30%
4.0% 30% 28% 26% 25% 24% 22% 21%4.5% 33% 31% 29% 28% 26% 25% 24%5.0% 37% 35% 33% 31% 29% 28% 27%5.5% 41% 38% 36% 34% 32% 31% 29%6.0% 44% 42% 39% 37% 35% 34% 32%6.5% 48% 45% 43% 40% 38% 36% 35%7.0% 52% 49% 46% 43% 41% 39% 37%7.5% 55% 52% 49% 47% 44% 42% 40%8.0% 59% 56% 52% 50% 47% 45% 43%
Exit DY-30% -20% -10% 0% 10% 20% 30%
Yr3 DY 12.6% 13.4% 14.2% 15.0% 15.8% 16.6% 17.4%Yr5 DY 14.5% 15.5% 16.5% 17.4% 18.4% 19.4% 20.4%
Change in Market Rent
Change in Market Rent
Resi
dual
Cap
Rat
e
Yr3 Exit LTV70% 60% 50% 40% 30%
4.0% 25% 26% 27% 28% 29%4.5% 28% 29% 30% 31% 32%5.0% 31% 32% 33% 34% 36%5.5% 34% 35% 37% 38% 39%6.0% 37% 38% 40% 41% 43%6.5% 40% 42% 43% 45% 46%7.0% 43% 45% 47% 48% 50%7.5% 47% 48% 50% 52% 54%8.0% 50% 51% 53% 55% 57%
Exit DY70% 60% 50% 40% 30%
Yr3 DY 15.0% 14.5% 14.0% 13.4% 12.9%Yr5 DY 17.4% 16.9% 16.3% 15.7% 15.1%
Profit Margin
Profit MarginRe
sidu
al C
ap R
ate
Wisdom Capital, LLC
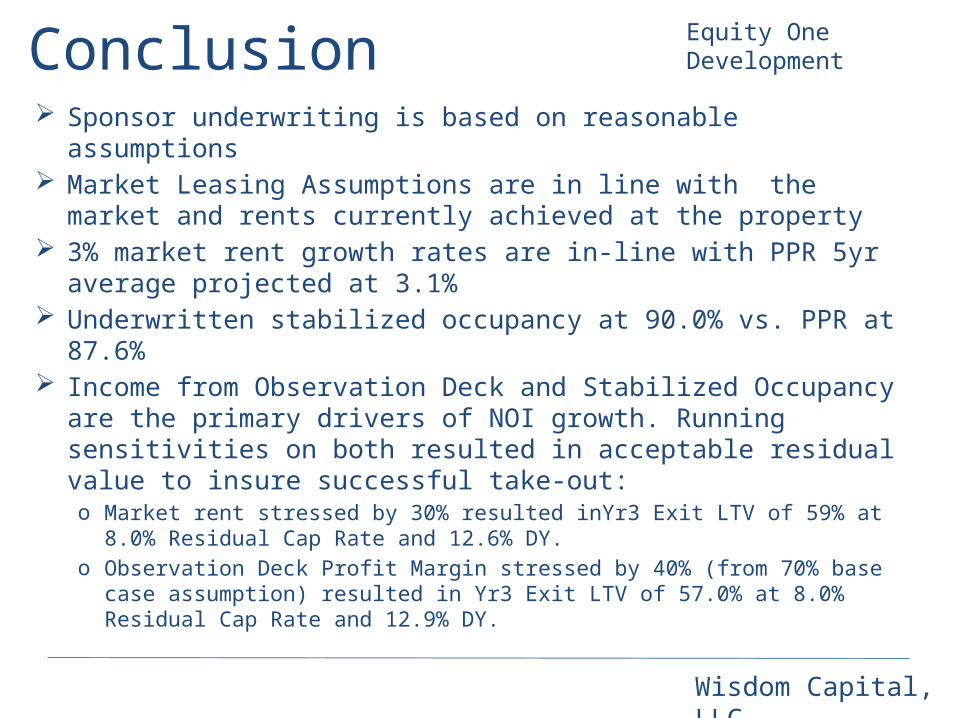
Conclusion Sponsor underwriting is based on reasonable assumptions Market Leasing Assumptions are in line with the market and rents
currently achieved at the property 3% market rent growth rates are in-line with PPR 5yr average
projected at 3.1% Underwritten stabilized occupancy at 90.0% vs. PPR at 87.6% Income from Observation Deck and Stabilized Occupancy are the
primary drivers of NOI growth. Running sensitivities on both resulted in acceptable residual value to insure successful take-out:o Market rent stressed by 30% resulted inYr3 Exit LTV of 59% at 8.0% Residual Cap
Rate and 12.6% DY.o Observation Deck Profit Margin stressed by 40% (from 70% base case
assumption) resulted in Yr3 Exit LTV of 57.0% at 8.0% Residual Cap Rate and 12.9% DY.
Equity One Development