us army forward surgical team fresh whole blood …rdcr.org/wp-content/uploads/symp2012pdf/us army...
TRANSCRIPT

LTCP Shawn C. Nessen DO, FACS
DCCS, 212th Combat Support Hospital
Trauma Critical Care Surgeon
Landstuhl Regional Medical Center
US Army Forward Surgical
TeamFresh Whole Blood
onsdag 5. september 2012

541st Medical Detachment
Evaluate the effectiveness of resuscitation with and without FWB at Forward Surgical Teams in Afghanistan
OBJECTIVE
onsdag 5. september 2012
541st Medical Detachment
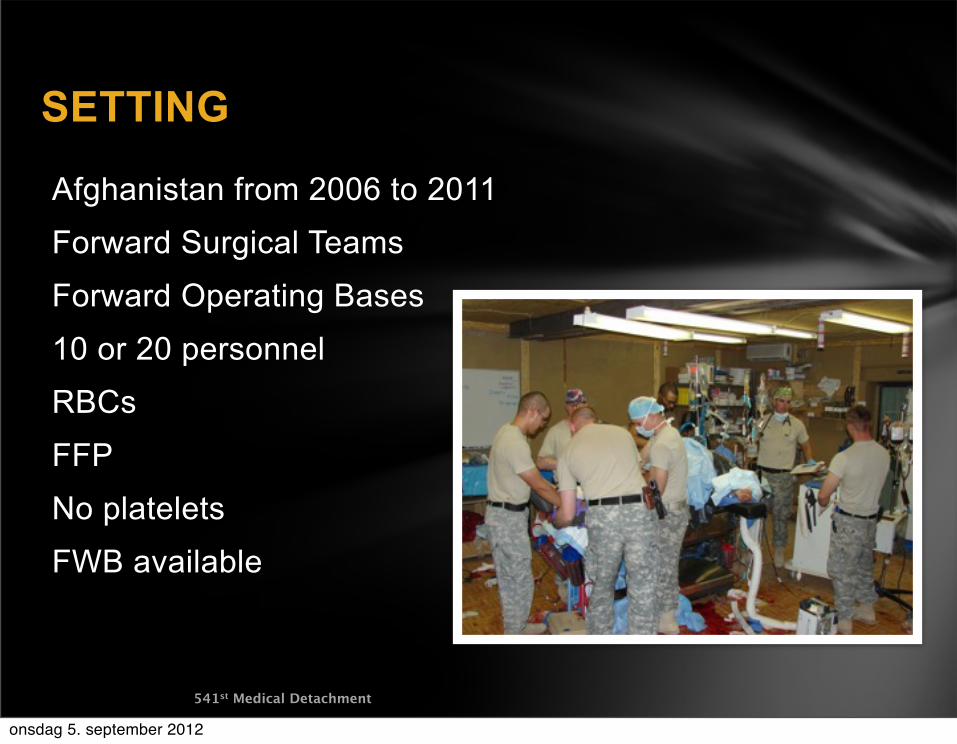
Afghanistan from 2006 to 2011
Forward Surgical Teams
Forward Operating Bases
10 or 20 personnel
RBCs
FFP
No platelets
FWB available
SETTING
onsdag 5. september 2012

490 patients given blood transfusions
4605 total units of blood products• 2622 units of RBCs• 1570 units of FFP• 416 units of FWB
94 Massive Blood Transfusions• 49 with FWB• 45 without FWB
94 Patients received Fresh Whole Blood
BACKGROUND
onsdag 5. september 2012

541st Medical Detachment
Temperature
Systolic blood pressure
Respiratory rate
Glasgow coma scale
Injury Severity score
Sex
Age
FST prospectively studied data from 206-2011
Blood product utilization
rF VIIa utilization
Mechanism of injury
Type of injury
Surgical procedures
Died of wounds
Nationality
Methods
onsdag 5. september 2012
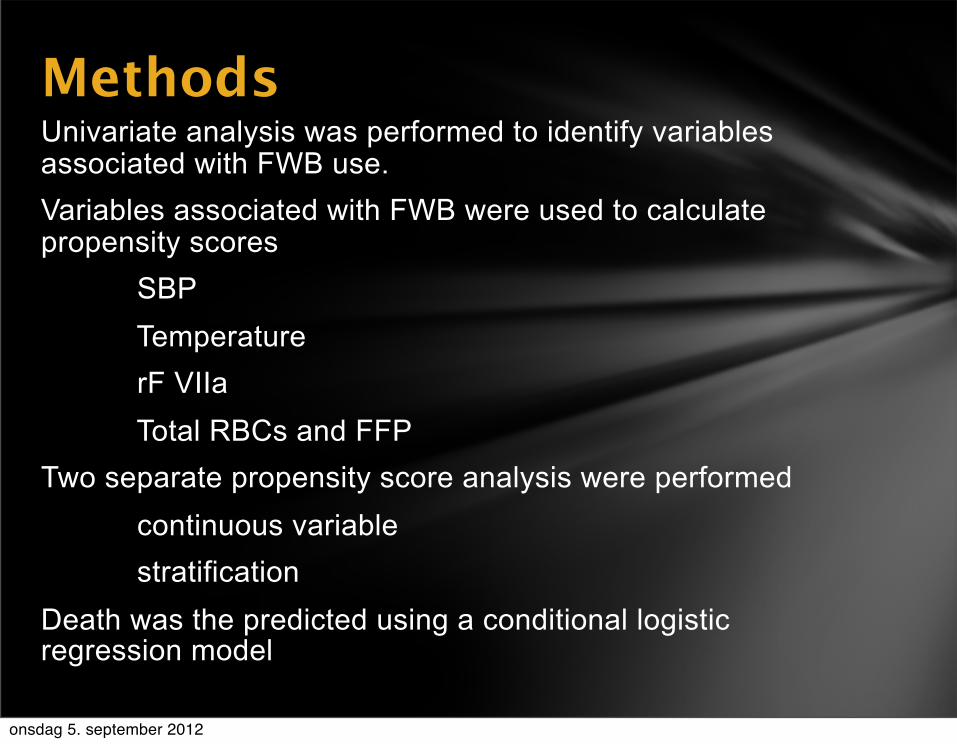
Univariate analysis was performed to identify variables associated with FWB use.Variables associated with FWB were used to calculate propensity scores SBP Temperature rF VIIa Total RBCs and FFPTwo separate propensity score analysis were performed continuous variable stratificationDeath was the predicted using a conditional logistic regression model
Methods
onsdag 5. september 2012

RESULTS
Table 1: Admission Vitals and Lab data by Fresh Whole Blood (FWB) use Table 1: Admission Vitals and Lab data by Fresh Whole Blood (FWB) useTable 1: Admission Vitals and Lab data by Fresh Whole Blood (FWB) use
No FWB (n =396) FWB (n =94) p value
Age (yrs) 25.6 ± 11.5; 24.5(20,30); 372 28.05 ± 9.65; 25(22,30); 81 0.08
Male gender 377 (95.2) 90 (95.7) 1.00
GCS 13.7 ± 2.8; 15(14,15); 396 13.2 ± 3.4; 15(14,15); 93 0.15
ISS 19.6 ± 9.2; 16.5 (16, 25); 396 22.4 ± 8.9; 20 (16, 26); 94 0.008
Arrival SBP (mmHg) 110.1 ± 27.6; 110 (95,128); 390 99.9 ± 30.1; 97(80,123); 94 0.002
Arrival RR 22 ± 83; 21(16,26); 385 25.2 ± 9.7; 25(18,30); 94 0.004Arrival Temp (F)
97.6 ± 1.6; 97.7(96.9, 98.4);375 96.9 ± 2.1;97.1(96,97.9); 83 0.005
Continuous variables reported as mean ± SD; median (LowerQ, UpperQ); nContinuous variables reported as mean ± SD; median (LowerQ, UpperQ); nContinuous variables reported as mean ± SD; median (LowerQ, UpperQ); n
Categorical variables reported as n (%)Categorical variables reported as n (%)
onsdag 5. september 2012

Blood Product Use with FWB
Table 2: Blood Products Use by Fresh Whole Blood (FWB) useTable 2: Blood Products Use by Fresh Whole Blood (FWB) useTable 2: Blood Products Use by Fresh Whole Blood (FWB) use No FWB (n =396) FWB (n =94) p value
FWB (U) 0 4.4 ± 4; 3(2,6) <0.001Total PRBC (U) 4.6 ± 3.7; 4(2,6) 12.7 ± 9.4; 10 (6,16) <0.001Total Plasma (U) 2.6 ± 2.7 ; 2(0,4) 10 ±7.1; 8(5,12) <0.001Total Blood Products (U) 7.3 ± 5.8; 6 (3,10) 18.3 ±13.1;14(10,24) <0.001Factor VII given 23 (5.8) 24 (25.5) <0.001Massive Transfusion 46 (11.6) 49 (52.1) <0.001Continuous variables reported as mean ± SD ; median (LowerQ, UpperQ)Continuous variables reported as mean ± SD ; median (LowerQ, UpperQ)Continuous variables reported as mean ± SD ; median (LowerQ, UpperQ) Categorical variables reported as n (%)Categorical variables reported as n (%)
onsdag 5. september 2012

Admission Vital Signs and Trauma Scores
Table 4: Admission Vitals and Lab data by Death StatusTable 4: Admission Vitals and Lab data by Death StatusTable 4: Admission Vitals and Lab data by Death StatusTable 4: Admission Vitals and Lab data by Death Status
Alive (n =448) Dead (n =42) p value
Age (yrs) 25.9 ± 11; 25 (20, 30); 417 28.1 ± 13.3; 25 (21,30); 3628.1 ± 13.3; 25 (21,30); 36 0.25Male gender 426 (95.1) 41 (97.6) 0.71GCS 14.1 ± 2.3 ; 15 (14,15); 447 9.07 ± 4.8; 9 (3,15); 42 <0.001ISS 19.4 ± 8.6 ; 16 (16,25);448 27.8 ± 12.1; 25 (18, 32); 4227.8 ± 12.1; 25 (18, 32); 42 <0.001Arrival SBP (mmHg) 109.9 ± 26.8 ;110 (93,128);443 88.8 ± 37.1; 84 (78,106); 4188.8 ± 37.1; 84 (78,106); 41 <0.001Arrival RR 22.5 ± 8.4 ; 22 (16, 28); 438 23.7 ± 11.5 ;24 (17, 32); 4123.7 ± 11.5 ;24 (17, 32); 41 0.54Arrival Temp (F) 97.6 ± 1.6;97.8(97,98.6); 420 96.4±1.6;96.4(95.8, 97.4);3896.4±1.6;96.4(95.8, 97.4);38 <0.001Continuous variables reported as mean ± SD; median (LowerQ, UpperQ); nContinuous variables reported as mean ± SD; median (LowerQ, UpperQ); nContinuous variables reported as mean ± SD; median (LowerQ, UpperQ); nContinuous variables reported as mean ± SD; median (LowerQ, UpperQ); n
Categorical variables reported as n (%)Categorical variables reported as n (%)
onsdag 5. september 2012

Variables Associated with Death
Table 5: Blood Products Use by Death StatusTable 5: Blood Products Use by Death Status Alive (n =448) Dead (n =42) p value
FWB (U) 0.8 ± 2.2 ;0 (0,0);448 1.33 ± 4.6 ; 0 (0, 0);42 0.46Total PRBC (U) 5.8 ± 5.5 ;4 (2, 8); 448 10.1±10.3 ; 7(4 ,12); 42 0.01Total Plasma (U) 3.9 ± 4.5; 3(0,6); 448 5.9 ± 7.8;4 (1,6); 42 0.12Total Blood Products (U) 8.9 ± 8 ;7 (3, 12); 448 14.7±14 ;10 (6, 19) 42 0.01Factor VII given 39 (8.7) 8 (19.1) 0.049Massive Transfusion 79 (17.6) 16 (38.1) 0.007Continuous variables reported as mean ± SD ; median (LowerQ, UpperQ); nContinuous variables reported as mean ± SD ; median (LowerQ, UpperQ); nContinuous variables reported as mean ± SD ; median (LowerQ, UpperQ); n Categorical variables reported as n (%)Categorical variables reported as n (%)
onsdag 5. september 2012

Logistic Regression Predicting Effect of FWB on Death
Table 7: Propensity score used as continuous variable in logistic regression predicting effect of FWB on deathTable 7: Propensity score used as continuous variable in logistic regression predicting effect of Table 7: Propensity score used as continuous variable in logistic regression predicting effect of Table 7: Propensity score used as continuous variable in logistic regression predicting effect of
Outcome: Death Odds Ratio 95% CI p-value
FWB use 0.09 0.02, 0.53 0.007
Injury Severity Score 1.07 1.03, 1.11 <0.001
Glasgow Coma Score 0.71 0.65, 0.78 <0.001
Propensity score 9.12 1.35, 61.48 0.023
Arrival systolic blood pressure, arrival temperature, use of factor VIIa, total packed red blood cells and total plasma administered were used to calculate propensity scoreArrival systolic blood pressure, arrival temperature, use of factor VIIa, total packed red blood cells and total plasma administered were used to calculate propensity scoreArrival systolic blood pressure, arrival temperature, use of factor VIIa, total packed red blood cells and total plasma administered were used to calculate propensity scoreArrival systolic blood pressure, arrival temperature, use of factor VIIa, total packed red blood cells
onsdag 5. september 2012
Propensity Score Analysis Predicting Effect of FWB on Death
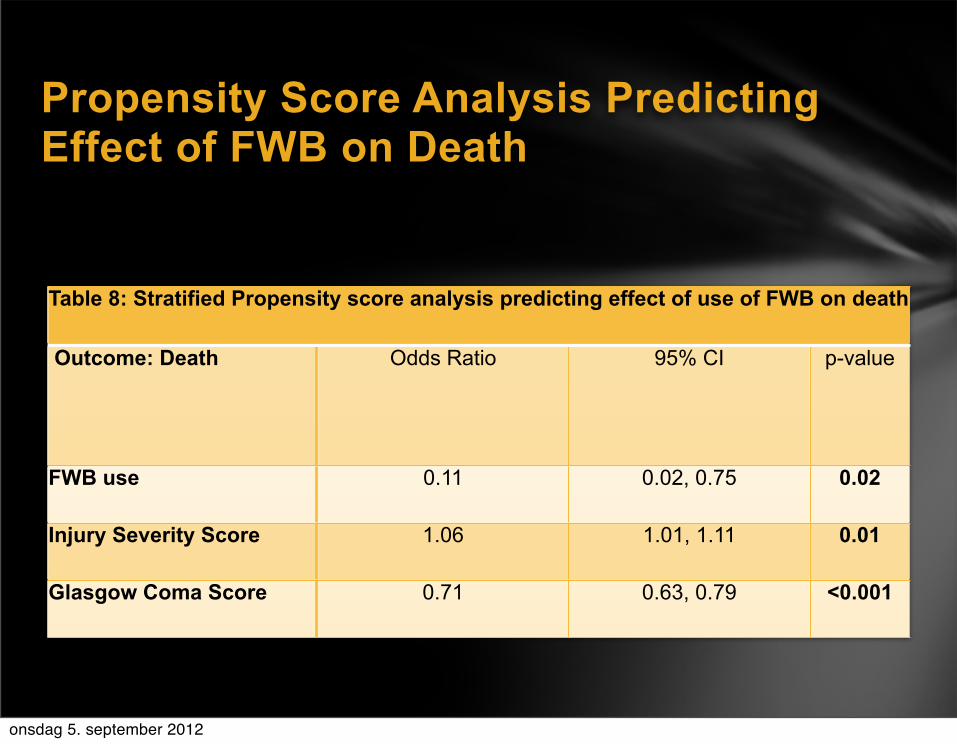
Table 8: Stratified Propensity score analysis predicting effect of use of FWB on death Table 8: Stratified Propensity score analysis predicting effect of use of FWB on death Table 8: Stratified Propensity score analysis predicting effect of use of FWB on death Table 8: Stratified Propensity score analysis predicting effect of use of FWB on death
Outcome: Death Odds Ratio 95% CI p-value
FWB use 0.11 0.02, 0.75 0.02
Injury Severity Score 1.06 1.01, 1.11 0.01
Glasgow Coma Score 0.71 0.63, 0.79 <0.001
onsdag 5. september 2012

Using logistic regression and propensity score analysis patients receiving RBCs and FFP with FWB had significantly higher survival than those who received RBCs and FFP alone.
Results
onsdag 5. september 2012

94 Patients received MBT
49 with FWB, RBCs, and FFP
DOW=8.16%
45 with RBCs and FFP
DOW=26.67%
P=0.025
Subset Analysis
onsdag 5. september 2012

94 patients received FWB51% was type Specific DOW=6.1%49% type O DOW=6.7%
Subset Analysis
onsdag 5. september 2012

Injury Severity Score
0
6,50
13,00
19,50
26,00
22,4525,820,15
All patientsMass transfused patientsFresh whole blood patients
onsdag 5. september 2012
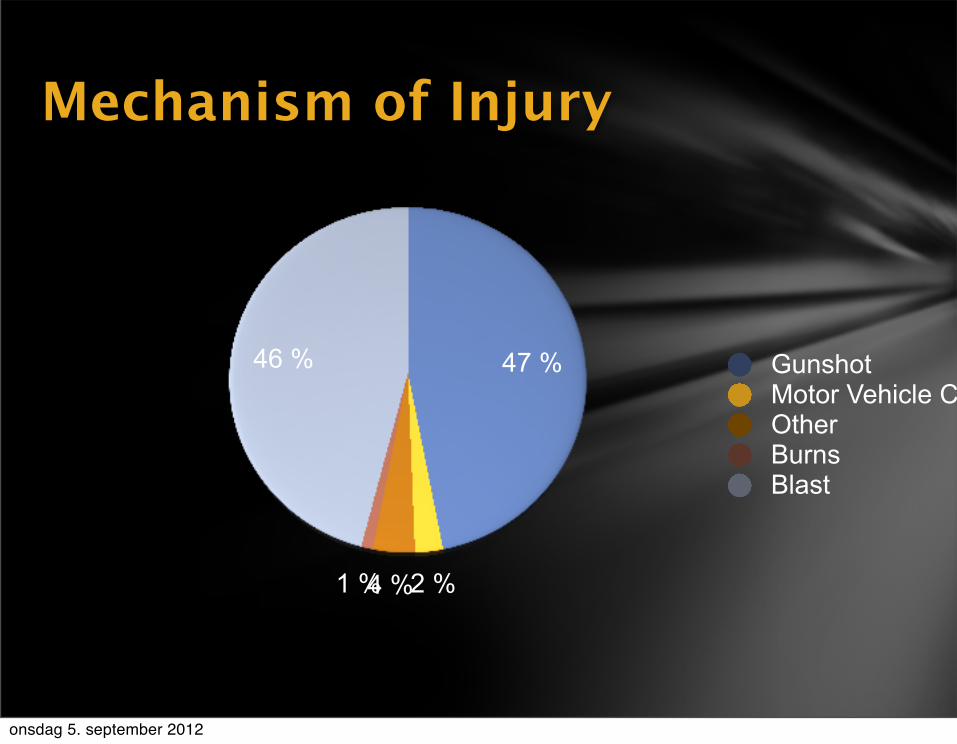
Mechanism of Injury
47 %
2 %4 %1 %
46 % GunshotMotor Vehicle CollisionOtherBurnsBlast
onsdag 5. september 2012

Injury by Site4 %1 %5 %
6 %
12 %
1 %2 % 5 %
39 %
24 % AbdominalExtremityVascularUrologyGYNThoracicHead/NeckNeuroBurnOther
onsdag 5. september 2012

541st Medical Detachment
Damage Control ResuscitationDamage Control SurgeryEvacuation
Forward Surgical Teams
onsdag 5. september 2012

541st Medical Detachment
Surgical Support of Combat OperationsForward Surgical Team
20 Personnel
6 HMMWV
3 Tents
2 OR tables
30 Operations
Limited holding
20 units PRBCs
Maneuvers with a combat brigade
1 hour set up
Combat Support Hospital
84 Beds
8 OR Tables
36+ ICU beds
Large
Slow
Lab
X-ray
Trauma Center
Division support area
onsdag 5. september 2012

Combat Surgical Support
onsdag 5. september 2012

541st Medical Detachment
Prevents the Lethal Triad of Trauma
hypothermia
acidosis
coagulopathy
Minimize crystalloid
Transfuse RBC:FFP:PLTs 1:1:1
Damage Control Surgery
stops the bleeding
or it doesn’t
Damage Control Resuscitation
onsdag 5. september 2012

541st Medical Detachment
Corrects Trauma associated Coagulopathy
Present in 1/3 of combat wounded
blood loss
acidosis
hypothermia
consumption
fibrinolysis
dilution
Damage Control
onsdag 5. september 2012

Damage Control Resuscitation allows Damage Control Surgery
RBC:FFP:PLT=1:1:1
4 units RBC triggers DCR
10 units RBC=10 units FFP=10 pack PLTs
1 unit of Fresh Whole Blood
1 unit of RBCs
1 unit of FFP
130,000 to 350,000 PLTs per microliter
Damage Control Surgery
onsdag 5. september 2012
Historically Type O Fresh Whole Blood Transfused
Current Clinical Practice Guideline requires type specific FWB despite historical data
Patients in this study received type O and type specific blood with no difference in mortality
Difficult to determine blood transfusion reactions in this environment
Further study warranted
Type O Fresh Whole Blood
onsdag 5. september 2012

FWB can be safely transfused at Level II Surgical FacilitiesFWB is independently associated with survival compared to patients who only receive RBCs and FFP at Level II facilities
Conclusions
onsdag 5. september 2012

DCR in locations without PLTs should include FWB
FST personnel must be trained to transfuse FWB
All combat surgeons should be trained in DCR and DCS
Role II Facilities primary role is DCR and DCS
Role II facilities should have a minimum of 2 General Trauma Surgeons
All deploying personnel should be typed and screened pre-deployment
Deploying personnel should undergo standard blood donor testing
Type O blood may be used in emergency situations to prevent exsanguination
Recommendations
onsdag 5. september 2012

Questions
onsdag 5. september 2012