u.s. angler population - american sportfishing association · 2018-08-29 · u.s. angler population...
TRANSCRIPT

U.S. Angler Population
Who Comes and Who Goes
Report one of six in a series September, 2015
2
Acknowledgments
This report, along with the other reports and materials associated with this report series,
were produced with funding awarded by the Multi-State Conservation Grant program, grant
#F14AP00138 as part of the Federal Aid in Sport Fish Restoration Program, administered by the U.S.
Fish and Wildlife Service and the Association of Fish and Wildlife Agencies. The American
Sportfishing Association (ASA) thanks these organizations for their support of these and other such
projects.
ASA also extends its thanks and appreciation to the 12 states that provided support, staff
time and license data to make this project possible: Colorado, Florida, Georgia, Maine, Michigan,
Minnesota, Mississippi, Montana, New Hampshire, New York, Utah and Wisconsin. Without their
cooperation and data, this report would not be possible.
This report was developed by Southwick Associates. Southwick Associates thanks the ASA
staff who contributed to this report. Also, we wish to thank the many state agency staff who took
time to answer questions and provide critical data.
Regardless of the contributions of many, Southwick Associates remains responsible for the
content within.
Suggested citation: American Sportfishing Association. “U.S. Angler Population: Who Comes and Who
Goes.” Report one of six in a series. Produced by Southwick Associates. September, 2015.
P.O. Box 6435, Fernandina Beach, FL 32035
(904) 277-9765; [email protected]

3
Table of Contents
Acknowledgments………………………………………………………………………………………… 2
Executive Summary………………………………………………………………………………………. 4
Introduction…………………………………………………………………………………………………. 5
Approach……………………………………………………………………………………………………… 6
Findings………………………………………………………………………………………………………… 7
Annual Churn Rate among 12 Participating States…………………………… 8
Composition of Licensed Angler Population…………………………………….. 11
Discussion……………………………………………………………………………………………………… 15

4
Executive Summary
When it comes to sportfishing “churn”—anglers transitioning in and out of the sport from year to year—there’s good news and bad news, and both are surprising. The bad news is anglers are not nearly as avid as we like to think. The good news is there’s far more low-hanging fruit than we realize when it comes to growing the sport. These and other findings are explained in this report which is first in a series from the American Sportfishing Association by Southwick Associates that sheds greater light on anglers’ fishing habits and loyalty to the sport.
Overall fishing participation is relatively stable from year to year, annually hovering around 33 million people over the age of 16, easily giving the impression that anglers are consistently taking part in the sport.1 Looking below the surface, however, the pool of individual anglers actually fluctuates greatly—about the same number of people joins and leaves the angling population each year. Not surprisingly, the study showed those most likely to come and go are female anglers, those between the ages of 18 and 24 years, and residents of urban communities. Other highlights include:
Die-hard anglers are a small group: Out of the pool of roughly 33 million people who fish each year1, only four percent of the licensed anglers purchase a fishing license every year (10 out of 10 years). The largest proportion of anglers—49 percent—purchases a license only one out of 10 years. Almost as many—47 percent—purchase a license in more than one year but lapse in between purchases.
Participation fluctuates greatly year-to-year: Close to half of all licensed anglers (46%) do not renew their licenses in any given year. The typical angler buys a license about three out of every 10 years throughout their fishing lifetime. For resident license holders, 41 percent do not renew, while 63 percent of non-residents do not renew.
“R3” numbers: Retained anglers, those who purchased a license in a given year and the previous one, are about 52 percent of the angling population. Recruited anglers, those who bought a license in a given year but not in at least five of the preceding years, are about 28 percent. The number of reactivated anglers is about 18 percent, with two percent of records unidentifiable. These are anglers who bought a license in a given year and at least one of the previous five years, but not the immediate preceding year.
Female anglers lapse more: In recent years, the growing number of female anglers has received a great deal of attention, but the churn rate for women is still about 13 percent higher than the rate for men.
Younger anglers lapse more: Annual churn rates are lowest, about 39 percent, among the 55-64 age group and are highest, about 55 percent, among anglers 18-24 years of age.
Urban residents lapse more: The churn rate among residents of urban communities, who make up about 10 percent of the angling population, is about 13 percent higher than those anglers living in rural communities and about seven percent higher than those living in suburban communities.
To produce these insights, 10 years of fishing license data covering 2004 to 2013 were compiled and studied for 12 states (CO, FL, GA, ME, MI, MN, MS, MT, NH, NY, UT, and WI) to provide regionally and nationally representative portraits of anglers for this and future reports in the series.
1 U.S. Fish and Wildlife Service, 2011 National Survey of Fishing, Hunting and Wildlife-Associated Recreation. 2013.
http://wsfrprograms.fws.gov/Subpages/NationalSurvey/NatSurveyIndex.htm. Arlington, VA
5
Introduction
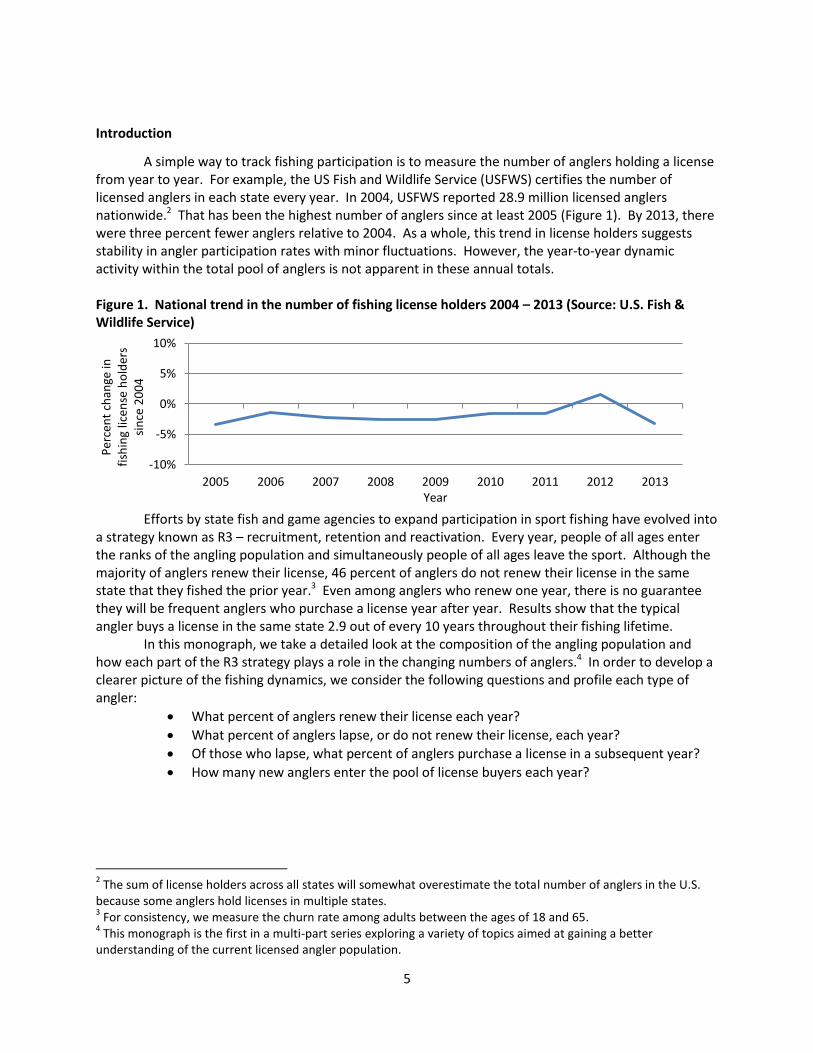
A simple way to track fishing participation is to measure the number of anglers holding a license from year to year. For example, the US Fish and Wildlife Service (USFWS) certifies the number of licensed anglers in each state every year. In 2004, USFWS reported 28.9 million licensed anglers nationwide.2 That has been the highest number of anglers since at least 2005 (Figure 1). By 2013, there were three percent fewer anglers relative to 2004. As a whole, this trend in license holders suggests stability in angler participation rates with minor fluctuations. However, the year-to-year dynamic activity within the total pool of anglers is not apparent in these annual totals. Figure 1. National trend in the number of fishing license holders 2004 – 2013 (Source: U.S. Fish & Wildlife Service)
Efforts by state fish and game agencies to expand participation in sport fishing have evolved into
a strategy known as R3 – recruitment, retention and reactivation. Every year, people of all ages enter the ranks of the angling population and simultaneously people of all ages leave the sport. Although the majority of anglers renew their license, 46 percent of anglers do not renew their license in the same state that they fished the prior year.3 Even among anglers who renew one year, there is no guarantee they will be frequent anglers who purchase a license year after year. Results show that the typical angler buys a license in the same state 2.9 out of every 10 years throughout their fishing lifetime.
In this monograph, we take a detailed look at the composition of the angling population and how each part of the R3 strategy plays a role in the changing numbers of anglers.4 In order to develop a clearer picture of the fishing dynamics, we consider the following questions and profile each type of angler:
What percent of anglers renew their license each year?
What percent of anglers lapse, or do not renew their license, each year?
Of those who lapse, what percent of anglers purchase a license in a subsequent year?
How many new anglers enter the pool of license buyers each year?
2 The sum of license holders across all states will somewhat overestimate the total number of anglers in the U.S.
because some anglers hold licenses in multiple states. 3 For consistency, we measure the churn rate among adults between the ages of 18 and 65.
4 This monograph is the first in a multi-part series exploring a variety of topics aimed at gaining a better
understanding of the current licensed angler population.
-10%
-5%
0%
5%
10%
2005 2006 2007 2008 2009 2010 2011 2012 2013
Per
cen
t ch
ange
in
fish
ing
licen
se h
old
ers
sin
ce 2
00
4
Year

6
Approach
Twelve states provided annual fishing license databases spanning a decade, from 2004 through 2013.5 These states were chosen to provide a regionally and nationally representative portrait of anglers. The database files were synchronized at the state-level to create one harmonized database of individuals along with their fishing license purchasing history over the entire decade.
Processing the raw databases required linking license records for each individual angler over a period of ten years. Issues that needed to be addressed included changes in states’ license structures during that time and identifying unique individuals across ten years of license sales data. Every effort was made to achieve the highest level of accuracy when characterizing an individual’s purchase history. Additionally, the twelve-state collection of license sales records was proportionally weighted to accurately represent regional and national results.
For this churn analysis, the total angler pool was limited to those who were at least age 18 in 2004 and no older than 65 in 2013. This group is referred to as “licensed anglers” in the remainder of the report. In many states, youth and senior citizens are eligible for a special category of licenses by virtue of their age (e.g., youth license, senior discounted license, permanent license) that is not consistent with most other states’ licensing options.
This is the first in a series of reports that examine anglers’ loyalty, background and more. The primary focus of this first report is to introduce the concept of churn by using nationwide trends in license purchase history among anglers. Except for comparisons between residents and nonresidents of the participating states, most of the report does not make a distinction between these two groups6. The measure of churn, then, reflects the turnover among people who fish within each of the participating states regardless of residency. Churn within any given state among non-residents is higher than among residents; therefore, their inclusion inflates the overall churn rate, albeit slightly based on the low proportion of nonresident anglers compared to resident anglers. Likewise, we are not able to account for residents who purchase a license outside of their home in any year when they do not purchase a resident license. This omission has the effect of overestimating churn in fishing activity among residents. Our approach includes both residents and nonresidents consistently across all years and all states. Therefore, the relative trends in churn are stable over time regardless of the effect on absolute churn rates. The churn rates specific to residents and non-residents will be presented separately throughout this series of reports.
This research effort is intended to provide a better understanding of anglers, including the types of people who fish and their level of loyalty to the sport. Through a better understanding, participation can be supported and R3 outreach efforts can be effectively tailored to the segments of anglers most at risk of lapsing, those most likely to stay engaged, and those most likely to re-engage with the sport. These efforts in turn have the potential to boost license sales revenues and increase conservation funding generated by license sales and excise tax revenue. The results of this effort can also be used by private interests to better understand the sportfishing marketplace.
In the remainder of this report, we present three different measures of angler participation from 2004 through 2013. First, we show the number of licenses purchased by individual anglers over the ten-year period as well as the average number of years fished over a rolling “window” of five-year periods. Second, we describe in detail the annual rate of churn among the angler population for each year between 2009 and 2013, both as a whole and across selected demographic characteristics (age,
5 The twelve participating states are Colorado, Florida, Georgia, Maine, Michigan, Minnesota, Mississippi,
Montana, New Hampshire, New York, Utah, and Wisconsin. 6 The remaining reports in this series will focus exclusively on resident anglers in all of the participating states.
7
gender, and neighborhood type). Finally, we introduce a categorization of anglers based on their purchase history to shed new light on the R3 strategy as it relates to the overall composition of the fishing population. Those categories are: 7
Recruited anglers: anglers who purchased a license in a given year but have not purchased a license in any of the five preceding years.
Retained anglers: anglers who purchased a license in a given year and also purchased a license in the preceding year.
Re-activated anglers: anglers who purchased a license in a given year and purchased at least once in the previous five years but not the immediately preceding year.
Lifetime or multi-year anglers: anglers who did not purchase a license in a given year, but are licensed virtue of holding an active lifetime or multi-year license purchased in a previous year.
While the report explores multiple time frames, the findings focus on a particular license period. As
a result, it is possible for an angler to transition between multiple categories. For example, a licensed angler could shift from a recruited to a retained and then into a re-activated angler between 2009 and 2013.
Findings
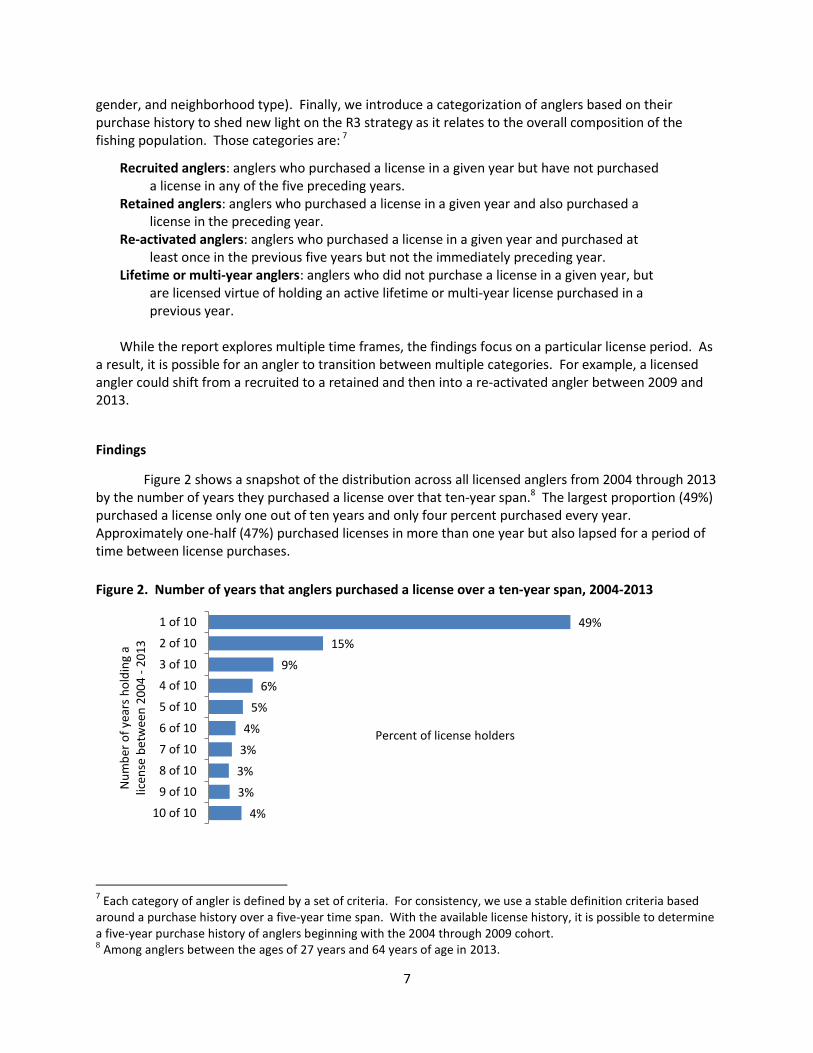
Figure 2 shows a snapshot of the distribution across all licensed anglers from 2004 through 2013 by the number of years they purchased a license over that ten-year span.8 The largest proportion (49%) purchased a license only one out of ten years and only four percent purchased every year. Approximately one-half (47%) purchased licenses in more than one year but also lapsed for a period of time between license purchases.
Figure 2. Number of years that anglers purchased a license over a ten-year span, 2004-2013
7 Each category of angler is defined by a set of criteria. For consistency, we use a stable definition criteria based
around a purchase history over a five-year time span. With the available license history, it is possible to determine a five-year purchase history of anglers beginning with the 2004 through 2009 cohort. 8 Among anglers between the ages of 27 years and 64 years of age in 2013.
4%
3%
3%
3%
4%
5%
6%
9%
15%
49%
10 of 10
9 of 10
8 of 10
7 of 10
6 of 10
5 of 10
4 of 10
3 of 10
2 of 10
1 of 10
Percent of license holders
Nu
mb
er o
f ye
ars
ho
ldin
g a
licen
se b
etw
een
20
04
- 2
01
3
8
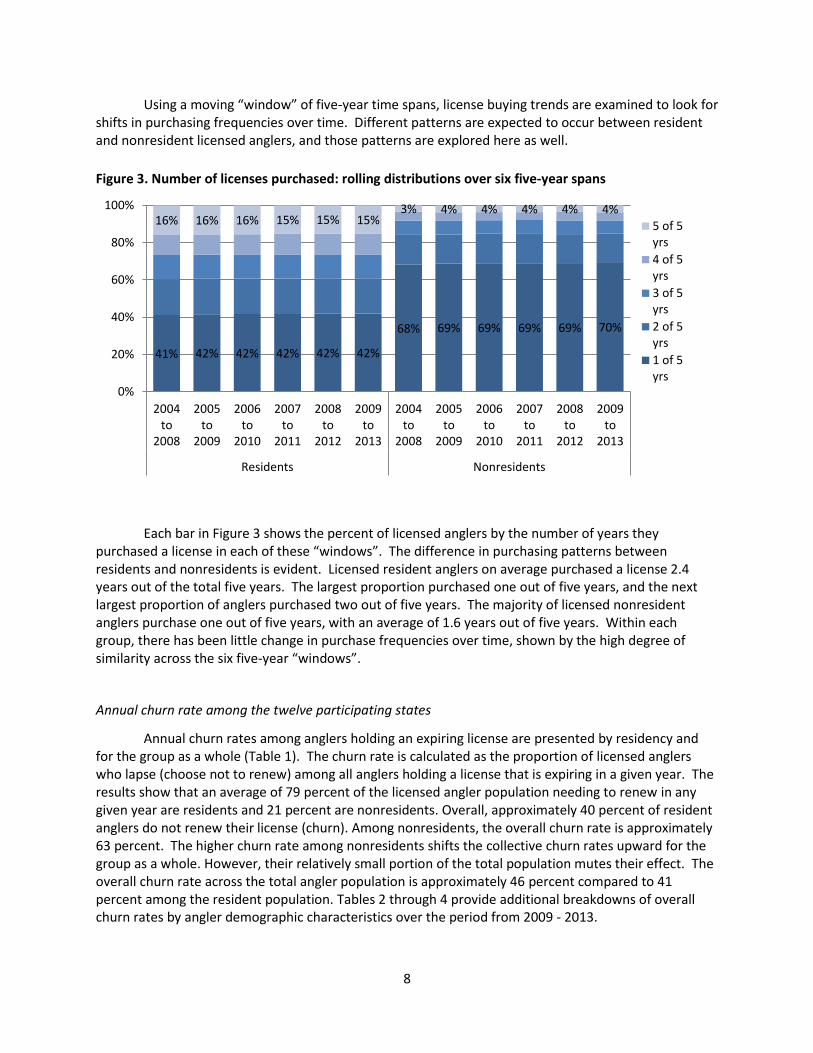
Using a moving “window” of five-year time spans, license buying trends are examined to look for shifts in purchasing frequencies over time. Different patterns are expected to occur between resident and nonresident licensed anglers, and those patterns are explored here as well.
Figure 3. Number of licenses purchased: rolling distributions over six five-year spans
Each bar in Figure 3 shows the percent of licensed anglers by the number of years they
purchased a license in each of these “windows”. The difference in purchasing patterns between residents and nonresidents is evident. Licensed resident anglers on average purchased a license 2.4 years out of the total five years. The largest proportion purchased one out of five years, and the next largest proportion of anglers purchased two out of five years. The majority of licensed nonresident anglers purchase one out of five years, with an average of 1.6 years out of five years. Within each group, there has been little change in purchase frequencies over time, shown by the high degree of similarity across the six five-year “windows”.
Annual churn rate among the twelve participating states
Annual churn rates among anglers holding an expiring license are presented by residency and for the group as a whole (Table 1). The churn rate is calculated as the proportion of licensed anglers who lapse (choose not to renew) among all anglers holding a license that is expiring in a given year. The results show that an average of 79 percent of the licensed angler population needing to renew in any given year are residents and 21 percent are nonresidents. Overall, approximately 40 percent of resident anglers do not renew their license (churn). Among nonresidents, the overall churn rate is approximately 63 percent. The higher churn rate among nonresidents shifts the collective churn rates upward for the group as a whole. However, their relatively small portion of the total population mutes their effect. The overall churn rate across the total angler population is approximately 46 percent compared to 41 percent among the resident population. Tables 2 through 4 provide additional breakdowns of overall churn rates by angler demographic characteristics over the period from 2009 - 2013.
41% 42% 42% 42% 42% 42%
68% 69% 69% 69% 69% 70%
16% 16% 16% 15% 15% 15% 3% 4% 4% 4% 4% 4%
0%
20%
40%
60%
80%
100%
2004to
2008
2005to
2009
2006to
2010
2007to
2011
2008to
2012
2009to
2013
2004to
2008
2005to
2009
2006to
2010
2007to
2011
2008to
2012
2009to
2013
Residents Nonresidents
5 of 5yrs
4 of 5yrs
3 of 5yrs
2 of 5yrs
1 of 5yrs

9
Table 1. Annual churn rate 2009 to 2013
Anglers with an expiring license
(2009-2013)
Annual churn rate by year Average Annual Churn 2009 2010 2011 2012 2013
Anglers 100% 44% 46% 46% 46% 46% 46%
Residents 79% 38% 40% 41% 41% 41% 40%
Nonresidents 21% 62% 64% 63% 62% 63% 63%
The average annual churn rate is highest (55%) among licensed anglers between the ages of 18 –
24 years of age and declines steadily with age. Licensed anglers between the ages of 55 – 64 years of age have the lowest (38%-40%) churn rate of all the age groups investigated.
Table 2. Annual churn rate by age 2009 to 2013
Annual churn rate by age category Year 18-24 yrs. 25-34 yrs. 35-44 yrs. 45-54 yrs. 55-64 yrs.
2009 53% 49% 44% 40% 38%
2010 56% 51% 46% 43% 40%
2011 56% 51% 46% 43% 40%
2012 55% 51% 46% 43% 40%
2013 55% 51% 47% 43% 40%
Average 55% 51% 46% 42% 40%
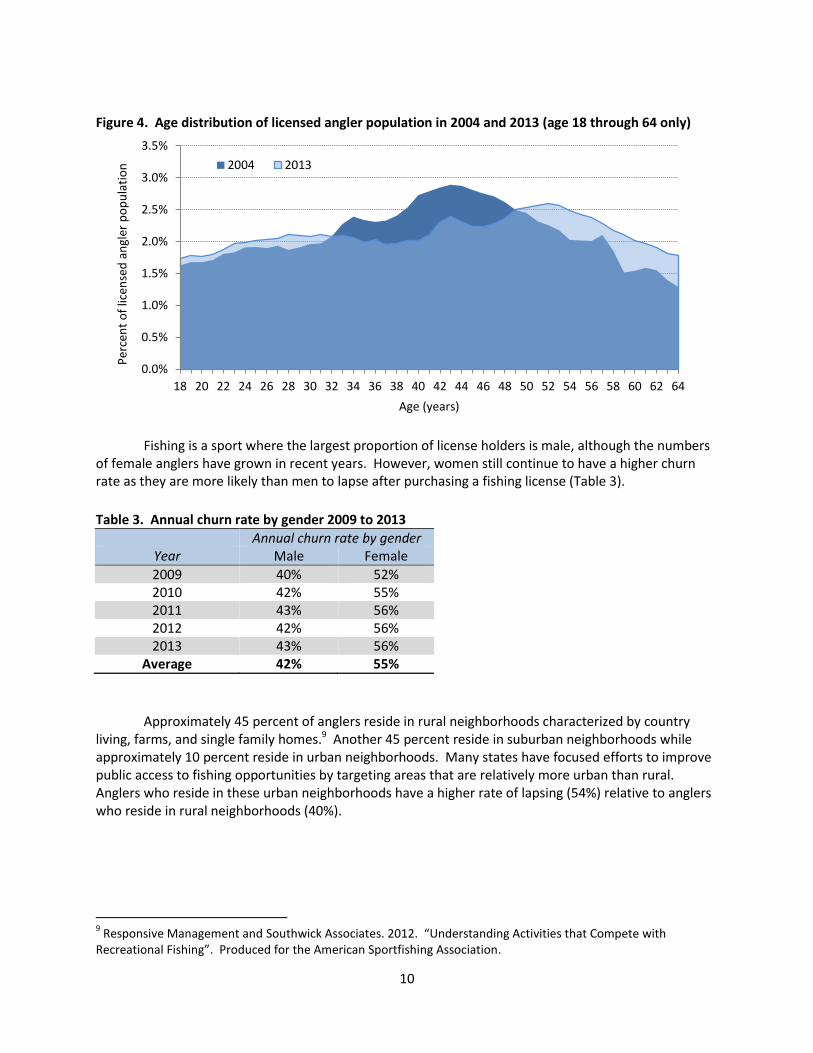
A person’s age is often related to other factors that might affect their level of fishing
participation. Younger anglers face a number of factors that compete for their time including family life, school, work, and other recreational pursuits. Older anglers who might have more free time as work obligations lessen can face health issues that limit their ability to fish. Figure 4 shows the percent distribution of fishing license holders by year of age in 2004 and 2013. The graphic shows a number of key highlights between the 2004 and 2013 distributions: 1) there are slightly more anglers between the ages of 18 and 33 years of age (Generation Y) in 2013 relative to 2004, 2) there are fewer anglers between the ages of 34 and 49 years of age (Generation X) in 2013, and 3) there are more anglers over the age of 50 (Baby Boomers) at both time periods. Moreover the graphic clearly shows the aging of the baby boom anglers and the impending decline in the angling population when they begin to “age out” of fishing.
10
Figure 4. Age distribution of licensed angler population in 2004 and 2013 (age 18 through 64 only)
Fishing is a sport where the largest proportion of license holders is male, although the numbers
of female anglers have grown in recent years. However, women still continue to have a higher churn rate as they are more likely than men to lapse after purchasing a fishing license (Table 3).
Table 3. Annual churn rate by gender 2009 to 2013
Annual churn rate by gender Year Male Female
2009 40% 52% 2010 42% 55% 2011 43% 56% 2012 42% 56% 2013 43% 56%
Average 42% 55%
Approximately 45 percent of anglers reside in rural neighborhoods characterized by country
living, farms, and single family homes.9 Another 45 percent reside in suburban neighborhoods while approximately 10 percent reside in urban neighborhoods. Many states have focused efforts to improve public access to fishing opportunities by targeting areas that are relatively more urban than rural. Anglers who reside in these urban neighborhoods have a higher rate of lapsing (54%) relative to anglers who reside in rural neighborhoods (40%).
9 Responsive Management and Southwick Associates. 2012. “Understanding Activities that Compete with
Recreational Fishing”. Produced for the American Sportfishing Association.
0.0%
0.5%
1.0%
1.5%
2.0%
2.5%
3.0%
3.5%
18 20 22 24 26 28 30 32 34 36 38 40 42 44 46 48 50 52 54 56 58 60 62 64
Per
cen
t o
f lic
ense
d a
ngl
er p
op
ula
tio
n
Age (years)
2004 2013

11
Table 4. Annual churn rate by neighborhood type 2009 to 2013
Annual churn rate
by neighborhood type Year Urban Suburban Rural
2009 52% 44% 38%
2010 54% 47% 41% 2011 54% 47% 41% 2012 54% 47% 40% 2013 55% 47% 41%
Average 54% 47% 40%
Composition of licensed angler population
This next section explores the composition of the licensed angler population from the perspective of the four categories defined earlier: recruited, retained, re-activated, and lifetime/multi-year anglers. The majority (51%-53%) of licensed buyers in any given year can be described as retained anglers who purchased a license in the previous year and elected to purchase a license again during the current year. Multi-year licenses, including lifetime licenses, are being offered by an increasing number of states. However, that group currently makes up a very small proportion of the licensed angler group.
Between 27%-28% of anglers can be defined as recruited anglers, those who have not purchased a fishing license for at least five years before they are recorded in the license database. Between 17%-19% can be defined as re-activated anglers – those anglers who bought a license in a given year and purchased at least one in the previous five years but not the immediate preceding year. In other words, 44% to 48% of the licensed angler population represents a group who has not purchased a license in a previous year. And, of that proportion, approximately 60 percent are recruited anglers and 40 percent are re-activated anglers.
Figure 5. Composition of license holder population 2009 to 2013
Figure 6 and Table 5 show the distribution of the license holders across five age categories.
Figure 6 focuses only on 2013 while Table 5 shows detailed results for 2009-2013. Licensed anglers who are 18 to 24 years old are more likely to be identified as recruited anglers and least likely to be retained or re-activated anglers. Licensed anglers between the ages of 55 and 64 are most likely to be identified as retained anglers, relative to other groups. And, three categories of anglers (25 – 34 years, 35 – 44
2%
2%
2%
2%
3%
51%
53%
52%
51%
51%
28%
27%
27%
27%
28%
19%
17%
19%
19%
19%
0% 10% 20% 30% 40% 50% 60% 70% 80% 90% 100%
2009
2010
2011
2012
2013
Lifetime or multi-year anglers Retained anglers Recruited anglers Re-actived anglers

12
years, and 45 – 54 years) are equally likely to be re-activated anglers, but only slightly more than older anglers. Review of Table 5 shows that these distinctions have held true over the most recent five year period. Figure 6. Composition of license holders by age in 2013
4%
3%
3%
2%
1%
58%
55%
51%
47%
36%
20%
22%
25%
31%
50%
18%
20%
20%
21%
13%
0% 20% 40% 60% 80% 100%
55-64 years old
45-54 years old
35-44 years old
25-34 years old
18-24 years old
Lifetime/ multi-year anglers Retained anglers Recruited anglers Re-activated anglers

13
Table 5. Composition of license holder population by age 2009 to 2013
Anglers holding an active license
Age category
Year Total
anglers
Lifetime or multi-year
anglers
Retained anglers
Recruited anglers
Re-activated anglers
18-24
2009 100% 0% 37% 50% 13%
2010 100% 1% 38% 49% 12%
2011 100% 1% 37% 49% 13%
2012 100% 1% 36% 50% 13%
2013 100% 1% 36% 50% 13%
25-34
2009 100% 1% 47% 31% 20%
2010 100% 1% 50% 30% 19%
2011 100% 2% 48% 30% 20%
2012 100% 2% 47% 30% 21%
2013 100% 2% 47% 31% 21%
35-44
2009 100% 2% 51% 26% 21%
2010 100% 2% 54% 25% 19%
2011 100% 3% 52% 25% 20%
2012 100% 3% 51% 25% 21%
2013 100% 3% 51% 25% 20%
45-54
2009 100% 2% 55% 23% 20%
2010 100% 3% 58% 22% 18%
2011 100% 3% 56% 22% 19%
2012 100% 3% 55% 22% 20%
2013 100% 3% 55% 22% 20%
55-64
2009 100% 2% 57% 22% 19%
2010 100% 3% 60% 20% 17%
2011 100% 3% 59% 20% 18%
2012 100% 3% 58% 20% 18%
2013 100% 4% 58% 20% 18%
The population of licensed anglers who are male has a higher portion of people who purchase a license the following year, relative to female anglers (Table 6). Conversely, the population of female anglers has a larger portion of recruited anglers. No significant differences in proportions of re-activated anglers exist between the two groups.

14
Table 6. Composition of license holder population by gender 2009 to 2013
Anglers holding an active license
Gender Year Total anglers
Lifetime or multi-year
anglers
Retained anglers
Recruited anglers
Re-activated anglers
Male
2009 100% 2% 54% 25% 19%
2010 100% 2% 57% 24% 17%
2011 100% 2% 56% 24% 18%
2012 100% 2% 54% 24% 19% 2013 100% 3% 54% 25% 19%
Female
2009 100% 2% 42% 36% 20%
2010 100% 2% 44% 35% 19%
2011 100% 2% 42% 36% 20%
2012 100% 2% 41% 36% 20% 2013 100% 2% 41% 37% 20%
Licensed anglers who reside in rural neighborhoods are more likely to purchase a license the following year; conversely, the population of urban anglers has a larger portion of recruited anglers. No significant differences in proportions of re-activated anglers exist between the two groups.
Table 7. Composition of license holder population by neighborhood type 2009 to 2013
Anglers holding an active license
Urban/ Rural
Year Total
anglers
Lifetime or multi-year
anglers
Retained anglers
Recruited anglers
Re-activated anglers
Urban
2009 100% 2% 43% 37% 19%
2010 100% 2% 45% 36% 17%
2011 100% 3% 44% 35% 18%
2012 100% 3% 43% 36% 19% 2013 100% 3% 43% 36% 19%
Suburban
2009 100% 2% 51% 29% 19%
2010 100% 2% 53% 28% 17%
2011 100% 3% 51% 28% 19%
2012 100% 3% 50% 28% 19% 2013 100% 3% 50% 28% 19%
Rural
2009 100% 1% 56% 24% 19%
2010 100% 1% 59% 22% 17%
2011 100% 2% 58% 22% 18%
2012 100% 2% 57% 22% 19% 2013 100% 2% 57% 23% 18%

15
Discussion
Even when the total number of licensed anglers shows a reasonable level of stability from year to year, the nation experiences a dynamic level of churn in the licensed angler population each year. Over the last five years, approximately 45 percent of licensed anglers living in the participating states did not renew their fishing privileges each year. Female anglers, anglers aging 18 – 24 years, and anglers residing in urban areas are more likely to lapse, relative to their counterparts.
Both residents and nonresidents are included in this churn analysis to reflect the ratio of renewal versus nonrenewal across the whole angler population that occurs year-to-year. While the inclusion of nonresidents does shift the annual churn rate upward, that shift is slight given that the calculated rate is a weighted proportion of licensed nonresident to licensed resident anglers. The persistence in the level of churn from year to year is not influenced by the inclusion of nonresidents, as the approach was applied consistently across geography and time. The next report in the series will investigate the harmonized license data at a regional level. Within the smaller geographic scope, the influence of the proportion of licensed resident to licensed nonresident anglers has the potential to be greater and therefore forthcoming analysis will focus exclusively on licensed resident anglers.
Anglers enter and leave the sport for a variety of reasons. One of the most commonly cited reasons is “lack of time”.10 This is likely indicates shifting interests and priorities. As family and work obligations change, anglers who have been license holders might choose to take a hiatus from the sport. Conversely, individuals who have never fished might try the sport, particularly if other friends and family are interested. To provide deeper insight into the licensed angler population beyond annual churn, the composition of the group is presented across four categories (lifetime/multi-year, retained, recruited, and re-activated) where assignments are based on purchasing behaviors over the last ten years.
Younger anglers, 18 – 24 years old, are most likely to be categorized as recruited anglers. Older anglers, 55 – 64 years old show a higher level of loyalty to the sport and are most likely categorized as retained anglers. Male anglers are more likely to be identified as retained anglers while female anglers are more apt to be identified as recruited anglers. States are more likely to retain anglers who reside in rural neighborhoods while the largest proportion of recruited anglers resides in urban neighborhoods.
These findings show the importance of focusing retention efforts to keep the active anglers engaged as well as to expand the active angler population through both recruitment and re-engagement. Recruited and reactivated anglers make up 44 percent to 48 percent of all licensed anglers in a given year. And, of that group, slightly less than one-half are anglers who have fished in the past but also have recently lapsed. While an individuals might never stop thinking of themselves as an angler, they do not tend to purchase a fishing license with a similar level of avidity. In fact, over a five year period, only one-tenth of anglers purchase a license every year. Instead, an angler is more likely to transition into and out of the sport, purchasing a license two or three times over five years. This is the first in a series of reports sharing the results of this new research into anglers’ loyalty to the sport, where they live and motivations to take up fishing. We encourage the reader to ask questions about why anglers discontinue fishing every year, and for further investigation, we refer the reader to other American Sportfishing Association reports on this topic.11 With accurate knowledge of anglers including their participation rates, motivations and preferences, the sportfishing community will be better equipped to maintain and improve sportfishing participation in the future.
10
Responsive Management and Southwick Associates. 2012. “Why do anglers sit on the fence about going fishing? A study of why they do and don’t fish and what will get them on the water”. Produced for the American Sportfishing Association under a US Fish and Wildlife Service Sport Fish Restoration grant. 11
“On the Fence” is one such report, examining activities that compete for anglers’ attention. Visit “Facts and Figures” on the ASA website to obtain a copy. www.Asafishing.org.