urinalysis screening of drugs in adulterated samples via
TRANSCRIPT

University of Central Florida University of Central Florida
STARS STARS
Honors Undergraduate Theses UCF Theses and Dissertations
2019
Urinalysis Screening of Drugs in Adulterated Samples via Direct Urinalysis Screening of Drugs in Adulterated Samples via Direct
Analysis in Real Time -- High Resolution/ Mass Spectrometry Analysis in Real Time -- High Resolution/ Mass Spectrometry
(DART-HR/MS) (DART-HR/MS)
Bianca E. Olivieri University of Central Florida
Part of the Biochemistry Commons, and the Chemistry Commons
Find similar works at: https://stars.library.ucf.edu/honorstheses
University of Central Florida Libraries http://library.ucf.edu
This Open Access is brought to you for free and open access by the UCF Theses and Dissertations at STARS. It has
been accepted for inclusion in Honors Undergraduate Theses by an authorized administrator of STARS. For more
information, please contact [email protected].
Recommended Citation Recommended Citation Olivieri, Bianca E., "Urinalysis Screening of Drugs in Adulterated Samples via Direct Analysis in Real Time -- High Resolution/ Mass Spectrometry (DART-HR/MS)" (2019). Honors Undergraduate Theses. 538. https://stars.library.ucf.edu/honorstheses/538

URINALYSIS SCREENING OF DRUGS IN ADULTERATED SAMPLES VIA DIRECT ANALYSIS IN REAL TIME – HIGH RESOLUTION/MASS
SPECTROMETRY
by
BIANCA E. OLIVIERI
B.S. University of Central Florida, 2019
A thesis submitted in partial fulfillment of the requirements for the Honors in the Major Program
in the Department of Chemistry in the College of Sciences
at the University of Central Florida Orlando, Florida
Spring Term 2019
Major Professor: Candice Bridge

ii
ABSTRACT
Current screening methods for drug analysis with urine samples includes
examination of the sample with an immunoassay. These methods are used to determine
the concentration of drug metabolites contained within the sample prior to further
confirmatory testing. Drug testing plays a crucial role in maintaining safe workplace
environments and safety of individuals. However, a positive result can lead to heavy
consequences for the employee including suspension or removal from the workplace.
Therefore, a majority of individuals add commonly known products into the sample to
evade detection by developing a false negative result. Although specimen integrity
examinations are performed to identify tampering of the sample, these results are typically
biased on the experience of the examiner. The purpose of this study was to develop an
analytical screening technique that will detect the drug of interest as well as the presence
of any additional products that may be added into the sample via Direct Analysis in Real
Time – High Resolution/Mass Spectrometry (DART-HR/MS) which is an ambient
ionization source that produces fast mass spectrum results that can provide semi-
quantitative information of the target metabolite concentration. Although there are various
studies that indicate the ability of the DART to detect drug compounds, there are no
known studies that have examined how real-world urine samples are analyzed.
Additionally, there are no current studies that take into consideration adulteration of the
urine sample using the DART method. The results obtained in the study showed the ability

iii
for DART to identify molecular protonated peaks indicative of dextroamphetamine and/or
the presence of masking agents. While the other target drugs could not be identified using
this method, the identification of dextroamphetamine, adulterant products and the
deuterated internal standard show promise in using this as a screening technique prior to
confirmatory tests. Future work is currently being conducted to optimize the protocol for
the evaluation of THC, cocaine and benzodiazepines.

iv
ACKNOWLEDGEMENTS
I would like to thank my amazing mentors who have entrusted me in this project,
Dr. Bridge and Dr. Mari. Thank you for not only believing in me to become a member of
your research group, but also for allowing me to grow into my own person and giving me
the confidence to pursue my dreams. I am also thankful for the support of my laboratory
peers. Thank you to my HIM thesis committee for taking the time to complete this journey
with me. And lastly, thank you to my family and friends who have always supported my
endeavors and lifted me up when I felt overwhelmed or needed words of encouragement.

v
DEDICATION
This project is dedicated to my biggest supporter. –Love, your Mariposita.

vi
TABLE OF CONTENTS
CHAPTER 1: INTRODUCTION 1
CHAPTER 2: BACKGROUND 3
CHAPTER 3: INSTRUMENTATION 6
CHAPTER 4: STATISTICAL ANALYSIS 9
CHAPTER 5: DESIGN OF STUDY 11
CHAPTER 6: ELISA AND TEST STRIPS RESULTS 19
CHAPTER 7: DART RESULTS 23
CHAPTER 8: CONCLUSION 42
REFERENCES 44

vii
LIST OF FIGURES
Figure 1. Mechanism of Direct Analysis in Real Time (DART)18 ..................................... 8
Figure 2. DART- HR/MS SPE-it Fiber Blank ................................................................. 23
Figure 3. DART-HR/MS THC Sample Positive and Negative Mode Comparison ......... 24
Figure 4. DART- HR/MS THC Sample pH Comparison ................................................ 25
Figure 5. DART-HR/MS Cocaine Sample Negative and Positive Mode Comparisons .. 26
Figure 6. Structure of Ecstasy Provided by NIST .......................................................... 27
Figure 7. DART- HR/MS Amphetamine Sample pH Comparison .................................. 28
Figure 8. DART- HR/MS Adulterated Amphetamine Sample – Bleach ......................... 30
Figure 9. DART- HR/MS Adulterated Amphetamine Sample – Vinegar ........................ 33
Figure 10. DART- HR/MS Adulterated Amphetamine Sample – Sodium Nitrite ............ 35
Figure 11. DART-HR/MS Adulterated Amphetamine Sample – Eye drops ................... 37
Figure 12. DART-HR/MS SPE-it Fiber and Eye drop Solution Results ......................... 37
Figure 13. DART - HR/MS Adulterated Amphetamine Sample – Drano® ...................... 39
Figure 14. DART-HR/MS Benzodiazepine Sample #2 Positive and Negative Mode
Comparison ................................................................................................................... 41

viii
LIST OF TABLES
Table 1. Drugs of Interest and Important Characteristics .............................................. 12
Table 2. Participant Samples and Important Characteristics ......................................... 13
Table 3. List of adulterants and their active ingredients ................................................ 15
Table 4. Statistical Values for the Concentration of Dextroamphetamine versus Adulterant
Concentration; Bleach (B), Vinegar (V), Sodium Nitrite (N), Eye drops (E), Drano® (D),
Average (Avg.), Standard Deviation (Std. Dev.) ............................................................ 40

ix
LIST OF EQUATIONS
Equation 1. Confidence Interval for Samples .................................................................. 9
Equation 2. Upper Confidence Level ............................................................................... 9
Equation 3. Lower Confidence Level .............................................................................. 9

x
LIST OF ABBREVIATIONS
• THC………………………………………….. Tetrahydrocannabinol
• DART – HRMS……………………………… Direct analysis in real time – high
resolution mass spectrometry
• ELISA………………………………………... Enzyme linked immunosorbent
assay
• PCC Pyridinium Chlorochromate
• AC6 …………………………………………. AdultaCheck® 6
• In7 Intect™ 7
• [M+H]+……………………………………….. Protonated molecular peak
• SPE-it Fibers Solid-phase microextraction tips
fibers
• CI Confidence Intervals

1
CHAPTER 1: INTRODUCTION
The formation of the Mandatory Guidelines for Federal Workplace Drug Testing in
19881 has increased the number of individuals required to complete a drug test to ensure
a safe workplace environment. However, this does not limit drug testing to only places of
employment, but also extends to court proceedings, medical environments, rehabilitation
and athletic programs.2 The drug testing process involves a preliminary screening of a
urine sample through an immunoassay technique, where if the result is positive the
sample is evaluated further by a confirmatory technique such as gas chromatography –
mass spectrometry. Due to the heavy consequences that may arise as a result of a
positive response, individuals will often add common household products into the urine
matrix in an attempt to manipulate the screening technique to produce a false-negative
result thereby avoiding confirmatory testing.3, 4 A variety of these products include bleach,
Drano®, vinegar etc. To combat this increase of adulterant use, analysts often evaluate
the samples using specimen integrity tests those most commonly used being adulterant
test strips. Previous research conducted by this group has exemplified that the current
screening techniques produce false-negative results in respect to certain adulterants and
their concentration levels in the urine sample.5 Additionally, current evaluation of samples
by specimen integrity tests are highly subjective to analyst interpretation.
With the advancement of the forensic science community, a new approach is
necessary to eliminate the producibility of false-negative results and limit the subjectivity
in current screening techniques. Ambient mass spectrometry has shown promise in the

2
field of forensics and in this study, it is proposed that the use of direct analysis real time
– high resolution mass spectrometry (DART-HRMS) can be used as a screening method
for urinalysis. The specific objectives of this study are:
• The development of a screening technique using DART to identify drug/metabolite
peaks as well as additional peaks indicating adulteration.
• Comparative analysis of unadulterated and adulterated urine samples containing
drugs/metabolites of interest on DART and an immunoassay, examining the
concentration of drug metabolites in response to an increase of adulteration.
• Quantification of drug concentrations in real world samples via the DART method.

3
CHAPTER 2: BACKGROUND
Individuals who may abuse drugs are at risk for drug dependence, erratical
behavior, psychiatric disorders, and heart/circulatory problems.6 Therefore, various
agencies have proposed drug testing guidelines to prevent the misuse of these
substances.7 Drugs that are included in common testing protocols include:
tetrahydrocannabidiol (THC), cocaine, amphetamines, and benzodiazepines. While there
are a variety of sampling mediums, using urine is not as invasive as other methods, while
maintaining the drug metabolites in the sample for an extended period of time. The
detection range for amphetamine and cocaine is 2 to 4 days, and chronic use of THC and
benzodiazepines may persist in the sample for up to a month.8
However, with current drug screening methods, the urine sample can be
manipulated with the addition of products (in vitro) producing a false-negative result.9
Immunoassay techniques that have been reviewed for manipulation of the urine sample
with adulterant products include radioimmunoassay (RIA)4, 10, enzyme multiplied
immunoassay technique (EMIT)9, 10, 11, fluorescence polarization immunoassay (FPIA)10,
12 and enzyme-linked immunosorbent assay (ELISA)5. In these studies, certain products
demonstrated abnormal results. At a 10 % v/v concentration eye drops, liquid bleach, and
vinegar interfered with the detection of THC metabolites using the FPIA method.13
Additionally, the use of eye drops as an adulterant resulted in false-negative results for
THC assays using EMIT.14
Due to the increased use of adulterants, examiners will use a form of a specimen
integrity test to ensure that there is no manipulation of the urine sample potentially causing

4
a false negative or positive result. While specimen integrity test often includes evaluation
of the sample visually, by pH, and/or temperature, a majority of adulterants do not produce
these effects. Adulterant test strips use reagent pads that interact with chemical
substances, nitrite, creatinine, glutaraldehyde, pyridinium chlorochromate (PCC), specific
gravity and pH, to develop a color change indicating in vitro addition. Additionally, another
benefit is adulterant test strips can be easily purchased in many drug stores or through
online vendors. Adulterant test strips that have been analyzed in previous research
include AdultaCheck® 6 (AC6) and Intect™ 7 (In7).15, 16, 17 In a study conducted by
Dasgupta et al., AC6 and In7 were compared for their ability to detect nitrite, PCC, and
bleach with responses compared to potassium iodide spot tests. The results revealed that
the test strips were able to detect the adulterants and at times were able to differentiate
concentration levels, with In7 being superior to AC6 in sensitivity. Another study evaluated
adulterant detection between In7, AdultaCheck® 4 and Mask Ultra Screen by adding
adulterants to spiked drug samples. In conclusion, In7 proved to be the most effective of
the three in detecting bleach, vinegar, PCC and nitrite.17
In a previous study conducted by the Bridge research group, the use of ELISA and
adulterant test strips In7 and AC6 exemplified that certain adulterants were able to evade
detection.5 These results will be further discussed in chapter 6, however what these
outcomes concluded was the need for a new, more robust screening technique with the
prevention of analyst subjectivity.
The introduction of DART-HRMS as a screening technique for urinalysis has
shown promise due to the ability of the instrument to provide information regarding the

5
components within the sample as a mass spectrum. Additionally, DART is capable of
analyzing and providing high mass accuracy of compounds within a few seconds with
minimal sample preparation. In previous literature, the DART has exhibited the ability to
detect drugs of interest, drug metabolites, and chemical substances.18, 19, 20 Prior studies
focused on evaluation of urinalysis by spiking either synthetic or clean urine samples with
the drugs standards of interest, whereas in this study the focus is the evaluation of real-
world urine samples containing metabolized drugs of abuse.

6
CHAPTER 3: INSTRUMENTATION
Current screening techniques for drug analysis in urine samples often consists of
an immunoassay technique. The one specifically used in this protocol was enzyme linked
immunosorbent assay (ELISA). Competitive ELISA is a heterogeneous immunoassay
technique that focuses on use of enzyme-linked antigens to compete with the antigen of
the sample for antibody sites whereas other techniques use enzyme-linked antibodies.10,
21 The 96 well plate contains antibody with a specific binding site for the target analyte
and the enzyme conjugate. The sample is then added into the well plate along with quality
controls and standards. The standards will provide an informative standard curve to
exemplify if pipetting was accurate and precise by the R2 value. After the addition of the
urine sample, an enzyme labeled conjugate is added into the wells and the conjugate
competes with the antigen for the binding site during the first incubation period. Following
the first incubation, a washing procedure is performed using the Biotek® ELISA washer
to remove any unbound components. A substrate is then added into each well which
creates a color reaction during the second incubation period. The optical density of the
color reaction can then be read using a Biotek® plate reader at absorbances of 450 and
630 nm. The ELISA protocol used for this study was provided by Randox ELISA well plate
manufacturers.
Due to the number of individuals who manipulate the urine samples with
adulterants to alter the immunoassays capability to detect the target analyte(s), analysts
use specimen integrity tests. These tests detect when the sample has additional products
by a variety of methods such as smell, appearance, and chemical reactions. Of these a

7
common method is using adulterant test strips which have reaction pads that interact with
the sample creating a color change that exhibits particular chemicals that are typically not
seen in a urine sample are present.
Direct analysis in real time – high resolution mass spectrometry is an ambient
ionization technique used to analyze samples at high mass accuracy within a few seconds
and limiting the amount of required sample preparation.22 The mechanism of the DART
(Figure 1) begins with a helium gas source that enters the instrument and interacts with
the needle electrode forming a glow discharge producing cations, anions, electrons and
helium metastables which are neutral electronically excited atoms. These species then
flow through the grounded electrode which separates the charged species from the
metastables allowing only the metastables to enter the second chamber. In the second
chamber there is a gas heater, heating the metastables to the desired temperature
required for analyzing the sample. The heated metastables then flow through the exit grid
electrode which can be biased towards a negative or position ionization mode depending
on the requirements for evaluation. In a positive ionization mode, a water cluster
protonates the sample to form a protonated sample whereas in negative ionization mode,
the water cluster removes a proton from the sample giving a deprotonated molecular
peak.22 As the metastables exit the apparatus, they interact with the sample located in
the sample gap to ionize and desorb the sample for introduction of ionized atoms into the
mass spectrometer inlet. The sample is then broken down into components and a mass
spectrum indicating the protonated molecular peaks ([M+H]+) for individual compound
analysis.

8
Figure 1. Mechanism of Direct Analysis in Real Time (DART)18
Prior literature acknowledged that direct sampling of urine samples on DART leads
to the reduction in the detection of drug metabolites within the sample due to the high
concentration of creatinine and urea.23 For this particular method, solid-phase
microextraction tips fibers were necessary in decreasing the urine matrix components
such as creatinine that could inhibit the detection of the drug metabolite in question.
Ionsense® SPE-it fibers extraction technique isolates the analyte of interest and allows
direct analyzation on the DART system. Another feature of the SPE-it fiber is the ability
to use it in conjunction with a linear rail system. The use of a linear rail system allows for
reproducible results and minimization of error seen in manual introduction of the sample
into the sample gap.

9
CHAPTER 4: STATISTICAL ANALYSIS
An objective of this study was to evaluate how the increase of adulterant
concentration effects the detectable concentration of the target drug metabolite.
Specifically for this study, confidence intervals calculated by Equation 1 were conducted
to provide information for the most probable value for the sample mean (µ).24 The critical
value t was obtained for a 95% confidence level with a degree of freedom of 1 which
provided a t-value of 12.71.24 This large critical value was obtained due to the small
sample set of each adulterated urine sample being run in duplicates, however this was
the statistical test allowing for the comparison within a data sample set. To obtain a range
of the confidence intervals (CI) the upper confidence level and lower confidence level
were obtained by using Equations 2 and 3.
Equation 1. Confidence Interval for Samples
𝐶𝐼 =𝑡 − 𝜇
√𝑛
Equation 2. Upper Confidence Level
𝑈𝑝𝑝𝑒𝑟 𝑐𝑜𝑛𝑓𝑖𝑑𝑒𝑛𝑐𝑒 𝑙𝑒𝑣𝑒𝑙 = 𝐴𝑣𝑒𝑟𝑎𝑔𝑒 + 𝐶𝐼
Equation 3. Lower Confidence Level
𝐿𝑜𝑤𝑒𝑟 𝑐𝑜𝑛𝑓𝑖𝑑𝑒𝑛𝑐𝑒 𝑙𝑒𝑣𝑒𝑙 = 𝐴𝑣𝑒𝑟𝑎𝑔𝑒 − 𝐶𝐼
Measurements were performed for all adulteration levels and the confidence
intervals for each adulterant concentration were compared to the unadulterated sample.

10
If there was intertwining values between the adulterant level and unadulterated sample,
the difference in the antigen concentration was not considered statistically significant.

11
CHAPTER 5: DESIGN OF STUDY
As previously stated the novelty of this project is the use of real-world urine
samples to evaluate the detection of illicit drugs metabolized through the body. Therefore,
samples were collected by anonymous volunteers under UCF IRB no. SBE-16-12568. In
addition to providing the samples, volunteers filled out a questionnaire detailing
information pertaining to the drugs and/or prescriptions taken, the history of use, chronic
or recreational use, the amount consumed, and the time of recent drug use. Other
information that was obtained from the survey included the age, gender and additional
consumption of caffeine products within the week. Samples were stored in a biological
hazard freezer until needed for evaluation.
The drugs of interest and their main metabolites for this study included:
tetrahydrocannabinol (11-nor-9-carboxy-Δ9-THC), cocaine (Benzoylecgonine),
amphetamines (Dextroamphetamine), and benzodiazepines (Diazepam). However, for
this particular paper the main discussion of results will focus on the evaluation of
amphetamine real world samples. To evaluate the DART experimental method and semi-
quantify the drugs in the real-world samples, internal standards and drug standards were
purchased (Cerilliant Corporation, Round Rock, TX). The internal standards of interest
included (-)-11-nor-9-Carboxy-Δ9-THC (T-018), (-)-11-nor-9-Carboxy-Δ9-THC-D3 (T-
004), (-)-Δ9-THC (T-005), (-)-Δ9-THC-D3 (T-003), Cocaine (C-008), Cocaine-D3 (C-004),
Benzoylecgonine (B-004), Benzoylecgonine-D3 (B-001), (±) – Amphetamine (A-007), (±)
– Amphetamine-D5 (A-002), Diazepam (D-907), Diazepam-D5 (D-902), Nordiazepam (N-

12
905), and Nordiazepam-D5 (N-903). All information pertinent to the drugs of interest in
this study are found in Table 1.
Table 1. Drugs of Interest and Important Characteristics
Drug of Interest
Major Metabolite
Internal Standard(s)
for DART Cut-off Level25
Target [M+H]+ on DART (g/mol)
THC 11-nor-9-
carboxy-Δ9-THC
(-)-11-nor-9-Carboxy-Δ9-
THC-D3
(-)-Δ9-THC-D3
50 ng/ml 345.4446
and/or 315.4617
Cocaine Benzoylecgoni
ne Benzoylecgoni
ne-D3 300 ng/ml
304.3529 and/or
290.3264
Amphetamines Dextroampheta
mine
(±) – Amphetamine-
D5 1000 ng/ml 136.2062
Benzodiazepines
Diazepam Diazepam-D5 200 ng/ml 145.1732
and/or 285.7402
For the examination of real-world samples on ELISA, kits were purchased from
RANDOX laboratories (Kearneysville, WV, USA) for each of the drugs of interest.
Samples that identified having a high potential for the detection of the target drugs based
on their concentration were selected and examined using the ELISA protocol provided by
the manufacturer. Samples that exhibited the target compound above the concentration
cut off limit for the immunoassay were chosen for downstream analysis. Sample collection

13
for the DART consisted of identifying samples in which the volunteers indicated drug use
of a target drug in the study. Samples were evaluated using the SPE-it fiber protocol
provided by Ionsense (Saugus, MA, USA) and optimized parameters. Samples used for
both portions of the study are found in Table 2.
Table 2. Participant Samples and Important Characteristics
ELISA
Participant Number
Drug(s) Disclosed Amount of
Drug Ingested
Drug Use Prior to Sample
Collection
Target Drug Study
17 Marijuana Chronic User 1 hour THC
23 Marijuana Cocaine
Chronic User “2 Bumps”
2 hours 2 days
Cocaine
20 Marijuana Cocaine Adderall
Recreational Not provided
20 mg ~20 hours Amphetamines
11
Marijuana Wellbutrin Topamax Abilify®
Ativan (Lorazepam)
Chronic User 300 mg 75 mg
Not provided 1 mg
~14 hours Benzodiazepines
DART-HR/MS
17 Marijuana Chronic User 1 hour THC
98 Marijuana Recreational 1 day THC
99 Marijuana Chronic User ~12 hours THC

14
100 Marijuana Recreational N/A THC
95
Marijuana Molly
Ecstasy Cocaine
Recreational N/A
N/A Cocaine
31 Cocaine “1 Bump” 2 days Cocaine
32 Marijuana Adderall Cocaine
Recreational 20 mg 1 gram
N/A Cocaine
25 Marijuana Adderall Cocaine
Chronic 10 mg
“1 Line” 3 days Cocaine
20 Marijuana Adderall Cocaine
Recreational 20 mg
N/A 1 week Cocaine
14 MDMA
Cocaine
“2 beans (Tesla)”
“2 bumps” 1 week Cocaine
93
Marijuana Molly
Cocaine Ecstasy Adderall
Recreational N/A
20 mg N/A Amphetamines
2
Marijuana Wellbutrin Topamax Abilify®
Ativan (Lorazepam)
Chronic User 300 mg 75 mg
Not provided 1 mg
N/A Benzodiazepines
11
Marijuana Wellbutrin Topamax Abilify®
Ativan (Lorazepam)
Chronic User 300 mg 75 mg
Not provided 1 mg
~14 hours Benzodiazepines

15
16
Marijuana Wellbutrin Topamax Abilify®
Ativan (Lorazepam)
Chronic User 300 mg 75 mg
Not provided 1 mg
3 hours Benzodiazepines
In previous literature, studies have identified common household products that are
used to adulterate the urine samples screened for drugs of abuse. Adulterants that have
been recognized for manipulation of immunoassay techniques and are used in this study
include: bleach4, 23, Drano® 4, 26, vinegar4, 17, 27, Naphcon-A eye drops4, 14, 23, 26, table salt28,
29 , and sodium nitrite17, 30 which is an active ingredient in the adulterant whizzies. The
active ingredients of the adulterants in this study can be found in Table 3.
Table 3. List of adulterants and their active ingredients
Adulterant/ Product Active Ingredient
Clorox® bleach Sodium hypochlorite
Liquid Drano® Sodium hypochlorite (5%)
Sodium hydroxide
White vinegar Acetic acid
Naphcon A eye drops Naphazoline hydrochloride (0.025%)
Pheniramine maleate (0.3%)
Benzalkonium chloride (0.01%)
Table Salt Sodium chloride
Sodium nitrite (Whizzies) –

16
To prepare the selected samples for adulterant analysis, the sample were obtained
from the freezer and thawed at room temperature. For ELISA analysis, 1 mL aliquots were
collected for each drug and each adulterant concentration of that particular drug target. A
200 µL sample was maintained to ensure the original concentration of the sample and all
other samples adulterated were kept at a final volume of 200 µL. The adulterant
concentrations ranged from 5, 10, 25, and 50 % v/v or w/v. Adulterant sample for 5 % v/v
contained 190 µL of urine and 10 µL of adulterant to achieve the 200 µL volume. The
remaining sample contained respective ratios of urine to adulterant product (10 % v/v –
180:20, 25 % v/v – 150:50, and 50 % v/v – 100:100). Certain adulterant products, Drano®,
table salt and nitrite, were viscous or solid and were instead added into the sample using
weight-by-volume calculations.
Unadulterated samples and samples of concentrations 5 and 25% v/v or w/v were
evaluated on the test strips, Intect 7 (In7) and AdultaCheck 6 (AC6), by using a glass
pipette to place 1 drop on each reagent pad. The pads were then examined for color
change by comparison of the pad to the provided color chart at the specified time.
Additional examinations were performed for eye drops at 50 % v/v due to their ability to
decrease the detectable metabolite concentration while maintaining a normal color
appearance at 25 % v/v on the reagent pads.
Regarding DART analysis, the adulterants that previously exemplified a decrease
of detectable metabolite concentration on ELISA were evaluated on DART. To prepare
the DART samples, the total volume for SPE-it fiber protocols was 1 mL. Therefore,
aliquots of the urine samples were obtained and adulterated using volume-by-volume

17
calculations to achieve the 5 to 50 % v/v or w/v adulterant concentration range. An
unadulterated sample was maintained to determine if the target metabolite or derivatives
could be seen in the mass spectrum and for a comparison of adulterant effects as the
adulterant concentration increased.
Prior to evaluation of the samples on DART, optimization studies were conducted
for the DART protocol parameters including temperature, evaluation of the exit grid
voltage, and adjustment of the linear rail distance and speed. To determine the optimal
temperature for the detection of drug metabolites, real world samples containing their
respective internal standards were analyzed from 250 to 400 °C at increments of 50. The
ideal temperature was identified at 400 °C due to the amount of molecular peaks for
identification of the sample components in the mass spectrum. Additionally, this
temperature provided the most intense signal in terms of total ion count. While there is
not a current clear understanding of the purpose of the exit grid voltage, it is proposed
that adjustment of the exit grid voltage will highlight different peaks for the sample of
interest. The exit grid voltage was examined at 50, 150, 250, 350, 450 and 530 volts using
real world samples with internal standard(s). The exit grid voltage parameter of 250V
provided the greatest amount of protonated molecular peaks ([M+H]+) which is essential
for this study due to the need to identify not only the main drug metabolite, but also the
presence of any potential adulterants of fragmentation of the drug metabolite or urine
components (i.e. creatinine, urea). While the main purpose of the SPE-it fiber is to isolate
the analytes of interest from the urine components, another purpose is to allow for
reproducibility by using a linear rail system manufactured holding the SPE-it fiber railing.

18
The linear rail distance and speed was analyzed to determine at what parameters
provided the best ionization of the target metabolite. The distance was evaluated from 1.5
to 2 cm distance from the MS inlet orifice to the ionization gap. Any further measurements
will prove inadequate for this study due to the need of the sample to interact with the
metastables and enter the inlet source while still maintaining space for the linear rail in
the gap. Additionally, the speed of the linear rail through the ionization gap was examined
between 0.2 and 0.5 mm/s. Any higher speed would minimize interactions of the sample
to the metastable source or flow of ionized particles into the inlet. The parameters
providing the best results for the linear rail was inlet distance of 1.5 cm and linear rail
speed of 0.5 mm/s.

19
CHAPTER 6: ELISA and TEST STRIPS RESULTS
Immunoassays and specimen integrity tests are the current methods for urine
screening for the detection of drugs and their metabolites. A previous study highlighted
the effects of adulterant concentrations on ELISA, In7 and AC6.5 These results are
discussed in this chapter to provide comparative analysis of current screening techniques
to those developed in this study.
THC Results
The cut-off level indicated for the screening of THC is 50 ng/ml and examining the
urine sample it had an original concentration of 94.0 ng/ml. Adulterants were added at
various concentrations to determine if these adulterants would decrease the detectable
concentration below the cut-off limit and at which adulterant concentration level would the
adulterant be identified by the adulterant test strips. Bleach and Drano® both decreased
the concentration to below 50 ng/ml at only a 5 % level, with bleach causing a decrease
to 2.7 ng/ml. Evaluation by a student t-test revealed that these values were both
considered significant in comparison to the original concentration. In consideration of this
false-negative result, there was no detection of bleach or Drano® using AC6 at 5 %. Both
adulterants were detected on AC6 at the higher 25 % concentration. However, using In7,
bleach was detected at 5 % v/v on the PCC pad which is a reagent pad not available on
AC6. Nitrite also decreased the detectable concentration of the metabolite at 5 % but did
not have significant effect according to the student t-test until a 10 % w/v concentration
level. Unlike bleach and Drano®, nitrite was detected on both adulterant test strips at 5%.
Lastly, eye drops and vinegar decreased the concentration at 50 % potentially due to

20
dilution of the sample decreasing the amount of detectable antigen. Vinegar could be
identified on both adulterant test strips at 25 %, but eye drops evaded detection at
concentration of 5, 25 and 50 %. All other adulterants did not show an effect on the assay
response.
Cocaine Results
Using the ELISA cocaine assay, the initial concentration of the urine sample
containing cocaine metabolites was identified at 534.0 ng/ml. Similar to the results
obtained on the THC assay, bleach and Drano® at 5 % level decreased the concentration
of detected benzoylecgonine to below the 300 ng/ml cut-off level. However, according to
the student t-tests, bleach did not have significance until 10 % v/v. Vinegar was able
decrease the initial concentration to below 300 ng/ml at 10 % v/v by a 44% change.
However, similar to Drano® there was no significance after performing a student t-test.
For these three adulterants, only Drano® was identified at 5 % using AC6 on the oxidant
pad. Whereas bleach and vinegar exemplified color responses at 25 % concentration.
Drano® and vinegar created a color change at 5 % on In7, and again bleach only showed
a color change at 25 %. On the ELISA assay, eye drops dropped the detected
concentration of target metabolite below the cut-off at 50 % v/v. In contrast to the results
of THC, using In7 the specific gravity pad exhibited a slight color change at 25 and 50 %
v/v. Other adulterants were unable to decrease the detected benzoylecgonine below 300
ng/ml.

21
Amphetamine Results
The initial concentration of dextroamphetamine was above the upper threshold
limit and therefore, it was only determined that the amount was above 1575 ng/ml. The
only adulterant that decreased the concentration to below the cut-off level of 1000 ng/ml
was Drano® causing a decrease by 97.7 %. Bleach and sodium nitrite both decreased the
concentration at the 10 % level while vinegar and eye drops decreased at 25 % v/v. When
evaluating these adulterants on AC6 bleach, Drano®, and nitrite were all detected at 5 %
and vinegar displayed color change at 25 %. In7 showed a similar response, however at
5 % for bleach and Drano® there was only a slight color change in the PCC pad which
can be considered subjective to analyst interpretation. Again, eye drops exhibited
presence at 25% on the specific gravity pad of In7. This contributes to the theory that eye
drops may decrease the metabolite concentration of the ELISA assay through a form of
dilution of the sample.
Benzodiazepine Results
The sample identified of benzodiazepines use was examined for initial
concentration with the ELISA benzo assay and was identified at 96.1 ng/ml, well below
the cut-off threshold of 200 ng/ml. Therefore, adulterant concentrations were evaluated
using student t-test for the difference of the metabolite concentration at the particular
adulterant concentration compared to metabolite concentration at the unadulterated level.
At 5% adulterant concentration, bleach and Drano® slightly decreased the initial
concentration by 4.2 and 0.8 % respectively. At 50% both adulterants decreased the
concentration by 28.6 and 13.4 % whereas, vinegar showed the greatest decrease in

22
concentration of all adulterants at 50 % with a 49.8 % decrease. However, the student t-
test did not identify vinegar at 50 % to be significant. When evaluating the original sample
on the adulterant test strips, there was indication of high specific gravity on In7 and
therefore, specific gravity was not evaluated for the remaining analysis. At a 5 % level,
AC6 was only able to identify nitrite, but at 25 % was able to detect color change from
bleach, Drano® and vinegar. When using In7, Drano® was detected at the 25 % level.
Neither adulterant test strip could identify eye drops at the 5, 25 or 50 % concentrations.

23
CHAPTER 7: DART RESULTS
As shown, current screening techniques for drugs of abuse (immunoassay and
specimen integrity tests) can be manipulated to produce a negative response when
common adulterants are added in vitro to the urine matrix. Therefore, it was proposed
that using an ionization technique called direct analysis in real time – high resolution mass
spectrometry (DART-HRMS) would provide a higher quality screening technique to
identify not only the drug/metabolite of interest, but additionally any adulterants present.
SPE-it Fiber Results
Prior to performing analysis on the urine samples on DART, a SPE-it fiber was
analyzed using deionized water instead of urine. This was done in efforts to determine
what protonated molecular peaks ([M+H]+) would appear on the mass spectrum from
interactions of the fiber with the metastables in the ionization gap. As shown in Figure 2,
the spectrum exemplified peaks at 83.0600 [M+H]+, 88.1120 [M+H]+, 242.1313 [M+H]+,
and 241.1717 [M+H]+.
Figure 2. DART- HR/MS SPE-it Fiber Blank

24
THC Results
Samples containing THC metabolites were identified from the volunteer packets
and evaluated with deuterated internal standard to determine if the metabolites and
standard could be identified on the mass spectrum. As shown in Figure 1, all samples
were evaluated in positive and negative ionization mode, but none of the samples had
the characteristic peaks (Table 2). Samples collected specifically for DART examination
(#99) did not display protonated molecular peaks at 345.4446 or 315.4617 g/mol. The
sample used in the ELISA study was then evaluated in positive and negative ionization
mode with no demonstration of the target peaks.
Figure 3. DART-HR/MS THC Sample Positive and Negative Mode Comparison

25
Upon recommendation from the developer at Ionsense, the pH was then evaluated
for a clean sample spiked with THC internal standard at pH of ~10 compared to the pH of
~7. As shown in Figure 4, there are no indications of the target molecular peaks. Further
work will be conducted to optimize the protocol for the identification of THC metabolites
in real world samples.
Figure 4. DART- HR/MS THC Sample pH Comparison
Cocaine Results
Cocaine sample #95 (Table 2) with the Benzoylecgonine-D3 spiked internal
standard was initially analyzed using the SPE-it/ DART protocol in positive ionization
mode (Figure 5). However, any molecular peaks indicating cocaine metabolites were not
present and instead a peak at 194. 1176 [M+H]+ appeared which after evaluation on Mass

26
Mountaineer was identified as Ecstasy (Figure 6). The assumption made based on this
result was the masking effect of amphetamine metabolites to any present cocaine
metabolites. This may be due to the nature of the SPE-it fiber which is PDMS coated to
concentrate analytes of interest. However, there are only a few binding portions on the
fiber and therefore, the analyte of higher binding affinity will bind to those binding sites
before other potential analytes. The sample was then analyzed in negative ionization
mode (Figure 5), but similar to positive mode no peaks presented information pertaining
to cocaine metabolites. Any samples donated that indicated use of cocaine (Table 2) were
then evaluated to determine if the metabolites were present, but none of the samples
displayed metabolite or internal standard peaks.
Figure 5. DART-HR/MS Cocaine Sample Negative and Positive Mode Comparisons

27
Figure 6. Structure of Ecstasy Provided by NIST
Amphetamine Results
When analyzing the unadulterated and adulterated amphetamine samples there
were a series of results that supported the original hypothesis of the detection of the
analyte and presence of adulterants. Upon recommendation by Ionsense operators, the
pH of the urine sample (# 93, Table 2) was evaluated at a pH of ~7 and pH of ~10. At pH
of ~7, the dextroamphetamine peak at 136.2062 [M+H]+ was not present, but when
adjusting the pH to ~10 using 10N NaOH the dextroamphetamine was visible at 136.1136
[M+H]+ (Figure 7). Therefore, all further evaluations for amphetamine sample #93 were
tested with pH litmus paper and adjusted to a pH of ~10 prior to continuing the SPE-it
protocol.

28
Figure 7. DART- HR/MS Amphetamine Sample pH Comparison
To detect the concentration of the drug without the manipulation of adulterants, an
internal standard (amphetamine – D5) was spiked into the urine sample to a cut-off level
as indicated by the ELISA test kits (1000 ng/ml). An aliquot of the spiked sample was
analyzed for identification of the amphetamine metabolite and the internal standard. The
mass spectrum exemplified peaks at 136.11 [M+H]+ indicative of dextroamphetamine and
141.14 [M+H]+ of the amphetamine – D5 internal standard. Upon completing a ratio of the
dextroamphetamine peak to the deuterated internal standard and multiplying this by the
cut-off factor of 1000 ng/ml, the average concentration was calculated as 11975.19 ng/ml
(Table 4).

29
Evaluating the adulterated amphetamine samples of bleach, as the adulterant
concentration increases the relative intensity of the amphetamine peak decreases (Figure
8). The dextroamphetamine peak is visible until reaching a concentration of 50% v/v of
bleach. However, after evaluating the abundance values for both duplicate trials the
average concentration at 5 and 25 % adulterant levels are 7401.471 ng/ml and 6291.235
ng/ml respectively and thereby well above the 1000 ng/ml cut-off limit (Table 4).
Vinegar however, was detected throughout all levels of adulterant
concentration (Figure 9). An additional factor when evaluating the vinegar spectrums, was
the consistency of the concentration of dextroamphetamine to the internal standard during
the increase of adulterant concentration (Table 4).
Similar to the results observed using vinegar as the adulterant, sodium nitrite was
detected through all adulterant concentration levels (Figure 10). Additionally, the
concentration of dextroamphetamine remained above the 1000 ng/ml cut off level after
calculating the average concentration from the internal standard (Table 4).

30
Figure 8. DART- HR/MS Adulterated Amphetamine Sample – Bleach

31

32

33
Figure 9. DART- HR/MS Adulterated Amphetamine Sample – Vinegar

34

35
Figure 10. DART- HR/MS Adulterated Amphetamine Sample – Sodium Nitrite
The use of eye drops as an adulterant produced unexpected results (Figure 11).
The expectation of using DART was the detection of either the drug metabolite or of other
characteristic peaks that could deduce that an additional product was added into the
matrix to manipulate testing procedures. Instead the eye drops did not exemplify
additional peaks, but interacted with the SPE-it fiber increasing the relative intensity of
the 241.17 [M+H]+ peak. To confirm the interaction of eye drops solution with the SPE-it
fiber, a run was conducted following the protocol, but instead substituting 1 ml of eye drop
solution instead of urine. As predicted, the relative intensity of the 241.1717 [M+H]+ peak
present in the SPE-it fiber blank (Figure 2) increased when using eye drop solution as the
sampling medium (Figure 12). The identity of these peaks are currently unknown,
however, further research will be conducted to establish the identity.

36

37
Figure 11. DART-HR/MS Adulterated Amphetamine Sample – Eye drops
Figure 12. DART-HR/MS SPE-it Fiber and Eye drop Solution Results
As previously mentioned, the expectation of this study was the ability to detect
peaks that could exemplify adulteration and as shown in the results of Drano® while the
Dextroamphetamine peak and internal standard were not present, there are a variety of
additional peaks that were not identified in the primary unadulterated sample (Figure 13).
For case-work these results indicate that there is manipulation of the sample and the
sample would not be appropriate for further evaluation by confirmatory techniques.

38

39
Figure 13. DART - HR/MS Adulterated Amphetamine Sample – Drano®

Table 4. Statistical Values for the Concentration of Dextroamphetamine versus Adulterant Concentration; Bleach (B), Vinegar (V), Sodium Nitrite (N), Eye drops (E), Drano® (D), Average (Avg.), Standard Deviation (Std. Dev.)
Adulterant (%)
Abundance Values for 136.11 [M+H]+
Abundance Values for 141.14 [M+H]+
Ratio Values (ng/ml)
Avg. (ng/ml)
Std. Dev Upper Limit Confidence
Level
Lower Limit Confidence
Level Trial 1 Trial 2 Trial 1 Trial 2 Trial 1 Trial 2
Unadulterated 59.4497 100 10.2999 5.501 5771.872 18178.51 11975.19 8772.82 90819.4 -66869
B 5% 23.2899 32.4998 2.6 5.56 8957.654 5845.288 7401.471 2200.775 27180.56 -12377.6
B10% 49.23 37.2397 8.8403 5.3096 5568.816 7013.655 6291.235 1021.655 15473.19 -2890.72
B 25% 2.5 1.9 0 0 0 0 0 0 0 0
B 50% 0 0 0 0 0 0 0 0 0 0
V 5% 73.9286 82.4387 8.6297 8.3106 8566.764 9919.705 9243.234 956.674 17841.18 645.2921
V 10% 57.8707 54.9393 6.8506 6.3209 8447.537 8691.689 8569.613 172.6416 10121.2 7018.027
V 25% 50.6908 54.9603 8.3895 5.9801 6042.172 9190.532 7616.352 2226.227 27624.18 -12391.5
V 50% 79.4184 100 8.2306 15.9803 9649.163 6257.705 7953.434 2398.123 29506.15 -13599.3
N 5% 100 100 3.9 15.8302 25641.03 6317.04 15979.03 13664.12 138783 -106825
N 10% 100 100 12.4287 8.7225 8045.894 11464.6 9755.248 2417.393 31481.15 -11970.6
N 25% 100 70.1508 5.5402 10.5491 18049.89 6649.932 12349.91 8060.987 84796.64 -60096.8
N 50% 100 100 18.2797 14.8512 5470.549 6733.463 6102.006 893.0146 14127.82 -1923.81
E 5% 0 0 0 0 0 0 0 0 0 0
E 10% 0 0 0 0 0 0 0 0 0 0
E 25% 0 0 0 0 0 0 0 0 0 0
E 50% 0 0 0 0 0 0 0 0 0 0
D 5% 0 1.2 0 0 0 0 0 0 0 0
D 10% 0 65.036 0 0 0 0 0 0 0 0
D 25% 0 0 0 0 0 0 0 0 0 0
D 50% 0 0 0 0 0 0 0 0 0 0
Benzodiazepine Results
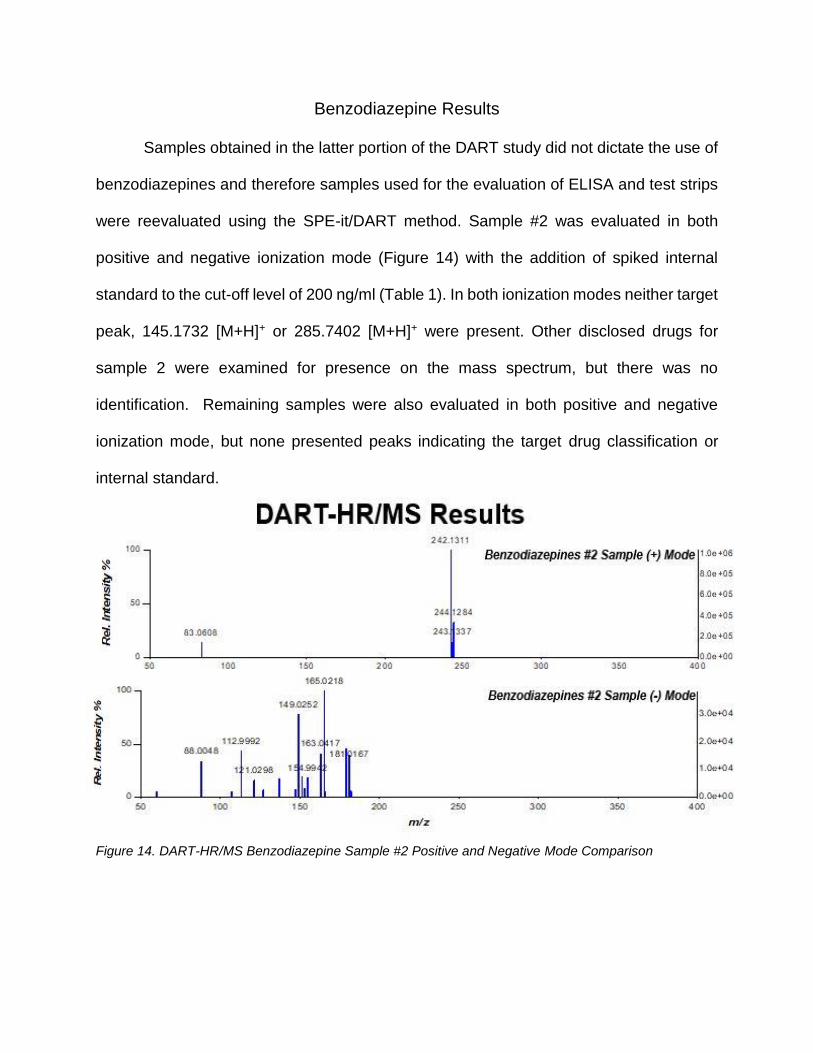
Samples obtained in the latter portion of the DART study did not dictate the use of
benzodiazepines and therefore samples used for the evaluation of ELISA and test strips
were reevaluated using the SPE-it/DART method. Sample #2 was evaluated in both
positive and negative ionization mode (Figure 14) with the addition of spiked internal
standard to the cut-off level of 200 ng/ml (Table 1). In both ionization modes neither target
peak, 145.1732 [M+H]+ or 285.7402 [M+H]+ were present. Other disclosed drugs for
sample 2 were examined for presence on the mass spectrum, but there was no
identification. Remaining samples were also evaluated in both positive and negative
ionization mode, but none presented peaks indicating the target drug classification or
internal standard.
Figure 14. DART-HR/MS Benzodiazepine Sample #2 Positive and Negative Mode Comparison

42
CHAPTER 8: CONCLUSION
Drug screenings are widely used to evaluate individuals who hold employment
status or are in other positions such as court proceedings. The current screening
techniques used include the use of an immunoassay and specimen integrity test.
However, the addition of products in vitro to a sampling medium of urine, can alter the
mechanisms of analyte detection producing a false-negative result. Therefore, the
purpose of this study was to evaluate adulterant effects on real-world samples with
metabolized drugs of abuse on current screening techniques, ELISA and adulterant test
strips (AC6 and In7), versus a new method using DART. ELISA has an antigen-antibody
binding system that can be manipulated when certain products such as bleach, Drano®,
and eye drops. Therefore, the hypothesis of this study was that in the development of a
DART method for urinalysis, peaks exhibiting the drug of interest and/or the presence of
adulterant products will appear on the mass spectrum. Additionally, the DART method
would provide semi-quantitative analysis of concentration values between the
unadulterated samples and adulterated samples at their various concentrations.
Comparison of screening techniques
In the ELISA and adulterant test strip method, certain adulterants were able to
decrease the detectable metabolite concentrations to below the cut-off levels at low
adulterant concentration levels. For example, at 5 % bleach and Drano® produced a false
negative result on ELISA for the THC and cocaine assays. Additionally, for a majority of
the immunoassays, eye drops at the 50% level decreased the concentration of target
metabolites to below the cut off levels but remained undetected on adulterant test strips

43
AC6. While eye drops exhibited a color response at 50% on In7, the color change was
slight and highly subjective to analyst interpretation.
The only target drug that could be evaluated using the SPE-it/DART method was
amphetamines; the results revealed the ability to detect drug metabolites at higher
concentrations of adulterant and/or the identification of peaks exhibiting the addition of
masking products. Additionally, the concentration of dextroamphetamine remained
relatively consistent throughout the various concentrations of certain adulterants (i.e.
vinegar and sodium nitrite). This work shows promising for the use of DART as a
screening technique because of the ability to identify target components and outlying
protonated peaks. However, a result exemplified by the evaluation of the cocaine sample
was the masking of the target drug when additional drugs are present within the sample.
The only counter to this would be that the presence of any drug in this screening technique
would indicate further testing by confirmatory methods. Future work is currently being
conducted to optimize the protocol parameters for the other drugs of interest. This
including the purchase of C18 SPE-it fibers to determine if this would have higher binding
affinity for THC, cocaine and benzodiazepines.

44
REFERENCES
1. Preventing Workplace Substance Abuse: Beyond Drug Testing to Wellness American Psychological Association: Washington, D.C., 2003. 2. Hawks, R. L.; Chiang, C. N., Urine Testing for Drugs of Abuse. Abuse, N. I. o. D., Ed. DHHS: Rockville, MD, 1986. 3. Fu, S., Adulterants in Urine Drug Testing. Adv Clin Chem 2016, 76, 123-163. 4. Cody, J. T.; Schwarzhoff, R. H., Impact of Adulterants on RIA Analysis of Urine for Drugs of Abuse. Journal of analytical toxicology 1989, 13 (5), 277-284. 5. Olivieri, B.; Marić, M.; Bridge, C., Determining the effects of adulterants on drug detection via ELISA and adulterant tests strips. Drug testing and analysis 2018. 6. Staff, M. C. Performance Enhancing Drugs: Know the Risks. https://www.mayoclinic.org/healthy-lifestyle/fitness/in-depth/performance-enhancing-drugs/art-20046134. 7. Mandatory Guidelines and Proposed Revisions to Mandatory Guidelines for Federal Workplace Drug Testing Programs; Notices Services, D. o. H. a. H., Ed. Federal Register 2004; Vol. 69. 8. Verstraete, A. G., Detection Times of Drugs of Abuse in Blood, Urine, and Oral Fluid. Ther Drug Monit 2004, 26 (2), 200-205. 9. Jaffee, W. B.; Trucco, E.; Levy, S.; Weiss, R. D., Is this urine really negative? A systematic review of tampering methods in urine drug screening and testing. J Subst Abuse Treat 2007, 33 (1), 33-42. 10. Grange, R. D.; Thompson, J. P.; Lambert, D. G., Radioimmunoassay, enzyme and non-enzyme-based immunoassays. Br J Anaesth 2014, 112 (2), 213-216. 11. Tsai, J. S. C.; ElSohly, M. A.; Tsai, S.-F.; Murphy, T. P.; Twarowska, B.; Salamone, S. J., Investigation of Nitrite Adulteration on the Immunoassay and GC-MS Analysis of Cannabinoids in Urine Specimens. Journal of analytical toxicology 2000, 24 (8), 708-714. 12. Dasgupta, A., The Effects of Adulterants and Selected Ingested Compounds on Drugs-of-Abuse Testing in Urine. Am J Clin Pathol 2007, 128 (3), 491-503. 13. Schwarzhoff, R.; Cody, J. T., The Effects of Adulterating Agents on FPIA Analysis of Urine for Drugs of Abuse. Journal of analytical toxicology 1993, 17 (1), 14-17. 14. Pearson, S. D.; Ash, K. O.; Urry, F. M., Mechanism of false-negative urine cannabinoid immunoassay screens by VisineTM eyedrops. Clin Chem 1989, 35 (4), 636-638. 15. Dasgupta, A.; Chughtai, O.; Hannah, C.; Davis, B.; Wells, A., Comparison of spot tests with AdultaCheck 6 and Intect 7 urine test strips for detecting the presence of adulterants in urine specimens. Clin Chim Acta 2004, 348 (1), 19-25. 16. Dasgupta, A.; Wahed, A.; Wells, A., Rapid Spot Tests for Detecting the Presence of Adulterants in Urine Specimens Submitted for Drug Testing. Am J Clin Pathol 2002, 117 (2), 325-329. 17. Peace, M. R.; Tarnai, L. D., Performance evaluation of three on-site adulterant detection devices for urine specimens. Journal of analytical toxicology 2002, 26 (7), 464-70. 18. Gross, J. H., Direct analysis in real time—a critical review on DART-MS. Analytical and Bioanalytical Chemistry 2014, 406 (1), 63-80.

45
19. Fernández, F. M.; Cody, R. B.; Green, M. D.; Hampton, C. Y.; McGready, R.; Sengaloundeth, S.; White, N. J.; Newton, P. N., Characterization of Solid Counterfeit Drug Samples by Desorption Electrospray Ionization and Direct-analysis-in-real-time Coupled to Time-of-flight Mass Spectrometry. ChemMedChem 2006, 1 (7), 702-705. 20. Lesiak, A. D.; Adams, K. J.; Domin, M. A.; Henck, C.; Shepard, J. R. E., DART-MS for rapid, preliminary screening of urine for DMAA. Drug Testing and Analysis 2014, 6 (7-8), 788-796. 21. Engvall, E., [28] Enzyme immunoassay ELISA and EMIT. Methods Enzymol 1980, 70, 419-439. 22. Jeol, U. I. AccuTOF - DART- The Ambient Ionization Toolbox. https://www.jeolusa.com/PRODUCTS/Mass-Spectrometers/AccuTOF-DART. 23. Baiker, C.; Serrano, L.; Lindner, B., Hypochlorite adulteration of urine causing decreased concentration of delta 9-THC-COOH by GC/MS. Journal of analytical toxicology 1994, 18 (2), 101-3. 24. Harvey, D., Chapter 4 Evaluating Analytical Data In Modern Analytical Chemistry, McGraw-Hill Higher Education: 2000. 25. § 26.163 Cutoff levels for drugs and drug metabolites. https://www.nrc.gov/reading-rm/doc-collections/cfr/part026/part026-0163.html. 26. Wu, A. H. B.; Forte, E.; Casella, G.; Sun, K.; Hemphill, G.; Foery, R.; Schanzenbach, H., CEDIA for Screening Drugs of Abuse in Urine and the Effect of Adulterants. J Forensic Sci 1995, 40 (4), 614-618. 27. Wong, R., The effect of adulterants on urine screen for drugs of abuse: detection by an on-site dipstick device. American clinical laboratory 2002, 21 (1), 37-9. 28. Cassells, N. P.; Craston, D. H., The effects of commonly used adulterants on the detection of spiked LSD by an enzyme immunoassay. Sci Justice 1998, 38 (2), 109-117. 29. Dasgupta, A., Urinary adulterants and drugs-of-abuse testing. MLO: medical laboratory observer 2003, 35 (2), 26-8, 30-1. 30. Tsai, S. C.; ElSohly, M. A.; Dubrovsky, T.; Twarowska, B.; Towt, J.; Salamone, S. J., Determination of five abused drugs in nitrite-adulterated urine by immunoassays and gas chromatography-mass spectrometry. Journal of analytical toxicology 1998, 22 (6), 474-80.