urgent measurement of coseismic displacement and tsunami...
TRANSCRIPT
Report on Loan No. 860
Assessment of the earthquake and tsunami hazard in western Sumatra following
the 09/07 Mentawai Islands earthquake sequence.
John McCloskey
1 and Peter Clarke
2
1 School of Environmental Sciences University of Ulster,
2 School of Civil Engineering and Geosciences, University of Newcastle
1 Background
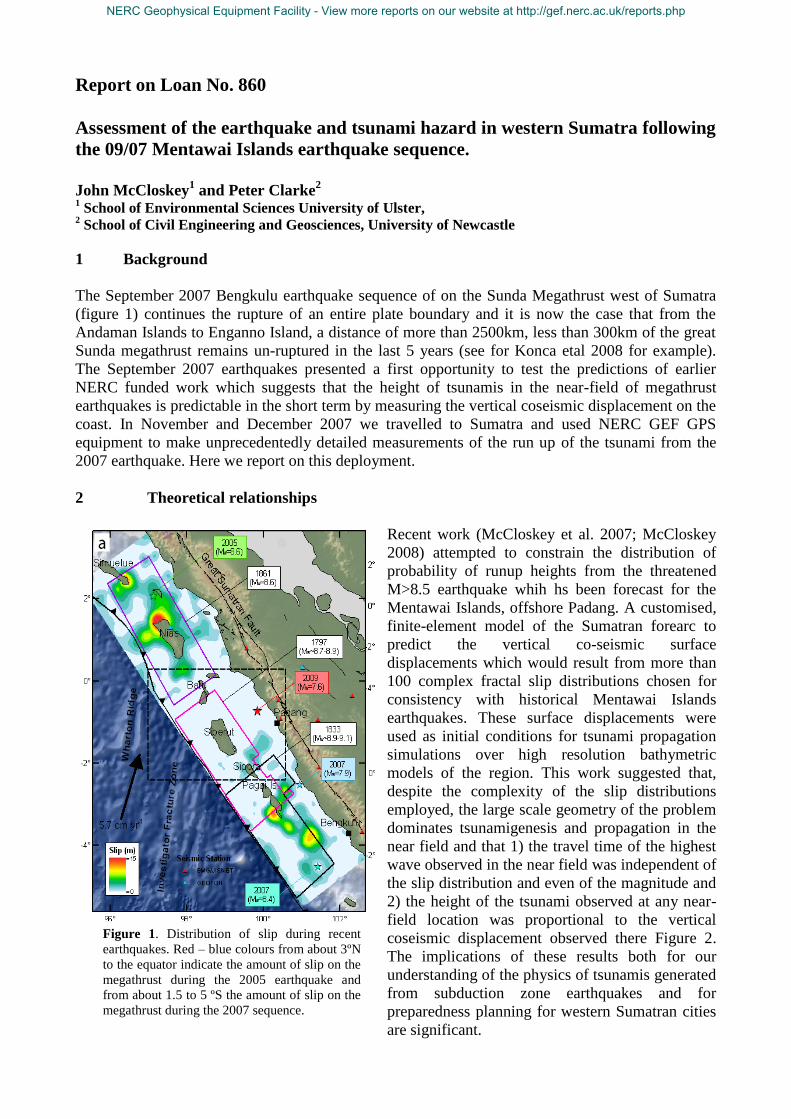
The September 2007 Bengkulu earthquake sequence of on the Sunda Megathrust west of Sumatra
(figure 1) continues the rupture of an entire plate boundary and it is now the case that from the
Andaman Islands to Enganno Island, a distance of more than 2500km, less than 300km of the great
Sunda megathrust remains un-ruptured in the last 5 years (see for Konca etal 2008 for example).
The September 2007 earthquakes presented a first opportunity to test the predictions of earlier
NERC funded work which suggests that the height of tsunamis in the near-field of megathrust
earthquakes is predictable in the short term by measuring the vertical coseismic displacement on the
coast. In November and December 2007 we travelled to Sumatra and used NERC GEF GPS
equipment to make unprecedentedly detailed measurements of the run up of the tsunami from the
2007 earthquake. Here we report on this deployment.
2 Theoretical relationships
Recent work (McCloskey et al. 2007; McCloskey
2008) attempted to constrain the distribution of
probability of runup heights from the threatened
M>8.5 earthquake whih hs been forecast for the
Mentawai Islands, offshore Padang. A customised,
finite-element model of the Sumatran forearc to
predict the vertical co-seismic surface
displacements which would result from more than
100 complex fractal slip distributions chosen for
consistency with historical Mentawai Islands
earthquakes. These surface displacements were
used as initial conditions for tsunami propagation
simulations over high resolution bathymetric
models of the region. This work suggested that,
despite the complexity of the slip distributions
employed, the large scale geometry of the problem
dominates tsunamigenesis and propagation in the
near field and that 1) the travel time of the highest
wave observed in the near field was independent of
the slip distribution and even of the magnitude and
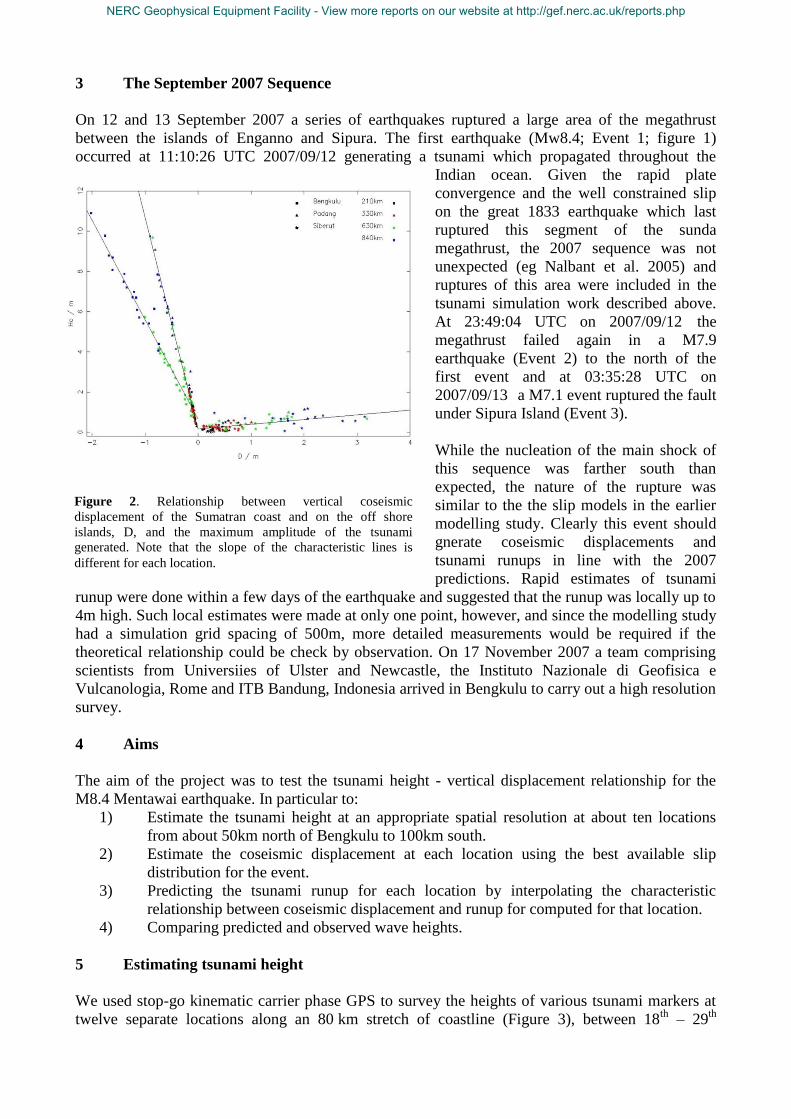
2) the height of the tsunami observed at any near-
field location was proportional to the vertical
coseismic displacement observed there Figure 2.
The implications of these results both for our
understanding of the physics of tsunamis generated
from subduction zone earthquakes and for
preparedness planning for western Sumatran cities
are significant.
Figure 1. Distribution of slip during recent
earthquakes. Red – blue colours from about 3ºN
to the equator indicate the amount of slip on the
megathrust during the 2005 earthquake and
from about 1.5 to 5 ºS the amount of slip on the
megathrust during the 2007 sequence.
NERC Geophysical Equipment Facility - View more reports on our website at http://gef.nerc.ac.uk/reports.php
3 The September 2007 Sequence
On 12 and 13 September 2007 a series of earthquakes ruptured a large area of the megathrust
between the islands of Enganno and Sipura. The first earthquake (Mw8.4; Event 1; figure 1)
occurred at 11:10:26 UTC 2007/09/12 generating a tsunami which propagated throughout the
Indian ocean. Given the rapid plate
convergence and the well constrained slip
on the great 1833 earthquake which last
ruptured this segment of the sunda
megathrust, the 2007 sequence was not
unexpected (eg Nalbant et al. 2005) and
ruptures of this area were included in the
tsunami simulation work described above.
At 23:49:04 UTC on 2007/09/12 the
megathrust failed again in a M7.9
earthquake (Event 2) to the north of the
first event and at 03:35:28 UTC on
2007/09/13 a M7.1 event ruptured the fault
under Sipura Island (Event 3).
While the nucleation of the main shock of
this sequence was farther south than
expected, the nature of the rupture was
similar to the the slip models in the earlier
modelling study. Clearly this event should
gnerate coseismic displacements and
tsunami runups in line with the 2007
predictions. Rapid estimates of tsunami
runup were done within a few days of the earthquake and suggested that the runup was locally up to
4m high. Such local estimates were made at only one point, however, and since the modelling study
had a simulation grid spacing of 500m, more detailed measurements would be required if the
theoretical relationship could be check by observation. On 17 November 2007 a team comprising
scientists from Universiies of Ulster and Newcastle, the Instituto Nazionale di Geofisica e
Vulcanologia, Rome and ITB Bandung, Indonesia arrived in Bengkulu to carry out a high resolution
survey.
4 Aims
The aim of the project was to test the tsunami height - vertical displacement relationship for the
M8.4 Mentawai earthquake. In particular to:
1) Estimate the tsunami height at an appropriate spatial resolution at about ten locations
from about 50km north of Bengkulu to 100km south.
2) Estimate the coseismic displacement at each location using the best available slip
distribution for the event.
3) Predicting the tsunami runup for each location by interpolating the characteristic
relationship between coseismic displacement and runup for computed for that location.
4) Comparing predicted and observed wave heights.
5 Estimating tsunami height
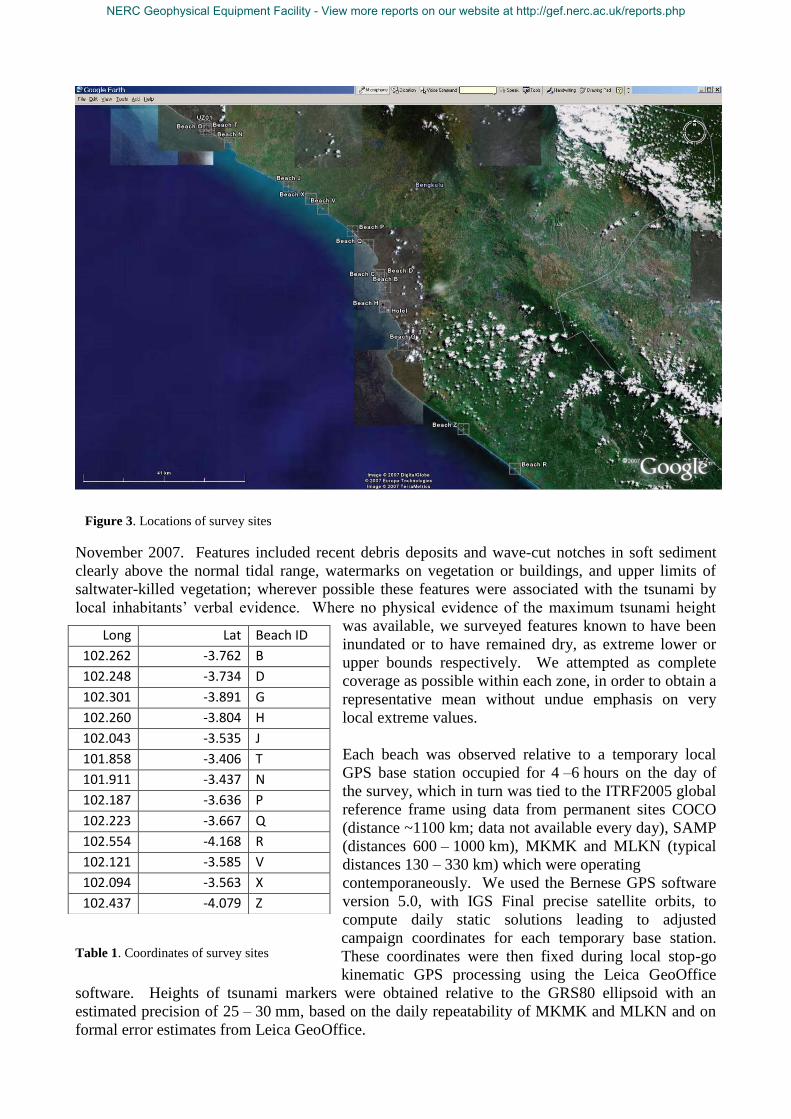
We used stop-go kinematic carrier phase GPS to survey the heights of various tsunami markers at
twelve separate locations along an 80 km stretch of coastline (Figure 3), between 18th
– 29th
Figure 2. Relationship between vertical coseismic
displacement of the Sumatran coast and on the off shore
islands, D, and the maximum amplitude of the tsunami
generated. Note that the slope of the characteristic lines is
different for each location.
NERC Geophysical Equipment Facility - View more reports on our website at http://gef.nerc.ac.uk/reports.php
November 2007. Features included recent debris deposits and wave-cut notches in soft sediment
clearly above the normal tidal range, watermarks on vegetation or buildings, and upper limits of
saltwater-killed vegetation; wherever possible these features were associated with the tsunami by
local inhabitants’ verbal evidence. Where no physical evidence of the maximum tsunami height
was available, we surveyed features known to have been
inundated or to have remained dry, as extreme lower or
upper bounds respectively. We attempted as complete
coverage as possible within each zone, in order to obtain a
representative mean without undue emphasis on very
local extreme values.
Each beach was observed relative to a temporary local
GPS base station occupied for 4 –6 hours on the day of
the survey, which in turn was tied to the ITRF2005 global
reference frame using data from permanent sites COCO
(distance ~1100 km; data not available every day), SAMP
(distances 600 – 1000 km), MKMK and MLKN (typical
distances 130 – 330 km) which were operating
contemporaneously. We used the Bernese GPS software
version 5.0, with IGS Final precise satellite orbits, to
compute daily static solutions leading to adjusted
campaign coordinates for each temporary base station.
These coordinates were then fixed during local stop-go
kinematic GPS processing using the Leica GeoOffice
software. Heights of tsunami markers were obtained relative to the GRS80 ellipsoid with an
estimated precision of 25 – 30 mm, based on the daily repeatability of MKMK and MLKN and on
formal error estimates from Leica GeoOffice.
Long Lat Beach ID
102.262 -3.762 B
102.248 -3.734 D
102.301 -3.891 G
102.260 -3.804 H
102.043 -3.535 J
101.858 -3.406 T
101.911 -3.437 N
102.187 -3.636 P
102.223 -3.667 Q
102.554 -4.168 R
102.121 -3.585 V
102.094 -3.563 X
102.437 -4.079 Z
Table 1. Coordinates of survey sites
Figure 3. Locations of survey sites
NERC Geophysical Equipment Facility - View more reports on our website at http://gef.nerc.ac.uk/reports.php
In order to compare these observed heights with predictions, they must be expressed as heights
above the sea surface as it was immediately before the 12th
September tsunami, which occurred at
when the sea surface was 42 cm above mean sea level (MSL) according to the FES2004 numerical
ocean tide model, close to high tide on that day. Predicted variations in tidal height and dynamic
sea surface topography (including the inverse barometer effect due to atmospheric pressure) are less
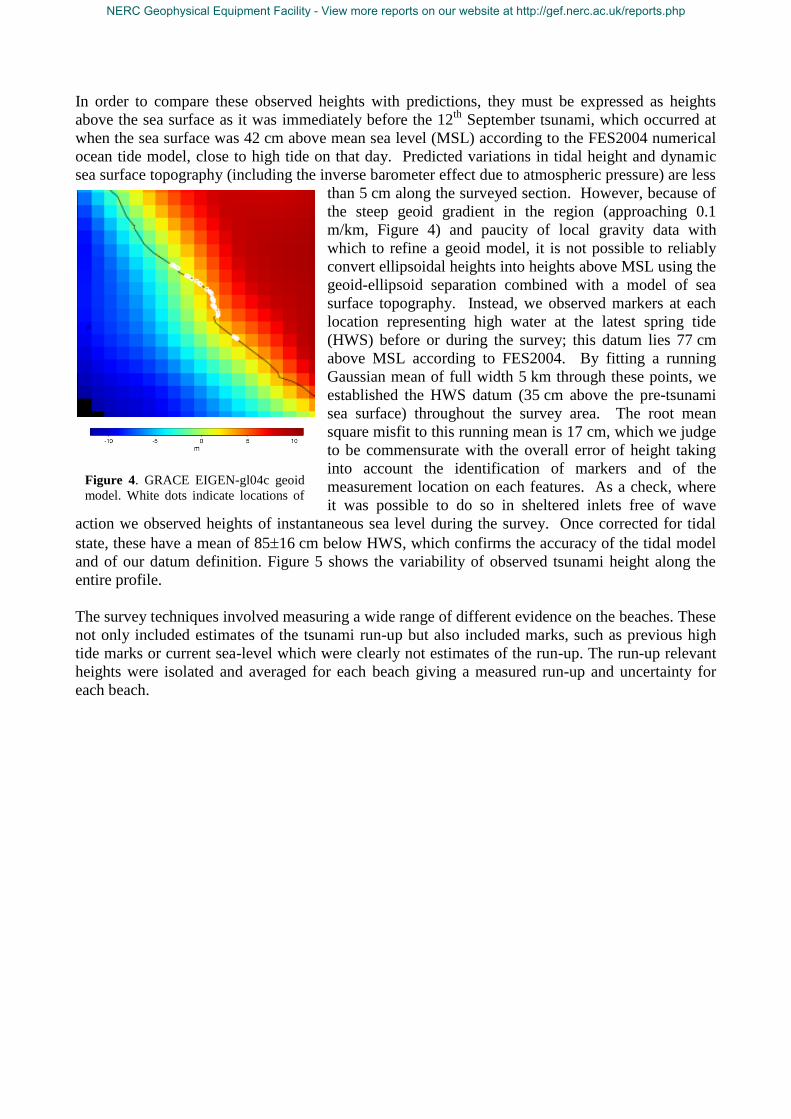
than 5 cm along the surveyed section. However, because of
the steep geoid gradient in the region (approaching 0.1
m/km, Figure 4) and paucity of local gravity data with
which to refine a geoid model, it is not possible to reliably
convert ellipsoidal heights into heights above MSL using the
geoid-ellipsoid separation combined with a model of sea
surface topography. Instead, we observed markers at each
location representing high water at the latest spring tide
(HWS) before or during the survey; this datum lies 77 cm
above MSL according to FES2004. By fitting a running
Gaussian mean of full width 5 km through these points, we
established the HWS datum (35 cm above the pre-tsunami
sea surface) throughout the survey area. The root mean
square misfit to this running mean is 17 cm, which we judge
to be commensurate with the overall error of height taking
into account the identification of markers and of the
measurement location on each features. As a check, where
it was possible to do so in sheltered inlets free of wave
action we observed heights of instantaneous sea level during the survey. Once corrected for tidal
state, these have a mean of 8516 cm below HWS, which confirms the accuracy of the tidal model
and of our datum definition. Figure 5 shows the variability of observed tsunami height along the
entire profile.
The survey techniques involved measuring a wide range of different evidence on the beaches. These
not only included estimates of the tsunami run-up but also included marks, such as previous high
tide marks or current sea-level which were clearly not estimates of the run-up. The run-up relevant
heights were isolated and averaged for each beach giving a measured run-up and uncertainty for
each beach.
Figure 4. GRACE EIGEN-gl04c geoid
model. White dots indicate locations of
survey locations Variation in
geoidelevation is more than 5m across
the survey
NERC Geophysical Equipment Facility - View more reports on our website at http://gef.nerc.ac.uk/reports.php
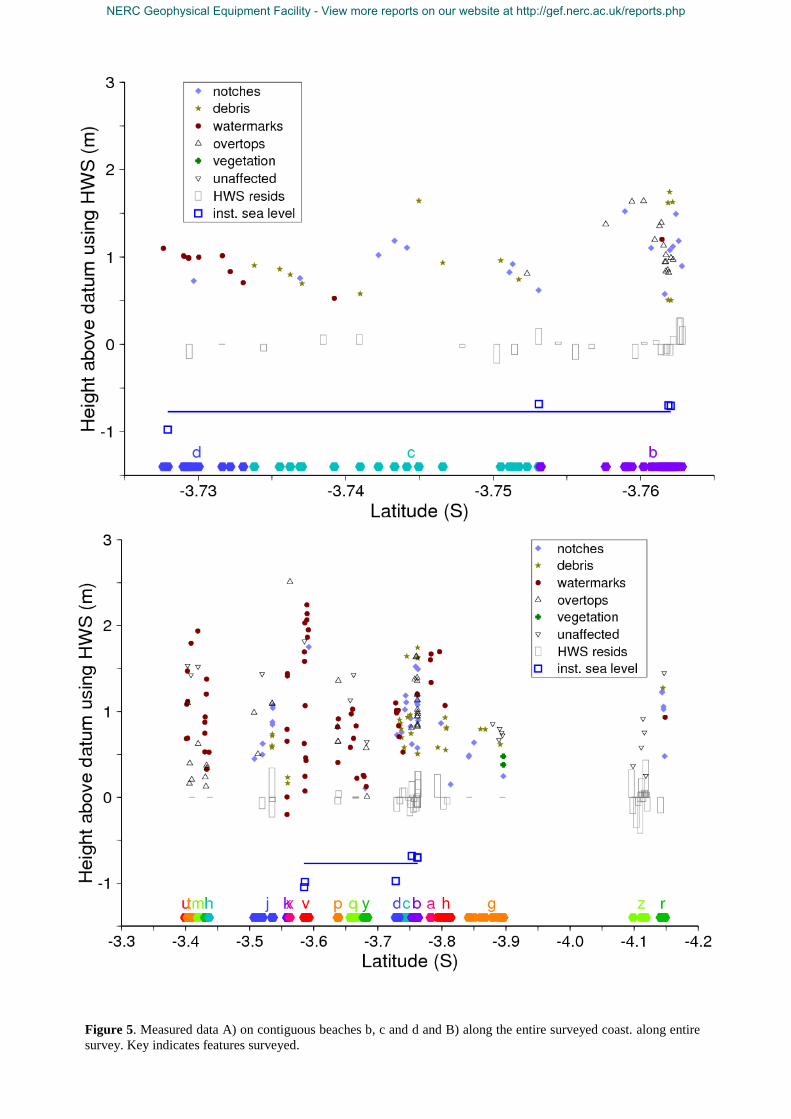
Figure 5. Measured data A) on contiguous beaches b, c and d and B) along the entire surveyed coast. along entire
survey. Key indicates features surveyed.
NERC Geophysical Equipment Facility - View more reports on our website at http://gef.nerc.ac.uk/reports.php
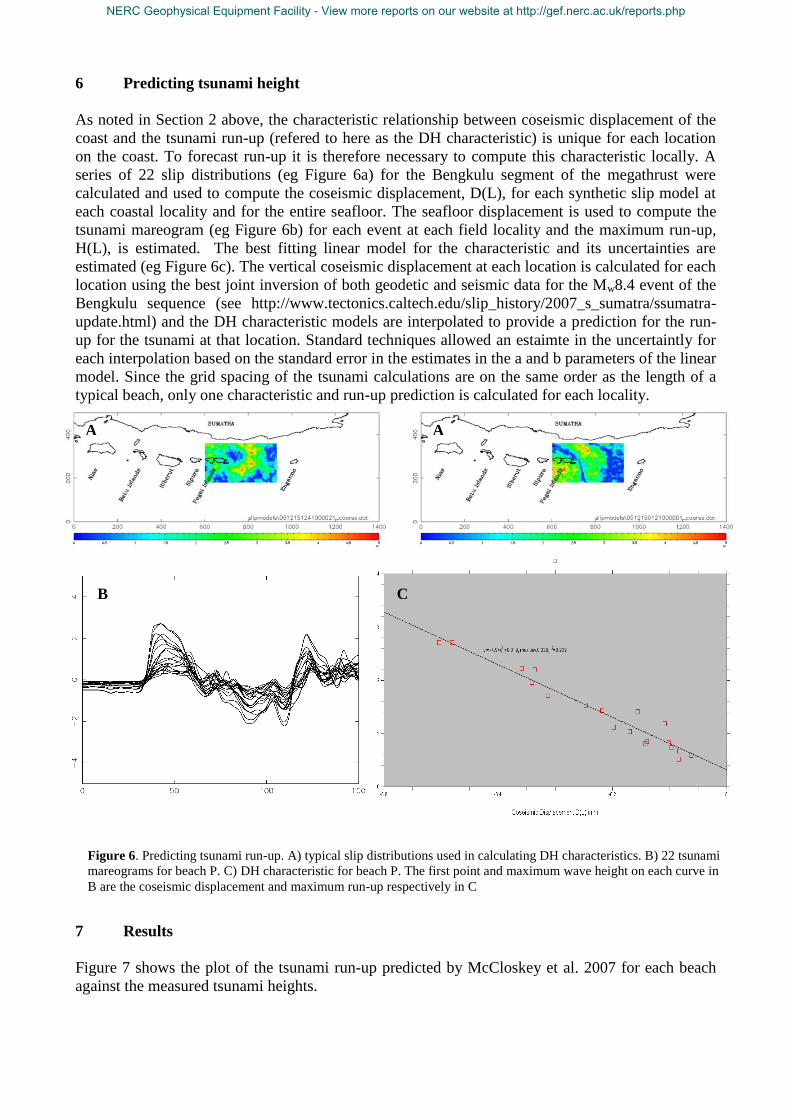
6 Predicting tsunami height
As noted in Section 2 above, the characteristic relationship between coseismic displacement of the
coast and the tsunami run-up (refered to here as the DH characteristic) is unique for each location
on the coast. To forecast run-up it is therefore necessary to compute this characteristic locally. A
series of 22 slip distributions (eg Figure 6a) for the Bengkulu segment of the megathrust were
calculated and used to compute the coseismic displacement, D(L), for each synthetic slip model at
each coastal locality and for the entire seafloor. The seafloor displacement is used to compute the
tsunami mareogram (eg Figure 6b) for each event at each field locality and the maximum run-up,
H(L), is estimated. The best fitting linear model for the characteristic and its uncertainties are
estimated (eg Figure 6c). The vertical coseismic displacement at each location is calculated for each
location using the best joint inversion of both geodetic and seismic data for the Mw8.4 event of the
Bengkulu sequence (see http://www.tectonics.caltech.edu/slip_history/2007_s_sumatra/ssumatra-
update.html) and the DH characteristic models are interpolated to provide a prediction for the run-
up for the tsunami at that location. Standard techniques allowed an estaimte in the uncertaintly for
each interpolation based on the standard error in the estimates in the a and b parameters of the linear
model. Since the grid spacing of the tsunami calculations are on the same order as the length of a
typical beach, only one characteristic and run-up prediction is calculated for each locality.
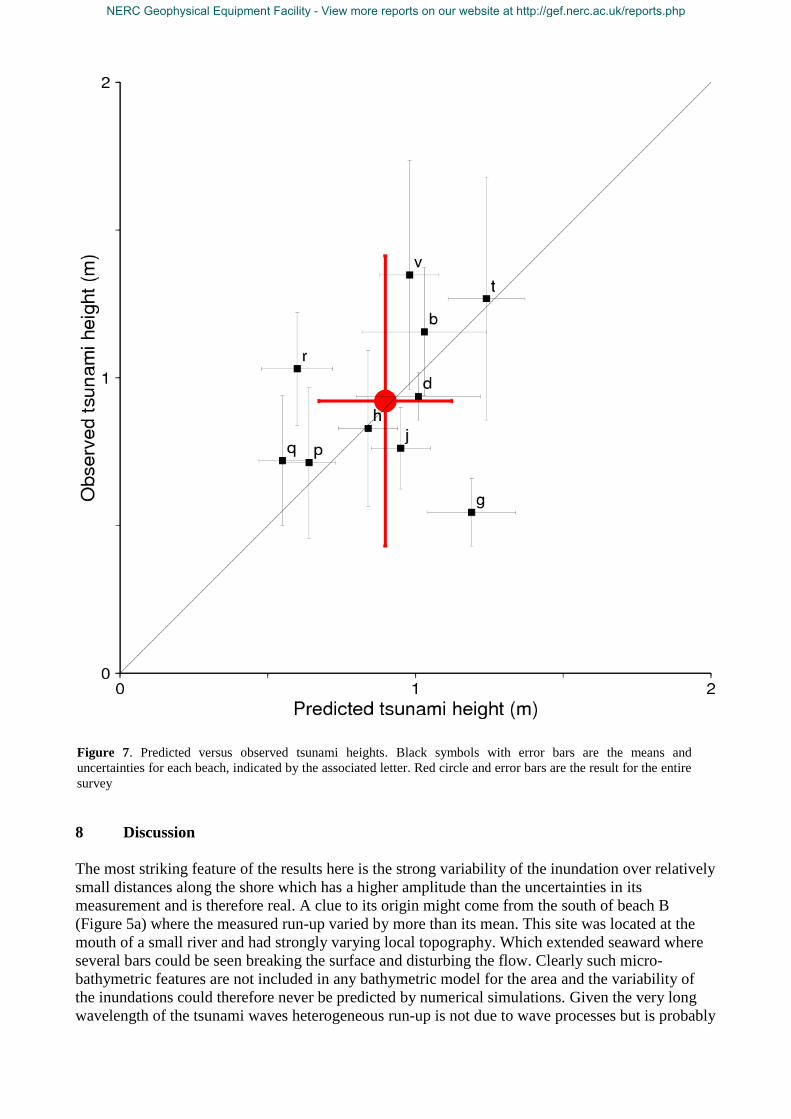
7 Results
Figure 7 shows the plot of the tsunami run-up predicted by McCloskey et al. 2007 for each beach
against the measured tsunami heights.
C B
A A
Figure 6. Predicting tsunami run-up. A) typical slip distributions used in calculating DH characteristics. B) 22 tsunami
mareograms for beach P. C) DH characteristic for beach P. The first point and maximum wave height on each curve in
B are the coseismic displacement and maximum run-up respectively in C
NERC Geophysical Equipment Facility - View more reports on our website at http://gef.nerc.ac.uk/reports.php
8 Discussion
The most striking feature of the results here is the strong variability of the inundation over relatively
small distances along the shore which has a higher amplitude than the uncertainties in its
measurement and is therefore real. A clue to its origin might come from the south of beach B
(Figure 5a) where the measured run-up varied by more than its mean. This site was located at the
mouth of a small river and had strongly varying local topography. Which extended seaward where
several bars could be seen breaking the surface and disturbing the flow. Clearly such micro-
bathymetric features are not included in any bathymetric model for the area and the variability of
the inundations could therefore never be predicted by numerical simulations. Given the very long
wavelength of the tsunami waves heterogeneous run-up is not due to wave processes but is probably
Figure 7. Predicted versus observed tsunami heights. Black symbols with error bars are the means and
uncertainties for each beach, indicated by the associated letter. Red circle and error bars are the result for the entire
survey
NERC Geophysical Equipment Facility - View more reports on our website at http://gef.nerc.ac.uk/reports.php

the results of hydrodynamic interaction with the shallow bathymetry and local topography. It is
probable that such interactions will be very important in controlling the precise run-up in larger
tsunamis and this study would support the use of detailed bathymetric and topographic models for
assessing likely run-up from threatened tsunamis. In this instance the correct run-up for beach b for
comparison with numerical simulations is the mean of the measurements, about 1.2±0.25m not the
maximum run-up along this stretch of coast, about 1.7m, which is often recorded in tsunami
surveys.
Figure 7 shows predicted versus observed tsunami run-up for the project. Firstly, the average result
for the entire survey is entirely consistent with theory. The theoretical relationship would have
predicted an average inundation for this coast of about 0.9±0.3m, the observed heights were about
0.9±0.5m. The detail, however, is more complex and this mean is the result of long-wavelength
smoothing of significant variability.
A clear finding of this work is the importance of using appropriate scale variability and the use of
full hydrodynamic models in the forecasting of tsunami inundation. We note that such work is
currently being carried out for the city of Padang in western Sumatra.
9 Publications
McCloskey et al. (2007), Lessons from the 2007 Mentawai Islands earthquakes, Eos Trans. AGU,
88 (52), Fall Meet. Suppl., Abstract U53A-03
A paper is in preparation for Nature Geoscience.
10 References
Konca, A.O. et al. 2008. Nature, 456 . pp. 631-635.
McCloskey, J., et al. 2007. GRL., 34, L14316,.
McCloskey, J. et al. 2008. EPSL, 265, 61-81.
NERC Geophysical Equipment Facility - View more reports on our website at http://gef.nerc.ac.uk/reports.php