urea volatilization and enhanced efficiency nitrogen...
TRANSCRIPT

Urea Volatilization and Enhanced Efficiency Nitrogen Fertilizers for Small Grains
Crop Pest Management School January 6, 2011
by Clain Jones, Extension Soil Fertility Specialist and Kathrin Olson-Rutz, Research Associate
[email protected]; 994-6076

Objectives
• Present urea volatilization study results • Present fertilizer management options to
decrease volatilization • Explain pros and cons of enhanced
efficiency fertilizers (EEFs) • Show research results for EEFs

The N Cycle

Factors Increasing Volatilization
1. High Soil pH and Temperature 2. Windy 3. Low Cation Exchange Capacity (CEC). WHY? 4. Low buffering capacity (resistance to pH
change) 5. High soil moisture/humidity 6. Little Rainfall/Irrigation following fertilization 7. High Ground cover/vegetation/residue. WHY? 8. Low Soluble and Exchangeable Calcium Bottom line: Large number of factors make volatilization amounts VARIABLE and difficult to predict.


mast and shuttles
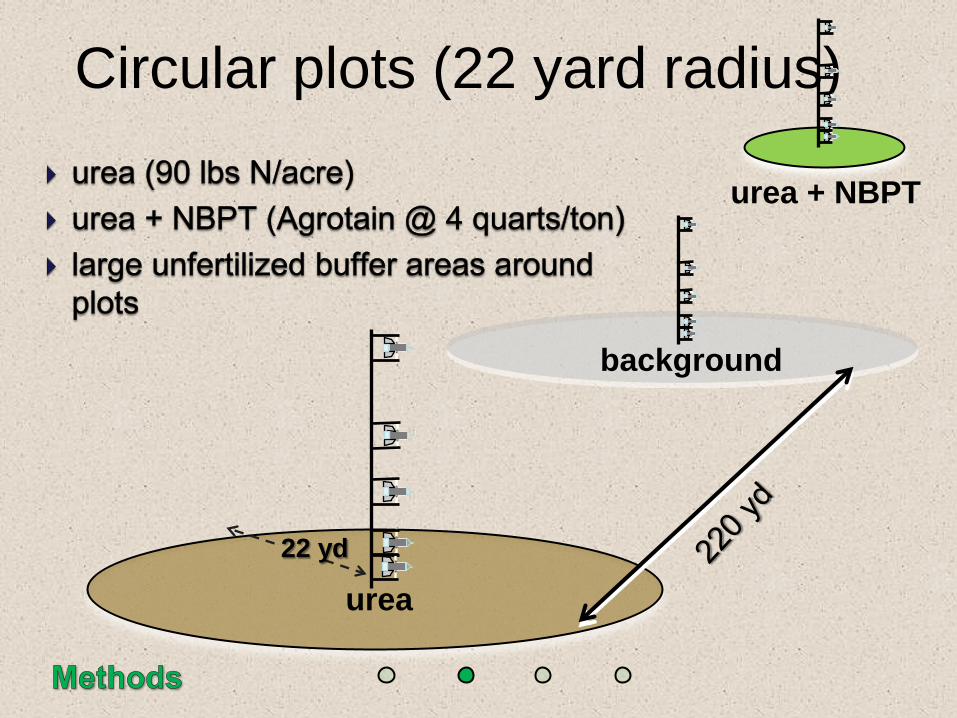
Circular plots (22 yard radius)
urea
background
urea + NBPT
22 yd

stainless steel spiral coated with oxalic acid front back
rotate on pivot & face into wind

Campaign 2: October 9, 2008. Air temp = 45 F, Soil temp = 43 F
Campaign 5: March 26, 2009. Air temp = 21 F, Soil temp = 34 F

• October 9, 2008 application,
air-temp. 45 °F, dry soil surface
• no rain for 24 days and then
Nov. 2-5 field site received 0.98”ppt.
1 wk post-fertilization prills not dissolved

0
5
10
15
20
25
1 2 3 4 5 6 7 8Perc
enta
ge o
f app
lied
N lo
st
Weeks post-fertilization
Urea (3.1%)
Urea + NBPT (1.4%)
Mean Air Temp ~ 42 F
Mean Soil Temp ~ 41 F

soil surface with fertilizer prills beginning to dissolve
Fertilizer applied on Mar 26, 2009 light snow on soil surface and air
temp = 21 F

0
5
10
15
20
25
1 2 3 4 5 6 7 8Perc
enta
ge o
f app
lied
N lo
st
Weeks post-fertilization
urea (39.9%)
urea + NBPT (18.1%) Precipitation no rain 0-2 wks 1.54” 2-8 wks
Soil = 38 °F Air = 39 °F
Mean temperature
Conclusion: High losses observed even though temperatures were cold!

calcareous soils, pH 8.3
Campaign 9 & 10 – Willow Creek Brocko silt loam

Campaign 9 – Willow Creek – Jan. 27
5.3 inches of snow

Campaign 9 – Willow Creek – Feb. 10

• no runoff

• no runoff • NBPT < urea (10 wks activity)

Soil temperature (0.4 inch) at Willow Creek, Campaign 9

Campaign Summary (% N loss) Campaign Fertilization
date Urea Agrotain 1 April 3, 2008 8.4 4.4
2 Oct 8, 2008 3.1 1.4
3 Nov 14, 2008 31.5 4.0
4 March 25, 2009 35.6 18.0
5 March 26, 2009 39.9 18.1
6 Oct 6, 2009 10.7 3.3
7 Oct 13, 2009 10.4 4.8
8 Oct 19, 2009 15.7 3.4
9 Jan 27, 2010 24.3 9.3
10 Feb 26, 2010 44.1 11.9
11 March 29, 2010 6.3 1.7
12 April 20, 2010 14.7 1.4 Average 20.4 6.8
wide range in N loss amounts

http://landresources.montana.edu/ureavolatilization


If ~20% of broadcast urea is lost, why didn’t MT research from the 1990s show large yield/protein losses compared to ammonium nitrate and/or subsurface banding? (Jones et al. 2007)
1. Adequate precipitation may have occurred after application.
2. Urea takes 2 - 5 weeks to become available whereas AN is immediately available for plants and for other losses-urea’s ‘slow release’ property may increase its efficiency, making up for loss.
3. About 50% of N uptake comes from fertilizer (rest from soil). So 20% of 50% is 10% difference in N availability-might not make a statistically SIGNIFICANT difference (though still a bottom line difference).
4. With longer term no-till could ‘urease’ enzyme concentrations have increased? It is known that residue contains more urease than soil.
5. With longer term no-till, some calcium has likely leached out of surface soil. Calcium is known to decrease volatilization and most source studies were conducted last decade.

Effect of Urea Placement on Hays Annual Forage Yield

Effect of Urea Placement on Hays Barley (Annual Forage) Yield
0.0
0.5
1.0
1.5
2.0
2.5
3.0
2009 2010
Fora
ge y
ield
(ton
s/ac
re)
subsurfacebandbroadcast
a
ab
Angvick et a l . unpub data
Froid, MT
b

Urea broadcast
2009 (apparent low volatilization)
1.8 inches
Urea broadcast
0.5 inches
2010 (apparent high volatilization)

Effect of irrigation rate on urea volatilization (Horneck, unpub data)
Echo, Oregon
Soil Temp = 46 F

Does ½ inch of rain also stop volatilization? (Horneck unpub data)
Not if spread out over 3 days

What should you do to minimize volatilization?
1. Do not apply urea on moist ground UNLESS a snow or rainstorm is forecast to drop at least ½ inch of rain in a day. Preferably more (unlikely unfortunately!).
2. If you irrigate, apply ½ inch of irrigation after urea application.
3. Apply urea below the surface – either in a midrow band, 2 inches from the seed or with the seed with a ‘protected’ product or a wide opener.
4. Consider seeding right after urea application to cover some urea; wider openers will help with this. (We’re currently testing effectiveness of this practice)
5.Consider using Agrotain or ammonium nitrate (if available) if can’t apply during a low risk time.

Enhanced Efficiency Fertilizers EEFs
• Any fertilizer designed to: – Increase fertilizer availability – Decrease fertilizer losses
• 3 major methods of action
– Stabilized - alter soil microbial or enzymatic reactions – Slow release - have additives which require chemical
or biological decomposition to release nutrients – Controlled release - a semipermeable coating, usually
a polymer, regulates release

Stabilized Urease Inhibitors
NH 4 +
NO
NO 2
NH 4 +
NH3 NO 3
-
N2 and N2O
Den
itrifi
catio
n
NO 2 -
Vola
tiliz
atio
n
Plan
t Upt
ake
Leac
hing
Urea UAN
slow urea hydrolysis here, most common is
NBPT

Stabilized Nitrification Inhibitors
NH 4 +
NO
NO 2
NH 4 +
NH3 NO 3
-
N2 and N2O
Den
itrifi
catio
n
NO 2 -
Vola
tiliz
atio
n
Plan
t Upt
ake
Leac
hing
Urea UAN
slow conversion to nitrate here

Slow and Controlled Release
NH 4 +
NO
NO 2
NH 4 +
NH3 NO 3
-
N2 and N2O
Den
itrifi
catio
n
NO 2 -
Vola
tiliz
atio
n
Plan
t Upt
ake
Leac
hing
Urea UAN control release here
slow release here

Questions?

Under what growing conditions would you expect EEFs to work better?
• High potential volatilization loss coarse soils moist surface warm temps long time between application and incorporation
• High potential leaching
coarse soils high moisture content/irrigation/rainfall

0
2
4
6
8
10
12
14
16
18
0 2 4 6 8 10 12
Urea
Urea + irrigation
NBPT- urea
NBPT-urea + irrigationCum
lativ
e N
loss
(% o
f app
lied
N)
Days after N fertilization
Effect of irrigation and NBPT on volatilization
0.8 inch irrigation on days 2 and 8
Rawluk 2000 Manitoba

NBPT uses
• Can minimize urea volatilization for several weeks
• ‘Buys’ time for rainfall, irrigation or mechanical incorporation to protect urea
• Warm weather top-dressing • Cool weather broadcast

N release by polymer-coated (controlled release) fertilizers
water moves in through coating
urea dissolves in prill
N moves out through coating
into soil solution
collapsed prill biodegrades Schematic adaptation and photo courtesy of Agrium, U.S. All rights reserved.

-4
-2
0
2
4
6
8
10
12
14
16
Yiel
d ch
ange
with
spr
ing-
band
ed P
CU
ov
er c
onve
ntio
nal u
rea
(%) Barley
Canola
Wheat
Low moisture High moisture
Effects of over-winter moisture conditions on effectiveness of PCU
Grant & Downbenko 2008 spring banded PCU
Saskatchewan
WHY?

What type of crops would you expect slow release to work better?
• Irrigated • Warm season
What about dryland cool season crops?

DateApr May Jun Jul Aug
Cum
ulat
ive N
upt
ake
(%
max
imum
)
0
20
40
60
80
100
Timing of N uptake by wheat

DateApr May Jun Jul Aug
Cum
ulat
ive N
upt
ake
(%
max
imum
)
0
20
40
60
80
100
Approx % N released by typical ESN seedplaced
in mid May
Timing of N uptake by wheat and ESN® N release
Options for wheat?

How does PCU work for small grains?
• Fall/winter pre-plant works well. PCU is in soil long enough to dissolve in time for plant need.
• Late winter/spring broadcast PCU does not - may dry out, release is too slow.
• Incorporation is important, especially late winter/spring.
• Blending is recommended with late winter/spring surface applied PCU.

Effect of EEF source and application method on winter wheat yield
Location: Beiseker, Alberta Soil: silt loam, 4.5% organic matter Precipitation: 13.5 in. seeding to harvest 5 N sources: • AN – ammonium nitrate • Urea • Agrotain® treated urea – urease inhibitor • Super Urea® – urease and nitrification inhibitor • ESN® – polymer coated urea Rate: 80 lb N/ac Subsurface side-banded (1.2” below and 1” side of seed) at seeding or broadcast in spring

Yield with N fall subsurface side-banded
Why did urea outcompete AN?

Stabilized Urease Inhibitors
NH 4 +
NO
NO 2
NH 4 +
NH3 NO 3
-
N2 and N2O
Den
itrifi
catio
n
NO 2 -
Vola
tiliz
atio
n
Plan
t Upt
ake
Leac
hing
Urea AN
(NH4+ + NO3
- )

Yield with N spring broadcast
Why equal AN, Urea and Agrotain yields?

Each form of N is suitable – if used properly • Urea and Agrotain®-urea best used in spring • Super Urea® best fall banded • ESN® best side- or seed-row banded in fall –
advantage likely less in MT. Why? • Blend urea with ESN® to ensure early N
availability (50/50?)
Alberta Study Summary

Winter wheat with Nutrisphere-N ® (NSN) side-banded at seeding
Location: North of Conrad (WTARC) 2 N sources: • Urea • Nutrisphere-N® – urease and nitrification
inhibitor Rate: 40 and 80 lb N/ac Subsurface side-banded (1” above and to side of seed) at seeding

Yield with NSN treated urea side banded

Seed placing EEFs
• Can apply ~ 2 – 4x as much slow release product as urea directly with small grain seeds
• Saves on field passes – fuel, labor, soil disturbance

0
5
10
15
20
25
30
35
40
45
0 25 50 75 100 125
Application rate (lb N/acre)
Gra
in y
ield
(bu/
acre
)
Urea
Urease inhibitor
Polymer-coated
Saskatchewan Malhi et al. 2003
Effect of N source applied with the seed on dryland spring wheat yield

• Urea volatilization rates are highest when applied to moist soil surface w/o rain for at least 2 weeks following application.
• The best way to prevent volatilization is to place urea below the soil surface (> 1.5 inches is optimum)
• Agrotain decreases volatilization.
Conclusions

• Enhanced efficiency fertilizers can decrease N losses.
• Blending EEFs with conventional fertilizer may provide a good match between crop uptake and fertilizer availability.
• More EEF can be placed with the seed than conventional fertilizer, possibly saving a fertilizer pass and fuel costs.
Conclusions
Additional info in: Enhanced Efficiency Fertilizers (EB0188)
http://landresources.montana.edu/soilfertility Go to Fertilizer Information