urea distribution in renal failure - jcp.bmj.com · chronic renal failure is reported. amethod for...
TRANSCRIPT

J. clin. Path. (1963), 16, 235
Urea distribution in renal failureD. J. BLACKMORE, W. J. ELDER, AND C. H. BOWDEN
From the Research Department, R.A.F. Institute ofPathology and Tropical Medicine, andthe Renal Unit, Princess Mary's R.A.F. Hospital, Halton, Aylesbury, Bucks.
SYNOPSIS An assessment of intracellular urea removed during haemodialysis has been made fromurea extraction and plasma urea estimations. An apparent wide variation in the movement ofintracellular urea in patients with acute renal failure from obstetric and traumatic causes and withchronic renal failure is reported.A method for the estimation of red cell water urea is presented. In two patients with chronic
renal failure the red cell urea level was much higher than would have been expected from the plasmaurea level before dialysis. In two obstetric patients there was no such discrepancy.The conclusion is drawn that research should be directed to variations of intracellular metabolism
in renal failure before a more rational approach can be made to its management.
Urea measurements made during haemodialysis ofpatients w-ith renal failure have presented anomalieswhich are apparently inconsistent with the postulatethat urea is freely diffusible throughout the totalbody water. In an earlier paper two of us analysed60 haemodialyses with respect to the urea fall inplasma (Blackmore and Elder, 1961). A theoreticalfall in plasma urea was calculated from the knownurea clearance of the artificial kidney, the assumedtotal body water of the patient, and the initial plasmaurea. The actual fall in plasma urea never significantlyexceeded the calculated figure. In some patients withtrauma or glomerulonephritis the fall in plasma ureawas less than predicted, whereas in patients withrenal failure complicating pregnancy the actual andcalculated plasma urea falls were very close. Theprediction of plasma urea fall from the theoreticalperformance of the artificial kidney was not areliable procedure, partly because the machine didnot necessarily perform as predicted and partlybecause the urea did not apparently travel from cellsto extracellular fluid by a simple process of diffusionin all cases. As the ratio of calculated to observedplasma urea fall was found to correlate with theaetiology of the primary condition it was felt thatvariation in the performance of the machine was nota major factor. It was postulated that urea exists inboth cell and plasma in diffusible and non-diffusibleforms, and that there is a greater ratio of non-diffusible urea in the cell than in the plasma, theseratios being maintained in equilibrium. This ratioReceived for publication 23 January 1963.
might be determined by the aetiology of the primarycondition.Shackman, Chisholm, Holden, and Pigott (1962)
found in muscle biopsies an increased intracellularurea concentration in 14 of their 19 unselectedpatients and a decrease in the remaining five. Theycommented that this tended to support the conceptthat urea might exist as diffusible and non-diffusiblemoieties.
Further investigations on the dialyses of sevenpatients in renal failure are presented.
MATERIAL
The details of the patients investigated during dialysis areshown in Table I.
In our previous paper (Blackmore and Elder, 1961)the glomerulo-nephritic group included five patientswith chronic renal failure due to glomerulonephritis.During the period of the present investigation no patientwith glomerulonephritis was dialysed, but two patients(C.G. and W.W.) with chronic renal failure due tonephrosclerosis were included as it appeared from ourprevious studies that they behaved in a similar mannerwith respect to urea distribution. This group is notstrictly comparable with that previously presented.
METHODS
Haemodialyses were performed with a Kolff disposabletwin-coil unit using a modified Travenol artificial kidney.The coil was sealed in the can with sponge rubber and thebath circulating pump altered to give a constant flow of34 litres per minute under variable load. The blood flowwas measured by electromagnetic induction (Brennand
235
on 29 April 2019 by guest. P
rotected by copyright.http://jcp.bm
j.com/
J Clin P
athol: first published as 10.1136/jcp.16.3.235 on 1 May 1963. D
ownloaded from

D. J. Blackmore, W. J. Elder, and C. H. Bowden
TABLE ISUMMARY OF PATIENTS
Sex Age Days of Maximum Dialyses RemarksOliguria Plasma Urea (day from
(mg./100 ml.) onset of renalfailure)
ObstetricL.F. Septic abortion at about tenth
week of pregnancy
R.J.H. Toxaemia of pregnancyAnterior rupture of membranesat term, followed by spontaneousdelivery of live male child;post-partum eclampsia
Chronic Renal FailureC.G. Nephrosclerosis with polyuria
Myocardial infarction
W .W. Malignant hypertension,narrowed left renal artery,impaired renal function, leftrenal endarterectomy
TraumaticC.J. Fractured pelvis, left femur,
and right humerus; grosscontusion of lower abdomenand thighs; perforated bladderand rectum
F 31 20 470 8 and 15 Curettage of uterus under generalanaesthesia on third day. Progressthrough oliguric and recovery phasesuneventful
F 22 16 410 7 and 14 Satisfactory involution of uterus.'Toxic psychosis' developed after firstdialysis, treated with thioridazine(Melleril). Uneventful progress througholiguric and recovery phases
M 49 18 490 10, 12, 15, Severely ill throughout, rapid rise ofand 18 plasma urea and potassium. From 13th
day required small amounts of metara-minol bitartrate (Aramine) to maintainthe blood pressure. Died during fourthdialysis as a result of a further myocardialinfarct. Post-mortem examinationconfirmed the diagnosis
M 38 27 420 8, 12, 17, Progress through oliguric phase onlyand 22 complicated by moderately severe
exfoliative dermatitis (presumed drugsensitivity) for which prednisolone wasgiven from the 13th day. Hypotensivetherapy started on 32nd day. Dischargedon 44th day with blood urea 55 mg./100 ml. and urine volumes 1-5 to 2 0 1.24 hours.
M 27 660 12 On first day general anaesthesia forinsertion of Steinmann's pin into righttibia, suture of bladder, and transversecolostomy. General condition fairthrough oliguric and recovery phases.On 17th day general anaesthesia forapplication of hip spica and explorationand further suture of bladder laceration.Transferred to Surgical Division on30th day having made a good recovery
P.U. Ventricular septal defect;closure with hypothermia andbypass
F 18 9 475 8 On fifth day sudden rise of bloodpressure to c. 200/140 mm. Hg; thisreturned to normal levels within the nextfive days without treatment. In recoveryphase developed right lower lobepneumonia. Discharged on 23rd daywith normal plasma urea, having madea good recovery
A.J.M. Crush injury to right arm,followed by gas gangrene
M 19 20 470 9, 11, 13, 16, Acute renal failure followed profound18, and 22 blood pressure fall during massive
debridement three days after crashinjury. The next day the right arm wasamputated. Very ill throughout oliguricand recovery phases. Tracheotomyperformed on 7th day. On 16th daypassed massive melaena stoolsDied on 30th day from septicaemia
and Bunker, 1960). Sodium and potassium concentrationsin the dialysing fluid varied from patient to patient but nourea was added. The dialysing fluid was prepared fromde-ionized water (conductivity < 20 ,u mho). Lactic acidwas added to adjust the pH range to 7-4 to 7-6; to
maintain thispH, 5% CO2 in oxygen was bubbled throughthe dialysing fluid during the period of dialysis.The urea concentration in the dialysing bath was
estimated in duplicate by the method of Fawcett and Scott(1960). A modification of this method using a protein
236
on 29 April 2019 by guest. P
rotected by copyright.http://jcp.bm
j.com/
J Clin P
athol: first published as 10.1136/jcp.16.3.235 on 1 May 1963. D
ownloaded from

Urea distribution in renalfailure
precipitation stage was used for the red cell and plasmaurea estimations.
RED BLOOD CELL UREA CONCENTRATION To 2 ml. dilutedwhole blood (adjusted to give a final urea content of lessthan 1 mg. urea/100 ml.) was added 2 ml. of bufferedurease reagent. After 30 minutes' incubation at roomtemperature 0-5 ml. 2/3 N sulphuric acid and 0 6 ml.10% sodium tungstate were added in this order. Theslight excess of sodium tungstate produced more con-sistent results. The tubes were stood for 10 minutes andthen centrifuged at 3,000 r.p.m. for 10 minutes.To 2 ml. of the supernatant the following reagents
were added in quick succession: 2 ml. of sodium phenatereagent, 3 ml. 0-01% sodium nitroprusside, and 3 ml.0-02 N sodium hypochlorite. The colour was left todevelop away from direct light for 60 minutes and thencompared in a Hilger-Spekker colorimeter at 630 m,u(Kodak filter no. 7) against standards and blankssimilarly treated.Plasma was obtained from heparinized blood (7-5
units heparin per ml. blood) separated within 10 minutesof sampling. The urea content was then estimated in thesame manner.The standard urea solution (1 mg. urea/100 ml.) was
freshly prepared with low conductivity water (<01 Zmho).Each estimation was prepared in duplicate or quadru-
plicate; the standard and blank were estimated inquadruplicate.A Seligson pipette was used for the initial aqueous
dilutions of the blood and plasma. Automatic syringeswere employed for the colour reagents. De-ionized waterwas used throughout (conductivity < 01 ,u mho).
Using this technique on 10 sera estimated in quadru-plicate the standard deviation of difference for individualresults from the quadruplicate means was 0 8 mg. urea!100 ml.The test tubes used in this estimation were thoroughly
washed in detergent and not submitted to chromic acidtreatment. A difference was observed in precision if thelatter was used (S.D. haemosol ± 0 8 mg. urea/100 ml.;S.D. chromic acid ± 2-7 mg. urea/100 ml.).The haematocrit values were determined in quadru-
plicate using calibrated Wintrobe tubes. These werespun for 60 minutes at 3,000 r.p.m. using an M.S.E.haematocrit centrifuge. From the whole blood urea,plasma urea, and packed cell volume the red cell ureamay be simply calculated:
R.B.C. urea whole blood urea 100 P.C.V. x[whole ~~~~100plasma urea)]> 100
P.C.V.As the water content of the red cell is approximately
69% of its volume (Van Slyke, Wu, and McLean, 1923)the theoretical concentration of urea in the red cell waterwill be:
R.B.C. H20 ureared blood cell urea
0-69provided that the urea is in fact all dissolved in red cell
water.
The calculation of red cell water urea magnifies smallerrors in dermination of whole blood and plasma urea,especially at low P.C.V. values. Thus the accuracy of thered cell water urea determination is much lower than thatof plasma and whole blood ureas. For example, at a redcell water urea level of 350 mg./100 ml., a change of lessthan 40 mg./100 ml. is not significant as this is within thelimits of maximum experimental error. Every precautionwas taken to limit any inaccuracy but a difference of1 mg./100 ml. on either the plasma or whole blood ureawill affect the red cell water urea calculation by approxi-mately 4 mg./100 ml. at a P.C.V. of 40%.The method of Fawcett and Scott (1960) is claimed to
have a high degree of specificity for the estimation ofurea in plasma, and it is likely to have a similar specificityfor urea in the red cell method described. Although thiswas not investigated extensively, it was found that nocolour was produced from red cell extracts in the absenceof urease indicating a lack of non-specific colour-producing substances.
CHANGES IN INTRACELLULAR UR-A CONCENTRATION Ifthe amount of urea extracted by haemodialysis is knownit is possible to calculate the change in the urea con-centration of the intracellular fluid from the body weightand the change in plasma urea concentration. In theabsence of direct body fluid measurements on individualpatients it was assumed that the extracellular fluid(ECF) was 15% of the total body weight, that the intra-cellular fluid (ICF) was 420% of the total body weight,and that the plasma water was 94% of the plasma volume(within normal protein concentrations). Although theseapproximations were not exact for each patient they haveallowed assessment of gross changes. In addition, it wasmecessary to assume that the plasma water urea con-centration represented the ECF urea concentration. Thechange in the urea concentration of the intracellular fluidwas calculated as follows:
Let ICF urea concentration = ICLet ICF volume = 1.Let ECF urea concentration = EcLet ECF volume = E,Let plasma water urea concentration = PLet urea extracted by haemodialysis = Bu
and A represents difference of concentrationThen total body urea content ICF content + ECF
content=(Ic I) + (Ec E,)=1(I I,) + (P-E,) .... (1)
If a quantity of urea is extracted by dialysis then:Bu = ICF urea lost + ECF urea lost .... (2)
substituting (I) in (2)Bu = (lv /,,le) + (Ev ^ P)
and A le = Bu -(E LP)
THEORETICAL DIALYSIS CURVE The nomogram of Black-more and Elder (1961) was used to determine theexpected plasma urea levels at two, four, and six hours.A theoretical dialysis curve was constructed from thesefigures.
237
on 29 April 2019 by guest. P
rotected by copyright.http://jcp.bm
j.com/
J Clin P
athol: first published as 10.1136/jcp.16.3.235 on 1 May 1963. D
ownloaded from

Dialysis Parameter'No.
TABLE IIUREA DETERMINATIONS DURING DIALYSES
Dialysis Time ib Hours
0 -1 I 131 2 3 4 5 6
Body Weight Remarks(kg.)
Start Finish
ObstetricL.F. I P.H,O
Ex.R.B.C.sE12°R.B.C.: P
2 P.H2OEx.R.B.C.H20R.B.C.: P
R.J. H. I P.H.0Ex.R.B.C.H2oR.B.C.: P
2 P.H20Ex.R.B.C.H20R.B.C.: P
Chronic Renal FailureL.G. I P.H20
Ex.R.B.C.H20R.B.C.: P
2 P.H20Ex.R.B.C.H20R.B.C.: P
3 P.H20Ex.R.B.C.H20R.B.C.: P
4 P.H20Ex.R.B.C.H20R.B.C.: P
W.W. I P.H20Ex.R.B.C.H20R.B.C.: P
2 P.H2OEx.R.B.C.H20R.B.C.: P
3 P.H20Ex.R.B.C.H20R.B.C.: P
TraumuricC.J. I P.H20
Ex.
P.U. I P.H20Ex.
A.J.M. 1 PH20Ex.
2 P.H20Ex.P.H2OEx.P.H20Ex.
P.H20Ex.
31427 1
450
4200-94
425
4200-99
370
3540-95
450
4460-99
28022-8
26726-1269
1-0
366 32016-9 31-0
420 4131-14 1-29
268 18348 79.3
23241-4
21646-2
16866-6
15282-2
Shr. 10min.
268 235 195 16951-5 69-1 81-2 94-9
318 344 326 1911-18 1-46 1-67 1-13
425 436 416 400 455 4465-6 14-2 31-1 42-2 53-9
1,120 970 1,010 860 690 6052-6 2-2 2-4 2-15 1-5 1-32
482 395 400 4775-1 10-2 21-4
545 440 485 6001-12 1-12 1-22 1-24
554 490 463 428 438 3946-1 13-9 23-8 31-6 44-5
470 490 455 421 383 3800-85 1-0 0-98 0-98 0-88 0-97
505 455 415 370 364 340
589 471 429 400 344 3101-17 1-04 1-03 1-08 0-94 0-91
38690-9450
1-16
30475-9
2640-87
252
2741-08
13598-6189
1-411784-1136
1-16
88100-9141
1-6
68-3 66-95
66-05 64-55
70-9 69-2
67-5 64-9 Dialysis ceased at 5 hr.10 min.
70-65 68-35Dialysis ceased at 4 hr.
67-0 67-0 Dialysis ceased at I hr.,recommenced 1 hr. later
217 67-0103-4211
0-98178 68-3
1891-06
453 383 273 279 269 218 173 147 134 62-911-4 19 39-9 50-3 59-8 80-8 97-5 113-5 124-9
695 2091-53 1-58
470 406 367 308 286 270 205 196 156 139 59-97-9 16-6 31-9 44-9 45-9 66 73-5 86-9 95-5
586 490 472 474 386 326 290 277 248 2171-24 1-21 1-28 1-54 1-35 1-21 1-41 1-41 1-59 1-56
455 293 236 156 104 56-348-5 65-5 90-5 105
372 245 2060-87 0-89 0-93
587 394 328 279 252 193 86-530 60 85 110 129 148
535 430 344 345 331 308 252 213 175 163 57-553-4 13-3 25-1 36-1 49 74-1 85-5 101-5 113-2
510 351 377 303 243 59-45-6 11-5 22-7 27-2
485 356 365 322 329 330 255 224 223 208 59-43-9 11-0 22-5 31-6 42 55-2 74-3 88-4 101-7
620 534 450 340 328 265 57-830-7 66 5 85 104-7 133
479 414 429 379 358 342 240 180 56-14-9 10-3 24 35-5 43-6 75-8 99-6
447 37720-7
29437-7
200 149 54-667 86-4
65-65 This dialysis commencedI hr. following C.G.(2)
66-07 No extraction figuresavailable for this dialysis
61-1
58-9
55-1
84-7
54-65
58-8 Dialysis ceased at 1 hr.15 min., recommenced1 hr. later and was notinvestigated
57-7
57-7
56-6
56-1
At 8 hr. P.H,0 = 240Ex. = 151-5
At 8 hr. P.H20 = 149Ex. = 113-7
At 10 hr. P.H20 = 141Ex. = 127-2
(plasma urea)'P.H20 = plasma water urea in mg./100 ml. 0 94
Ex. = extracted urea in gramsR.B.C.H2o = red cell water urea in mg./100 ml.R.B.C.: P = ratio of red cell water urea to plasma water urea
on 29 April 2019 by guest. P
rotected by copyright.http://jcp.bm
j.com/
J Clin P
athol: first published as 10.1136/jcp.16.3.235 on 1 May 1963. D
ownloaded from

Urea distribution in renal failure
RESULTS
In our earlier paper (Blackmore and Elder, 1961) itwas suggested that the aetiology of the primarycondition preceding renal failure might determinethe proportion of bound urea within the cells. Thecurrent investigation supports this postulate and theresults are therefore grouped according to aetiology.The characteristics of a group are apparent in thefirst dialysis of any patient, and the initial dialysisof one patient from each group is presented graphic-ally. Data of all the patients are presented in theTables.The urea determinations are presented in Table II,
while Table III shows the derived figures of falls inurea concentration in the extracellular and intra-cellular fluids during dialysis. Unfortunately no redcell water studies were made on the traumatic groupof patients as a satisfactory method for this esti-mation had not been established at the time of theiradmission.
OBSTETRIC Figure 1 shows the theoretical dialysisfigures, observed plasma, and red cell water urea
No. of Extracellular Flui
concentrations plotted against time for the initialdialysis of patient R.J.H.Throughout the dialysis the total urea extracted
in the dialysing fluid was slightly less than thatexpected from the product of plasma water urea falland calculated total body water. In all four dialysesexamined in this group similar figures were observed.
Figure 2 shows the fall in plasma water ureaexpressed as extracellular fluid water urea, ureaextracted in the dialysing fluid expressed as mg./100 ml. total body water, and derived fall in intra-cellular fluid water urea in relation to time. It canbe seen that throughout the dialysis the fall in theintracellular fluid urea was less than that of the extra-cellular fluid water urea. This could reasonably beexplained by either a small time lag in intracellularto extracellular fluid urea diffusion, or an over-estimation of total body water in all four dialyses.A time lag in intracellular to extracellular fluid ureadiffusion could also explain the slight fall of plasmawater urea to below the theoretical dialysis curveduring the first hour (see Fig. 1), a drop that cannotbe simply explained by the diluting effect of approxi-mately 1 litre of priming blood. If, however, total
LE IIIDERIVED FALLS IN EXTRACELLULAR AND INTRACELLULAR FLUID UREA
CONCENTRATION DURING DIALYSES
id Water Urea Drop (mg./lOOml.) Intracellular Fluid Water Urea Drop (mg./lOOml.)Dialysis
Dialysis Time in Hours
i i I 1I 2 3 4 5 6
Remarks
Dialysis Time in Hours
i i I 14 2 3 4 5 6
ObstetricL.F.
2
R.J.H. 1
2
Chronic renal failureW.W. 1 70
2 653
136 182 267 315145 193 257 308
103 164 228 2825 hr.10 min.
84 130 182 215 255 281
180 174 184103 162 194 200
162 215
235 280265 274
299
319341351
46 104 184 23531-2 82 151 197
45-1 98 198 242
30 9 65-5
5 hr.10 min.
120 172 201 240
19-2 13 4 132 186 228 2768-8 22-2 71-5 112 114 148 157
129 219
L.G. 1 9 25 -30 -212 87 82 5
3 64 91 126 116 1604 50 90 135 139 165
39
250 337253 327
193 259 308 335
191 190
133 207120 163
96
227 282 322
1 hr.15 min.243
155 230 261170 280 292
44-5 95.5-15-5 4-7 76
153 189
-2-9 14 4 36 5 68-6 98
394
292
176 241
15-3 78 128 161
372 -1-5 31-8
0 17-2277 1*6 32-1355 93
117 185 230
I hr.15 min.14-2
113 140170 249
Dialysis ceasedat 4 hr.
274
276
Dialysis ceasedat 5 hr. 10 min.
TraumaticC.J. I
P.U. I
366264274
A.J.M. 123
137 239 299 25-3 65-5 135 234 313153 247 298 60-5 102 189 311
205 309326 420 Dialysis ceased
at 1 hr. 15 min.
239
5 50 1006 70
on 29 April 2019 by guest. P
rotected by copyright.http://jcp.bm
j.com/
J Clin P
athol: first published as 10.1136/jcp.16.3.235 on 1 May 1963. D
ownloaded from

D. J. Blackmore, W. J. Elder, and C. H. Bowden
400-
00
0
w
a
v
£ Red Wood Cell water urea- - Theoretical dialysis curveo-o Plasma water urea
Time C hours)
FIG. 1. First dialysis (R.J.H., obstetric) showing theore-tical dialysis figures and observed plasma and red cellwater urea concentrations plotted against time.
400
Time C hours)
FIG. 2. First dialysis (R.J.H., obstetric) showing fall inplasma water urea expressed as extracellular fluid waterurea, urea extracted in the dialysing fluid expressed asmg.f100 ml. total body water, and the derived fall inintracellular fluid water urea in relation to time.
body water has been overstimated during thesedialyses correction for this overestimation wouldmake the curves on Fig. 2 for the extracellular andintracellular fluids and extracted urea more nearlycoincide. There is no evidence of a greater amount ofurea within the cells than could be expected fromthe plasma urea levels, and the results are consistentwith urea being freely diffusible from the intra-cellular to extracellular fluids in these patients.Blood studies at the beginning of dialysis showed
a red cell water: plasma water urea ratio approxi-mating to unity. At the end of the dialysis this ratiohad increased. Subsequent dialyses produced similarresults.
CHRONIC RENAL FAILURE Figure 3 shows thetheoretical dialysis figures, observed plasma, and redcell water urea concentrations plotted against timefor the initial dialysis of patient L.G.
It can be seen that the levels of plasma ureadiverged widely from the theoretical dialysis curve.At one and a half and two hours the concentrationof urea in the plasma exceeded that at the beginningof dialysis. This suggested that during this periodthe rate of release of urea from the intracellular to
1200
1100
1000
900-
800-
_E 700-
8
400:) 500-
400-
300-
200-
100-
A
a* Red Blood Cell water urea--. Theoretical dialysis curveo-o Plasma water urea
A
A
1 2 I 4h u
Time C hours)
FIG. 3. First dialysis (L.G., chronic renalfailure) showingtheoretical dialysis figures and observed plasma and redcell water urea concentrations plotted against time.
extracellular fluid was greater than the rate ofclearance from the artificial kidney coil.Blood studies showed that the level of red cell
water urea fell from 1,120 mg./100 ml. to 450 mg./100 ml. during the four-hour period of dialysis.Figure 4 shows the fall in plasma water urea
expressed as extracellular fluid water urea, ureaextracted in the dialysing fluid expressed as mg./100ml. total body water, and the derived fall in intra-cellular fluid water urea related to time.
240
on 29 April 2019 by guest. P
rotected by copyright.http://jcp.bm
j.com/
J Clin P
athol: first published as 10.1136/jcp.16.3.235 on 1 May 1963. D
ownloaded from

Urea distribution in renal failure
a00
CPE
I.C.F. Fall*-.* Extracted Urea0-.* E.C.F Fall
500s-
400-
E09 300-
a 200-
100-
2 Time Chours)
FIG. 4. First dialysis (L.G., chronic renal failure) showingfall in plasma water urea expressed as extracellular fluidwater urea, urea extracted in the dialysing fluid expressedas mg./100 ml. total body water, and the derived fall inintracellular fluid water urea in relation to time.
In the first two dialyses of the patient investigatedthe early stages produced an extracellular fluid ureaconcentration that did not vary greatly from thestarting level. This would indicate that at thebeginning of dialysis the intracellular fluid ureaconcentration in this patient was considerably higherthan that of the extracellular fluid and dialysisproduced a rapid release of this urea from the intra-cellular fluid. Subsequent dialyses showed a gradualreturn to the obstetric pattern.
TRAUMATIC Figure 5 shows the theoretical dialysisfigures, observed plasma, and red cell water ureaconcentrations plotted against time for the seconddialysis of patient A.J.M. This patient has beenpresented graphically in preference to the others ashe alone had a series of dialyses. The first dialysiswas not fully investigated as a break of one andthree quarter hours occurred after 75 minutes.
It can be seen that the level of plasma water ureafell below the theoretical curve during the initialstages of dialysis, crossed at one and a half hours,and then remained at a considerably higher level.The initial fall of plasma water urea greatly exceededthat calculated from dilution with I litre of primingblood. The extracted urea exceeded that calculatedfrom the product of the plasma water urea drop andtotal body water. During the last two hours of dialysisthe plasma water urea fell only 16 mg./l00 ml. but28 g. of urea was extracted within this period.
Figure 6 shows the fall in plasma water ureaexpressed as extracellular fluid water urea, ureaextracted in the dialysing fluid expressed as mg./100 ml. total body water, and the derived fall inintracellular fluid water urea in relation to time.
It can be seen that during the first half hour of thedialysis the calculated intracellular fluid urea con-
t ~~~o-o Plalsma water urea
\X~~~- -- Theoretical dialysis curve~~~~~~2 3 4 5 h
Time C hours)
FIG. 5. Second dialysis (A.J.M., traumatic) showingtheoretical dialysis figures and observed plasma and redcell water urea concentrations plotted against time.
4001 a- I.C.F Fall*--- Extracted Ureae*-. E.C.F. Fall
3 4Time C hours)
FIG. 6. Second dialysis (A.J.M., traumatic) showing fallin plasma water urea expressed as extracellular fluid waterurea, urea extracted in the dialysing fluid expressed asmg./100 ml. total body water, and the derived fall inintracellular water urea in relation to time.
centration remained constant. This was observed inthe first dialysis of all three injured patients studied.Following the static period it would appear thaturea movement from intracellular to extracellularfluid began suddenly and was reflected by theflattening of the extracellular fluid urea curve. It isalso evident that this sudden liberation of intra-cellular fluid urea was not of sufficient rapidity tocause the plasma water urea to rise significantly aswas observed in chronic renal failure.
In subsequent dialyses the fall in plasma waterurea progressively resembled the obstetric patternbut with a consistently higher urea extraction. Itwould therefore appear that this patient tended tomaintain a higher concentration of intracellularfluid water urea than was apparent from plasmawater urea studies during the entire period of
l~~~~~
241
on 29 April 2019 by guest. P
rotected by copyright.http://jcp.bm
j.com/
J Clin P
athol: first published as 10.1136/jcp.16.3.235 on 1 May 1963. D
ownloaded from
D. J. Blackmore, W. J. Elder, and C. H. Bowden
TABLE IVSUMMARY OF OBSERVED PAT1rERNS OF DIALYSIS
Dialysis Efficiency Pre-dialysis Intracellular Fluid Urea Drop' Observed Plasma Urea' Extracted Urea3No. Index Ratio of by Dialysis
Red Cell: 0-30 min. 30-60 min. 60-120 min. At 30 min. At 60 min. At 120 min.Plasma Urea
Any Good Approxi- Slowermately unity
Same Same Lower Lower Same Slightly reduced
Chronic renal Firstfailure (2 cases)
Usually Usuallyvery poor very high
Faster Much Faster tofaster same
Higher Higher Muchhigher
Subsequent Usually Decreasesimproves
Approaches obstetric pattern
Traumatic(3 cases)
First Usually Figures not Nilpoor available
Nil to much Fasterslower
Muchlower
Subsequent Improves Figures not Approaches obstetric patternavailable
'With respect to plasma urea fall.'As compared with the fall predicted from the known efficiency of the coil.3Compared with that expected from product of total body water and plasma water urea fall.
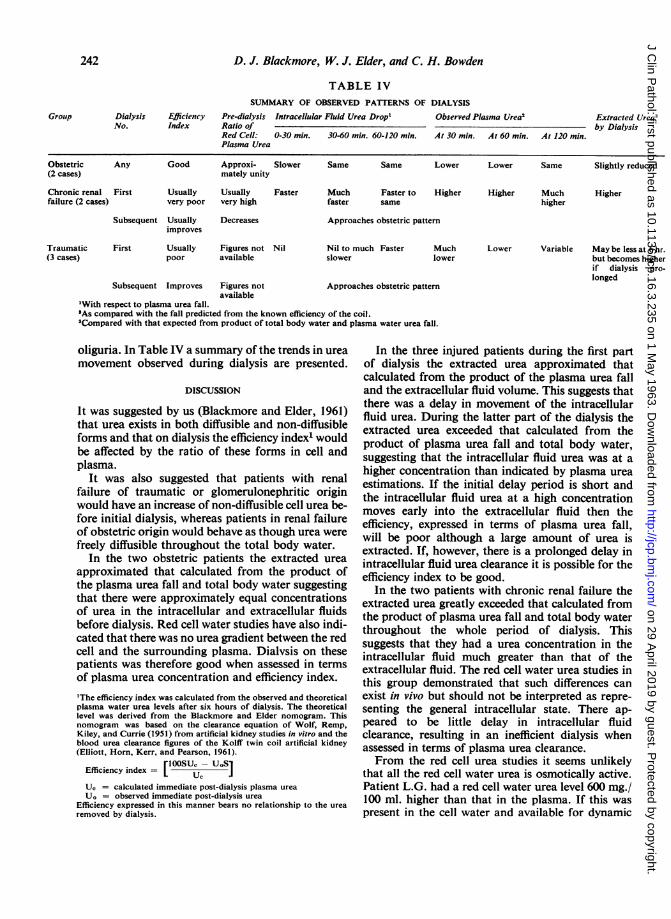
oliguria. In Table IV a summary of the trends in ureamovement observed during dialysis are presented.
DISCUSSION
It was suggested by us (Blackmore and Elder, 1961)that urea exists in both diffusible and non-diffusibleforms and that on dialysis the efficiency index' wouldbe affected by the ratio of these forms in cell andplasma.
It was also suggested that patients with renalfailure of traumatic or glomerulonephritic originwould have an increase of non-diffusible cell urea be-fore initial dialysis, whereas patients in renal failureof obstetric origin would behave as though urea werefreely diffusible throughout the total body water.
In the two obstetric patients the extracted ureaapproximated that calculated from the product ofthe plasma urea fall and total body water suggestingthat there were approximately equal concentrationsof urea in the intracellular and extracellular fluidsbefore dialysis. Red cell water studies have also indi-cated that there was no urea gradient between the redcell and the surrounding plasma. Dialvsis on thesepatients was therefore good when assessed in termsof plasma urea concentration and efficiency index.
'The efficiency index was calculated from the observed and theoreticalplasma water urea levels after six hours of dialysis. The theoreticallevel was derived from the Blackmore and Elder nomogram. Thisnomogram was based on the clearance equation of Wolf, Remp,Kiley, and Currie (1951) from artificial kidney studies in vitro and theblood urea clearance figures of the Kolff twin coil artificial kidney(Elliott, Horn, Kerr, and Pearson, 1961).
rlOOSUc- uosEfficiency index = L uc
Uc = calculated immediate post-dialysis plasma urea
UO = observed immediate post-dialysis urea
Efficiency expressed in this manner bears no relationship to the urearemoved by dialysis.
Lower Variable May be less at 6 hr.but becomes higherif dialysis pro-
longed
In the three injured patients during the first partof dialysis the extracted urea approximated thatcalculated from the product of the plasma urea falland the extracellular fluid volume. This suggests thatthere was a delay in movement of the intracellularfluid urea. During the latter part of the dialysis theextracted urea exceeded that calculated from theproduct of plasma urea fall and total body water,suggesting that the intracellalar fluid urea was at ahigher concentration than indicated by plasma urea
estimations. If the initial delay period is short andthe intracellular fluid urea at a high concentrationmoves early into the extracellular fluid then theefficiency, expressed in terms of plasma urea fall,will be poor although a large amount of urea isextracted. If, however, there is a prolonged delay inintracellular fluid urea clearance it is possible for theefficiency index to be good.
In the two patients with chronic renal failure theextracted urea greatly exceeded that calculated fromthe product of plasma urea fall and total body waterthroughout the whole period of dialysis. Thissuggests that they had a urea concentration in theintracellular fluid much greater than that of theextracellular fluid. The red cell water urea studies inthis group demonstrated that such differences canexist in vivo but should not be interpreted as repre-senting the general intracellular state. There ap-peared to be little delay in intracellular fluidclearance, resulting in an inefficient dialysis whenassessed in terms of plasma urea clearance.From the red cell urea studies it seems unlikely
that all the red cell water urea is osmotically active.Patient L.G. had a red cell water urea level 600 mg./100 ml. higher than that in the plasma. If this waspresent in the cell water and available for dynamic
Group
Obstetric(2 cases)
Higher
242
on 29 April 2019 by guest. P
rotected by copyright.http://jcp.bm
j.com/
J Clin P
athol: first published as 10.1136/jcp.16.3.235 on 1 May 1963. D
ownloaded from

Urea distribution in renal failure
equilibrium an osmotic gradient of 100 m. osmolswould have existed. A maintained osmotic gradientof this magnitude in circulating red blood cellswould probably have caused distortion and lysis.No evidence of this process was found on bloodsmears or in plasma. Therefore it would appear thatthe urea was probably bound within the cell andbecame available for diffusion following clearance ofthe existing cell water urea. Assuming that the ureacan be bound within the cell it is m.ost likely that it isbound to the cellular proteins. Urea has been shownto combine with plasma albumin (Huggins, Tapley,and Jensen, 1951), heme (Burk and Greenberg, 1930),albumin and globulin (Pasynskii and Chernyak,1950), haemoglobin and albumin (Murdaugh andDoyle, 1961), and sodium deoxyribonucleate (Ruffo,Santamaria, and Mattace-Raso, 1955).The differences in intracellular urea binding
observed within the groups probably result fromvariation in the intracellular metabolic states whichcan be corrected by dialysis. Theil, Brodine, andDoolan (1961) in a study on red blood cells haveshown a significant decrease of glutathione contentand diminished stability to acetylphenylhydrazinein patients with acute uraemia and a significantlowering of glutathione stability in patients withchronic renal disease when compared with 15 normalsubjects. They also found that the red blood cellglucose-6-phosphate dehydrogenase activity wassignificantly greater in these patients.The term 'efficiency index' was introduced during
the previous analysis of 60 dialyses. It enabled acomparison to be made between the urea clearancecharacteristics in vitro of the artificial kidney anddialyses on patients. The results revealed the strikingdifference between patients in the various aetio-logical groups. Our further studies show that tomeasure the efficiency of a six-hour dialysis in termsof plasma urea fall can be misleading, due to thevariation in intracellular urea levels and the time atwhich urea moves freely during the dialysis. It isnow apparent that a more reasonable assessment ofdialysis efficiency would be given by the quantity ofurea removed by dialysis. As can be seen the ureaextraction can increase considerably whilst theplasma urea remains relatively constant.The optimum duration of dialysis with the Kolff
twin coil artificial kidney has been generally acceptedas six hours. By this time the patient is usually verytired, often exhausted, and longer dialysis has pro-duced relatively little further change in plasma urea.Within this time electrolyte, water, and acid-baseimbalance are generally corrected. We have dialysedpatients for eight, 10, and 12 bours and have noted
significant clinical improvement. In each instanceat six hours the patient has been very tired andrestless. As the dialyses were extended the patientsbecame less tired, more alert and cooperative, andhave appeared much improved in their general state.Table II shows the plasma and extracted ureafigures during two prolonged dialyses (A.J.M. (3)and (5)). The extracted urea greatly exceeded thatcalculated from the plasma urea fall during the latterpart of these dialyses suggesting that urea was stillbeing removed from the intracellular fluid; thisfurther emphasizes the need to assess the efficiencyof dialysis in terms of urea extraction and not byplasma urea levels.The present study suggests that the intracellular
urea state is subject to wide variations which differwith aetiology. The plasma urea level does not givea reliable indication of the patient's state withrespect to total body urea content, and the fall ofplasma urea during dialysis is an unsatisfactoryguide to the efficiency of dialysis.We conclude that research should be directed to
variations of intracellular metabolism in renalfailure before a more rational approach can bemade in its management.
We wish to thank Air Commodores W. P. Stamm andR. C. Jackson and Group Captain R. Mortimer for theirhelp and encouragement. We are also very grateful toDr. A. M. Joekes for his advice.We have much appreciated the assistance of the staffs
of the Renal Unit and the Biochemistry Department ofthe R.A.F. Institute of Pathology and Tropical Medicine,in particular Junior Technician A. E. McLachlan.We wish to thank the Director General of Medical
Services for permission to publish.
REFERENCES
Blackmore, D. J., and Elder, W. J. (1961). J. clin. Path., 14, 455.Brennand, R., and Bunker, N. V. (1960). Lancet, 1, 578.Burk, N. F., and Greenberg, D. M. (1930). J. biol. Chem., 87, 197.EHliott, W., Horn, D. B., Kerr, D. N. S., and Pearson, D. T. (1961).
Lancet, 1, 248.Fawcett, J. K., and Scott, J. E. (1960). J. clin. Path., 13, 156.Huggins, C., Tapley, D. F., and Jensen, E. V. (1951). Nature (Lond.),
167, 592.Murdaugh, H. V. Jr., and Doyle, E. M. (1961). J. Lab. clin. Med.,
57, 759.Pasynskii, A. G., and Chernyak, R. S. (1950). Dokl. Acad. Nauk
SSSR, 73, 771.Ruffo, A., Santamaria, R., and Mattace-Raso, F. (1955). Boll. Soc.
Ital. Biol. sper., 31, 1381.Theil, G. B., Brodine, C. E., and Doolan, P. D. (1%1). J. Lab. clin.
Med., 58, 736.Van Slyke, D. D., Wu, H., and McLean, F. C. (1923). J. biol. Chem.,
56, 765.Wolf, A. V., Remp, D. G., Kiley, J. E., and Currie, G. D. (1951).
J. clin. Invest., 30, 1062.Shackman, R., Chisholm, G. D., Holden, Angela J., and Pigott, R. W.
(1962). Brit. Med. J., 2, 355.
243
on 29 April 2019 by guest. P
rotected by copyright.http://jcp.bm
j.com/
J Clin P
athol: first published as 10.1136/jcp.16.3.235 on 1 May 1963. D
ownloaded from