urban transport challenge - ipa
TRANSCRIPT

Urban Transport Challenge:DRIVING REFORM ON SYDNEY’S ROADS

I
Infrastructure Partnerships Australia
8th Floor 8-10 Loftus Street Sydney NSW 2000T +61 2 9240 2050 F +61 2 9240 2055www.infrastructure.org.au
For more information please contact:
Brendan LyonExecutive Director Infrastructure Partnerships Australia PO Box R 1804, Royal Exchange,Sydney NSW 1225T +61 2 9240 2050E [email protected]
Peter ColacinoNational Manager - PolicyInfrastructure Partnerships AustraliaPO Box R 1804, Royal Exchange,Sydney NSW 1225T +61 2 9240 2050E [email protected]

II

III
Contents
Executive Summary V
Recommendations VII
1 Introduction 1
2 Sydney’s Road Network 3
2.1 Sydney’s Changing Road Network 3
2.2 The Unfinished Network – the ‘Missing Links’ 9
3 The Case for Change 11
3.1 Drivers of Demand 11
3.2 The Cost of Congestion 15
3.3 So, is the Current System Broken? 21
3.4 Why Hasn’t it Been Fixed? 22
3.5 How Can the Road System be Fixed 24
4 The Use of Tolls to Optimise Utilisation 27
4.1 Achieving Operational Harmonisation 27
4.2 The Process for Toll Setting in Sydney 27
4.3 How Can the Tolling Regime be More Efficient? 29
4.4 Use of Network Tolling to Promote New Investment 32
5 A New Model for Tolling 33
5.1 Models for Tolling 33
5.2 Types of Variable Road Toll 35
IV
6 Principles for Introducing Network Tolling 39
6.1 The Relevance of the Road Hierarchy 39
6.2 Principles of Traffic Flow & Optimising Asset Use 39
6.3 Reducing User Costs & Responses to Road Pricing 41
6.4 Price Elasticity of Demand 42
6.5 Creating a Network within a Network 43
7 Barriers to Implementing Network-Wide Pricing 45
7.1 Barriers to Greater Network Harmonisation 45
7.2 Equity Concerns of Users and Communities 45
7.3 Risks to Operators from Changing Commercial Agreements 50
7.4 Complexity of the Traffic Model 56
8 The Way Forward – A Practical Option for Sydney 59
8.1 Provide a Basis for Integration in Future Contracts 59
8.2 Remove Existing Toll Refund Schemes 61
8.3 Renegotiate Existing Concession Agreements 62
8.4 Introduction of Network Tolling 62
9 Conclusion 63
Appendices 65
Appendix A : Background to Sydney Toll Roads 65

V
Executive Summary
Urban congestion is one of the greatest challenges facing Australia. The solution will require a new approach which includes better demand management and significant, sustained and targeted investment in new transport links.
Roads will always be the fundamental backbone of urban transport networks. Roads are critical to the movement of freight and passengers and underpin economic growth and social connectedness. And roads are not only for private vehicles. Roughly half of Sydney’s urban public transport is conducted on roads.
Each day freight, passenger and public transport vehicles travel over 120 million kilometres within the greater Sydney area. Passenger kilometres travelled in Sydney will soar by a further 38 per cent by 2020 – the third highest growth across all capital cities, behind Brisbane (46 per cent) and Darwin (40 per cent).
Australia has recently embarked upon a welcome debate about the role of a national road pricing scheme in funding infrastructure and shaping demand for limited road space. While this debate is welcome, such significant reform is likely to be a long-term proposition - while Sydney faces spiralling congestion which requires immediate action.
The time has now come for debate about the use of tolls to help manage demand across the Sydney Motorway Network. Under a variable tolling model, the price is increased to shape demand during peaks and reduced to stimulate demand when traffic on the network is low.
The Sydney Motorway Network is already the most advanced road network in the country. It forms the arteries of the State’s economy; and provides a vital link for inter and intra state journeys. Analysts recently estimated the corridor has an economic value of $22.7 billion and contributes more than $2 billion to the New South Wales economy each year.
Even as Sydney begins to grapple with its urban transport challenge, the cost of congestion continues to mount, already exceeding $4 billion per annum. The lack of cohesion between road segments across the network contributes to perceptions of inequity, with motorists in some regions reimbursed road charges by taxpayers, while others pay relative high daily tolls, because they travel across several segments.
Under a customer service model, motorists would be charged a floating toll, pegged to the number of vehicles using the network. It would see a reduction of tolls during quiet periods of low demand, and increased charges at times of high demand.
The various segments of the network would be integrated into a single pricing system that would be set at a rate to ensure the most efficient use of the network at all times, maintaining traffic at optimal levels. This new, integrated pricing model would greatly improve the efficiency and effectiveness of this infrastructure for commuters and businesses alike.

VI
The use of demand management will be critical in ensuring efficient use of Sydney’s road space, which is a finite resource. Pricing is used effectively in other infrastructure classes, such as electricity and water. Of course, to ensure Sydney’s transport network is effective over the longer term, demand management must be accompanied by renewed investment in critical, priority infrastructure.
The application of a network toll, including its extension to currently untolled sections of the Sydney Motorway Network, could provide a valuable source of additional revenue for investment in new infrastructure. This tolling model could provide public investment to seed the development of new road and public transport options, as the city grows and demand increases.
Despite the underlying need and inherent value of tolling reform, it is critical that any change is progressed by consensus and agreement between government and motorway investors. Any move to reform the Network would need to be predicated on the protection of the legitimate commercial interests of existing concessions - and take account of potential new costs and risks posed by bold reform.
This paper proposes a revenue-sharing approach, which ensures existing concession holders are no worse off than under current arrangements.
Over the longer term, Australia will consider the introduction of a broad-based national road pricing system. The introduction of a national road pricing scheme would present a platform for the efficient regulation of infrastructure use, as well as a source for government revenue.
Critical to the development of a national road pricing system would be thorough consideration of the interaction of such a scheme with established motorways across urban Australia - including those which comprise the Sydney Motorway Network.
The implementation of such a large and complex scheme, as outlined by Treasury Secretary Ken Henry, could take many years to consider and implement. The introduction of a network toll for the Sydney Motorway Network provides a complementary strategy to drive more efficient use of infrastructure in Sydney in the shorter term.
It is clear that Sydney can - through considered reform - drive better efficiency across its motorway network.
This paper considers the fundamental principles for the development of a new system of tolling that provides improved equity and efficiency across the Sydney Motorway Network. This model could also facilitate improved transport infrastructure to meet Sydney’s urban transport challenge.
Sydney would benefit from a new model which allows the Sydney Motorway Network to operate as under a single tolling structure. A fully flexible network toll is desirable; however the complexity of implementation should not be underestimated.
The principle recommendation of this paper is that the New South Wales Government and motorway operators consider and agree to implement a variable, time of day tolling system for Sydney’s various motorways.
In the medium term, to support a more efficient and equitable road network, this paper recommends:
1 The New South Wales Government commits to a customer service focused model of tolling on the Sydney Motorway Network.
Government, in partnership with industry, must agree to a framework of guiding principles to govern a network toll. Principle aims of the new network tolling regime should include:
• thealleviationofcongestionacrosstheSydneyMotorwayNetwork.
• deliveringtraveltimereliabilityandpredictabilitytousersofthe Network.
Recommendations
VII

• thehypothecationofsurplusrevenueforthedevelopmentof public transport and road infrastructure to accommodate growth in demand.
• maintainingappropriatelevelsofreturnformotorwayowners,reflective of the commercial terms of existing concession agreements and new risks that may emerge as a result of any new tolling arrangement (e.g. increased revenue leakage and costs of establishing the network).
2 Government, industry and the community must work together to examine the implementation of customer service focused network tolling for the Sydney Motorway Network, potentially based on the implementation of a fully dynamic toll.
As an initial step, the New South Wales Roads and Traffic Authority (RTA) should form a working group, incorporating motorway owners and operators, to investigate a practical process of implementation.
3 The New South Wales Government must prepare and commit to a detailed implementation strategy, incorporating key milestones and stages to ensure smooth transition to the new scheme.
A network toll must integrate with the long-term transport plan for the Sydney region, including staging and the direction of investment of additional network toll revenue to priority public transport and road projects.
4 Implementation of reforms to the tolling arrangements must be accompanied by a community awareness campaign, outlining the proposed changes to the New South Wales community. The New South Wales Government should undertake this campaign in partnership with motorway owners and operators, together with consumer groups.
VIII

IX

1
1. Introduction
Sydney is Australia’s key economic hub. The city accommodates around a quarter of Australia’s population and delivers 25 per cent of Australia’s gross domestic product. Sydney’s economy is twice the size of New Zealand’s and equal to Asia’s major city states like Hong Kong and Singapore.
Successive governments have delivered ambitious transport plans, yet a range of key projects that should constitute the transport spine of Australia’s most economically significant city remain unbuilt.
The failure to match population and economic growth to the development of transport infrastructure now leaves Sydney facing rapidly increasing congestion, impacting social and economic outcomes and the environment.
Since the completion of the Sydney Harbour Bridge in 1932, daily patronage has increased from 10,000 crossings per day to more than 160,000. To accommodate demand additional lanes have been added, the Harbour Tunnel commissioned and tolling technologies have advanced to allow free flow, time of day tolls. Despite these and other changes, demand for the limited road space on the Bridge has hit saturation; and travel times have become longer, more unpredictable and more stressful. In short, the very objective of the project – creating an effective link between the CBD and North Sydney – has become compromised.
This is not unique to the Harbour Bridge; several of Sydney’s roads including the Eastern Distributor, M4 Western Motorway, the M5 East, M5 South Western Motorway and the Hills M2 regularly exceed capacity during peaks.
Restoring Sydney’s mobility presents two seemingly simple, yet interlinked options: the construction of additional capacity and better use of existing road space.
There is relative consensus about the need for new road projects. Industry, motorist and community groups have long campaigned for progress on major road projects including:
• theM4East;
• F3-SydneyOrbitalLink,
• F6Extension;and
• SpitBridgealternative.
2
But Sydney cannot increase capacity infinitely. Bottlenecks like the CBD and harbour crossings where there is little opportunity for network expansion or expansion would be at a prohibitively high cost, present substantial physical barriers to the capacity enhancement approach.
The time has come for debate about the use of tolls to manage demand across the Sydney road network. Under a variable tolling model, the price is increased to shape demand during peaks and reduced to stimulate demand when there are less vehicles using the network. One model is to do this in discrete, predictable peak and off-peak tranches. Another is a dynamic model where the focus is directed at guaranteeing a quality of service.
The New South Wales Government recently applied a time of day based system on Sydney’s harbour crossings. This modest experiment shows that tolls can provide an effective price signal to road users, leading to ‘smoothing’ of demand peaks by encouraging the increased use of excess capacity during quiet periods
This paper considers the application of a system of road pricing to the Sydney Motorway Network that gives greater regard to the value that individual users place on accessing a reliable road network. The system of pricing discussed in the paper provides an alternative to the existing approach, which uses tolls to recover the costs of the construction and maintenance of the network.
Adopting a network approach to tolling could allow cost-effective completion and expansion of the Network, and improve the effectiveness of Sydney’s public road network. The network model would:
• settollswiththeobjectiveofkeepingdemandatanoptimallevel
• providecertainty,reliabilityandpredictabilityoftraveltime
• allowthecollectionofadditionalrevenuetobeusedforthedevelopmentofpriorityinfrastructure.
Road tolls are regulated through complex and rigid contracts and the re-negotiation of these contracts would be necessary to allow Sydney’s motorways to operate as a network.
This paper proposes a revenue sharing approach which protects the commercial interests of concession holders, while using network tolling to optimise utilisation and generate additional revenues that would be invested in developing new public transport and completion of the network.

3
2. Sydney’s Road Network
2.1 Sydney’s Changing Road Network
2.1.1 The Early Road Network
Sydney’s earliest road network developed organically following ridgelines or the path of least resistance. The arrival of Governor Lachlan Macquarie in 1810 led to the first focus on developing a planned transport network. One of Macquarie’s earliest reforms was the assignment of street names, widening and realignment of major thoroughfares and the removal of surplus streets.
Tolls also have a long history in New South Wales.
The first toll bridge was constructed in 1802 over South Creek in Windsor by a private citizen, Andrew Thompson, who financed its construction and maintenance in return for the right to collect a toll for the use of the bridge over a 14-year period. This arrangement in effect marked the first private sector contribution to Sydney’s road estate.
In 1810, James Harper was contracted to build a tolled road from Sydney’s George Street to connect to the bridge at Windsor. This road featured toll gates at Windsor, Rouse Hill and Parramatta and in effect, created a network of toll roads.
By 1877, both the colony and various municipalities levied tolls to assist in the maintenance of the road network. Various tollbars were constructed and operated on public roads across Sydney in places including:
• OxfordSt,BondiJunction
• BronteRd,Waverley
• AnzacParade,Randwick
• HydePark,Sydney
• BunnerongRoad,Kingsford
• AnzacParade,MoorePark
• A’BeckettCreek,Parramatta
• RushcuttersBay
• BarrackHill;and
• RouseHill
The colony’s tolling system ended in 1877, driven in large part by the arrival of the steam tram. The introduction and expansion of the tram network resulted in such a dramatic reduction in traffic volumes that the collection of tolls became costly and inefficient.
4
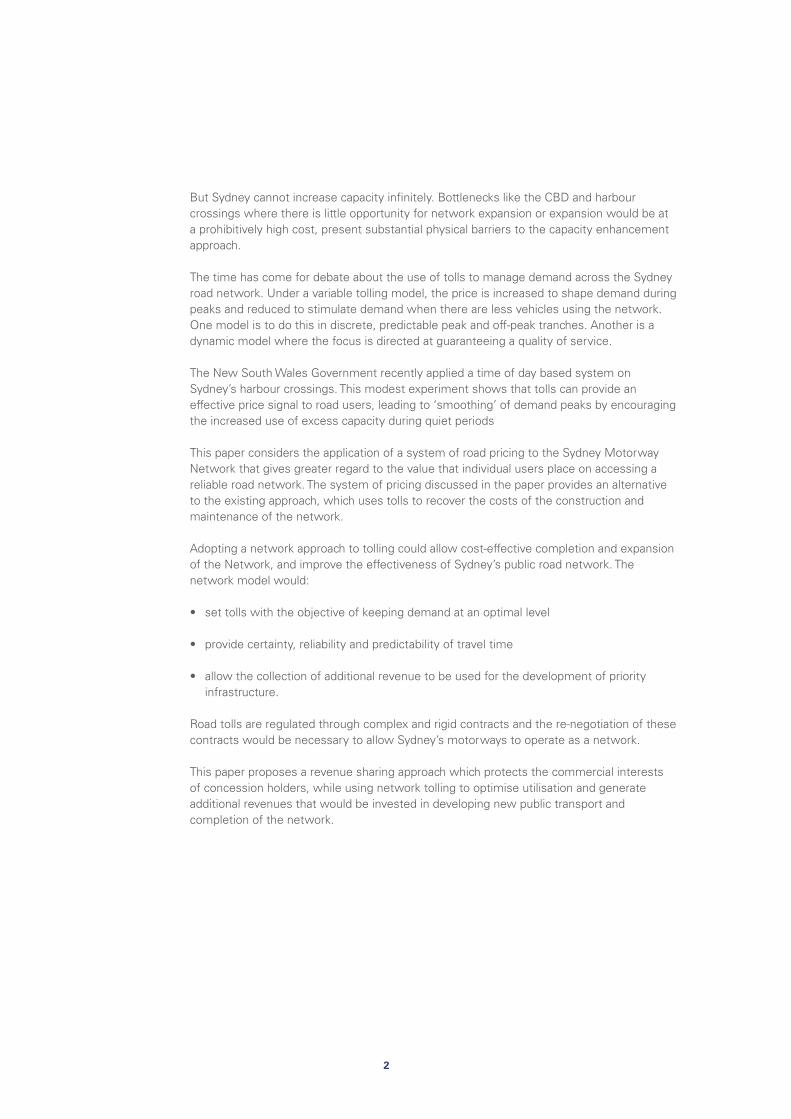
2.1.2 The Modern Road Network
Sydney’s modern road network was laid out in the 1951 County of Cumberland Plan. This Plan integrated previous planning documents and instruments to deliver a master plan for greater Sydney. The plan mapped out an evolved system of radial motorways and inner city distributors, allowing road users to either bypass or access the CBD as required.
Over the proceeding half-century, the Cumberland Plan was adapted, appended and amended on at least six occasions, forming the basis of ‘new’ transport plans for Sydney. The most recent example is the 2006 Urban Transport Statement. In spite of these amendments, the majority of the plan’s fundamental links have now been delivered and form the basis of the Sydney Motorway Network.
The plan’s strategic reservation of transport corridors for future development has been of significant importance to the successful completion of the Cumberland Plan over the longer term.
Figure 1
The Road Network of the County of Cumberland PlanSource: The County of Cumberland Council (1956)
Sydney
Parramatta
Hurstville
Liverpool
Blacktown
Bankstown
Chatswood
Bondi JunctionBurwood
Hornsby
Freeways
Major Arterials

5
By the early 1980s, the need for new connections to service growth in Sydney’s south, west and north-west became apparent. The 1987 Roads 2000 plan mapped the development of an orbital road corridor for Sydney. A fundamental aspect of the plan was the creation of a circular ring of motorways, the Orbital Network, bisected by an east-west corridor. The Orbital Network formed a logical solution to the challenges posed by a radial road network, allowing for the movement of goods and people between suburban and metropolitan centres.
2.1.3 Beyond the Orbital Network
The Roads 2000 plan has largely been completed principally due to the delivery of these assets through privately financed toll roads. The Sydney Harbour Bridge and untolled sections of the network are publicly owned and operated, with the remainder developed on Crown land under long-term concessions by the private sector through Public Private Partnerships (PPP). These PPP motorways have played a critical role in reducing travel times and alleviating congestion in Australia’s most heavily populated city.
The resulting Orbital Network is comprised of a series of linked bridges, tunnels, toll roads and freeways. The network provides a motorway-grade, free-flowing road network circumnavigating the city’s densely populated inner-west.
Figure 2
Sydney Orbital and East-West Corridor Motorways NetworksSource: NSW Roads and Traffic Authority (2009)
Sydney’s Orbital Motorway Network
Other Motorways/Freeways
East - West Corridor
Major Arterials
Liverpool
Parramatta
M5
M4
M2
Sydney Harbour Bridge and Tunnel
Cross City Tunnel
Eastern Distributor
M5 East
Lane CoveTunnel
Hume Highway
Westlink M7
F3 Freeway
Blacktown
Bankstown
Hurstville
Burwood
Chatswood
Bondi Junction
North Sydney
Sydney
Hornsby
Castle Hill
Epping
Rockdale
Ryde

6
Table 1
The Constituent Motorways of the Sydney Orbital Network
ROAD OWNER/CONCESSIONAIRE TOLL
Sydney Harbour Bridge (Bradfield Highway) New South Wales Government Yes
Sydney Harbour Tunnel Private Sector (Sydney Harbour Tunnel Company) Yes
Cahill Expressway New South Wales Government No
The Eastern Distributor Private Sector (Airport Motorways Limited) Yes
Southern Cross Drive New South Wales Government No
General Holmes Drive New South Wales Government No
M5 East Tunnel New South Wales Government No
M5 South-Western Motorway Private Sector (Interlink Roads) Yes
Westlink M7 Private Sector (Westlink M7) Yes
Hills M2 Private Sector (Hills M2 Motorway) Yes
Lane Cove Tunnel Private Sector (Connector Motorways) Yes
Warringah Freeway New South Wales Government No
Gore Hill Freeway New South Wales Government No
Falcon Street Gateway* Private Sector (Connector Motorways) Yes
*Falcon Street Gateway is a tolled ramp linking the untolled Warringah Freeway to the neighbouring road network.
The Orbital is bisected by the east-west corridor, which links Sydney’s eastern suburbs and CBD to Parramatta and Penrith in the city’s far-west. The corridor is comprised of a number of publicly and privately owned roads, several of which are tolled. This corridor remains incomplete and does not offer motorway conditions for its entire length, notably through the absence of the long-planned M4 East Motorway. Both the M4 Motorway and the Cross City Tunnel are direct feeders into the Orbital Network.
Table 2
The Constituent Motorways and Roads of the Sydney East-West Corridor
ROAD OWNER/CONCESSIONAIRE TOLL
New South Head Road New South Wales Government No
Cross City Tunnel Private Sector (CCT Motorway Group) Yes
The Western Distributor New South Wales Government No
Victoria Road New South Wales Government No
City West Link New South Wales Government No
Wattle Street New South Wales Government No
Parramatta Road New South Wales Government No
M4 – Western Motorway Private Sector (Statewide Roads) Yes
F4 – Western Motorway New South Wales Government No

7
The Orbital Network and the east-west corridor together constitute the Sydney Motorway Network. The Motorway Network is the principle high capacity urban corridor within metropolitan Sydney, however, the corridor remains incomplete with the sections of the east-west corridor between Strathfield and the CBD below motorway grade.
The driving conditions on the corridor, particularly the high number of intersections – approximately 80 within 12 kilometres – are not conducive to the application of a corridor-specific toll utilising the established electronic tag arrangements.
Subsequently until such a time that full motorway conditions are extended to this corridor, potentially through the completion of the M4 East or a similar project, this corridor should remain untolled. The application of new network tolling arrangements for the Sydney Motorway Network should not apply to this segment of the corridor until such time that a motorway grade solution for the corridor is completed.
2.1.4 The Role of the Private Sector
Throughout the past two decades, New South Wales has led the world in the use of PPPs to deliver motorway projects. Central to this success has been bipartisan support for innovative private financing funded by ‘user-pays’ models.
The ability to harness private investment in public infrastructure has allowed complex motorway projects to be delivered decades ahead of the limited capacity of the New South Wales Government balance sheet. The continuing involvement of the private sector in the operation of the Network is desirable and indeed a certainty, with current concessions for assets on the Network ranging from less than one to more than 38 years.
Table 3
Concession Contract Periods on the Sydney Motorway NetworkSource: NSW Roads and Traffic Authority (2009)
SHT M4 M5 M2 ED CCT M7 LCT
Concession start year 1987 1992 1992 1997 1999 2005 2005 2007
Cost (m) $750 $246 $380 $644 $700 $680 $1,540 $1,142
Concession end year 2022 2010 2023 2042 2048 2035 2037 2037
Concession period (years) 35 18 31 45 49 30 31 30
The delivery of the Sydney Harbour Tunnel in 1987 marked an important shift toward private sector involvement in Sydney’s road projects. The Tunnel was proposed by an unsolicited bid and delivered under a Build Own Operate Transfer (BOOT) model. Under the terms of the concession, the private sector assumed project risk. The State Government placed a floor under patronage risk through a revenue stream agreement, which sees tolls from the Harbour Bridge support revenue for the Tunnel.

8
PPPs have been used to deliver eight motorways and tunnel projects in Sydney. These projects account for some 161 kilometres of roadway, representing almost one per cent of the State Government’s total road network.
The majority of Sydney motorway PPPs have been successful. The use of private finance ensured early project delivery; but has also secured innovation in construction, operation and design. Private innovation has delivered sustainable design, which incorporates the provision of cycling and public transport facilities, as well as the development and use of electronic tolling.
The use of PPPs has also been critical in securing community and government support for projects, such as Westlink M7. The project was jointly funded by the private sector, the New South Wales and Commonwealth Governments and has been strongly supported by the local community throughout its construction and operation. That road has played a critical role in economic development in adjoining areas, including the development of transport and logistics industries around Eastern Creek.
The first of Sydney’s modern PPPs is due to expire in 2010 when the M4 Western Motorway will be returned to State Government ownership.
In a report released in October 2009, the New South Wales Auditor General found the good management and goodwill of the concession holders had ensured the asset would be handed back to taxpayers in good condition.
However, the Auditor-General warned if the handback of the motorway was accompanied by removal of the toll, more motorists would want to use the corridor than capacity would allow - leading to significant congestion. Obviously, retention of the M4 toll to manage demand along the corridor is the only sensible option. In any case, the return of the Motorway and removal of the toll by the NSW Government may provide a useful case study of the effect of price signals in managing demand and may assist the public debate over tolling reform across the entire network.
The PPP model has evolved considerably from the collared risk model used to procure the Sydney Harbour Tunnel. Fiscal reforms and debt stabilisation programs like the General Government Debt Elimination Act (1995) and the Fiscal Responsibility Act (2005) led to a focus on procuring roads at no cost to government. This approach ended with the release of the Review of Future Provision of Motorways in New South Wales report, known as the Richmond Review, following the collapse of the initial Cross City Tunnel concessionaire.
The well-publicised failure of projects like the Cross City Tunnel holds lessons for investors and government alike. However, in spite of public controversy, such projects also show the value of risk transfer gained through a PPP model. The use of a PPP protected taxpayers from the impact of overly optimistic patronage forecasts. Rather, it was private investors who lost equity when the project failed, while taxpayers have enjoyed continued access to a world-class road tunnel, under the same terms laid out in the contract.

9
2.2 The Unfinished Network – the ‘Missing Links’
In spite of the successful delivery of large sections of the Orbital Network, significant missing links remain across Sydney’s road network. The completion of the Lane Cove Tunnel in 2007 completed the fundamental sections of the Sydney Orbital Network – but key feeder corridors remain incomplete. These include:
• The M4 East: completes the east-west corridor from the Blue Mountains to the eastern suburbs. Current planning sees this also incorporating a link to the airport and port precinct at Botany.
• The F3-Orbital Link: joins the F3 Freeway to the Hills M2 and/or Westlink M7.
• The F6/M6 Extension: connects the M5 to the southern suburbs and Illawarra.
The growth in population and economic activity in the Sydney basin means the completion of these missing links is a national priority. The economic, environmental and social dividends of a complete, functional motorway network will be significant and will benefit the national economy.
However, it is also clear that New South Wales cannot continue to commission and operate individual assets in apparent isolation from the broader road network. The current approach of commissioning individual assets that operate within a broader network has clear limitations, including:
• Inflexiblecontractsandlimitedincentivestorenegotiate;
• Tollsthatdonotprovideequitytomotorists;
• Piecemealassetdevelopmentleavingcleargaps,ormissinglinks,inthenetwork.
This approach does not deliver optimal efficiency or functionality and could discourage the development of costly or complex projects, due to the complexities of developing a tolling regime to support the project.

10

11
Sydney’s Orbital Network forms the road transport backbone of Australia’s largest and most economically significant city. A 2008 analysis commissioned by Transurban and undertaken by Ernst & Young concluded Sydney’s toll road network was a key economic driver and contributed $1.8 billion to gross state product in 2007. The study found by 2020, the value delivered by the road network would grow to $3.4 billion per annum. But this vital economic network is under significant, sustained and growing pressure.
Each day freight, passenger and public transport vehicles travel over 120 million kilometres within the greater Sydney area. Passenger kilometres travelled in Sydney will soar by a further 38 per cent by 2020 – the third highest growth across all capital cities, behind Brisbane (46 per cent) and Darwin (40 per cent).
Sydney also sits at the centre of the nation’s most valuable intercity freight corridor, the recently renamed Network 1, which links Sydney to Brisbane and Melbourne. The Federal Government estimates urban road freight in Sydney accounts for nearly 30 million tonne kilometres each day – one quarter of the total transport task.
Existing congestion and growing demand pressures now require bold reform to manage demand and major augmentations and expansions to the network’s capacity.
3.1 Drivers of Demand
Australia is facing unprecedented growth in demand for transport across all modes. In Sydney, a growing and ageing population, economic development and poor public transport options will combine to further drive demand for transport services. Key demand pressures include:
• BroadPopulationGrowth – Modelling by IBISWorld finds that Australia’s population will reach 37.8 million by 2051, between the high and medium Australian Bureau of Statistics (ABS) projections (recognising the recent trend towards stronger than forecast population growth). The ABS estimates that New South Wales’ population will increase by 3.3 million to 11.78 million by 2056. This growth will exacerbate demand pressures on Sydney’s transport infrastructure.
3. The Case for Change

12
Figure 3
Australian Population 1850 - 2051 Source: IBISWorld (2008)
1850
1860
1870
1880
1890
1900
1910
1920
1930
1940
1950
1960
1970
1980
1990
2000
2010
2020
2030
2040
2050
Mill
ion
Year ended June
22.3
25.6
29.3
33.4
37.8
02468
101214161820222426283032343638404244
Forecasts (IBISWorld)
• DemographicTrends – Australia is already one of the most urbanised nations in the developed world. It is expected the flow of people from rural and regional areas to major cities will continue. Sydney alone already houses more than 20 per cent of the national population. According to IBIS World’s modelling, two thirds of Australians will reside in capital cities by 2050 – up from 64 per cent in 2001. In absolute terms, the population of Australia’s capital cities will surge from 12.5 million people to 24.9 million people by 2050. According to the ABS, Sydney’s population will rise from 4.3 million in 2009 to 7.6 million in 2056.

13
Figure 4
Demographic Trends impacting Australian Communities, 1901 - 2051Source: IBISWorld (2008)
3.8 million 19.6 million 37.8 million
100%
80%
60%
40%
20%
90%
70%
50%
30%
10%
0%
Coastal Capital Cities Rural (cities >30,000 ) Rural (towns & shires)
1901
32%
61%
7%
2001
64%
5%
12%
19%
2051 (F)
66%
4%5%
25%
0
1
2
3
4
5
6
7
8
2006
2008
2010
2012
2014
2016
2018
2020
2022
2024
2026
2028
2030
2032
2034
2036
2038
2040
2042
2044
2046
2048
2050
2052
2054
2056
Year
Po
pu
lati
on
(m
illio
n)
Figure 5
Population of Sydney, 2006 - 2056Source: ABS (2008)
14
• IncreasedDependenceonRoadTransport – In spite of large legacy public transport networks, Sydney’s passenger movement task is dominated by the use of private motor vehicles. On a business as usual scenario, where there are no major reforms to road and public transport capacity and management, mobility will continue to be underpinned by road vehicle transport. Current estimates show that if public transport were to double over the next two decades, road use would continue to grow substantially.
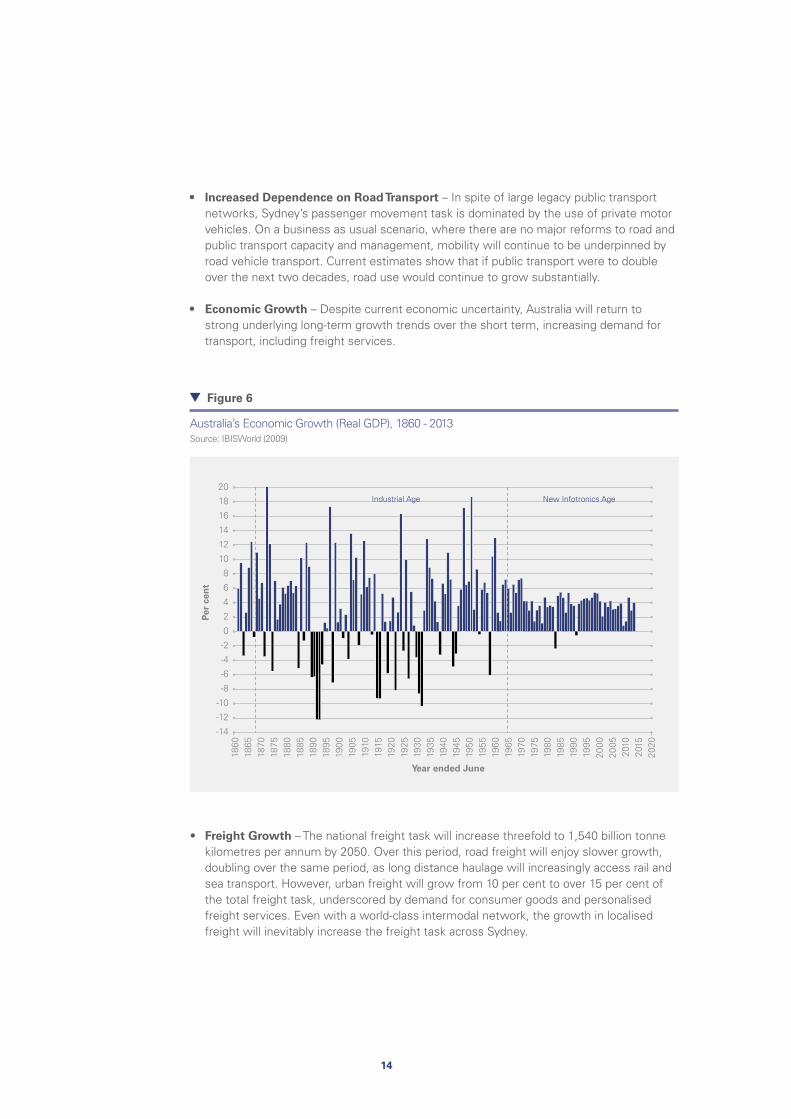
• EconomicGrowth – Despite current economic uncertainty, Australia will return to strong underlying long-term growth trends over the short term, increasing demand for transport, including freight services.
1860
1870
1880
1890
1900
1910
1920
1930
1940
1950
1960
1970
1980
1990
2000
2010
1865
1875
1885
1895
1905
1915
1925
1935
1945
1955
1965
1975
1985
1995
2005
2015
2020
Per
cen
t
Year ended June
0
2
-2
4
-4
6
-6
8
-8
10
-10
12
-12
14
-14
16
18
20Industrial Age New Infotronics Age
Figure 6
Australia’s Economic Growth (Real GDP), 1860 - 2013Source: IBISWorld (2009)
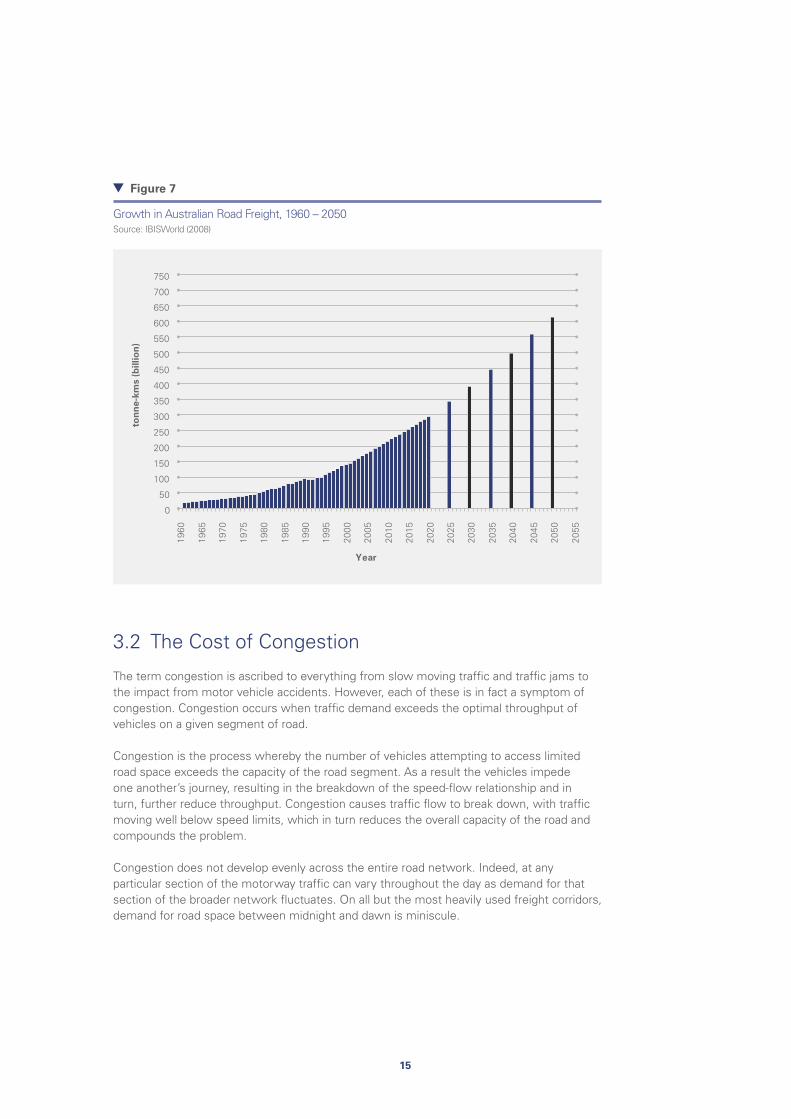
• Freight Growth – The national freight task will increase threefold to 1,540 billion tonne kilometres per annum by 2050. Over this period, road freight will enjoy slower growth, doubling over the same period, as long distance haulage will increasingly access rail and sea transport. However, urban freight will grow from 10 per cent to over 15 per cent of the total freight task, underscored by demand for consumer goods and personalised freight services. Even with a world-class intermodal network, the growth in localised freight will inevitably increase the freight task across Sydney.
15
Figure 7
Growth in Australian Road Freight, 1960 – 2050Source: IBISWorld (2008)
0
50
100
150
200
250
300
350
400
450
500
550
600
650
700
750
1960
1965
1970
1975
1980
1985
1990
1995
2000
2005
2010
2015
2020
2025
2030
2035
2040
2045
2050
2055
ton
ne-
kms
(bill
ion
)
Year
3.2 The Cost of Congestion
The term congestion is ascribed to everything from slow moving traffic and traffic jams to the impact from motor vehicle accidents. However, each of these is in fact a symptom of congestion. Congestion occurs when traffic demand exceeds the optimal throughput of vehicles on a given segment of road.
Congestion is the process whereby the number of vehicles attempting to access limited road space exceeds the capacity of the road segment. As a result the vehicles impede one another’s journey, resulting in the breakdown of the speed-flow relationship and in turn, further reduce throughput. Congestion causes traffic flow to break down, with traffic moving well below speed limits, which in turn reduces the overall capacity of the road and compounds the problem.
Congestion does not develop evenly across the entire road network. Indeed, at any particular section of the motorway traffic can vary throughout the day as demand for that section of the broader network fluctuates. On all but the most heavily used freight corridors, demand for road space between midnight and dawn is miniscule.

16
Figure 8
Typical Day Profile of Avoidable Social Costs of CongestionSource: BTRE (2007) Working Paper 71 - Estimating urban traffic and congestion cost trends for Australian cities’, Australian Government, http://www.bitre.gov.au/publications/49/Files/wp71.pdf, last visited 16 November 2009
Hour of the day
Per
cen
t o
f to
tal d
aily
co
sts
0
2
1
4
6
8
10
3
5
7
9
11
12
13
14
0 1 2 3 4 5 6 7 8 9 10 11 12 13 14 15 16 17 18 19 20 21 22 23 24
Extra air pollution Increase vehicle operating cost
Travel time costs (difference between current congestion and economic optimum)
The tendency for traffic to ebb and peak, including significant periods where the road is underutilised, indicates that in some instances the addition of further capacity to the network may not be required. Better use of existing road space outside of peak times could provide an opportunity to reduce congestion.
3.2.1 The Symptoms of Congestion
The symptoms of congestion are evident to Sydney’s motorists; stop-start traffic, traffic speeds well below speed limits and long queues of vehicles. However the real cost of congestion is much greater and more complex than what is visible to the commuter.
The cost of congestion extends well beyond the individual commuter and radiates throughout the economy and community. A commuter delayed by congestion may be late to collect their children from day care. This commuter would incur both a direct cost in lost time and indirect costs through increased vehicle maintenance and the like; however they also incur an additional cost for child care. In this way, the cost of congestion is passed through the entire economy.

17
Congestion costs impact business productivity, putting a handbrake on the capacity of industry to prosper. From handymen to doctors, lawyers to delivery drivers, every additional minute a worker spends in traffic is a minute they must make up elsewhere in their day.
Congestion also has social costs. Just as congestion reduces productivity during the working day, it also reduces the time that commuters have available to spend with family, contributing to community organisations and charities, playing sport and enjoying leisure time.
Motor vehicles are also a major source of pollution, including greenhouse gas emissions. The National Carbon Inventory estimates emissions from transport accounts for around 14 per cent of Australia’s total national emissions. One practical step to reduce the emission profile of motor vehicles can be made through improving the driving conditions of vehicles on roads by reducing congestion.
The Bureau of Infrastructure, Transport and Regional Economics (BITRE), undertook a major study of the costs of congestion on Australia’s capital cities in 2005. BITRE identified four key costs of congestion including:
• Extra Travel Time: travel time above that for a vehicle travelling under less congested conditions;
• Extra Travel Time Variability: where congestion can result in trip times becoming less certain, meaning commuters must allow a greater amount of travel time than the average journey time;
• IncreasedVehicleOperatingCosts: through higher rates of fuel consumption and greater engine wear. A RACQ field test report showed a 30 per cent increase in fuel consumption between free-flow versus stop-start conditions and through greater wear on vehicles. Another study, conducted by Integrated Management Information Systems (IMIS) on Melbourne’s Eastlink, showed costs could be as high as 40 per cent;
• PoorerAirQuality: vehicles operating in congested conditions emit higher rates of noxious pollutants than under more free flowing conditions, leading to higher health and environmental costs.
Beyond those costs identified by BITRE, a number of additional costs have not been measured, such as:
• ReducedPersonalSafety: congestion including stop-start traffic, reduced vehicle spacing and unnecessary merging and weaving – can result in additional vehicle accidents;
• PoorerPersonalHealth: high stress environments like heavy traffic, can increase stress, anger and frustration.

18
3.2.2 Modelling the Cost of Congestion
BITRE undertook a major study of the costs of congestion on Australia’s capital cities Estimating Urban Traffic and Congestion Cost Trends for Australian Cities determined an aggregate of the avoidable costs of congestion across Australia’s capital cities would more than double over the 15 years between 2005 and 2020, from $9.39 billion to an estimated $20.4 billion. The true cost of congestion is difficult to quantify and the work undertaken by BITRE examined only a portion of the total costs incurred by the community as a result of congestion.
As the components of congestion costs can vary, so too does the methodology for the calculation of congestion costs. The BITRE study utilised three methodologies:
• Total Cost of Congestion Estimate:
- incorporates the costs borne by the vehicle’s driver and external costs borne by the community and other drivers;
- compares the actual experience of drivers compared to estimated free-flow speeds;
- this measure does not recognise the cost-effectiveness of providing certain infrastructure and is a theoretical best case, not necessarily achievable.
- this approach calculated that the annual cost of congestion calculated as total annual delay was $11.1 billion over the eight capital cities for 2005, rising to more than $23 billion by 2020.
• External Cost of Congestion Estimate:
- measures the costs that emerge from congestion but not borne by the vehicle’s driver, commonly referred to as externalities. These costs can include environmental costs (such as air pollution) and additional costs road users imposes on the time of others.
- this approach does not provide an exhaustive analysis of externalities suggesting the actual cost of congestion may be higher than indicated in the study. Externalities include the impacts of travel time on other drivers, which constitute the majority of the costs of congestion and other costs, such as extra air pollution damage costs, estimated as $1.1 billion in 2005.
- in the 2002 study Paying for Road Use, the United Kingdom Commission for Integrated Transport found externalities accounted for up to a third of the total costs of congestion. The Paying for Road Use study incorporated a range of externalities, such as road trauma and noise, not analysed by BITRE.

19
Figure 9
The Costs of Road User ExternalitiesSource: United Kingdom Commission for Integrated Transport (2002), ‘
0
2
4
6
8
10
12
14
16
18
20
Congestion Accidents
Upper estimate
UK
pen
ce p
er v
ehic
le m
ile
Lower estimate
Air pollution Noise Climate change
• Deadweight Loss Cost of Congestion:
- measures the cost of doing nothing.
- tries to quantify the cost of journeys that contribute to congestion, where the value of the journey being taken (such as the delivery of a particular good) does not exceed the cost of the journey being taken.
- infers that the value of a vehicle’s journey can vary dependent on the reason for that journey – for instance the delivery of stationery to an office, would be less critical than the delivery of blood supplies to a hospital.
- BITRE determined the dead weight costs of congestion equalled about $5.6 billion in 2005, rising to $12.6 billion by 2020.
The study concluded the deadweight loss cost approach provided the most accurate value for the costs of congestion that could be recovered through mitigative action. The measure was subsequently used to determine the overall cost of congestion for each capital city.
Several other studies have been undertaken examining the costs of congestion on the Australian community; however the BITRE provides the most rigorous examination, despite the opportunity for a more comprehensive exploration of externalities.
20
3.2.3 The Cost of Congestion in Sydney
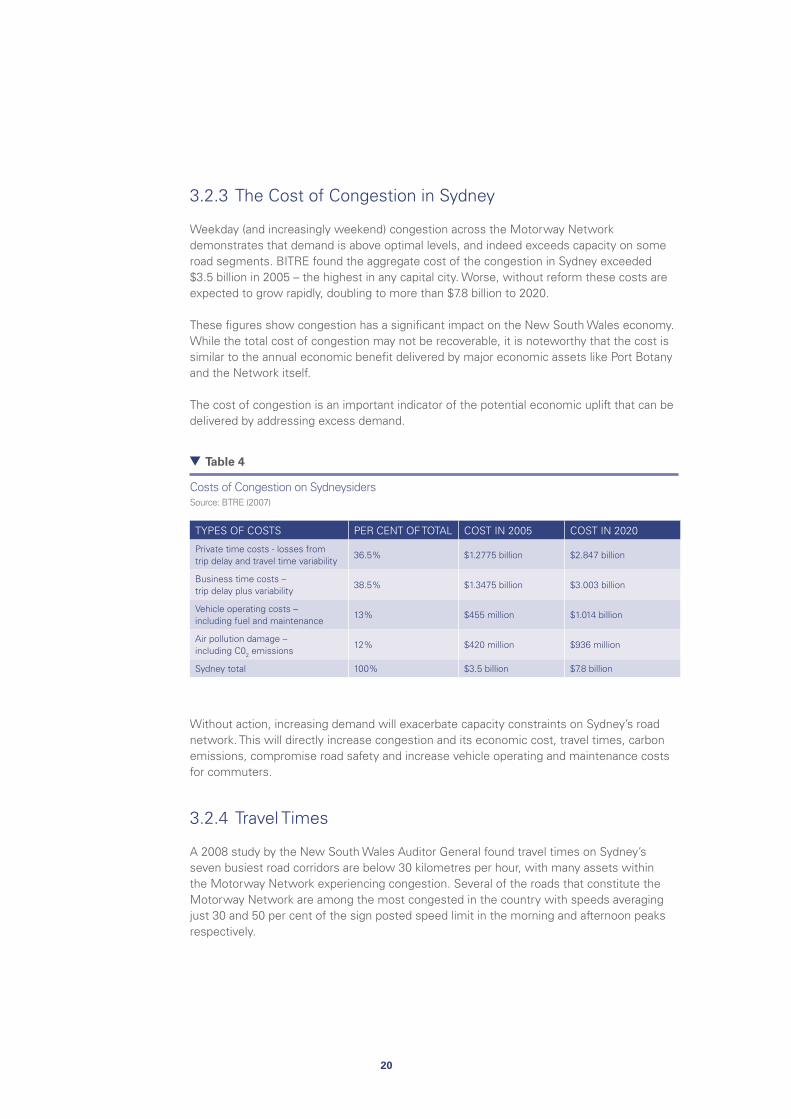
Weekday (and increasingly weekend) congestion across the Motorway Network demonstrates that demand is above optimal levels, and indeed exceeds capacity on some road segments. BITRE found the aggregate cost of the congestion in Sydney exceeded $3.5 billion in 2005 – the highest in any capital city. Worse, without reform these costs are expected to grow rapidly, doubling to more than $7.8 billion to 2020.
These figures show congestion has a significant impact on the New South Wales economy. While the total cost of congestion may not be recoverable, it is noteworthy that the cost is similar to the annual economic benefit delivered by major economic assets like Port Botany and the Network itself.
The cost of congestion is an important indicator of the potential economic uplift that can be delivered by addressing excess demand.
Table 4
Costs of Congestion on SydneysidersSource: BTRE (2007)
TYPES OF COSTS PER CENT OF TOTAL COST IN 2005 COST IN 2020
Private time costs - losses from trip delay and travel time variability
36.5% $1.2775 billion $2.847 billion
Business time costs – trip delay plus variability
38.5% $1.3475 billion $3.003 billion
Vehicle operating costs – including fuel and maintenance
13% $455 million $1.014 billion
Air pollution damage – including C02 emissions
12% $420 million $936 million
Sydney total 100% $3.5 billion $7.8 billion
Without action, increasing demand will exacerbate capacity constraints on Sydney’s road network. This will directly increase congestion and its economic cost, travel times, carbon emissions, compromise road safety and increase vehicle operating and maintenance costs for commuters.
3.2.4 Travel Times
A 2008 study by the New South Wales Auditor General found travel times on Sydney’s seven busiest road corridors are below 30 kilometres per hour, with many assets within the Motorway Network experiencing congestion. Several of the roads that constitute the Motorway Network are among the most congested in the country with speeds averaging just 30 and 50 per cent of the sign posted speed limit in the morning and afternoon peaks respectively.

21
Figure 10
Average Speed Trend for Seven Major Routes to and from SydneySource: Adapted from NSW Auditor General (2008)
0
10
20
30
40
50
60
70
Morning Peak Afternoon Peak Morning Peak Afternoon Peak Morning Peak Afternoon Peak
M2/Lane Cove Tunnel/Gore Hill M4/Parramatta Road/City West Link M5/Eastern Distributor
Sp
eed
(km
/h)
Km/h 2004 Km/h 2005 Km/h 2006 Km/h 2007 Km/h 2008
3.3 Is the Current System Broken?
Congestion on individual sections of the Orbital Network impacts on the efficiency of the broader network. On some sections of the network, congestion already causes traffic ‘tail-backs’ which impact other sections of the Motorway Network and feeder roads during peak periods. Under a business as usual scenario, congestion on the Network and untolled feeder roads will increase congestion across the broader network, increasing negative economic and social costs for the community at large.
Without fundamental reform, key regional transport corridors which link the CBD with important employment centres like Parramatta, Macquarie Park and Eastern Creek and residential hubs such as Rouse Hill, Camden and Leppington will be severely impacted by growing demand. The relative distance of rail connections versus nearby motorway connections means that transport (including public transport) in these regions will continue to be dominated by road use.
Without substantial access to provide for new demand for road transport and to limit growth, congestion will continue to climb in these corridors, eventually resulting in reduced desirability of these locations for business and residential use.
22
3.4 Why Hasn’t it Been Fixed?
The development of transport infrastructure in New South Wales is widely regarded to have stalled since the completion of the Orbital Network in 2007. Excepting recent progress on the M2 widening, other planned and long awaited enhancements to the Orbital and adjacent road network have failed to materialise.
Uncertainty surrounding the state’s project priorities, the global financial crisis and the recent experience of difficult projects like the Cross City Tunnel and Lane Cove Tunnel have all played a part in slow progress toward the next generation of road projects.
However, a reduced political appetite for the next generation of major road projects, coupled with the scale, complexity and balance sheet impact of major road projects have also undoubtedly contributed to delay.
The newly amalgamated New South Wales Department of Transport and Infrastructure recently committed to the development of a 25-year integrated transport plan – the Transport Blueprint - for the Sydney to 2036. The Blueprint aims to link transport planning with land use in the region over the period.
Infrastructure Partnerships Australia has contributed to the development of the Blueprint through a submission outlining key principles that should underpin project development and the identification of key transport projects across modes. The submission identifies a number of major projects identified as government priorities.
23
PROJECT DESCRIPTION
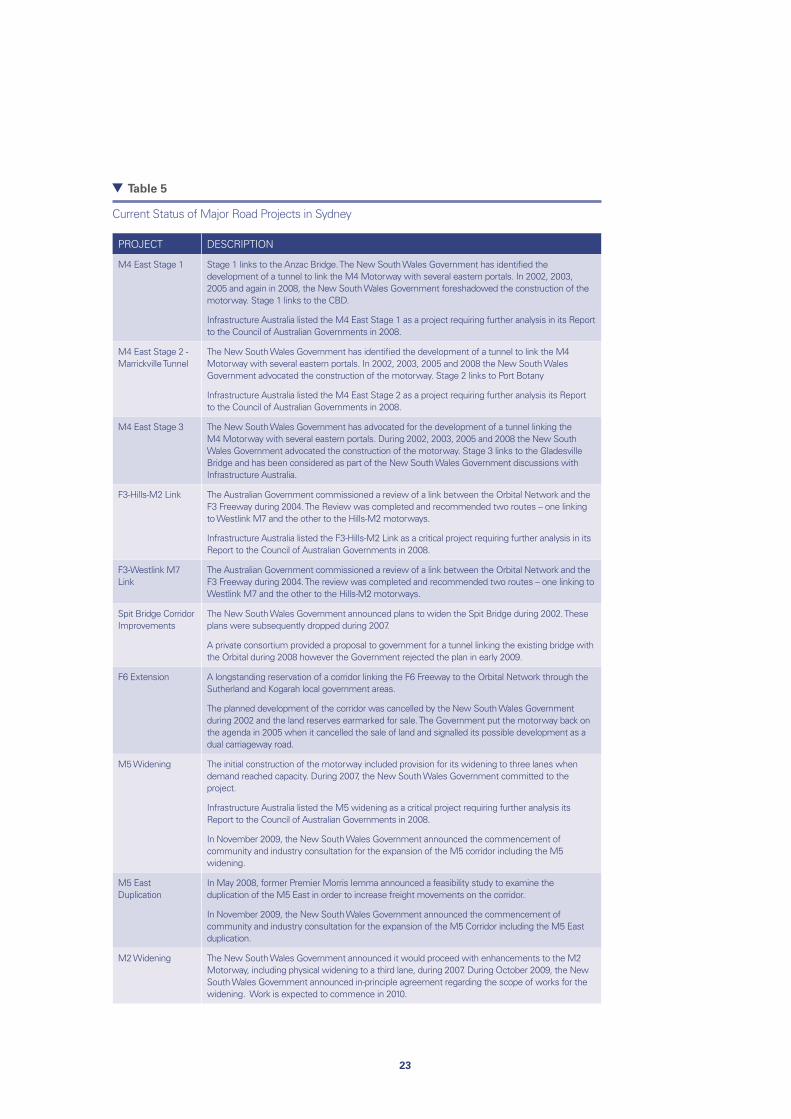
M4 East Stage 1 Stage 1 links to the Anzac Bridge. The New South Wales Government has identified the development of a tunnel to link the M4 Motorway with several eastern portals. In 2002, 2003, 2005 and again in 2008, the New South Wales Government foreshadowed the construction of the motorway. Stage 1 links to the CBD.
Infrastructure Australia listed the M4 East Stage 1 as a project requiring further analysis in its Report to the Council of Australian Governments in 2008.
M4 East Stage 2 - Marrickville Tunnel
The New South Wales Government has identified the development of a tunnel to link the M4 Motorway with several eastern portals. In 2002, 2003, 2005 and 2008 the New South Wales Government advocated the construction of the motorway. Stage 2 links to Port Botany
Infrastructure Australia listed the M4 East Stage 2 as a project requiring further analysis its Report to the Council of Australian Governments in 2008.
M4 East Stage 3 The New South Wales Government has advocated for the development of a tunnel linking the M4 Motorway with several eastern portals. During 2002, 2003, 2005 and 2008 the New South Wales Government advocated the construction of the motorway. Stage 3 links to the Gladesville Bridge and has been considered as part of the New South Wales Government discussions with Infrastructure Australia.
F3-Hills-M2 Link The Australian Government commissioned a review of a link between the Orbital Network and the F3 Freeway during 2004. The Review was completed and recommended two routes – one linking to Westlink M7 and the other to the Hills-M2 motorways.
Infrastructure Australia listed the F3-Hills-M2 Link as a critical project requiring further analysis in its Report to the Council of Australian Governments in 2008.
F3-Westlink M7 Link
The Australian Government commissioned a review of a link between the Orbital Network and the F3 Freeway during 2004. The review was completed and recommended two routes – one linking to Westlink M7 and the other to the Hills-M2 motorways.
Spit Bridge Corridor Improvements
The New South Wales Government announced plans to widen the Spit Bridge during 2002. These plans were subsequently dropped during 2007.
A private consortium provided a proposal to government for a tunnel linking the existing bridge with the Orbital during 2008 however the Government rejected the plan in early 2009.
F6 Extension A longstanding reservation of a corridor linking the F6 Freeway to the Orbital Network through the Sutherland and Kogarah local government areas.
The planned development of the corridor was cancelled by the New South Wales Government during 2002 and the land reserves earmarked for sale. The Government put the motorway back on the agenda in 2005 when it cancelled the sale of land and signalled its possible development as a dual carriageway road.
M5 Widening The initial construction of the motorway included provision for its widening to three lanes when demand reached capacity. During 2007, the New South Wales Government committed to the project.
Infrastructure Australia listed the M5 widening as a critical project requiring further analysis its Report to the Council of Australian Governments in 2008.
In November 2009, the New South Wales Government announced the commencement of community and industry consultation for the expansion of the M5 corridor including the M5 widening.
M5 East Duplication
In May 2008, former Premier Morris Iemma announced a feasibility study to examine the duplication of the M5 East in order to increase freight movements on the corridor.
In November 2009, the New South Wales Government announced the commencement of community and industry consultation for the expansion of the M5 Corridor including the M5 East duplication.
M2 Widening The New South Wales Government announced it would proceed with enhancements to the M2 Motorway, including physical widening to a third lane, during 2007. During October 2009, the New South Wales Government announced in-principle agreement regarding the scope of works for the widening. Work is expected to commence in 2010.
Table 5
Current Status of Major Road Projects in Sydney

24
3.5 How Can the Road System be Fixed?
There are two key and integrally linked options which must be taken in concert to improve the efficiency of Sydney’s road network:
• Increasethenetworkcapacitythroughnetworkenhancementsandcompletingthe‘missing links’, and;
• Improveefficiencyoftheexistingnetworkthroughdemandmanagementpractices.
3.5.1 Increasing Network Capacity
Sydney’s transport infrastructure has not kept pace with the city’s rapid growth. Both road and public transport infrastructure must be upgraded if New South Wales is to position itself for the next round of productivity enhancements and social development. In recognising the role that both private transport and mass transit will have over coming decades, it is critical to recognise the importance of roads in delivery of both modes of transport.
The road network is a vital facilitator of transport in Sydney, supporting both the use of the private motor car and public transport services provided by buses. Indeed, buses account for approximately 950,000 personal public transport movements in Sydney each day, on par with the one million rail-based journeys over the same period.
In addition to the important role roads play in the passenger transport task, road freight accounts for over 40 per cent of the total freight task and provides an irreplaceable service transporting goods from railway depots to department stores, supermarkets and homes. Over the past five years, the New South Wales and Australian governments have identified (and in some instances commenced planning) a range of road projects to alleviate congestion on some of the city’s busiest corridors. The addition of new capacity on the network through widening motorways and the construction of new segments of roadway, will aid in reducing congestion on the network.
Enhancement of the network’s capacity through the construction of new assets is a critical part of meeting the growing passenger and freight task on Sydney’s roads; but we will reach a point where physical limitations will restrict the ability to build new roads. Sydney simply cannot continue to build its way out of trouble – demand management is also an important option.
3.5.2 The Potential Role of Tolls in Managing Demand
Tolls in New South Wales have conventionally been used to recover the cost of construction, maintenance and operation of road infrastructure. Initially, tolls were levied for the general maintenance and construction of the broader state road network. More recently they have been applied to specific segments of the network to recover the costs of construction and operation of that asset. However, tolls can also be used to deliver a price signal to encourage a range of behaviours.

25
The time has come for New South Wales to consider how tolls can be used to do more than simply finance the construction and maintenance of a motorway. In other parts of the world, price signals have been used to successfully drive changes in behaviour. Differential tolls have been used to both manage peak demand and change purchasing decisions toward low emission and renewable fuel vehicles.
In addition to price, there are a range of additional measures which have been used overseas to influence driver behaviour. For instance, variable price HOT (High Occupancy Toll) lanes – where is a toll is charged to assure level of service – transit lanes or toll discounts for hybrid cars encourage particular driver behaviour by rewarding desirable decisions.
The current tolling regime on the Sydney Orbital Network provide an awkward combination of these two functions. The majority of Sydney’s motorways are structured to recover the costs of the asset and its maintenance. However, the introduction of time of day tolling on the harbour crossings in 2009 represents a marked (though modest) shift toward the use of pricing to change road use patterns.
A price signal acts to ration finite road space during times of high demand. To ease congestion during demand peaks, the price must be set high enough to ration access to optimal traffic volumes. Price is only one method to ration access. Alternative models for limiting demand without the use of price signals can include ramp-metering, used on some freeways in Melbourne, or the issuing of permits to a limited number of road users to enable restricted access, such as what occurred in Singapore during the 1970s.
While alternative models to ration road capacity exist, the use of a price signal is preferable because it is highly flexible and allows users to make an informed decision based on their particular situation. It provides choice as users may elect on one journey to pay to access the road, while on another journey they may not, choosing instead to utilise a more congested free road to get to the same destination.
The other benefit of pricing to ration access is it allows an efficient identification and pricing of externalities, such as emissions and impacts on other road users. When priced, these costs can be recovered and invested to offset the impacts of road use.
The use of tolling to influence behaviour on the Motorway Network could be facilitated by the pre-existence of:
• Atollingregimesupportedbyexistinginfrastructure;
• Generalconsumerawarenessandacceptanceoftolling,and;
• Freesurfaceroadsoperatinginparalleltoasignificantproportionofthenetwork,givingroad users a choice in accessing the tolled network.
With the avoidable social costs from congestion projected to increase rapidly and double by 2020, there is an opportunity to deliver windfall social and economic gains by optimising the utilisation of Sydney’s road network through a move to a demand management-based tolling regime.

26

27
4. The Use of Tolls to Optimise Utilisation
Sydney would benefit from a transition from a tolling system that primarily seeks to recover costs, to one that encourages the optimal use of the Network by maximising network-wide efficiency.
Maximising throughput across the Motorway Network offers the capacity to more fully realise the potential economic, social and environmental benefits offered by the network. The introduction of a new system of tolling to the Network could improve its current function and also potentially assist in funding new, complementary road and public transport assets.
A key benefit offered by a new way of pricing Sydney’s road infrastructure is the ability to drive new sources of revenue for the stretched public sector by recovering the deadweight cost of congestion. These new revenues could be applied to seeding or delivering enhancements to Sydney’s struggling road and public transport networks.
Importantly, a new source of revenue offers a new opportunity to fund the transport infrastructure which will be identified by the New South Wales Transport Blueprint.
4.1 Achieving Operational Harmonisation
Incremental delivery of the Orbital Network has allowed the public and private sectors to marshal the resources and capital required for these mega projects. But it has also delivered operational challenges and constrained flexibility in managing the broader network.
While operational issues have largely been positively progressed through commercial agreement, the more substantial issue of pricing disparity requires fundamental and complex changes to concession agreements.
4.2 The Process for Toll Setting in Sydney
Tolls currently apply to nine sections of the Sydney Orbital Network and East-West corridor, including all eight privately owned motorways. The tolls that apply to these private assets are determined by the concession deeds that form the basis of the commercial agreement for the ownership and operation of each asset.
The current process for setting tolls within the concession deeds has two distinct features:
• Thenetworkbrokenupintoindividualsections,witheachsectionreflectingastand-alone project, and;
• Eachcomponentisfinanciallyviableonastand-alonebasis,withtollsreflectingthecostof delivering and operating each component.
Due to the Sydney Harbour Tunnel duplicating the only tolled government owned section of the Motorway Network, the Sydney Harbour Bridge; the New South Wales Government applies the same rate of toll to both harbour crossings, ensuring competitive neutrality between the two assets.
28
The historic process for toll determination in Sydney has not been based on cost but rather the opposite. In setting tolls, the Roads and Traffic Authority examines the potential benefits that can be derived from a project and then determines what would be a reasonable expense for the project, calculating a toll in order to deliver these benefits. The 2005 Richmond Review described this process as a “benefit-cost analysis which grosses up the benefits for the expected number of road users”.’ Generally, the predetermined toll is included as a benchmark in Requests for Tender and Environmental Impact Statement documentation – if the predetermined level of toll is sufficient to covers costs, the private sector would bid to operate the concession.
Variations of this approach have applied on some projects, such as the Cross City Tunnel where other factors, such as upfront contributions to government, influenced the selection of private sector partners, although the contracted toll varied considerably from the benchmark.
While this approach has been central in the development of many successful motorway PPPs in Sydney, the Richmond Review stated this approach was less effective for short, high cost projects. “[The prevailing approach is] likely to work best where a long road delivers substantial travel time savings and less well when a short road delivers indefinite benefits.” A number of Sydney’s missing link motorways are projects that fall into the latter category, making private sector participation under the prevailing approach to tolling arrangements difficult.
The segmentation of the Network into individual projects has been a necessary approach, but it has had unintended consequences, including:
• tollingwheretherateoftollforshorthighlyengineeredprojectsisexcessive–resultingin low demand due to pricing to recover the costs of individual assets or high demand and congestion on long overland assets.
• restrictedcapacitytoreformpricingastheroadnetworkevolvesandexpandsduetotherigid, contractual application of tolls to individual projects.
• tollsononesectionoftheNetworkthatgivelittleornoregardtodemandfororcapacityon neighbouring sections of the road network.
• tollswhichcannotbeadjustedoutsideoftheconcessiondeedtoencourageparticulardriver behaviour, such as the use of hybrid cars or multiple occupancy vehicles.
• theinabilityoftollroadownerstovaryassettollstoencourageparticulardriverbehaviour, such as reducing tolls in off-peak times.
• theimpactofmultipletollsonasinglecorridor–suchasthejourneyfromthenorth-west to the city – cannot to be addressed through commercial agreement between concession holders.
• measurestoaddresscommunityconcerns(forexample,theCashbackschemeontheM4 and M5) have resulted an inconsistent application of price signals and inequity for Sydney’s motorists.

29
The complexity of the current tolling regime restricts the ability to move to a new tolling system and to develop further projects to boost network capacity. Without reform to the current toll determination process, fiscal constraints facing the New South Wales Government might continue to frustrate the next series of road projects, even where they would be financially viable within a coherent network.
It is important to note that the process of developing large motorway networks in a series of interconnected projects has no international precedent. The adopted project-by-project approach was best-practice at the time of contractual close. However, with the benefit of hindsight, limitations of this approach are becoming apparent.
While there are good historical reasons for the current structure of tolls, we need to ask whether it is possible to move to an alternative model which would:
• Allowformoreoptimaluseofthecurrentnetwork,and;
• Makeiteasiertoundertakenewinvestmentstocompletethenetwork.
4.3 How Can the Tolling Regime be More Efficient?
An efficient tolling regime can be defined as one that effectively balances demand for and the availability of road space. In this way an efficient tolling regime addresses congestion. An efficient tolling regime may take two forms:
• Demand Reduction: this can be achieved by relatively blunt measures, such as fixed tolls that increase during periods of high demand, such as morning and afternoon peaks. This approach can be useful in shifting demand to quieter shoulder and off-peak periods. However, fixed toll schedules are not able to respond to unplanned or irregular events, such as accidents, which can substantially impede traffic flow.
• Quality of Service: guarantees a service standard, such as the minimum speed of travel. In order to be effective, this approach requires tolls to be dynamically variable, rapidly changing if service quality shifts. For instance, if quality of service drops, there must be a rapid diversion of vehicles to restore service quality. This change must then be communicated to potential road users to effectively regulate demand, and therefore reduce congestion.
Congestion and the under-utilisation of various sections of the Motorway Network at various times of the day shows the current pricing structure does not provide clear signals for optimal use of Sydney’s road network.
Adjusting toll charges to match road capacity and consumer need would have a positive impact on the efficiency of the network and reduce the social and economic costs of congestion. With the exception of the Harbour Bridge, toll charges on Sydney’s roads have been set to reflect the average capital and operating costs of each project per vehicle. The majority of Sydney’s toll roads (with the exception of the Sydney Harbour Bridge and Tunnel) operate using fixed toll charges and therefore do not provide an effective price signal to consumers regarding time or type of use.

30
The use of pricing to manage congestion means in effect a tolling regime which varies according to demand, or as a substitute for demand, the time of day. As shown in Figure 11, demand for roads varies significantly across a 24-hour period, marked by peaks during morning and afternoon.
As the road network’s capacity remains constant, a pricing structure which does not reflect variable demand inevitably leads to over-utilisation and congestion in peak periods, while leaving spare capacity during off peak demand periods. A toll charge which changes according to demand is more likely to optimise utilisation of the road network than a fixed toll, as it creates a price incentive for commuters to switch to alternative transport modes, or to prioritise the timing of their journey.
Figure 11
Hourly Traffic Volumes for Typical Metropolitan TravelSource: BTRE (2007)
Hour of the day
Per
cen
t o
f d
aily
tra
ffic
0
2
1
4
6
8
3
5
7
9
0 1 2 3 4 5 6 7 8 9 10 11 12 13 14 15 16 17 18 19 20 21 22 23 24
Network (arterial) everage Freeway average
However, time-of-day is only one aspect of pricing flexibility. Tolls can also be used to distribute traffic more efficiently along a network. Some parts of the road network in Sydney are more congested than others. Tolls can be used to encourage greater utilisation of the less congested parts of the network, just as they can be used to manage the demand on the more congested parts.
This is not to suggest that road tolls must be infinitely variable across the entire network in order to enhance network performance. Efficient pricing requires achieving balance between practicality and optimal price signals, in turn demanding an understanding of the networked nature of the road system. It requires that toll charges on individual roads be set within the context of the network by considering both the benefits and costs that charging a toll on a particular road segment imposes—not just on users of that specific road, but also on other road users and society in general.

31
The introduction of a variable tolling regime on the Sydney Motorway Network which gives due regard to the relationship between demand and price will result in twin benefits of:
• adirectincreaseinrevenuederivedthroughpriceincreasesleviedtobluntdemandduring peaks, maintaining demand at optimal levels; and potential patronage growth supported by capacity augmentation, and;
• gainsassociatedwithvariouseconomic,environmentalandsocialfactorssuchasreduced greenhouse gas emissions, reduced accidents and noise.
Figure 11 demonstrates the economically optimal settings for a congestion charge. The figure illustrates the two potential gains from the introduction of a congestion-linked charge and the subsequent decrease in vehicle flow per hour. The first is the economic gain derived by the direct reduction in the costs of congestion. The second is the revenue generated by the charge itself.
Figure 12
Economically Optimal Congestion ChargingSource: BITRE (2008)
Revenue from congestion pricing
Valu
e / C
ost
Optimalcongestioncharge
0
$
Quantity 2 Quantity 1
Economic gain fromcongestion pricing
Demand
Traffic Flow(vehicles per hour)
Marginal Private Cost
Marginal Social Cost
In Sydney’s case, achieving optimal use of the road system will likely involve reducing tolls on some sections of the network and increasing them on others. It is therefore critical that owners and operators of the network are compensated for any potential reduction in the return on their initial investment in the network.

32
4.4 Use of Network Tolling to Promote New Investment
A primary consideration is the opportunity for fully dynamic tolling to advance new projects to drive a better functioning road network. A number of vital projects which may not be viable without government funding could become viable if New South Wales is able to capture the benefits from the wider effect they have on network use, and therefore toll revenue, as well as externalities.
Major network augmentations will feed traffic into the rest of the network and reduce congestion. For example, the construction of the M4 East could have two effects:
• TheextendedsectionwouldfeedadditionalvolumesoftrafficflowintotheCrossCity Tunnel, the Eastern Distributor and the M5 corridor, increasing revenue on those concessions.
• ItwouldreducecongestionontheM4,allowinggreatertrafficflowandgreaterrevenue(iftolls were kept on this motorway beyond their planned removal in 2010).
Under a model in which the Network is operated as a whole network, decisions to complete vital extensions like the M4 East would depend on whether its costs could be recovered through a combination of the new toll and additional revenue contributed from the network tolling regime. By contrast, to proceed on a stand-alone basis under the status quo, the project would have to depend on its own tolls and a significant taxpayer contribution.
A second consideration in moving to a network tolling framework is the perceived value of tolls. In deciding how to respond to the price signals sent by tolls, road users make decisions about the incremental value of the road on which they will travel. For example, the tolled Falcon Street Gateway has been criticised for its high cost per kilometre and is therefore underutilised, even though the toll reflects the actual cost of the project. People perceive levying a toll for 150 metres of roadway as unreasonable.
Value perception presents a significant issue in financing additional projects to increase the capacity, accessibility and functionality of the Motorway Network. Many important projects involve completing relatively small interconnections on the network. In spite of their relatively small size, these projects may well present unique and complex engineering and construction issues, increasing their cost and therefore, the toll required to finance these projects. This increases the risk that motorists will not appreciate the additional cost relative to the additional benefit of the new connection if the toll is based on recovering the full incremental cost. This could be the case even if the incremental benefits of the section for the entire network exceed the costs.
Other networks — such as payment networks or telecommunications networks — design prices carefully to recover costs from those elements of the network where consumers are relatively price insensitive, or where additional value is perceived or obvious. Overall, this ensures optimal utilisation of the network, while enabling overall costs to be recovered. The same logic should apply to road networks.
The underutilisation of the Lane Cove Tunnel and the Cross City Tunnel illustrates this problem. While both projects represent fundamental elements of the overall Motorway Network, the need to recover their costs on a concession specific basis has resulted in pricing strategies which were not perceived as delivering value for money, and which did not fit into the overall network context.

33
Like all customers, motorists should be able to expect their payment for access will deliver an agreed level of service. Ideally, motorists should be able to expect:
• tobeabletodriveataminimumspeed;
• accessawellmaintained,highqualityroad;
• toavoidcongestionandotherhazards;and,
• receivepromptassistancefromincidentresponsevehiclesintheeventofabreakdown.
Many motorway operators provide these services as part of their concession agreement for operation and maintenance of an asset, however a range of additional services are offered by motorway operators as part of their customer service offering.
Having accepted the underlying requirement for Sydney to move to a new system of tolling that encourages the optimal use of the network, this section examines the principles which should be considered in designing a new tolling model for Sydney.
5.1 Models for Tolling
Tolling a segment of road can be undertaken in a variety of ways. A common model is to charge road users for access to a particular segment of road, but tolls can also be structured to charge for access to an area and movement within an area. The three basic models of tolling are:
• AFacilityCharge – levied on a motorist that passes through a particular section of road. A facility charge can apply to an entire road, such as the tolls on the Sydney Motorway Network, or specific lanes within a road, such as the High Occupancy Toll (HOT) or High Occupancy Vehicle (HOV) lanes used in the USA.
• ACordonCharge – a driver is tolled when passing a border (either in or out) indicating a limited area. Europe’s first toll cordon was introduced in Bergen, Norway in 1986.
• AnAreaCharge – when a motorist is charged for journeys into or within a demarcated area. The London congestion charge charges road users for movements within the congestion zone as well as into the zone.
Each of these tolling models superimposes boundaries on geographic regions for the purpose of tolling; therefore influencing the decision to access specific assets or areas.
5. A New Model for Tolling
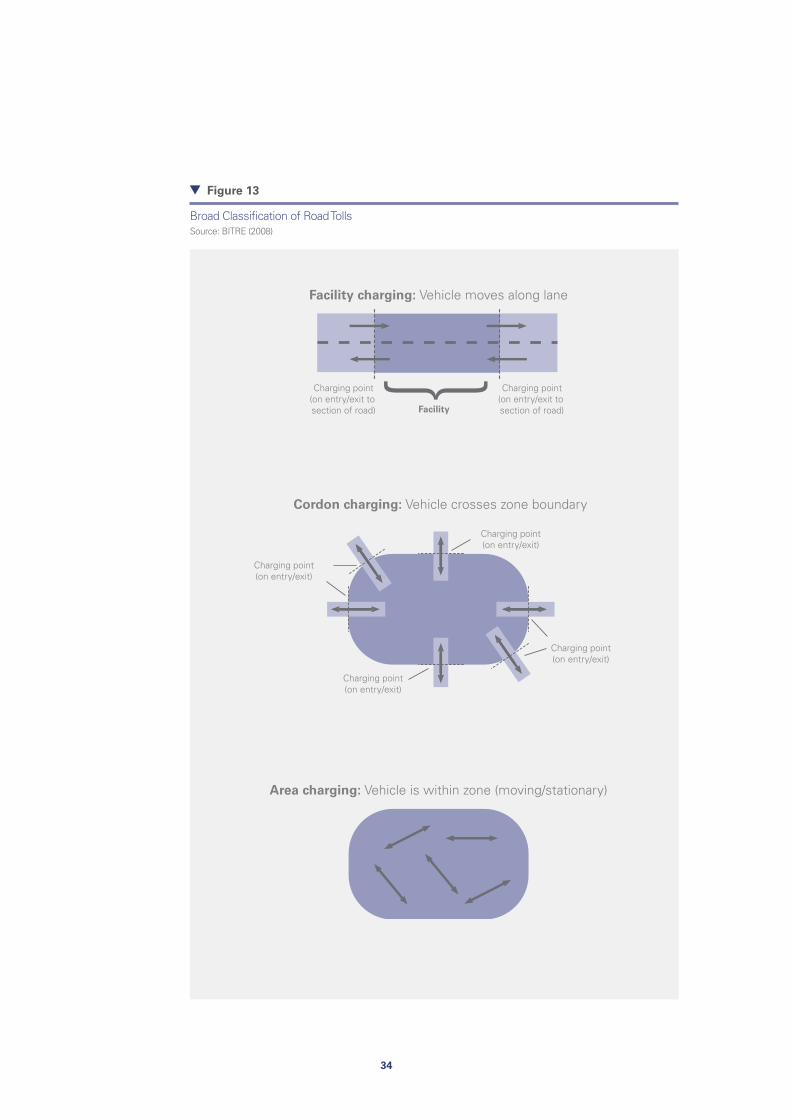
34
Figure 13
Broad Classification of Road TollsSource: BITRE (2008)
Facility charging: Vehicle moves along lane
Cordon charging: Vehicle crosses zone boundary
Area charging: Vehicle is within zone (moving/stationary)
Facility
Charging point(on entry/exit to section of road)
Charging point(on entry/exit to section of road)
Charging point(on entry/exit)
Charging point(on entry/exit)
Charging point(on entry/exit)
Charging point(on entry/exit)

35
5.2 Types of Variable Road Toll
Beyond the use of geographic boundaries, tolls and other charges can also be applied to a range of additional behaviours by road users. Time of day tolling on the Sydney Harbour Bridge and Tunnel are the only examples of tolling designed to influence behaviour on Sydney’s road network.
While not designed to discourage use by particular vehicles, tolls for access to many of the segments of the Motorway Network vary based on vehicle class thereby providing a disincentive for particular vehicle types to use the Network. For example, from July 1, 2009 heavy vehicles travelling the Hills-M2 pay approximately three times more than a passenger vehicle. The use of particular vehicle classes also attract charges from the Commonwealth and state governments, such as licence and registration fees based on vehicle class.
There are numerous international examples of behaviour-based tolling regimes include Colorado’s I-25 High Occupancy Vehicle (HOV) and High Occupancy Tolled (HOT) Express Lanes. Starting in 2006, single occupant vehicles are charged to use express lanes, but multiple occupant vehicles, buses and motorcycles access the same lane without charge. Several other innovative models are planned or operational in the US. Examples include California’s Freeway 10, and Georgia’s I-20 east of I-75/85, I-285. Plans also exist for the further roll-out of HOV lanes in some European cities.
These tolling models provide a framework to drive change to deliver desired economic and social outcomes on tolled motorways. These models are predicated on reducing congestion and rewarding desired behaviours.
Key tolling models to effect change are described below.
5.2.1 Influencers of Route Choice
• Segment – road networks, particularly motorways, can be divided into tolled segments. The value for a section may vary due to construction cost, length, capacity or numerous other factors. The various concession deeds on the Sydney Orbital Network act as segments, as do the dual tolls on the Hills M2 (Pennant Hills and Macquarie Park)
• Distance – vehicles are charged a rate per kilometre travelled, which is calculated dependent on their entry and exit points on the network. Applies on the Westlink M7 Motorway.
• Nodal – applies a charge based on the capacity of traffic to be passed through a node, portal or gateway, to another section of the road network. A nodal toll typically applies where traffic must travel the length of the segment, prior to being given the option to leave the motorway. This could be the distance between intersections, motorway off-ramps or changed traffic conditions (such as the introduction of additional lanes).
Nodal tolling recognises the requirement to travel a full segment and delineates prices based on attributing values, such as capacity, speed limit and on-road conditions, of each section.
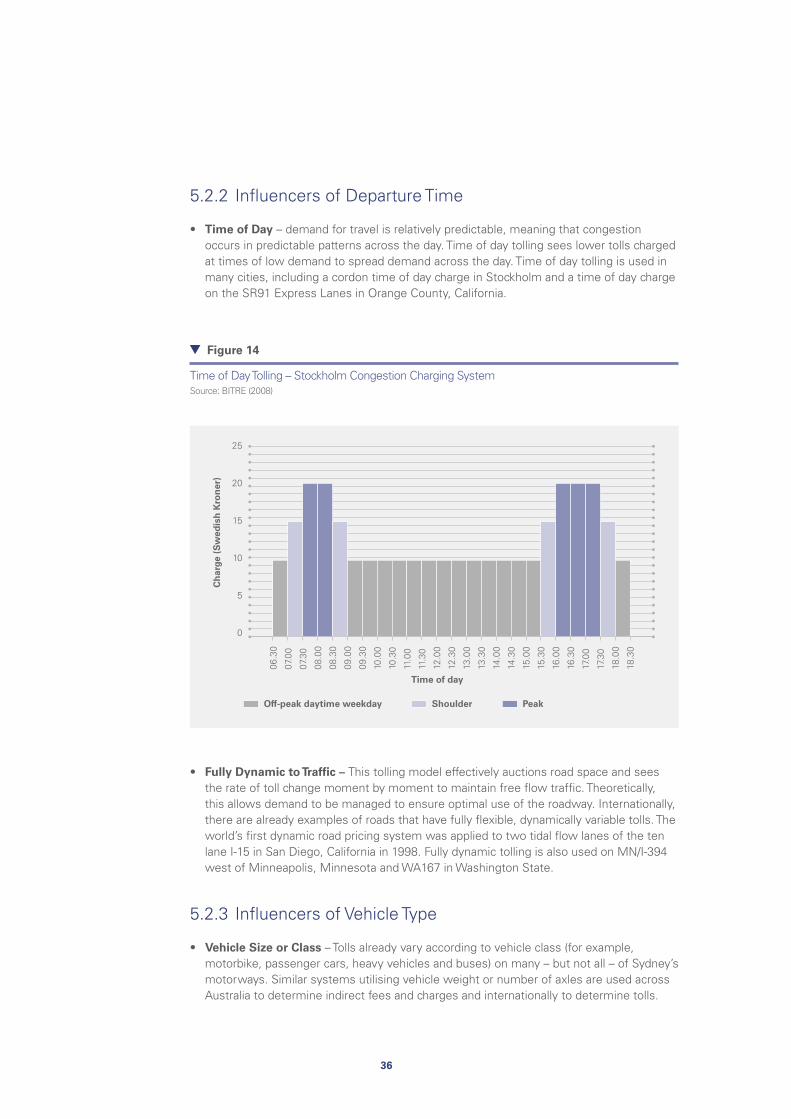
36
5.2.2 Influencers of Departure Time
• Time of Day – demand for travel is relatively predictable, meaning that congestion occurs in predictable patterns across the day. Time of day tolling sees lower tolls charged at times of low demand to spread demand across the day. Time of day tolling is used in many cities, including a cordon time of day charge in Stockholm and a time of day charge on the SR91 Express Lanes in Orange County, California.
Figure 14
Time of Day Tolling – Stockholm Congestion Charging System Source: BITRE (2008)
0
10
20
15
25
5
Off-peak daytime weekday Shoulder Peak
06.3
0
07.0
0
08.0
0
09.0
0
10.0
0
11.0
0
12.0
0
13.0
0
14.0
0
15.0
0
16.0
0
17.0
0
18.0
0
07.3
0
08.3
0
09.3
0
10.3
0
11.3
0
12.3
0
13.3
0
14.3
0
15.3
0
16.3
0
17.3
0
18.3
0
Ch
arge
(S
wed
ish
Kro
ner
)
Time of day
• Fully Dynamic to Traffic – This tolling model effectively auctions road space and sees the rate of toll change moment by moment to maintain free flow traffic. Theoretically, this allows demand to be managed to ensure optimal use of the roadway. Internationally, there are already examples of roads that have fully flexible, dynamically variable tolls. The world’s first dynamic road pricing system was applied to two tidal flow lanes of the ten lane I-15 in San Diego, California in 1998. Fully dynamic tolling is also used on MN/I-394 west of Minneapolis, Minnesota and WA167 in Washington State.
5.2.3 Influencers of Vehicle Type
• VehicleSizeorClass – Tolls already vary according to vehicle class (for example, motorbike, passenger cars, heavy vehicles and buses) on many – but not all – of Sydney’s motorways. Similar systems utilising vehicle weight or number of axles are used across Australia to determine indirect fees and charges and internationally to determine tolls.
37
The Maryland Transportation Authority Bay Bridge 50/301 offers five rates of toll, varying according to the number of axles, ranging from US$2.50 to US$18.00. Similarly the LA-1 Expressway has eight rates of toll varying by axle number between US$2.50 and US$12.00. Prior to its conclusion in 2005, Trondheim’s cordon charge featured a heavy vehicle rate, which doubled the toll for those vehicles over 3.5 tonnes.
• EngineCapacity– similar to vehicle class and size however based on vehicle engine specifications, like capacity or fuel consumption.
• FuelType – vehicles utilising particular fuel types, such as alternate or renewable fuels like biodiesel, or low emission fuels, such as LPG, receive discounted tolls. By doing so regulators can encourage the adoption of renewable and low emission fuels and reduce the environmental costs of congestion. The Georgia Department of Transportation Atlanta HOV projects including I-20, east of I-75/85, I-285; also provides toll-free access for 'Certified Alternative Fuel Vehicles'. The London Congestion Charge provides exemptions for electric, hybrid and some alternate fuel and LPG vehicles.
Reduced tolls for vehicles with low engine capacities or utilising alternative fuels may be appropriate in recognition of the reduced social costs of these vehicles associated with air pollution. However, as alternative fuels are increasingly adopted by road users, it is likely over the longer term that it may be necessary to review advantageous tolling arrangements for these vehicles. Such a review would be appropriate considering the principle aim of such a scheme is to reduce the total cost of congestion to society, not only the costs associated with air pollution.
Variable charges for vehicle types, while widespread, also need to be carefully designed to ensure that classification of the vehicle types can easily occur.
5.2.4 Influencers of Trip Frequency
• VehicleOccupancy – High Occupancy Vehicle (HOV), or car-pool lanes, are utilised in various jurisdictions with and without tolls attached to their use. Under this model, access or toll is dependent on the number of occupants within a vehicle. Typically single occupant vehicles pay the highest rate of toll, with lower charges for dual and treble occupancy.
• TripCaps – an equity measure which can limit the impact of multiple or distance based tolls. This approach encourages longer journeys, smoothing the impact of multiple charges on users from outlying areas. Caps can also be used, where appropriate, to discourage the use of a network for short ‘local’ journeys by providing a discount rate for longer journeys. A trip cap applies on the distance-tolled Westlink M7 Motorway in Sydney.
• TripFrequency – a discounted toll for particular users who access the network multiple times within a specific period. By discounting frequent use, road users, such as heavy vehicles, mass transit or taxis, can be encouraged to use the tolled network rather than diverting to free routes during periods of low demand.

38

39
6 Principles for Introducing Network Tolling
The theoretical benefit of moving to a pricing regime that optimises traffic flow is unambiguous. However, the relationship between supply and demand for road space is more complex.
The Sydney Motorway Network is a complex system of interconnected roads, with each serving a variety of roles. For instance, Southern Cross Drive is situated between the CBD and Sydney’s air and sea ports and serves as a high value connection between the city and many tens of millions of airport and container port users. However, the road is also the key commuter link for drivers from Sydney’s southern and south western suburbs.
In determining the appropriate application of a tolling regime to the Motorway Network it is therefore important to consider the role of the Network’s roads in delivering Sydney’s broader transport objectives.
6.1 The Relevance of the Road Hierarchy
Similar to the circulatory system in the human body, road systems work best when they operate according to a hierarchy of assets that serve distinct functions. As with arteries, veins and capillaries, the hierarchy of road assets needs high capacity motorways, arterials and local road connections. The position of a road within the hierarchy is essential to determine the broad objectives for its design and management. Specifically:
• MotorwayNetworks - deliver high throughput – or high speeds and large volumes - over long distances. To ensure roads can fulfil this role, they often have few or no turning movements, a few well-spaced entrances and exits, grade-separated intersections and restrict entry for cyclists and pedestrians. These roads do not serve an access-way function but are the ‘heavy lifters’ of the traffic network. The Sydney Motorway Network, most highways and the interstate network (e.g. Network 1) are constituting motorways.
• ArterialRoads - provide high volume links between the motorways and lower hierarchy roads. There are some intersections, which may include traffic lights limiting access for use by through-traffic. Arterials should be protected from deterioration of function by inappropriate development. Major feeders to the Sydney Motorway Network are arterial roads, such as Pennant Hills Road, Victoria Road and King Georges Road.
• LowerHierarchy/LocalRoads – serve as either “collectors” or provide access to higher capacity roads. These should be designed to be low-speed environments, have many entrances and exits, and provide for a mix of modes, traffic types and speeds. These lower order roads form the majority of the road estate and criss-cross suburban Sydney. They principally service local traffic.
6.2 Principles of Traffic Flow & Optimising Asset Use
While real road conditions are complex, in simple terms each road asset has an optimal traffic flow which garners the most efficient throughput of vehicles per hour. The capacity of a road is determined by a range of features, such as:
40
• SignPostedSpeeds – speed restrictions limit throughput by regulating the vehicles that can pass through the roadway per hour.
• RoadAlignment – the camber of turns or level of incline impact on the speed at which a particular road may be safely traversed.
• FrequencyofInterchanges - interchanges generate weaving and merging of vehicles, impacting steady flow and reducing travel speed and increasing the risk of accidents.
• RoadSurface – high quality road surfaces which are free of debris and well-maintained allow vehicles to travel at a higher speed safely.
• LaneWidth – motorists have a propensity to travel slowly where they feel ‘squeezed’ by nearby travellers.
• VisualAmenity – where line of sight or vision is restricted drivers may slow to offset reduced reaction times.
• WeatherConditions – conditions, such as rain, snow or the position of the sun may also inhibit the capacity of roads by encouraging drivers to reduce their speed and increase the distance between vehicles.
These factors are interrelated and can significantly influence driver behaviour, impacting on the throughput of traffic. Throughput is derived from the speed and density (distance vehicles travel from other vehicles) of traffic. Each road has a finite capacity – the maximum hourly rate of vehicles – which is determined by these factors. Once traffic volumes exceed the road’s capacity, throughput can decline dramatically.
When there are almost no cars on the motorway (traffic density approaches zero), the flow is zero and speed is high. As traffic density increases, speeds remain free speed, and traffic flow increases. As traffic density increases further, above the capacity of the road, the various factors mentioned above begin to impact drivers and speeds drop gradually. The impact of these features is typically felt before the capacity of the road is reached.
The principle of traffic flow recognises the existence of a point at which the maximum capacity of the road can be achieved. Two traffic flow factors are critical considerations:
• Onceflowreachesacriticalpoint,addingfurthertrafficresultsindramaticreductionsofspeed and flow. The maximum throughput is at a specific critical flow.
• Trafficdensitycanclimbsohighthattrafficcompletelystops,flowreturnstozeroandthere is no movement of traffic. At this point, minimum throughput occurs.
The greatest value can be obtained from the road network if traffic is held within the density required for maximum flow on each link. Recognising that the role of motorway networks is to provide maximum throughput levels, the maintenance of traffic throughput at optimal levels is an important component of the efficient operation of these roads.
This principle is essential in recognising that owners and operators of road infrastructure do not benefit from the infinite growth of traffic. Indeed, as demand for an asset grows beyond the capacity of an asset the revenue of the motorway owner will decline.

41
Figure 15
The Relationships between Road Speed and Volume
0 24000
30
20
10
40
50
60
70
80
F’ Freespeed - F
Volume (veh/h)
Sp
eed
(km
/h)
400 800 1200 1600 2000
6.3 Reducing User Costs & Responses to Road Pricing
The cost of using the road network is not simply tolls. Rather, the direct cost to the user is a generalised cost comprising the toll (if any) plus the costs of travel time, vehicle operation, road trauma and value of comfort, increased safety, improved environmental values or other preferences for the vehicle occupants. While toll roads carry a higher direct cost for access, free roads may carry a higher total costs due to factors such as increased travel time and cost.
Ideally, road users will take account of both factors and assess real journey cost and alternatives such as public transport against the value they will derive from the journey. However, this is not always the case.
In theory, users should seek to minimise their generalised cost when selecting a route through the network. In practice, users can perceive and treat the various costs quite differently. Upfront dollar costs, like tolls, have a greater impact than costs that come later, like fuel and maintenance.
Alongside differing views of upfront and deferred dollar costs, the cost time can be viewed differently by the motorists, companies and the wider economy. International experience has shown that some users selecting to travel on a congested “free” route do not choose the least cost option. They choose to pay more in other costs like time and fuel than the cost of a given toll.
42
These seemingly irrational choices occur because users are not aware of actual journey costs or because they may not fully value their time or opportunity costs. For road pricing to be effective, it must be accompanied by an effective package of measures to deliver pricing information to commuters about the total costs of various options for each specific trip.
Furthermore, in order for road users to respond sufficiently to a variable toll, it is essential that variations in tolls are effectively communicated. The use of multiple, coordinated media (such as web, text, voice and video messages and traffic information boards) to provide up to date, real time toll prices is essential.
Road pricing is a complex issue, and requires careful packaging. How and when charges are made can have as much effect on behaviour as the level of those charges.
6.4 Price Elasticity of Demand
Price elasticity of demand is the relationship between price and demand for a given segment of road. Elasticity varies from journey to journey, from motorway to motorway, and even between sections on the same motorway. The larger the system to which a price is applied, the more complex and sensitive the issue of elasticity becomes.
The greater the capacity of the user to access an alternative, the more elastic their demand will be. In order to demonstrate the relationship between price and demand elasticity, it is useful to consider a worker and their daily commute. If the worker:
• hasarequirementtomakethejourneyinordertoremainemployed–thechoicetomakethe journey is highly inelastic;
• receivesahighdisposableincome–thechoicetomakethejourneyishighlyinelastic;
• canaccessaparallelroadnetwork–thejourneychoiceishighlyelastic;
• livesinaregionwithpublictransport–thejourneychoiceishighlyelastic.
Governments and the private sector have put a lot of work into determining demand forecasts based on the price elasticity of road networks. This is known as traffic modelling.
The use and development of traffic modelling is a critical and controversial component of the engagement of the private sector in motorway development. The Richmond Review said traffic modelling is ”at the heart of decisions to set toll levels based on user preferences”. Despite the use of world-class techniques within government and the private sector, ongoing concerns as to the accuracy of models requires further attention from government.
This paper supports the views of the Richmond Review that it has become more difficult to determine accurate data for potential users and specific projects under the current system of motorway development with rigid commercial sectioning.

43
As a result of the complexity of price elasticity, this paper argues that under the current system of rigid commercial sectioning, it has become more difficult to fund the remaining projects feeding into and within the network as it comes closer to completion. A key reason is that the lower cost and therefore lower toll sections of the Motorway Network have been completed, leaving high cost segments for completion.
Subsequently, the missing links within the network – for instance the high cost M4 East – would require a relatively high toll to recover the costs associated with the construction and maintenance of the asset, when contrast against rate of toll on the adjacent M4 Western Motorway.
In order to offset the requirement for high tolls on high cost projects, such as the M4 East, it may be possible for industry and government to reach agreement on a revenue sharing scheme whereby all parties stand to gain from the development of the project. Such an agreement would recognise the overall positive affect on network utilisation and functionality that would occur as a result of the completion of the project.
6.5 Creating a Network within a Network
This paper focuses on the use of network management, particularly tolling, to improve the utilisation of the Sydney Motorway Network. However, the Network does not exist in isolation. The Network is an important component of the broader road estate of the city. In principle, a pricing regime should seek to optimise throughput on both the free and tolled sections of the road network.
The Council of Australian Governments (COAG) led by the Australian Government has undertaken a program of work examining the application of road pricing systems to the broader Australian road estate since 2006. COAG has focused primarily on the application of a nationally consistent set of fees and charges to heavy vehicles, however that agenda has broadened to include passenger vehicles since 2008. The Review of a Future Tax System (the Henry Review) has played an important role in the broadening of the road pricing agenda through the release of two papers examining broad base road pricing:
• AConceptualFrameworkfortheReformofTaxesRelatestoRoadsandTransport,June2009
• UrbanCongestion–Why‘Free’RoadsareCostly,July2009
The introduction of a national road pricing system would need to give due regard to existing commercial arrangements for road projects such as the Sydney Motorway Network and similar privately financed roads in Victoria and Queensland. The introduction of a national road pricing system would likely require the renegotiation of concession agreements associated with private roads in order to preserve existing commercial terms.
The introduction of a network tolling regime to the Sydney Motorway Network provides a way forward following the introduction of a national road pricing system, by providing a framework for contract renegotiation that both increases the functionality of the network and provides a model for service-based road charging, beyond the prevailing notion of cost recovery.

44
Since the operation of the Motorway Network is impacted by the capacity for traffic to be interchanged with the rest of the road network, an optimal pricing regime would give regard to the demand and capacity of both the Motorway Network and the adjacent road estate. It is therefore critical that the determination of a new pricing system for either gives due regard to the impacts on the other. Critically, a new tolling regime for the Network must:
• Retainsufficientflexibilityforinclusion,orsimpleinteraction,withanationalroadpricingscheme in the future;
• Retainthecapacitytodeliveronitsprincipleaim–improvedcustomerservicethroughassured service levels – under a national road pricing scheme.
6.5.1 Road Pricing
Road pricing theoretically provides the greatest net benefit from the total road assets. It involves pricing all links of the road network to achieve that end.
While it is theoretically optimal, in practice no country in the world has yet achieved such a dramatic shift in the way that the entire road estate is managed and funded. The Dutch Government has committed to the implementation of a nationwide road pricing system based on a per kilometre charge calculated by environmental and economic efficiency of a vehicle, as well as peak period surcharge. The system is planned for introduction in 2018, an earlier version having been delayed for political reasons.
To charge all roads electronically requires a vehicle identification system to record vehicle movements across a sector, which is likely to have a high setup cost. Back office systems for charging and billing are required to manage the large number of transactions. Such a system has to be integrated with existing charging mechanisms to avoid double charging. Consumer and privacy issues must also be addressed.
The complexity of developing and implementing an acceptable overall road pricing system would inevitably mean that progress would likely be slow. While road pricing may become an option in the future, the introduction of such a comprehensive model is not necessary to address the problems affecting Sydney’s Motorway Network.
Some international models exist for the application of cordon or area charges to large geographic regions for instance the London and Singapore congestion charges. Experience from these schemes could be drawn on for an Australian system.
In the absence of a unified national road pricing system for Australia, the development of a network toll for the Sydney Motorway Network offers many of the same potential benefits.

45
7 Barriers to Implementing Network Pricing
7.1 Barriers to Greater Network Harmonisation
A network-wide approach to pricing would both optimise the use of the existing network and enable additions to the network, but the institutional and political history of the Motorway Network means that transition to a new arrangement will not be easy. In this section we describe the main barriers to achieving better results, including:
• equityconcernsofusersandcommunities
- the application of tolls to currently untolled sections of the orbital
- the removal of the Cashback scheme
- the introduction of fully electronic tolling
• riskstooperatorsfromchangingcommercialagreements
- the cost of implementation
- the collection of tolls under a network model
- the distribution of tolls to asset owners
- revenue sharing between asset owners
- compensation for disadvantaged asset owners
- engaging concessionaires
- commercial review periods
• thecomplexityofthenewtrafficmodel
Furthermore, it is critical that the implementation of network pricing is seen as a single overall solution for increasing efficiency and improving equity on the entire road network. The selection of individual measures that are necessary to move to a network toll must be seen as a package. If single components were to be implemented without regard for the broader package, such as the increase in toll prices without investment in transport alternatives such as public transport, network efficiency and equity for road users may in effect be further eroded.
7.2 Equity Concerns of Users and Communities
Despite the long history of the use of road tolls in Sydney and the broader Australian community, the concept of user-pays charges for road use sits uneasily with the community. A recent review by the BITRE identified a series of commonly held community attitudes towards road pricing. These include:
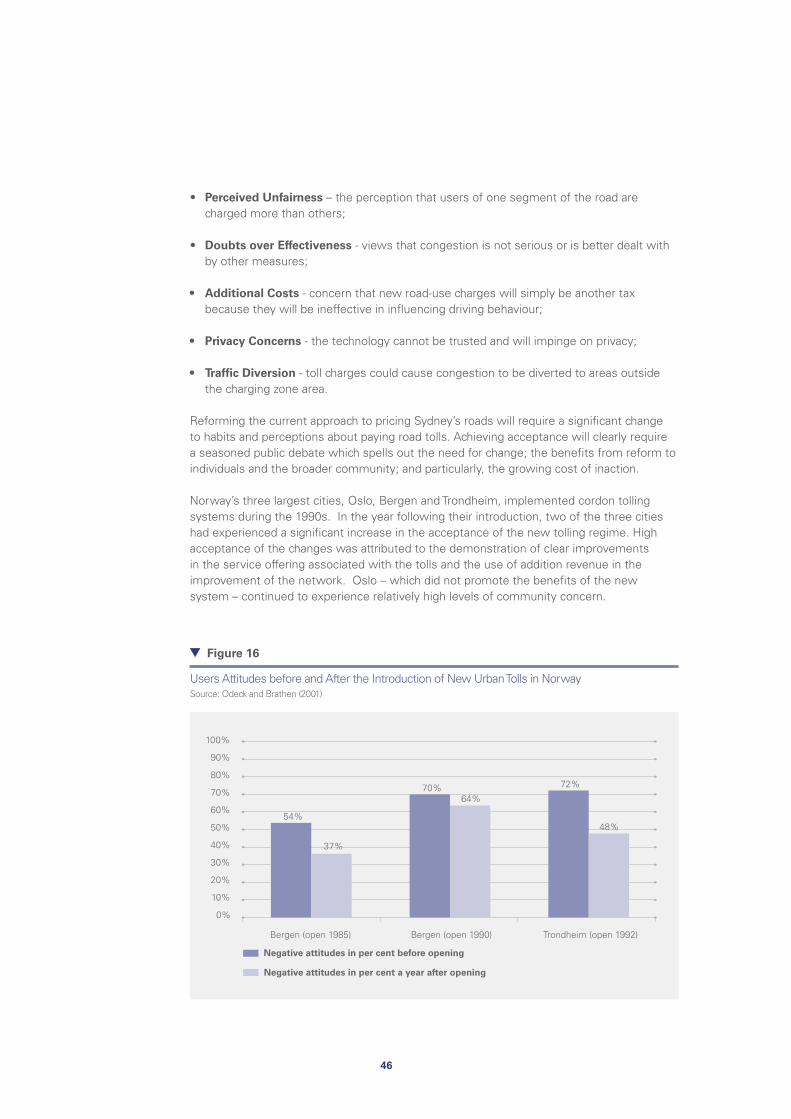
46
• PerceivedUnfairness – the perception that users of one segment of the road are charged more than others;
• Doubts over Effectiveness - views that congestion is not serious or is better dealt with by other measures;
• AdditionalCosts - concern that new road-use charges will simply be another tax because they will be ineffective in influencing driving behaviour;
• PrivacyConcerns - the technology cannot be trusted and will impinge on privacy;
• TrafficDiversion- toll charges could cause congestion to be diverted to areas outside the charging zone area.
Reforming the current approach to pricing Sydney’s roads will require a significant change to habits and perceptions about paying road tolls. Achieving acceptance will clearly require a seasoned public debate which spells out the need for change; the benefits from reform to individuals and the broader community; and particularly, the growing cost of inaction.
Norway’s three largest cities, Oslo, Bergen and Trondheim, implemented cordon tolling systems during the 1990s. In the year following their introduction, two of the three cities had experienced a significant increase in the acceptance of the new tolling regime. High acceptance of the changes was attributed to the demonstration of clear improvements in the service offering associated with the tolls and the use of addition revenue in the improvement of the network. Oslo – which did not promote the benefits of the new system – continued to experience relatively high levels of community concern.
100%
80%
60%
40%
20%
90%
70%
50%
30%
10%
0%
Bergen (open 1985) Bergen (open 1990) Trondheim (open 1992)
54%
37%
70%64%
48%
72%
Negative attitudes in per cent before opening
Negative attitudes in per cent a year after opening
Figure 16
Users Attitudes before and After the Introduction of New Urban Tolls in NorwaySource: Odeck and Brathen (2001)

47
The beginning of a broader debate about road pricing by the Henry Tax Review, coupled with the introduction of a variable toll on the Harbour crossings and the preparation of the New South Wales Transport Blueprint provides a window of opportunity for reasoned public debate about the most appropriate tolling regime for the Motorway Network.
7.2.1 The Application of Tolls to Currently Untolled Sections of the Motorway Network
The Motorway Network incorporates a mix of public and privately owned and operated roadways, and a mix of tolled and untolled sections. All untolled segments are publicly owned and principally include links between the CBD and the major outer-metropolitan motorway links. These untolled links include the Gore Hill and Warringah Freeways as well as Southern Cross Drive and the M5 East, which link to the Lane Cove Tunnel and Hills-M2 and M5 South Western Motorway respectively.
These untolled sections of the Orbital are notoriously affected by high levels of congestion during peak hour conditions. From its first day of operation on June 19, 1968, the Warringah Freeway has experienced consistent morning peak hour congestion. Similarly, the M5 East is well known for peak hour congestion, with a community-based grassroots campaign calling for the widening of the road. The principal New South Wales road users’ group, the National Road and Motorists Association (NRMA), has described the M5 East as the M5 corridor’s ‘Achilles Heel’ due to the bottleneck that forms on the free section of road.
While not carrying express costs for users through tolls, these sections of the Network carry disproportionate costs for users of the broader network and community. For instance, congestion caused by excess demand for the M5 East results in a congestion ‘tail back’ onto the M5 South Western motorway and into feeder and distributor arterial road networks.
Despite the ongoing and persistent impacts of congestion on untolled sections of the Network, the community may be reluctant to support introduction of new user charges to these sections of the network. In particular, users of these sections may feel the application of new tolls fails to recognise previous contributions to the cost of the development of the network through payment of fuel excise, goods and services tax on petrol sales, vehicle registration and licensing costs. The introduction of a customer service-based, guaranteed service tolling model, which supports optimising the asset’s use and raises additional revenue to be used on new infrastructure, provides an opportunity to allay these concerns by demonstrating a value-adding use of the toll revenue.
Applying tolls to currently ‘free’ sections of the network also has the potential to unlock substantial efficiencies through the broader network of motorways and potentially, the adjacent untolled network.
The New South Wales Government will need to make decisions on the appropriateness of continuing to provide operational management and maintenance of these roadways. While the RTA has considerable experience in the operation of the road network – including these assets – the private sector has played an important role in the introduction of innovative management practices to the operation of Sydney’s motorways and has the potential to apply these strategies to additional segments if management was contracted out.

48
Beyond the provision of operational and maintenance support for these assets, government could consider a potential role for these assets in offsetting costs that may be incurred by some operators during transition to a network tolling regime. Under this model, the government might consider the temporary addition of some segments of existing road to existing concession deeds, transitioning the call on revenue collection to the private sector.
7.2.2 The Removal of the Cashback Scheme
Recent history shows that a poor introduction or articulation of tolling can see it lifted to a significant political issue. The election of Labor’s Bob Carr to Premier in 1995, was in part attributed to a pre-election promise to scrap tolls on the M4 Western and M5 South Western Motorways. Following the election, Carr stepped away from this commitment due to contractual complexities, instead implementing a refund scheme for private vehicles, known as ‘Cashback’.
Cashback reduces the impact of road tolls on private users of the network, and artificially contributes to the overuse of the M4 and M5 motorways, compounding congestion on these corridors. These motorways attract patronage that is respectively 14 and 16 per cent higher than forecast, though it remains unclear as to what proportion of that increase can be attributed to the Cashback scheme.
The location of the affected roads in Sydney’s ‘mortgage belt’ in the southwest and west of the city means residents are particularly sensitive to price variations and are likely to alter their behaviour based on price changes. In addition to potential price elasticity, these areas are relatively well serviced by public transport. The M4 corridor is already serviced by a heavy rail connection; the south west has existing heavy rail and will benefit significantly from the construction of the South West Rail Link, which was revived in November 2009.
Cashback remains a major barrier to optimising use of Sydney’s road network. The traffic inducing characteristics of the scheme compounds the impacts of congestion on both the Motorway Network and connected roads. The scheme also provides a perverse incentive not to undertake much needed capacity enhancements, as increased use will exert pressure on state finances to increase reimbursements to motorists. The removal of the Cashback scheme, as part of a broader reform of the tolling regime, would help to improve equity in the current tolling regime while reducing pressure on the State budget.
Cashback has also increased the perceived unfairness of existing tolling arrangements in the community. Drivers who commonly use motorways not covered by the scheme, principally the Hills M2, have argued for the extension of the scheme to cover that corridor or its removal all together.
The removal of Cashback in isolation from complementary measures such as network augmentation, could potentially impact on the underlying financial position of the M4 and M5 concession-holders.
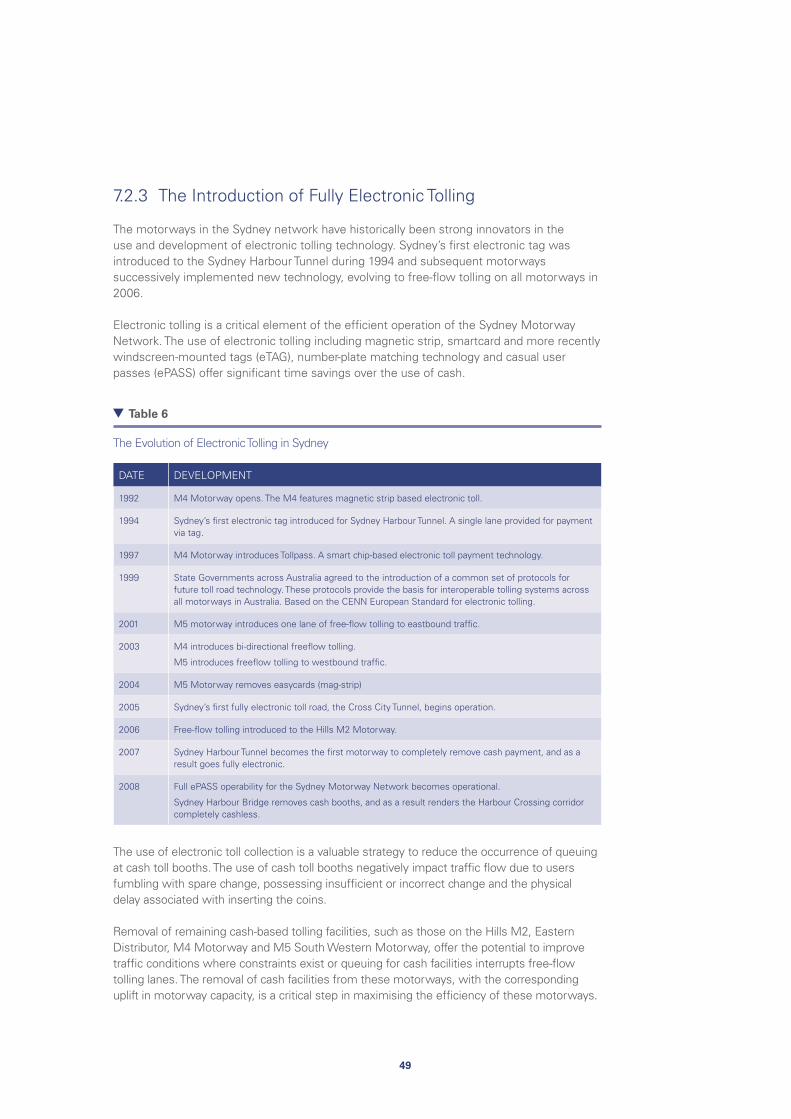
49
7.2.3 The Introduction of Fully Electronic Tolling
The motorways in the Sydney network have historically been strong innovators in the use and development of electronic tolling technology. Sydney’s first electronic tag was introduced to the Sydney Harbour Tunnel during 1994 and subsequent motorways successively implemented new technology, evolving to free-flow tolling on all motorways in 2006.
Electronic tolling is a critical element of the efficient operation of the Sydney Motorway Network. The use of electronic tolling including magnetic strip, smartcard and more recently windscreen-mounted tags (eTAG), number-plate matching technology and casual user passes (ePASS) offer significant time savings over the use of cash.
DATE DEVELOPMENT
1992 M4 Motorway opens. The M4 features magnetic strip based electronic toll.
1994 Sydney’s first electronic tag introduced for Sydney Harbour Tunnel. A single lane provided for payment via tag.
1997 M4 Motorway introduces Tollpass. A smart chip-based electronic toll payment technology.
1999 State Governments across Australia agreed to the introduction of a common set of protocols for future toll road technology. These protocols provide the basis for interoperable tolling systems across all motorways in Australia. Based on the CENN European Standard for electronic tolling.
2001 M5 motorway introduces one lane of free-flow tolling to eastbound traffic.
2003 M4 introduces bi-directional freeflow tolling.
M5 introduces freeflow tolling to westbound traffic.
2004 M5 Motorway removes easycards (mag-strip)
2005 Sydney’s first fully electronic toll road, the Cross City Tunnel, begins operation.
2006 Free-flow tolling introduced to the Hills M2 Motorway.
2007 Sydney Harbour Tunnel becomes the first motorway to completely remove cash payment, and as a result goes fully electronic.
2008 Full ePASS operability for the Sydney Motorway Network becomes operational.
Sydney Harbour Bridge removes cash booths, and as a result renders the Harbour Crossing corridor completely cashless.
The use of electronic toll collection is a valuable strategy to reduce the occurrence of queuing at cash toll booths. The use of cash toll booths negatively impact traffic flow due to users fumbling with spare change, possessing insufficient or incorrect change and the physical delay associated with inserting the coins.
Removal of remaining cash-based tolling facilities, such as those on the Hills M2, Eastern Distributor, M4 Motorway and M5 South Western Motorway, offer the potential to improve traffic conditions where constraints exist or queuing for cash facilities interrupts free-flow tolling lanes. The removal of cash facilities from these motorways, with the corresponding uplift in motorway capacity, is a critical step in maximising the efficiency of these motorways.
Table 6
The Evolution of Electronic Tolling in Sydney

50
The implementation of fully cashless motorway operations represents a practical step towards removing physical restrictions to traffic flow on motorway. However, it is possible to derive similar benefits for road users through the construction of cash collection facilities, separate to the main traffic lanes. The principle restriction of continued cash collection on Sydney’s Motorway Network is access to sufficient land area for the construction of additional cash facilities.
The construction of collection facilities to support the payment of cash tolls at each section of the network where a change in capacity and toll occurs, would be a further challenge to the retention of cash. The added complexity of requiring cash payments for a flexible toll suggests the use of fully electronic tolling as a more desirable outcome for the Network.
7.3 Risks to Operators from Changing Commercial Agreements
A move toward a new, network-based system of tolling for the Motorway Network will require changes to the existing concession contracts. Introducing a new tolling system for the Network will result in changes to the method by which revenue is both collected and distributed to motorway concession holders.
While the introduction of the Cashback program, which essentially resulted in the introduction of a shadow toll for the affected motorways, did not require a renegotiation of concession deeds, network tolling is likely to change the implied profitability of various sections of the network. The introduction of congestion-based pricing would:
• Reducepeak-timepatronageonsomesectionsofthenetwork,whileincreasingitonothers
• Increaseimpliedtollsforsomesectionsofthenetwork,whileloweringthemforothers.
Hence, some concessionaires could benefit from price optimisation, while others could potentially experience reduced long term revenue streams. In theory, both risks and benefits of the network pricing approach could be shared between the government, the community, the road users and various service providers on the network.
The previous sections of this paper are largely devoted to analysing methods by which tolls might be collected; but the distribution of this revenue is equally important.
Renegotiation of concession agreements brings with it inherent risks for the government and concession holders. As the various concession agreements that apply to the motorways within the Sydney Motorway Network were negotiated at different times, feature varying conditions and compensation arrangements, the individual concessions would need to be separately renegotiated and may feature different compromises.
The regulatory and economic circumstances that currently prevail are not likely to have also existed at the time of the initial contract negotiations, and concessionaires may seek to receive new rates of return. For instance, changing costs of finance, operational and maintenance standards, occupational health and safety standards, internal rates of return,
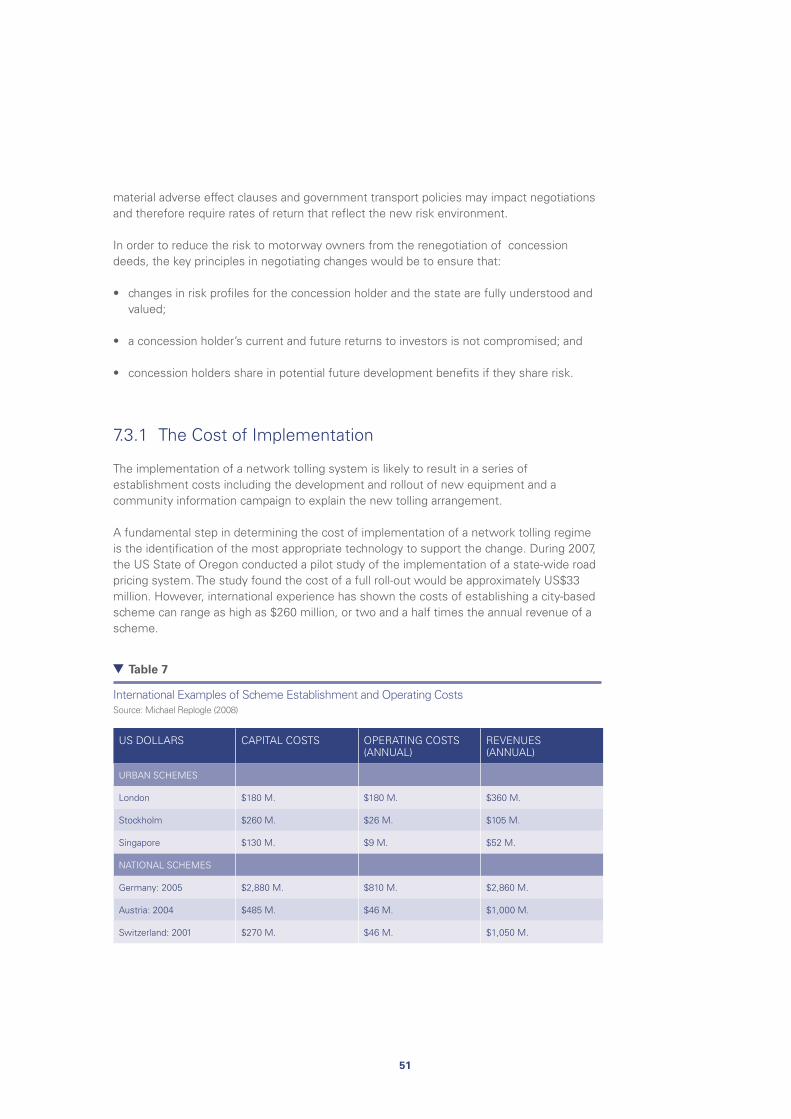
51
material adverse effect clauses and government transport policies may impact negotiations and therefore require rates of return that reflect the new risk environment.
In order to reduce the risk to motorway owners from the renegotiation of concession deeds, the key principles in negotiating changes would be to ensure that:
• changesinriskprofilesfortheconcessionholderandthestatearefullyunderstoodandvalued;
• aconcessionholder’scurrentandfuturereturnstoinvestorsisnotcompromised;and
• concessionholdersshareinpotentialfuturedevelopmentbenefitsiftheysharerisk.
7.3.1 The Cost of Implementation
The implementation of a network tolling system is likely to result in a series of establishment costs including the development and rollout of new equipment and a community information campaign to explain the new tolling arrangement.
A fundamental step in determining the cost of implementation of a network tolling regime is the identification of the most appropriate technology to support the change. During 2007, the US State of Oregon conducted a pilot study of the implementation of a state-wide road pricing system. The study found the cost of a full roll-out would be approximately US$33 million. However, international experience has shown the costs of establishing a city-based scheme can range as high as $260 million, or two and a half times the annual revenue of a scheme.
US DOLLARS CAPITAL COSTS OPERATING COSTS (ANNUAL)
REVENUES (ANNUAL)
URBAN SCHEMES
London $180 M. $180 M. $360 M.
Stockholm $260 M. $26 M. $105 M.
Singapore $130 M. $9 M. $52 M.
NATIONAL SCHEMES
Germany: 2005 $2,880 M. $810 M. $2,860 M.
Austria: 2004 $485 M. $46 M. $1,000 M.
Switzerland: 2001 $270 M. $46 M. $1,050 M.
Table 7
International Examples of Scheme Establishment and Operating CostsSource: Michael Replogle (2008)

52
It is likely the cost of implementing a variable toll on the Sydney Motorway Network would be considerably less than the international experiences given in Table 9, due to the existence of the current interoperable tolling regime.
The New South Wales Government should seek to recover the costs associated with the development and implementation of the new system through additional revenue derived after implementation.
The development of a new tolling system should hypothecate all additional revenue to the expansion of Sydney’s transportation system, including the city’s public transport system and the Motorway Network. As an initial step, this revenue could reasonably be used for the purpose of establishing the network scheme.
7.3.2 The Collection of Tolls under a Network Model
The New South Wales Government has acted as the primary collector of tolls following the reintroduction of user pays road charges following the completion of the Sydney Harbour Bridge. Following the development of the M4 Western and M5 South Western Motorways in 1992, the private sector took over direct responsibility for the collection of tolls and their internal reconciliation as revenue.
The New South Wales Roads and Traffic Authority continues to be the largest provider of eTAGs, with an 80 per cent market share. Private sector operators provide the balance of eTAGS, although their share is growing. There has also been significant consolidation in the private tolling sector, with Transurban a significant shareholder in each private sector toll provider, including Roam, Roam Express and eWay.
Under current arrangements, concession holders are responsible for toll collection on their motorway segment. When a customer uses a tollroad, their trip is captured by the concession holder for that tollroad. The trip details are passed on to the tag issuer who bills the customer. The customer pays the toll to the tag issuer. If the tag issuer is the concession holder, the concession holder receives the full benefit of the toll. It the tag issuer is not the concession holder, the tag issuer passes the toll on to the concession holder, less an administration (‘roaming’) fee. The tag issuer may be entitled to charge other service fees to the customer for additional services.
On fully electronic tollroads, ePass casual passes are also issued for non-tag travel. These passes are available on all tollroads and utilise number plate matching technology. Similar roaming fee arrangements also apply to passes, as well as a fee for manual data matching.
Under a network tolling model, the industry and government could consider the opportunity to derive additional value for money from toll collection contracts, for instance through the consolidation of the existing tolling contracts into a single or reduced number of toll service provider contract.
53
7.3.3 The Distribution of Tolls to Asset Owners
In essence, network tolling is akin to integrated ticketing in public transport. Revenue is collected across the entire network and is shared among service providers on the basis of patronage numbers, agreed costs and other negotiated factors. As interstate and international experience with the integration of public transport ticketing has shown, the negotiation of a system with the right incentives for participation which allows the reconciliation of revenue is not easy. But experience shows that it is possible, as long as the right commercial conditions are created.
Sharing toll revenue between asset owners should not be a major barrier to the implementation of the system. Critically, current concession holders will need to be guaranteed that they will be no worse off under a network tolling system than under the terms of their existing contracts, in both a commercial and risk-sharing sense. Recognising the current contractual terms vary between concessions, it may be necessary to create individual incentives for each concession holder.
Beyond the maintenance of expected returns, the move to a new tolling arrangement could consider new upside, downside risk sharing arrangements to provide certainty for the operation of the network following the addition of new complementary assets. Such provision could include consideration of an ensured revenue stream agreement, or a similar mechanism.
The reconciliation methodology could take into account a range of factors, including vehicle volume carried and marginal costs, as well as ensuring that data integration functions are fully remunerated. Several potential models exist for the distribution of revenue from the network toll to owners of individual assets, these include:
Patronage Risk Models
• MaintainCurrentArrangement(ActualUse): under current arrangements, concession holders receive a revenue stream derived from direct use of their asset (with the exception being the Sydney Harbour Tunnel). Under a network toll model, the road user would be charged a new rate of toll, however the asset operators would continue to receive the current rate of toll per vehicle.
• ActualUseatNewTollRate: concession holders receive the actual revenue derived from the use of the network under the new toll structure.
• ShadowToll: a shadow toll is a patronage based revenue stream whereby the government provides the concession holder an agreed revenue stream, based on the actual number of road users. The rate of shadow toll may or may not be reflective of the price actually charged to road users.
• Proportional–PercentageofVehicles: The concession holder receives a revenue stream based on the proportion of vehicles that access a segment of the whole network, who utilise the concessionaire’s asset.
54
• Proportional–PercentageofVehicle/Kilometres:the concession holder receives a revenue stream based on the percentage of total trips per vehicle kilometre undertaken on their segment of the network.
Non-Patronage Risk Models
• AvailabilityPayment: the move to an availability payment model would be a fundamental shift from the established patronage risk based model which operates across most of the Motorway Network. Under this model, concession holders receive regular service payments for meeting predetermined performance standards. Common performance standards include days of operation and pavement quality, however there may be up to several hundred conditions that must be met to receive full payment. Availability payments would be set to a level where operators would be no worse off than under the current approach.
• Proportional–PercentageofNetworkLanes: similar to an availability model concession holders could be compensated for the proportion of the toll network length they operate. Performance factors could be required to be met to receive payment.
• Proportional–PercentageofNetworkCost: this model would also operate like an availability payment, however concession holders would be compensated based on the replacement or operational cost of the assets they operate within the Network. The asset cost could be calculated using factors such as net present value of the concession contract or initial cost.
Alternative Models
• Inadditiontotheprincipleconsiderationswhichdeterminerevenuestreamsforconcession holders, other factors such as levies for heavy vehicles and other imposts can make a significant contribution to revenue collection. Reforms could potentially include performance payments for achieving broader community outcomes, such as reduced emission profiles.
7.3.4 Compensation for Disadvantaged Asset Owners
In theory, it would be relatively straightforward to imagine how motorway owners could agree to optimal network pricing and share the gains between them in a way which leaves everyone at least as well off as before. However, in practice, such an arrangement will be difficult to negotiate and implement. Concessionaires are generally aware of the likely long-term revenue stream that can be derived from their existing contracts and would need to be convinced about how they would be compensated if they agree to adjust current toll charges. The determination of a toll level that achieves optimal use of each asset through price signals provides the opportunity to derive the most sustainable long term revenue stream for operators.
As we have discussed, network pricing is likely to lead to increased revenue for some toll

55
operators and decreased revenue for others. Indeed, it is possible and likely that some motorway operators may benefit from a network toll approach over the short-term, but be disadvantaged over the longer term or vice versa. Beyond the short-term impacts of variation in the use of the network, the longer term implications of price indexation require further investigation.
The critical factor in implementing network tolling will be whether those that would require compensation would agree to join such a regime. Equally, those operators who would benefit from network tolling may have an incentive to hold out in order to negotiate more favourable terms.
In order to ensure the optimal use of the network as a whole, concessionaires of roads where price optimisation leads to increased profits may be encouraged to compensate concessionaires on other toll roads that are adversely affected. In cases where efficient network prices increase profits on a given road, but where the concession consortium’s profits are capped by a profit sharing agreement with the government, the redistribution to adversely affected parties would, to some extent, have to come from government.
Under a network tolling proposal it would be possible to change the current compensation arrangement to provide new incentives to both concession holders and their partners. This potential change would require agreed variations from existing concession arrangements and therefore motorway owners must be appropriately compensated. In recognising the importance of compensation for existing concession holders, it is critical to recognise that existing concession arrangements could not be changed without appropriate negotiation and compensation where appropriate.
7.3.5 Engaging Concessionaires
The success of the implementation of a network tolling regime will depend on support from all existing motorway network concession holders. In order to promote engagement from all owners it will be essential for government to commitment to a series of incentives to remove the potential for the erosion of motorway revenue.
The development of incentives for motorway concessionaires could include:
• RevenueSharing – the introduction of demand-based tolling is likely to result in the revenue increases on some network assets, while others segments will experience a reduction. Government and private operators could potentially reach agreement on a sharing agreement for revenue uplift as a result of the new tolling regime.
• ExtensionofConcessionTerms – the New South Wales Government recently agreed to the extension of concession terms for the owners of the Hills-M2 following negotiations on a widening project for that asset.
• CapitalEnhancements – the expenditure of public funds or surplus revenue collected through the network tolling system on asset enhancements or augmentations, such as motorway widening, could support additional revenue collection through facilitating greater asset use.
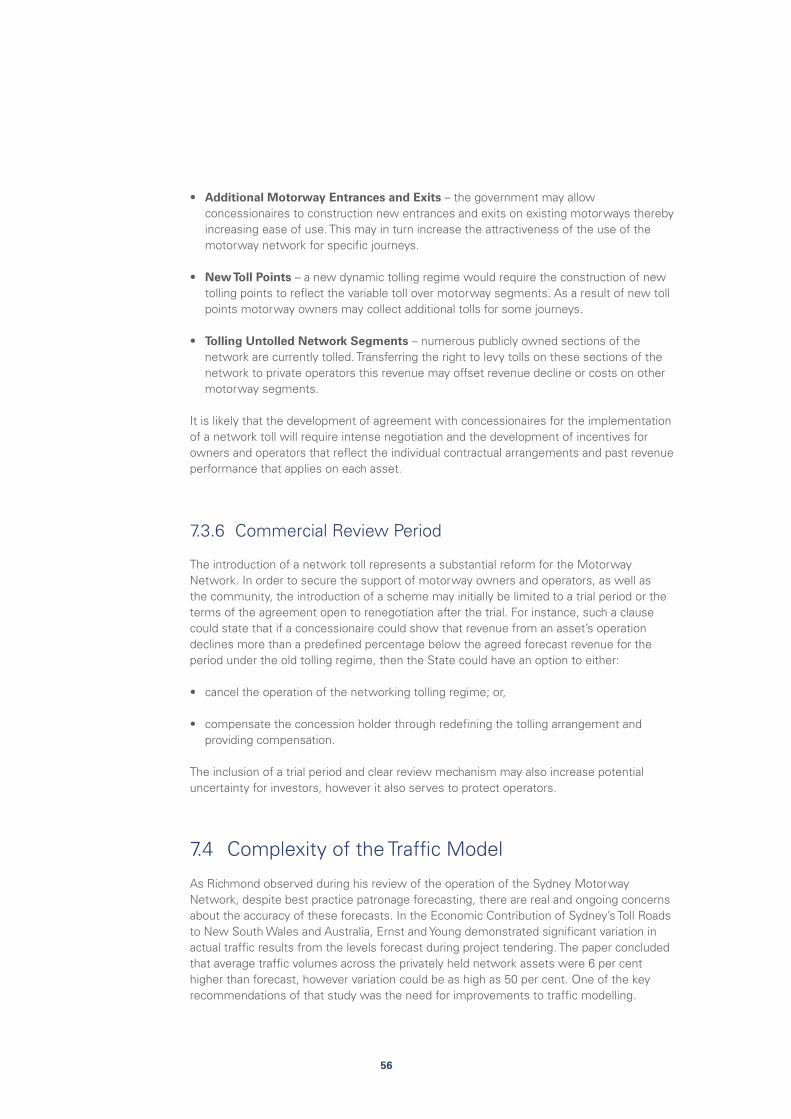
56
• AdditionalMotorwayEntrancesandExits – the government may allow concessionaires to construction new entrances and exits on existing motorways thereby increasing ease of use. This may in turn increase the attractiveness of the use of the motorway network for specific journeys.
• NewTollPoints – a new dynamic tolling regime would require the construction of new tolling points to reflect the variable toll over motorway segments. As a result of new toll points motorway owners may collect additional tolls for some journeys.
• TollingUntolledNetworkSegments – numerous publicly owned sections of the network are currently tolled. Transferring the right to levy tolls on these sections of the network to private operators this revenue may offset revenue decline or costs on other motorway segments.
It is likely that the development of agreement with concessionaires for the implementation of a network toll will require intense negotiation and the development of incentives for owners and operators that reflect the individual contractual arrangements and past revenue performance that applies on each asset.
7.3.6 Commercial Review Period
The introduction of a network toll represents a substantial reform for the Motorway Network. In order to secure the support of motorway owners and operators, as well as the community, the introduction of a scheme may initially be limited to a trial period or the terms of the agreement open to renegotiation after the trial. For instance, such a clause could state that if a concessionaire could show that revenue from an asset’s operation declines more than a predefined percentage below the agreed forecast revenue for the period under the old tolling regime, then the State could have an option to either:
• canceltheoperationofthenetworkingtollingregime;or,
• compensatetheconcessionholderthroughredefiningthetollingarrangementandproviding compensation.
The inclusion of a trial period and clear review mechanism may also increase potential uncertainty for investors, however it also serves to protect operators.
7.4 Complexity of the Traffic Model
As Richmond observed during his review of the operation of the Sydney Motorway Network, despite best practice patronage forecasting, there are real and ongoing concerns about the accuracy of these forecasts. In the Economic Contribution of Sydney’s Toll Roads to New South Wales and Australia, Ernst and Young demonstrated significant variation in actual traffic results from the levels forecast during project tendering. The paper concluded that average traffic volumes across the privately held network assets were 6 per cent higher than forecast, however variation could be as high as 50 per cent. One of the key recommendations of that study was the need for improvements to traffic modelling.
57
Figure 17
Adjustment in Traffic Levels on Motorway Network Assets Based on Actual PerformanceSource: Ernst and Young (2008)
5
16 1812
5
-53
11
-37
-60
-50
-40
-30
-20
-10
0
10
20
30
SydneyHarbourTunnel
M5 M4 M2 EasternDistributor
Cross CityTunnel
M7 Lane CoveTunnel
Orbital Asset
Per
cen
t Es
tim
ated
Ch
ang
e in
Tra
ffic
The development of a network approach for the tolling of the Motorway Network would require an integrated traffic model to facilitate a tolling regime that delivers optimal traffic levels across more than two hundred segments of the Motorway Network on daily, weekly and yearly operating cycles.
Development of a traffic model to facilitate the determination of optimal toll levels would require significant investment from the public and private sectors, building on the valuable knowledge of all participants in the network’s operations. The development of such a model would be a critical first step to the development of a network toll regime.
As with all traffic models, forecasts build from experience, so as the model is developed it will become more accurate over time.

58

59
The Sydney Motorway Network is in need of major renewal. The existing network of motorways is regularly impacted by congestion, important road links remain incomplete and pressure on the network is set to grow considerably over coming decades. A fundamental change in the way the Motorway Network is operated is required to meet these challenges and ensure the Network can provide its maximum contribution to the state’s economy.
This paper considered a range of policy options to support the implementation of a new system of pricing to maximise capacity on the Network and to provide additional revenue for investment in expanding network capacity and alternative transport options, including passenger and freight rail.
The Australian Government’s Review of a Future Tax System (Henry Tax Review) has highlighted the opportunity for national road pricing reform in Australia. The introduction of a national road pricing system should be designed to ensure the most effective use of the transport network, including the pricing of externalities. It is important that a national road pricing system balances the costs and benefits of the provision of transport infrastructure against the revenue requirements of the nation – a new road pricing system must deliver more than taxation.
Steps toward a national road pricing system are likely to be incremental and measured. Practical steps toward the introduction of tolling reform on the Sydney Motorway Network could be pursued over a shorter period. Practical steps to move to a network tolling regime might include:
• providingabasisforintegrationinfuturecontracts;
• removingexistingtollrefundschemes;
• renegotiatingexistingconcessioncontracts;and,
• theintroductionofnetworktolling.
8.1 Provide a Basis for Integration in Future Contracts
In order to facilitate the move to a network tolling environment, government should commit to engage on the basic building blocks for integration – including flexible contractual arrangements, cooperative reform to tolling arrangements and the distribution of revenues.
While the inclusion of flexibility in commercial contracts might create short-term uncertainty, the inclusion of robust, transparent principles for a future network tolling arrangement may act to increase certainty for the series of proposed projects, whose development has stalled due to significant costs.
8 The Way Forward – A Practical Option for Sydney

60
8.1.1 Determine the Basis for the Allocation of Additional Revenue
This paper has identified the likely creation of additional revenue for motorway owners, when averaged across the network, following the introduction of a network tolling regime. In order to facilitate the introduction of network tolling, the New South Wales Government must identify a preferred model for both:
• allocatingrevenuebetweenmotorwayowners–includingtheRTA;and,
• determiningpriorityprojectsforinvestmentofadditionalrevenue.
Section 7.3.3 identifies a number of potential models for the distribution of toll revenues between concession holders and the government under a network toll model. Central to the development of a model that will be acceptable to concession holders and successful over the longer term is the maintenance of revenue at levels at least consistent with levels of return under the existing concession deed. The New South Wales Government and concession holders should commence negotiations in order to determine an appropriate model for revenue sharing and compensation for disadvantaged motorway owners.
In addition to the reconciliation of arrangements for the distribution of funds between operators reflective of use, a network tolling model will facilitate investment in the development of existing and planned network enhancement projects as well as complementary projects that will enhance overall network capacity. The distribution of these funds should occur on priority basis, focused on development of projects with the greatest potential to contribute to the New South Wales economy.
In practice, this means a potential government contribution to each future projects should be considered against the contribution that project makes to the overall value of the Motorway Network. When evaluating new projects, it is important to consider the benefits to the total public and private network, especially in terms of determining the best sequencing of projects.
By increasing the capacity of motorways in the network, bottlenecks that reduce capacity on other sections of the network can be removed and traffic can be encouraged to utilise the motorway, rather than local road networks. Both these factors will alter the viability of the project, particularly if it can attract financial contributions from other directly affected network toll operators and from the public sector, compared to treating it as a stand-alone project that requires full cost recovery.
At least ten significant ‘missing links’ have been identified by the Commonwealth or state governments for development in the short term. It is essential that the New South Wales Government commits to a strategy for the prioritisation and funding of these projects.
The New South Wales Transport Blueprint, providing integrated transport and land use planning, is an important and welcome step. The industry looks forward to continuing consultation on the Blueprint and the selection of funding and procurement models to ensure its timely delivery.
61
8.1.2 Contractual Flexibility
The incorporation of provisions to support the eventual integration of these projects into a single network is an important step to ensuring a road network can be delivered at least economic cost. The rigidity of existing concession deeds, in particular the failure to provide a mechanism for negotiation of variations in contractual arrangements and the lack of any contractual review milestones and process, serve as a significant barrier to the implementation of network tolling.
To facilitate the development of an appropriate clause for inclusion in new concession deeds, the state government should consult with concession holders and, where appropriate, potential industry participants. The introduction of contract flexibility should aim to:
• provideguidingprinciplesfortheimplementationofnetworktolling;
• provideamechanismfortherenegotiationoftollingarrangementsfollowingtheintroduction of network tolling; and,
• reducecontractualuncertaintybylimitingtriggersforcontractrenegotiation.
8.2 Remove Existing Toll Refund Schemes
Cashback serves to increase demand on the M4 Western and M5 South Western Motorways, placing unnecessary demands on these assets. The scheme stimulates unsustainable levels of demand for these motorways, adding to congestion during peak periods. For instance, the M4 Western Motorway corridor consistently offers the slowest average speed across all of Sydney’s motorways.
Removal of Cashback will perform two important roles:
• ReleaseStateFinancesforAlternativeUses - this revenue could be used to support the planning and development of new infrastructure - or the design and implementation of a network tolling arrangement;
• ReduceDemandforCongestedSectionsoftheNetwork – the removal of Cashback will suppress demand for these sections of the network, reducing congestion on two of the state’s busiest roads, and further illustrating the role of pricing to manage surplus demand.
62
8.3 Renegotiate Existing Concession Agreements
The requirement for the renegotiation of existing concession agreements is a likely outcome of the introduction of network tolling. The renegotiation of these agreements will involve complex negotiation between government and concession holders.
In order to expedite these negotiations, the agreement on basic principles such as the assurance that no operator will be worse off under the new arrangement, will greatly aid resolution. The involvement of current operators in planning for integration of future contracts will also assist by clearly articulating the desired outcomes for future contracts. This should be done in advance of the more complex negotiations over changes to existing concession deeds.
Critical to the success of a network tolling regime is the commitment from all current operators of network assets to participate in the new scheme. Without this consensus, the introduction of a new tolling regime could serve to further complicate arrangements on the Motorway Network.
More work is required to determine the necessary refinements to the existing PPP contracts that would be required for a move to an integrated network.
8.4 Introduction of Network Tolling
During the implementation phase the network tolling system, the introduction will need to balance road user certainty against optimal traffic throughput. While the final implementation strategy will be dependent on considerations including technologies and the model of tolling, several guiding principles should be maintained during implementation:
• SupportingCommunityEngagement - The requirements and benefits of reform - and changes to tolling levels - will need to be clearly articulated to the community before and during implementation.
• StagedRoll-out – the introduction of the new tolling regime may be staged across vehicle classes or motorway assets, for instance the East-West Corridor, which is largely distinct from the interlinked Orbital Network. The expiry of the existing concession arrangements for the M4 Western Motorway in early 2010, may assist in the staged roll-out of a new tolling regime by avoiding the complexity of concession renegotiation.

63
9 Conclusion
The introduction of network tolling to the Sydney Motorway Network has the potential to significantly enhance the operation of the Network and deliver substantial economic, social and environmental benefits.
Network tolling provides a practical and short-term option for improving utilisation of the Sydney Motorway Network without placing substantial cost pressures on the state budget. Indeed, if well designed and implemented the development of an efficient tolling regime for the Network could potentially contribute a new revenue stream to fund infrastructure.
At the heart of reform is the fact that current arrangements satisfy neither motorists, nor government nor indeed, the private sector.
The introduction of a customer service-based model centred on the delivery of travel time certainty, reliability and predictability is a real option for the development of network tolling in Sydney. The customer-service model addresses many of the barriers to the introduction of network tolling – such as user equity and concession holder certainty – while also unleashing the maximum contribution of the network to New South Wales.
In order to facilitate the move to a more equitable system for the use of tolls on the Sydney Motorway Network, this paper recommends:
1. The New South Wales Government commit to a customer service focused model of tolling on the Sydney Motorway Network.
Government, in partnership with industry, must agree to a framework of guiding principles to govern a network toll. Principle aims of the new network tolling regime should include:
• thealleviationofcongestionontheSydneyMotorwayNetwork;
• deliveringtraveltimereliabilityandpredictabilitytousersoftheNetwork;
• thehypothecationofsurplusrevenueforthedevelopmentofpublictransportandroad infrastructure to accommodate growth in demand;
• maintainingappropriatelevelsofreturntomotorwayownersreflectingthecommercial terms of existing concession agreements and new risks that may emerge as a result of any new tolling arrangement (e.g. increased revenue leakage and costs of establishing the network).

64
2. Government, industry and the community must work together to immediately examine the implementation of customer service focused network tolling for the Sydney Motorway Network, potentially based on the implementation of a fully dynamic toll.
As an initial step, the New South Wales Roads and Traffic Authority (RTA) should form a working group, incorporating motorway owners and operators, to investigate a practical process of implementation.
3. The New South Wales Government must prepare and commit to a detailed implementation strategy, incorporating key milestones and stages to ensure smooth transition to the new scheme.
A network toll must integrate with the long-term transport plan for the Sydney region, including staging and the direction of investment of additional network toll revenue to priority public transport and road projects.
4. Implementation of reforms to the tolling arrangements must be accompanied by a community awareness campaign, outlining the proposed changes to the New South Wales community. The New South Wales Government should undertake this campaign in partnership with motorway owners and operators, together with consumer groups.
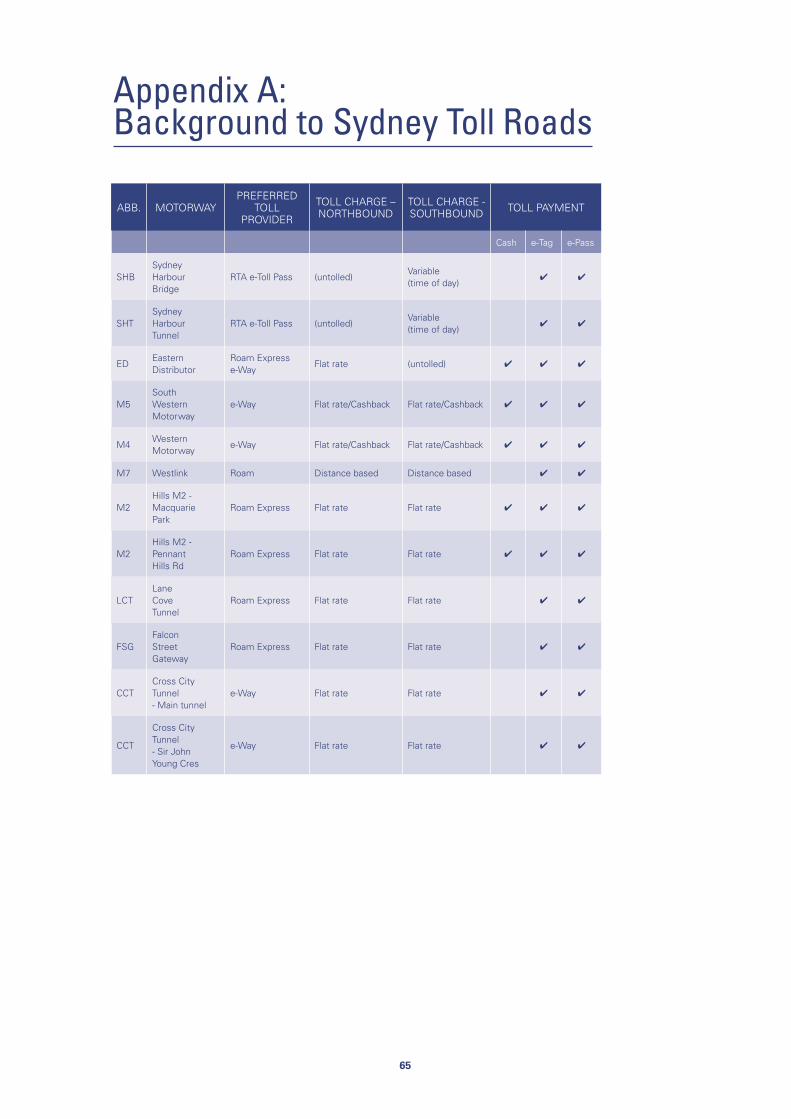
65
Appendix A: Background to Sydney Toll Roads
ABB. MOTORWAYPREFERRED
TOLL PROVIDER
TOLL CHARGE – NORTHBOUND
TOLL CHARGE - SOUTHBOUND TOLL PAYMENT
Cash e-Tag e-Pass
SHBSydney Harbour Bridge
RTA e-Toll Pass (untolled)Variable (time of day)
4 4
SHTSydney Harbour Tunnel
RTA e-Toll Pass (untolled)Variable (time of day)
4 4
EDEastern Distributor
Roam Express e-Way
Flat rate (untolled) 4 4 4
M5South Western Motorway
e-Way Flat rate/Cashback Flat rate/Cashback 4 4 4
M4Western Motorway
e-Way Flat rate/Cashback Flat rate/Cashback 4 4 4
M7 Westlink Roam Distance based Distance based 4 4
M2Hills M2 - Macquarie Park
Roam Express Flat rate Flat rate 4 4 4
M2Hills M2 - Pennant Hills Rd
Roam Express Flat rate Flat rate 4 4 4
LCTLane Cove Tunnel
Roam Express Flat rate Flat rate 4 4
FSGFalcon Street Gateway
Roam Express Flat rate Flat rate 4 4
CCTCross City Tunnel - Main tunnel
e-Way Flat rate Flat rate 4 4
CCT
Cross City Tunnel - Sir John Young Cres
e-Way Flat rate Flat rate 4 4

Infrastructure Partnerships Australia
8th Floor 8-10 Loftus Street Sydney NSW 2000T +61 2 9240 2050 F +61 2 9240 2055E [email protected]