urban growth management through travel demand modeling in
TRANSCRIPT

Journal of Traffic and Transportation Engineering 6 (2018) 255-260 doi: 10.17265/2328-2142/2018.06.001
Urban Growth Management through Travel Demand
Modeling in Washington and Oregon
Jinxiang Ren
Oregon Department of Transportation, 555, 13th St. NE, #2, Salem, Oregon 97301, USA
Abstract: Among the fast growing states in the USA, the States of Washington and Oregon have enacted legislative land use and transportation concurrency/balancing planning policies for orderly urban growth management since 1990 and 1991, respectively. Regional or urban travel demand forecasting models play an instrumental role in implementing the Washington GMA (Growth Management Act) and the Oregon TPR (Transportation Planning Rule). Both program- and project-level modeling approaches to urban land use/transportation system management are evaluated through the selected cities in Washington and Oregon.
Key words: Urban growth management, travel demand modeling, transportation planning, land use-transportation concurrency.
1. Introduction
At the beginnings of 1990s, both state governments
of Washington and Oregon anticipated significant
urban growths in the coming decades, and therefore
enacted respective legislations to mandate that the state,
regional and local jurisdictions establish their land
use/transportation concurrency or balancing processes
to effectively manage urban growth for their
community livability, economic vitality and
environmental sustainability.
The Washington GMA (Growth Management Act)
[1] states: “uncoordinated or unplanned growth lacks
of common goals, threatens the environment, impedes
sustainable economic development, and harms the
public health, safety, and high quality of life.”
Apparently, urban growths need to be planned and
managed in a coordinated way. Since land use
assumptions are used in estimating travel demand, how
will they be reassessed to ensure that transportation
LOS (level of service) standards will be met? A travel
demand forecasting model (hereafter referred to as the
Model) plays an instrumental role in assessing the
current and future land use/transportation
Corresponding author: Jinxiang Ren, P.E., MS and MUP, Sr. Transportation Analyst/Modeler; research field: travel demand forecasting.
concurrencies.
In Oregon, TPR (transportation planning rules)
Section 0060 [2] was enacted by the State of Oregon
Legislature in 1991. On the same token as GMA, TPR
requires “local governments to ensure that allowed
land uses are consistent with the identified function,
capacity, and performance standards of the facility
measured at the end of the planning period.” Four
acceptable approaches are considered best practices by
TPR, such as: “legislating consistence, mitigating
problems directly or improving alternative modes or
facility, and ‘partial mitigation’ allowed.”
2. Travel Demand Modeling for GMA/TPR
Both GMA and TPR identify the need to measure
and manage the current and future travel demand
growths for urban areas; therefore, the Model
reasonably becomes an essential “tool of the trade” as it
closely links the land use assumptions to be
implemented on transportation systems.
GMA allows regional and local jurisdictions some
flexibility to establish their own respective
transportation system LOS standards according to their
specific needs or traffic congestion allowances while
TPR requires that the local jurisdictions follow the
OHP (Oregon highway planning) mobility standards.
D DAVID PUBLISHING

256
No matter
mechanisms
Washington
regional and
adequately
performance
made by an
effects of mu
Three rep
Olympia in
are studied to
growth man
account for c
proposals, an
is modeled f
concurrency
3. Bellevue
In the last
in the City o
from 75,00
mid-80s’ to
employees,
Bellevue gro
its 20-year
1980s. In th
expanded to
Fig. 1 City o
Urban Growt
r what ur
s or approa
and Oregon
d local jurisd
measure
e changes o
individual lan
ultiple land u
presentative c
Washington,
o demonstrat
nagement is im
cumulative ef
nd how an in
for its traffic
y.
e Concurre
t 30 years, th
of Bellevue h
00 residents
currently 14
respectively.
owth, the first
downtown
he early 199
o forecast the
of Bellevue con
th Manageme
rban growt
aches are
n, without uti
dictions woul
the transpo
or significant
nd use propo
use proposals.
cities, such a
, and Grants
e how the pro
mplemented a
ffects of land
ndividual dev
impacts on t
ency Progr
he population
have almost d
and 78,000
40,000 reside
In anticipati
t Bellevue Mo
implementati
90s, the Belle
land use and
ncurrency mod
ent through T
th managem
implemented
lizing the M
ld not be abl
ortation sys
t traffic imp
sal or cumula
.
as: Bellevue
Pass in Ore
ogram level ur
and monitore
use developm
velopment pro
the transporta
am
and employm
doubled, grow
0 employees
ents and 148
ion of downt
odel was buil
ion plan in
evue Model
d network de
del build and ap
Travel Deman
ment
d in
Model
le to
stem
pacts
ative
and
gon,
rban
ed to
ment
oject
ation
ment
wing
s in
,000
town
lt for
late
was
etails
in t
resp
ther
B
purp
Con
app
proj
(cap
Mo
all
fore
with
dev
usin
Trip
pea
mod
the
both
A
Bel
of B
Cha
con
met
The
pplication.
d Modeling in
the eastside
ponse to the
refore called
BKR Mode
poses—annu
ncurrency M
proved land d
jects and th
pital improve
odel. At the pr
the annuall
ecast on the s
h and withou
velopment pr
ng the ITE (I
p Generation
ak hour veh
deling proces
concurrency
h program an
As described i
llevue annual
Bellevue’s a
apter 14.10) [
ncurrency re
thodologies, a
e TSC defines
n Washington
cities of Ki
state GMA l
BKR Model.
el serves
al concur
Model is bu
development
e city counc
ement program
rogram level,
ly approved
six-year Mode
ut CIP scena
oject, which
Institute of T
n Manual to
hicular trips,
ss is followed
model build
nd project lev
in the introdu
l Concurrency
dopted Traff
[4] establishe
equirements,
and complianc
s “concurrenc
n and Oregon
irkland and
legislation. T
.
one of th
rrency up
uilt by addi
permits or d
cil adopted s
am) to the ba
, the cumulat
d developme
del platform a
arios. For eve
is initially
Transportatio
generate 20
a developm
d as well. Fi
and applicati
vels [3].
uction of the “
y Update,” [
fic Standards
es the city’s tr
LOS sta
ce determinat
cy” whereas “
n
Redmond in
The Model is
he primary
date. The
ing annually
design review
six-year CIP
se year BKR
ive effects of
ents will be
and compared
ery proposed
estimated by
n Engineers)
or more PM
ment review
ig. 1 displays
ion process at
“2007 City of
3] “The City
s Code (TSC
ransportation
andards and
tion process.”
“the city must
n
s
y
e
y
w
P
R
f
e
d
d
y
)
M
w
s
t
f
y
C
n
d
”
t

enforce an
proposed d
cause the lev
fall below
financial c
mitigating t
within 6 yea
Under the
urban area
management
MMA land u
downtown,
mixed-use
methodology
and model
peak hour of
system inter
reserve capa
Within ea
in Table 1
intersection
reserve cap
system inter
the number
exceeds its
comparisons
Table 1 Com
Urban Growt
ordinance
development
vel of service
the city’s
ommitment
transportation
ars.”
e “Traffic St
is divided
t area), which
use characteri
commercial
MMAs. T
y, the city ca
volumes to
f 2-hour inter
rsection LOS
acities are ava
ach MMA de
[3]: Compar
LOS snaps
pacities woul
rsections exce
of intersect
s MMA all
s between
mparison of co
th Manageme
precluding
if that dev
e of a transpo
adopted stan
is in plac
n improveme
tandard Cod
into 14 M
h are classifie
istics and bou
l, industrial,
Through th
an use existi
post-process
rsection volum
S, and figure
ailable within
esignation, it
rison of con
shots, what
ld be availa
eed the TSC
tions over th
lowances. In
with and
ncurrency syst
ent through T
approval o
elopment wo
ortation facilit
ndard, unles
ce to comp
ents or strate
e,” the Belle
MMAs (mob
ed according t
undaries, such
, residential
his concurre
ng traffic co
an average
mes, calculate
e out how m
n its MMAs.
is clearly sh
ncurrency sys
percentages
able, how m
standards, an
he V/C stand
n addition,
without
tem intersectio
Travel Deman
of a
ould
ty to
ss a
plete
egies
evue
bility
to its
h as:
l or
ency
ounts
PM
e the
much
hown
stem
s of
many
nd if
dard
the
CIP
dem
ave
syst
imp
and
the
pro
tran
4. O
A
Oly
The
som
but
and
“
Rep
con
con
T
infr
not
imp
dev
line
on LOS snapsh
d Modeling in
monstrate how
erage MMA V
tem intersect
portant, the T
d analytical ap
next potent
grammed f
nsportation co
Olympia C
As the State C
ympia has a p
e city’s transp
me similarities
takes a simp
d the project l
“The City of
port” [5] stat
ncurrency an
nsistency requ
To maintain
rastructure in
allowed
provements o
velopment or w
e.
hots.
n Washington
w much the
V/C ratios an
ions over the
SC designs s
pproaches to p
tial improvem
for the city
oncurrency.
oncurrency
Capital of Wa
population siz
portation con
s to the mediu
ler approach
evel.
f Olympia 20
tes “in 1995
nalysis zones
uirements:
concurrency
nvestment and
until and
or strategies a
within 6 year
n and Oregon
CIP would
nd reduce th
e V/C standar
such modeling
proactively id
ment project
ty-wide land
y Program
ashington, th
ze of over 50,
ncurrency pro
um-sized City
at both the p
009 Annual
the city esta
s to meet
between a j
d growth, de
unless tr
are in place a
rs of when the
n 257
improve the
he number of
rd. What’s so
g mechanism
dentify where
ts should be
d use and
m
e small-sized
,000 in 2000.
ogram shares
y of Bellevue
program level
Concurrency
ablished four
two internal
jurisdiction’s
velopment is
ransportation
at the time of
e project is on
7
e
f
o
m
e
e
d
d
.
s
e,
l
y
r
l
s
s
n
f
n
Urban Growth Management through Travel Demand Modeling in Washington and Oregon
258
Annual review of concurrency management system
for cumulative effects along with annual update of
Capital Facility Plan (CFP) and Comprehensive Plan.”
The Olympia concurrency management system
utilizes the regionally developed Model to estimate the
vehicle trip growths within six years and to evaluate the
system deficiencies due to annual traffic growths and
6-year traffic growths. Within the Olympia four
concurrency zones, the 6-year future trip generation is
estimated at TAZ (traffic analysis zones) by the
regional concurrency Model.
The regional base year Model is updated and
calibrated for the existing condition. The concurrency
Model is built upon the base year model by applying
the regional 6-year land use forecasts and 6-year TFP
(transportation facility plan) projects on the model
network. Six-year traffic change forecasts will be
post-processed to the base year traffic counts for
identified intersection LOS analysis.
Two levels of service standards are established:
downtown concurrency zone allows more congestion
than the other three concurrency zones. Similar to
Bellevue, average one hour of PM peak two-hour LOS
allows traffic peak spreading over a two-hour period of
time than a single PM peak hour.
Through this travel demand modeling and average
one hour of PM 2-hour traffic analysis mechanism, the
city’s concurrency program examines potential traffic
problems and provides further verification of
transportation system improvement needs.
At a project level, a per trip cost is estimated for each
concurrency zone so that a development will simply be
charged with how many PM peak hour trips are
generated and where they are originated and destined in
terms of TAZs and concurrency zones. It’s simpler and
easier for developers to understand that the central
Olympia concurrency zone is charged higher impact
fees than other three zones.
5. Oregon Grants Pass TPR Implementation
At a program level in Oregon, each city or county
jurisdiction is required by the TPR to update its TSP
(transportation system plan), which will look into the
current travel demand through the base year model and
forecast the future 20-year travel demand within the
UGB (urban growth boundary). The financially
committed transportation improvement projects are
coded into the future demand model. The system
effects are determined and evaluated at the end of
planning period. The local TSP should be consistent
with the same land use assumptions as its
corresponding adopted RTP (regional transportation
plan).
The Oregon RTP and TSP are equivalent to the
program level land use and transportation concurrency
measures in Washington. Although the urban growth
areas are not divided further for their mobility
management areas unlike in Bellevue or Olympia, the
UGB plays an important role in containing the
development within the UGB, which will be renewed
every 10 years with the urban growth occurring. Some
cities maintain urban reserve areas for potential city
annexation to be either within UGB or city limit.
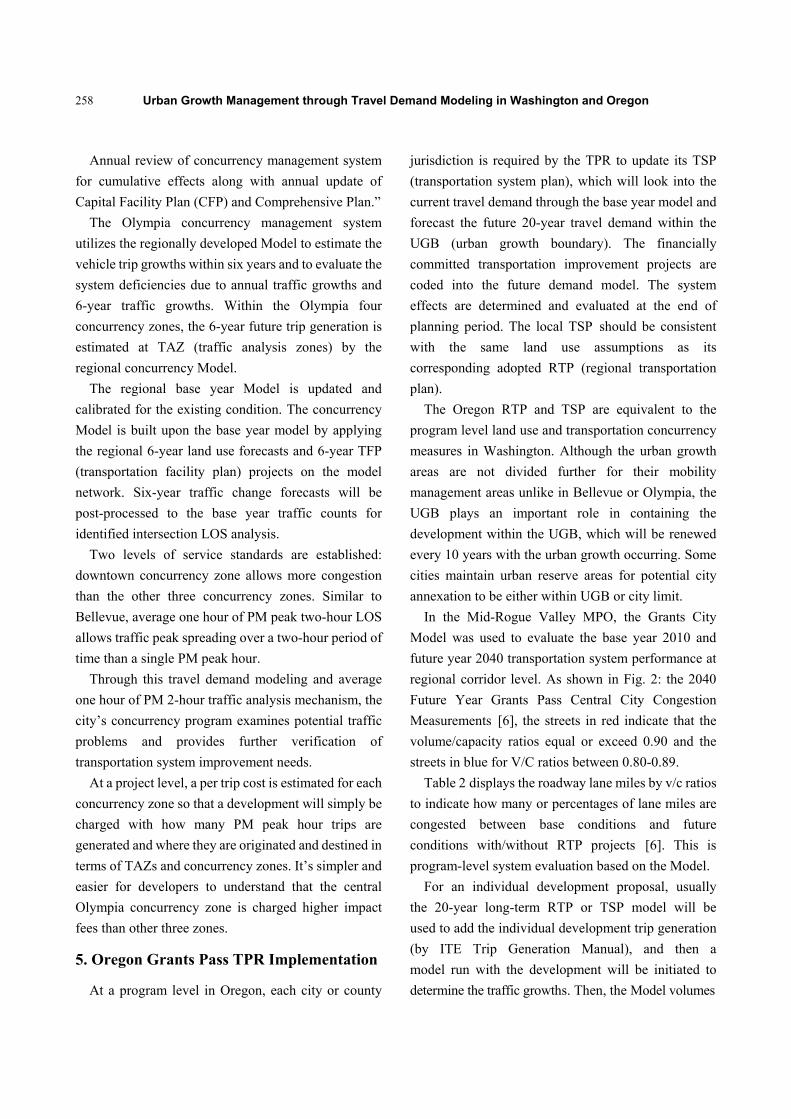
In the Mid-Rogue Valley MPO, the Grants City
Model was used to evaluate the base year 2010 and
future year 2040 transportation system performance at
regional corridor level. As shown in Fig. 2: the 2040
Future Year Grants Pass Central City Congestion
Measurements [6], the streets in red indicate that the
volume/capacity ratios equal or exceed 0.90 and the
streets in blue for V/C ratios between 0.80-0.89.
Table 2 displays the roadway lane miles by v/c ratios
to indicate how many or percentages of lane miles are
congested between base conditions and future
conditions with/without RTP projects [6]. This is
program-level system evaluation based on the Model.
For an individual development proposal, usually
the 20-year long-term RTP or TSP model will be
used to add the individual development trip generation
(by ITE Trip Generation Manual), and then a
model run with the development will be initiated to
determine the traffic growths. Then, the Model volumes

Fig. 2 The 2
Table 2 Gra
* Congestion d
are post-pr
intersection
individual p
and mitigati
system balan
6. Evaluat
Although
orderly urb
developmen
to accommo
modeling a
differences.
Both GM
DemR
Urban Growt
040 future yea
ants pass RTP
defined as mod
rocessed to
V/C ratios an
project-level
ion measure
nce at the end
tion of Mod
the common
ban growths
nt with transpo
odate the urb
approaches s
MA and TPR
0.0 - 0.590.60 - 0.69 0.70 - 0.790.80 - 0.890.90 - 0.99
> 1.0Total
mand/CapaRatio Range
th Manageme
ar grants pass c
PM peak hour
del links with de
calculate P
nd level of se
traffic impac
s are sought
d of the proje
deling Appr
n goal of GMA
s and bala
ortation syste
ban growths,
share some
R measure
LaneMiles6081212623
643
Rcity e
ent through T
central city con
r % of lane mil
emand/capacity
PM peak h
ervice. Theref
cts are identi
t to monitor
ct completion
roaches
A and TPR is
anced econo
em improvem
their respec
similarities
the concurre
e s
% of TotLane Mil
94%2%2%1%0%1%
Reference2010
Travel Deman
ngestion meas
les by V/C rati
y ration ≥ 0.90.
hour
fore,
ified
r the
n.
s for
omic
ments
ctive
and
ency
con
dev
prop
tran
TPR
for
fast
nee
whi
app
con
T
pos
traf
tal les
Lane Miles58514109915
643
N
d Modeling in
urement.
io ranges.
nditions by
velopments an
posal. GMA
nsportation co
R uses longe
its program-
ter growing u
ed to consider
ile small o
propriately co
ncurrency/bal
The cities of
st-processed a
ffic volumes f
% of TotaLane Mile
91%2%2%1%1%2%
No-RTP2040
n Washington
cumulative
nd individual
looks at short
oncurrency sy
er-term 20-ye
-level RTP a
urban commu
r short-term m
or medium-s
onsider longe
ance.
Bellevue and
average peak
for their LOS
al s
Lane Mi
592131297
15648
R
n and Oregon
effects of a
l effects of a
t-term 6-year
ystem perfor
ear future sce
and TSP. Co
munities as in
modeling for
sized cities
er terms of m
d Olympia us
k hour of PM
S snapshot to
les% of TLane M
91%2%2%1%1%2%
RTP Build2040
n 259
all approved
development
r land use and
mance while
enario model
nventionally,
Washington
concurrency
in Oregon
modeling for
se the Model
peak 2 hour
allow traffic
Total Miles%
%%%%%
9
d
t
d
e
l
,
n
y
n
r
l
r
c

Urban Growth Management through Travel Demand Modeling in Washington and Oregon
260
peak spreading effects for two-hour time period. The
Oregon cities only use the PM peak single-hour
approach to its LOS or volume/capacity ratio
calculation since its future model platform is 20-year
longer horizon, by which peak spreading may happen.
The City of Bellevue considers the actually
approved development permits and the
adopted/committed 6-year CIP while the City of
Olympia uses the regional TRPC forecast 6-year model
platform based on the regional land use forecast
assumptions. As a much faster-growing community,
Bellevue TSC monitors its land use/transportation
concurrency more strictly than Olympia’s concurrency
program; however, Bellevue commits much more
modeling resources than Olympia.
In Oregon small urban areas and MPOs, the future
year scenario land use assumptions follow the state
population and employment forecasts but are reviewed
in detail by the local planners. ODOT transportation
planning analysis unit has long maintained Models for
Oregon small urban areas and 5 MPOs to help with the
TPR implementation. Consolidated modeling
resources and approaches save public funding and are
more effective in both program- and project-level
modeling implementations.
7. Conclusion
For almost three decades, travel demand modeling
has been in effective use for urban land
use/transportation concurrency program and
development review modeling in local and regional
jurisdictions of both Oregon and Washington because
of their respective state legislations on urban growth
management.
In retrospect, the above-discussed modeling
approaches demonstrate that both program- and
project-level transportation system performance
management is made possible by using a regional or
urban travel demand forecasting model. The model
integrates land use and transportation system by
quantitatively assessing individual and cumulative
traffic impacts of developments, and measuring land
use/transportation system balancing or concurrency.
Without the Model, short- or long-term future traffic
forecasting is more like a “guessing game”; the GMA
and TPR could hardly be effectively implemented;
therefore, local and regional jurisdictions could hardly
have enjoyed the direct benefits of proactively (rather
than reactively as in the past) prioritizing their
transportation system improvements or financing
strategies to meet their system needs.
References
[1] State of Washington Laws. 1990. 1st ex. “Session.”
Chapter 17 [Substitute House Bill No. 2929] Growth
Management.
[2] Oregon State Department of Transportation. 2013.
Development Review Guidelines 2013 Chapter 3.2:
Transportation Planning Rule (TPR) Review.
[3] Ren, J., and Liljeblad, K. 2002-2007. “City of Bellevue,
Department of Transportation, Transportation Modeling
and Analysis Group.” Final Report: Concurrency Update:
LOS Snapshot as of September 15, 2007.
[4] City of Bellevue, Department of Transportation.
1993-2009. Chapter 14_10: Traffic Standards Code.
[5] Smith, D. and Ren, J. 1998-2002. City of Olympia, Public
Works Department, City of Olympia 2009 Annual
Concurrency Report.
[6] Mid-Rogue Metropolitan Planning Organization. 2016.
Chapter 11: System Performance, Regional
Transportation Plan (RTP) 2015-2040.