urban form, function and climate form, function and climate. gerald mills, dept. of geography, ucd....
TRANSCRIPT
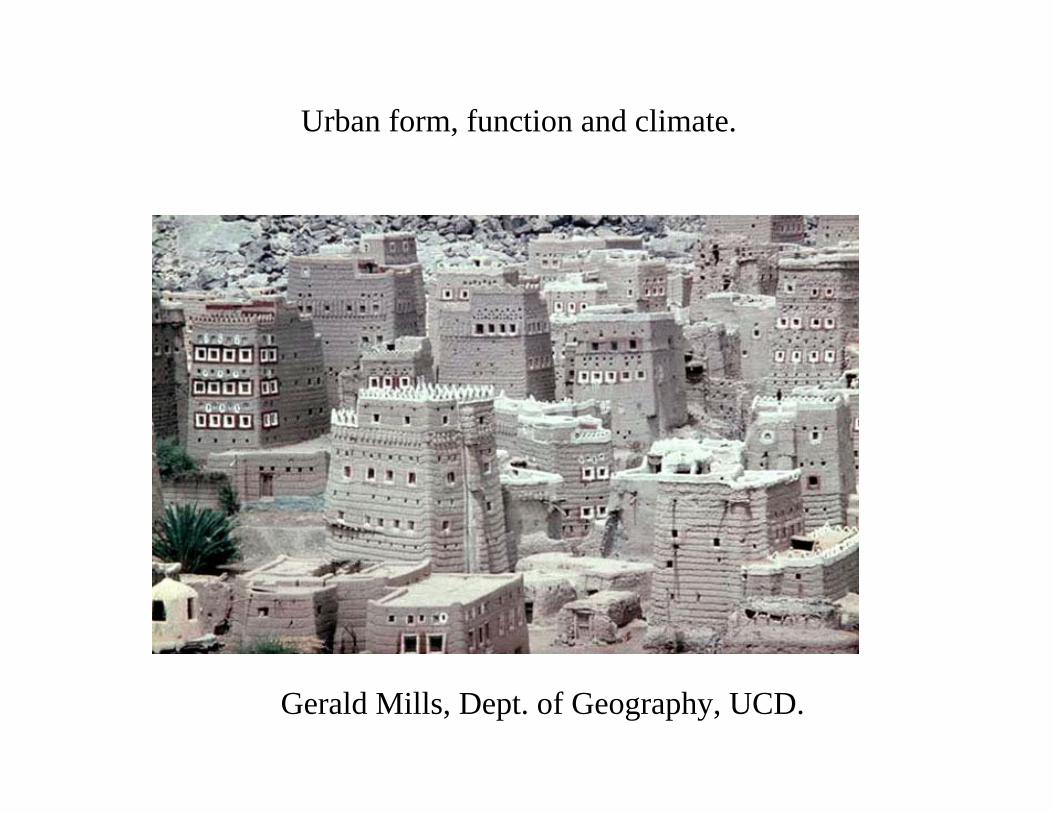
Urban form, function and climate.
Gerald Mills, Dept. of Geography, UCD.
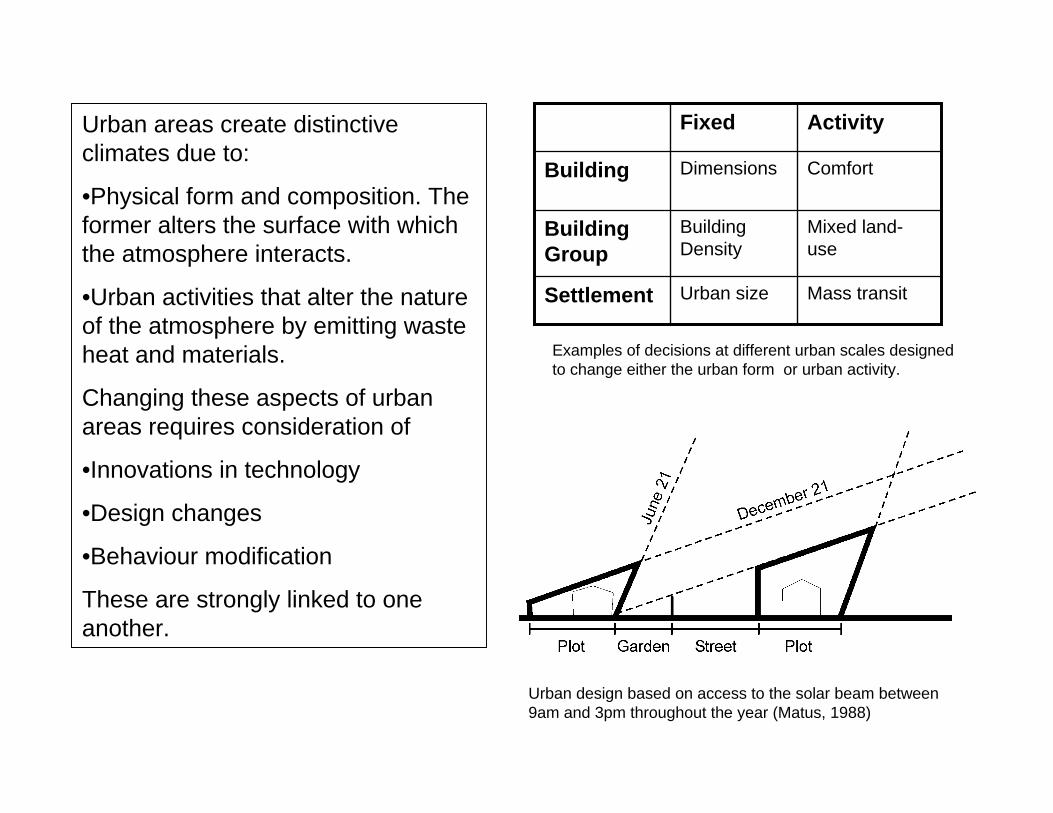
Urban areas create distinctive climates due to:
•Physical form and composition. The former alters the surface with which the atmosphere interacts.
•Urban activities that alter the nature of the atmosphere by emitting waste heat and materials.
Changing these aspects of urban areas requires consideration of
•Innovations in technology
•Design changes
•Behaviour modification
These are strongly linked to one another.
Fixed Activity
Building Dimensions Comfort
Building Group
Building Density
Mixed land-use
Settlement Urban size Mass transit
Examples of decisions at different urban scales designed to change either the urban form or urban activity.
Urban design based on access to the solar beam between 9am and 3pm throughout the year (Matus, 1988)

Applied urban climatology must interact with urban planners & designers (each with distinctive perspectives and scales of action)
Urban Design Urban Climatology Daytime Night-time Indoor Outdoor Comfort Urban effect Engineer/Artistic Science Applied Theoretical
Urban Planning Urban Climatology 2-Dimensional 3-Dimensional Conventional energy use
Renewable energy potential
Air pollution Urban effect Urban functions Urban
material/structure Population density Building density

Scales The climates of urban areas can be broadly classified into the
•Urban Boundary Layer (UBL)
•Urban Canopy Layer (UCL)
UBL: This layer of air forms above the city ‘surface’ and grows in depth downwind from the city edge. The diverse contributions of the underlying city are mixed in this layer.
UCL: This refers to the layer below roof-level and comprises enclosed and open volumes that experience varying degrees of management. A myriad of climates are to be found in this layer, each formed by immediate circumstances. This is the layer of human occupation.

Relationships between the urban physical structure and the urban effect.
The magnitude of the urban heat island can be related to the physical structure of the settlement.
12
10
8
6
4
2
00 0.5 1.0 1.5 2.0 2.5 3.0 3.5
H/W
Relationship between street geometry andMinimum temperature over Mexico City, maximum heat island intensity (Oke, 1987)November 1981 (Juaregui, 1984)
3
3
4 6
7 5
8 9
8
3 4
5
7
4 5
3
2 3
4
2
2 1 0
0 1234
2400 2400
2400
2400
28003200 2400 0 8Km
0 T
u-r (
max
.) (C
)

At the scale of the settlement transport is a critical determinant of urban form. Planners manage the functioning of the city through decisions on the transport infrastructure.
Travel time budget ( h cap-1 day-1) in numerous cities and countries throughout the world. Schafer (1998).
Range of acceptable walking distances (US cities). Most people are not willing to walk distances greater than about 220m (Dines and Brown 2001: Landscape Architect’s Portable Handbook.)

The Sustainable City
The rhetoric of sustainability is now a routine part of national and local planning.
Global and local climate issues (directly and indirectly) are inseparable from sustainability.
Urban areas are key areas for sustainable planning.
Energy use is a key measure of performance and the ideal city is described as
•Compact
•High-density
•Emphasizes sustainable transport
Density per hectare (Dph) based on a 30° obstruction to the south-facing façade of a building in the UK (H/W ≈0.6). This ensures ‘useful’ access to the direct and indirect daylight.
Place Dph Pph
UK average 25 <100
Garden City 45 125
Urban Task Force 75 125
30 Obstruction 200 500
Barcelona Centre 400 800
Hong Kong 1000 5000
Dwelling and population densities (Steemers, 2003)

The elements of a sustainable city design consider both the physical and functioning aspects of developments: mixed, high-density, land-use is presented as a means of curtailing travel demands.
‘The increase of population within city or town centres within their range of employment, recreation, educational, commercial and retail uses will curtail travel demand and therefore these locations have the greatest potential for the creation of sustainable patterns of development… to maximize .. population growth, there should, in principle, be no upper limit on the number of dwellings’ (Govt. of Ireland, Residential Density: Guidelines for Planning Authorities)
The Urban Task Force (1999) Towards an Urban Renaissance
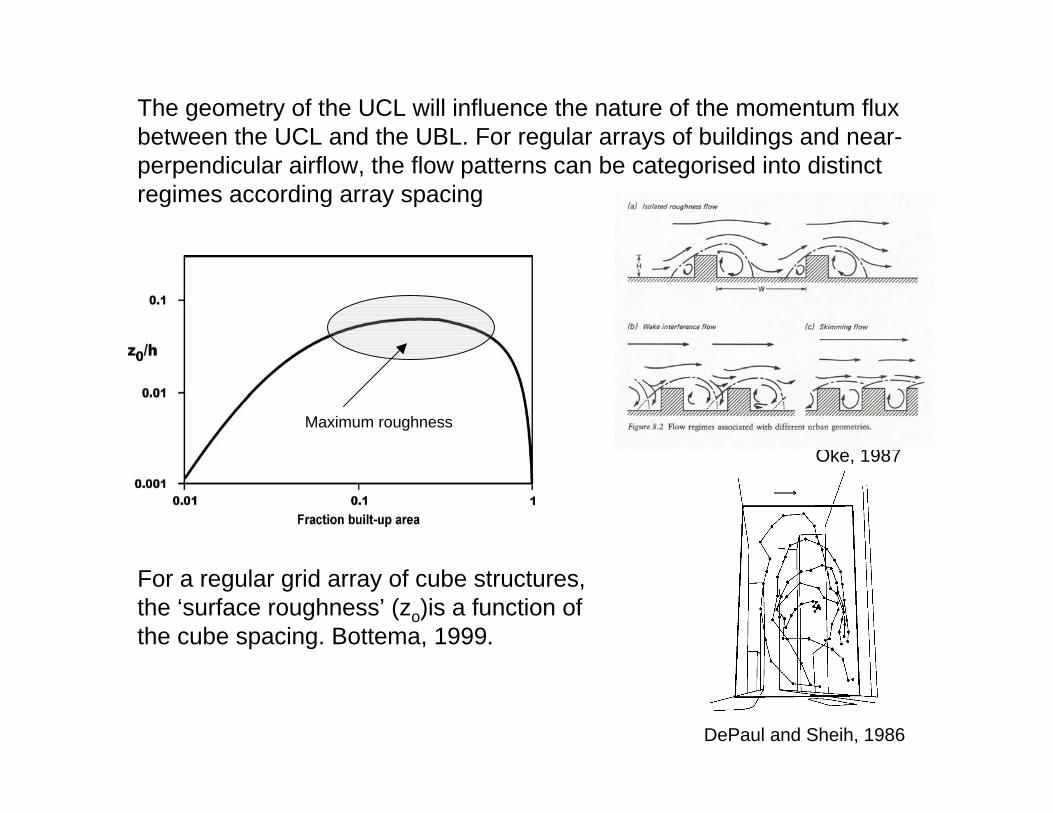
Maximum roughness
The geometry of the UCL will influence the nature of the momentum flux between the UCL and the UBL. For regular arrays of buildings and near-perpendicular airflow, the flow patterns can be categorised into distinct regimes according array spacing
Oke, 1987
For a regular grid array of cube structures, the ‘surface roughness’ (zo)is a function of the cube spacing. Bottema, 1999.
DePaul and Sheih, 1986

Urban energy use is related to another aspect of urban form. A clear relationship has been established between population density and automobile fuel consumption.
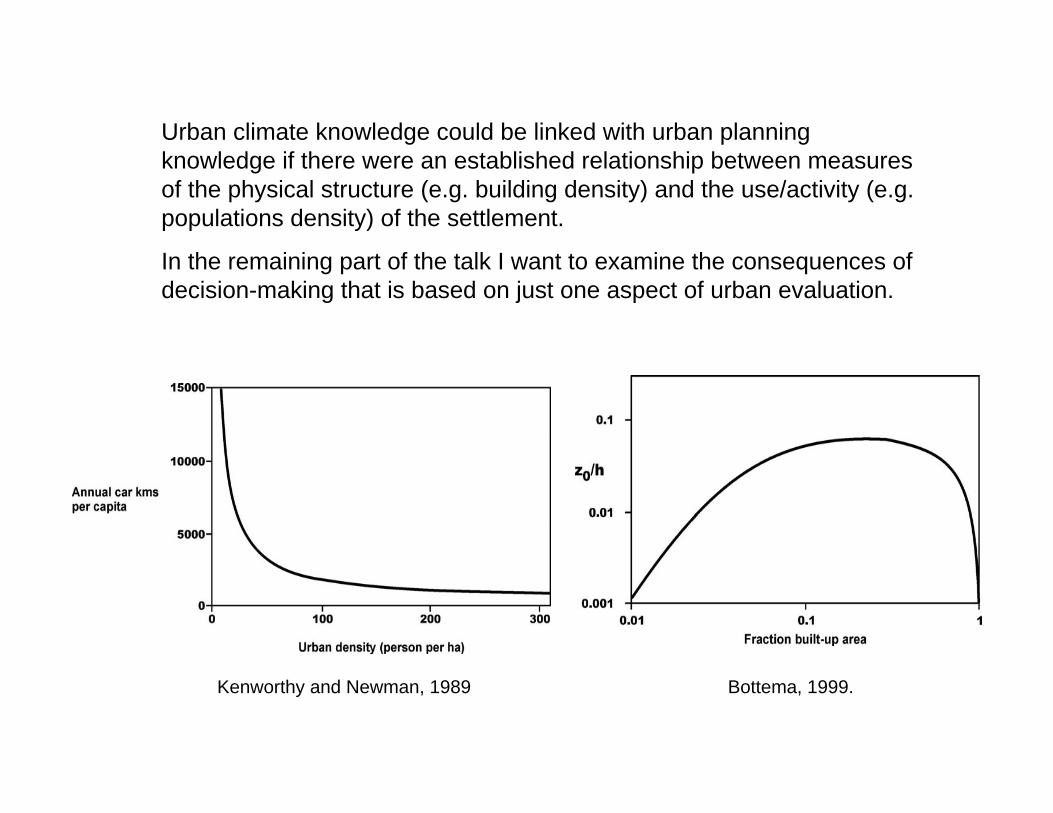
Urban climate knowledge could be linked with urban planning knowledge if there were an established relationship between measures of the physical structure (e.g. building density) and the use/activity (e.g. populations density) of the settlement.
In the remaining part of the talk I want to examine the consequences of decision-making that is based on just one aspect of urban evaluation.
Kenworthy and Newman, 1989 Bottema, 1999.

VKT = 0.045 x2
From an examination of data for a number of cities, Lyons et al. (2003) find that total car travel cost (measured in vehicle kilometers) is strongly correlated to the size of the urban area only.
As travel distance can be related to vehicle emissions, this finding can be used to estimate emissions from the city surface.
A simple UBL box model is constructed for urban areas that estimates average concentration (C) based on vehicle miles (VKT), average windspeed and mixing depth.

30+-982London (1989)
55+-2088Los Angeles (1990)
47+-1866Melbourne (1990)
80+-1787New York (1990)
63+-2298Sydney (1990)
NO x 635+-1331400New York (1990)
376+-1382100Los Angeles (1990)
467 +-1811375Melbourne (1980)
183+-571259London (1990)
PredictedObservedCO
z C
Emission (QA) is a function of total vehicle distance travelled (VKT) and a conversion factor (Pk).
Concentration (C) is a function of emissions, distance from city edge (x), windspeed (u) and depth of mixing layer (zi)
Qa = PkVKT 2 = Pk (0.0445x2
2
) 3600(24)x 3600(24)x
⎛ ⎞xC = Qa⎜⎜⎝
⎟⎟⎠ These results support the idea thatuzi
smaller settlements will consume less energy and generate less wastes.Values in µg/m3
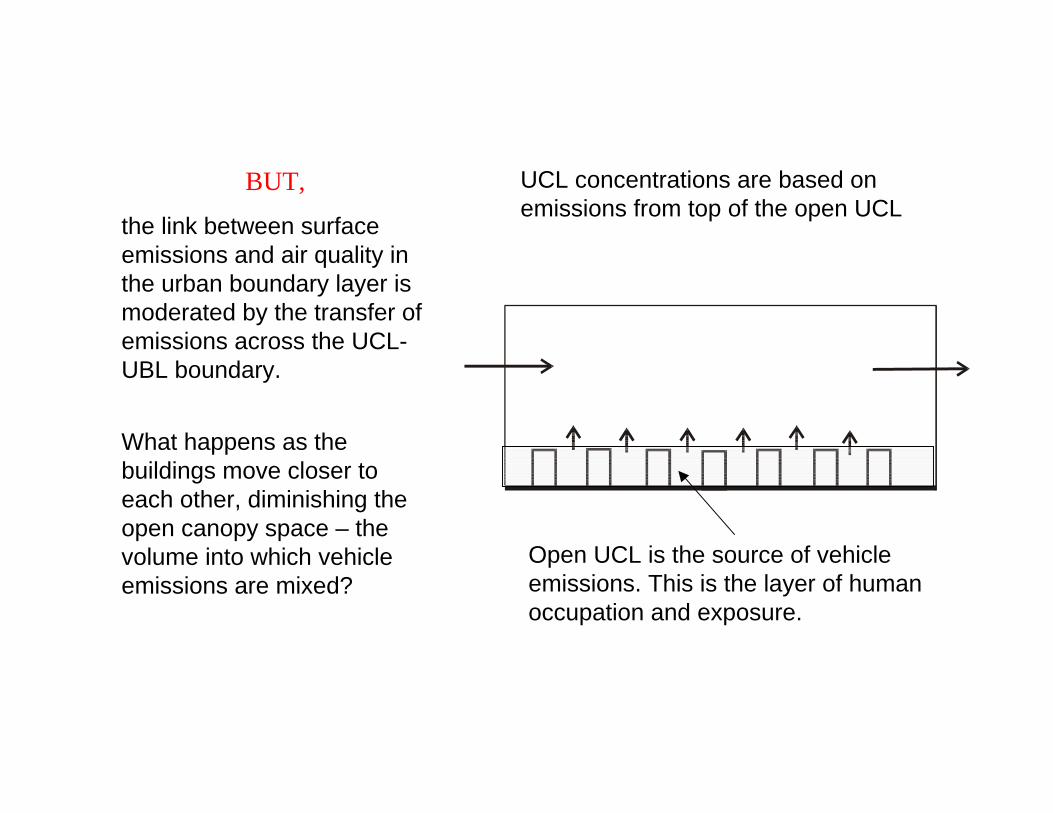
BUT,
the link between surface emissions and air quality in the urban boundary layer is moderated by the transfer of emissions across the UCLUBL boundary.
What happens as the buildings move closer to each other, diminishing the open canopy space – the volume into which vehicle emissions are mixed?
UCL concentrations are based on emissions from top of the open UCL
Open UCL is the source of vehicle emissions. This is the layer of human occupation and exposure.

The exchange between the UCL and UBL
⎟⎟ ⎠
⎞ ⎜⎜ ⎝
⎛ = ∑
floor
obstacles frontal f A
Aλ
can be assessed as a function of canopy layer structure. Bentham and Britter (2003) provide a simple means of linking air flow in the canopy with that above.
Afrontal
Afloor
Average airflow profiles above and within the urban canopy.
The structure of the UCL is expressed in terms of the frontal area density λf. The urban structure is expressed as the sum of the areas facing the airflow divided by the area occupied by the building group.

The average flow within the canopy (UC) is expressed as function of the friction velocity (u*), the roughness length (zo), the vertical plane displacement (d) and the frontal area density (λf).
The vertical exchange (UE) connects above- and within-canyon flow.
⎤ ⎥⎦
⎞ ⎟⎟⎠
⎤
⎛⎜⎜⎝
⎥⎦
⎤⎢⎣
⎡
⎡⎢⎣
UC ⎡λ f −0.5
u * = 2 for λf > 0.2
UC zo
−0.5
= u * ⎢⎣2H ⎥⎦ for λf < 0.2
U * E = 1 ln
zref − d − U
* C
−1
u k z uo
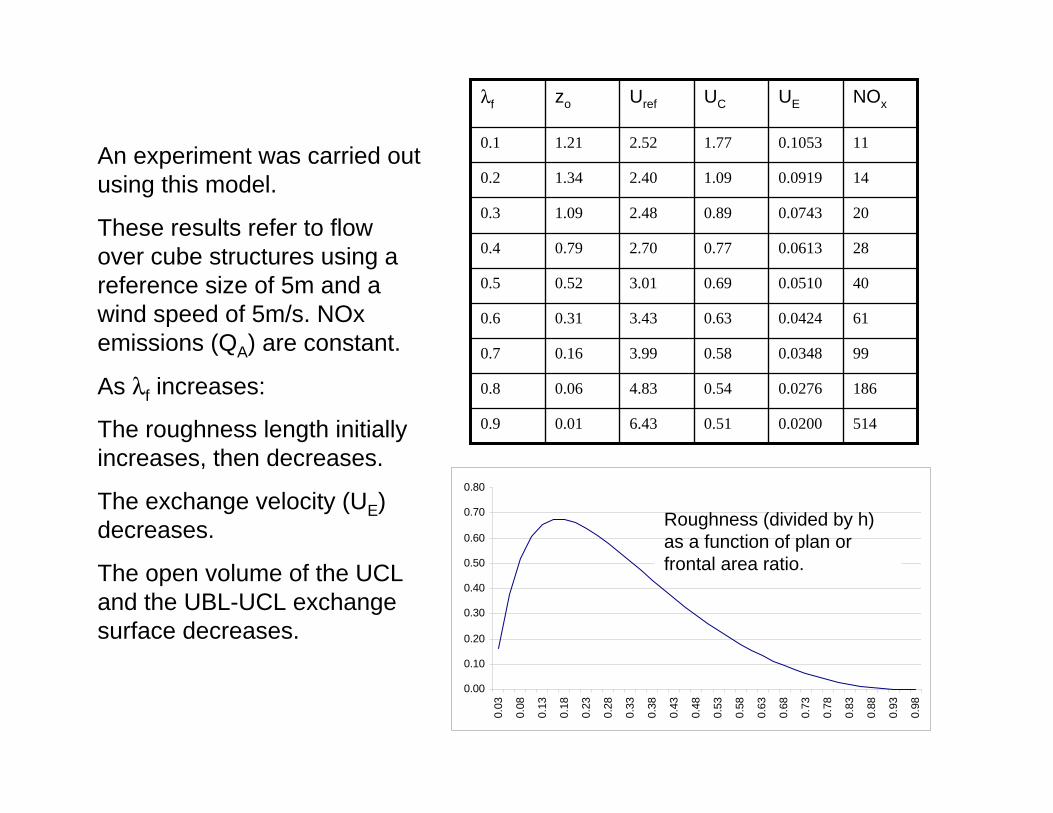
An experiment was carried out using this model.
These results refer to flow over cube structures using a reference size of 5m and a wind speed of 5m/s. NOx emissions (QA) are constant.
As λf increases:
The roughness length initially increases, then decreases.
The exchange velocity (UE) decreases.
The open volume of the UCL and the UBL-UCL exchange surface decreases.
λf zo Uref UC UE NOx
0.1 1.21 2.52 1.77 0.1053 11
0.2 1.34 2.40 1.09 0.0919 14
0.3 1.09 2.48 0.89 0.0743 20
0.4 0.79 2.70 0.77 0.0613 28
0.5 0.52 3.01 0.69 0.0510 40
0.6 0.31 3.43 0.63 0.0424 61
0.7 0.16 3.99 0.58 0.0348 99
0.8 0.06 4.83 0.54 0.0276 186
0.9 0.01 6.43 0.51 0.0200 514
0.00
0.10
0.20
0.30
0.40
0.50
0.60
0.70
0.80 0.
03
0.08
0.13
0.18
0.23
0.28
0.33
0.38
0.43
0.48
0.53
0.58
0.63
0.68
0.73
0.78
0.83
0.88
0.93
0.98
Roughness (divided by h) as a function of plan or frontal area ratio.

1−λf
C
UE
180
160
140
120
100
QA80
60
40
NOx concentrations (µg m-3)
Residence time (s)
⎛⎜⎜
⎞⎟⎟
−7 202(5.15 x10 )C = 0
0.03
0.08
0.13
0.18
0.23
0.28
0.33
0.38
0.43
0.48
0.53
0.58
0.63
0.68
0.73
0.78
0.83
0.88
U E (1 − λ f )⎝ ⎠
In this example, increasing building density, increases the residence time of vehicle pollutants within the UCL and decreases the volume of air into which they are mixed. The result is increased concentrations within the UCL.
This suggests that compact, high density urban developments must consciously incorporate roughness into their design.
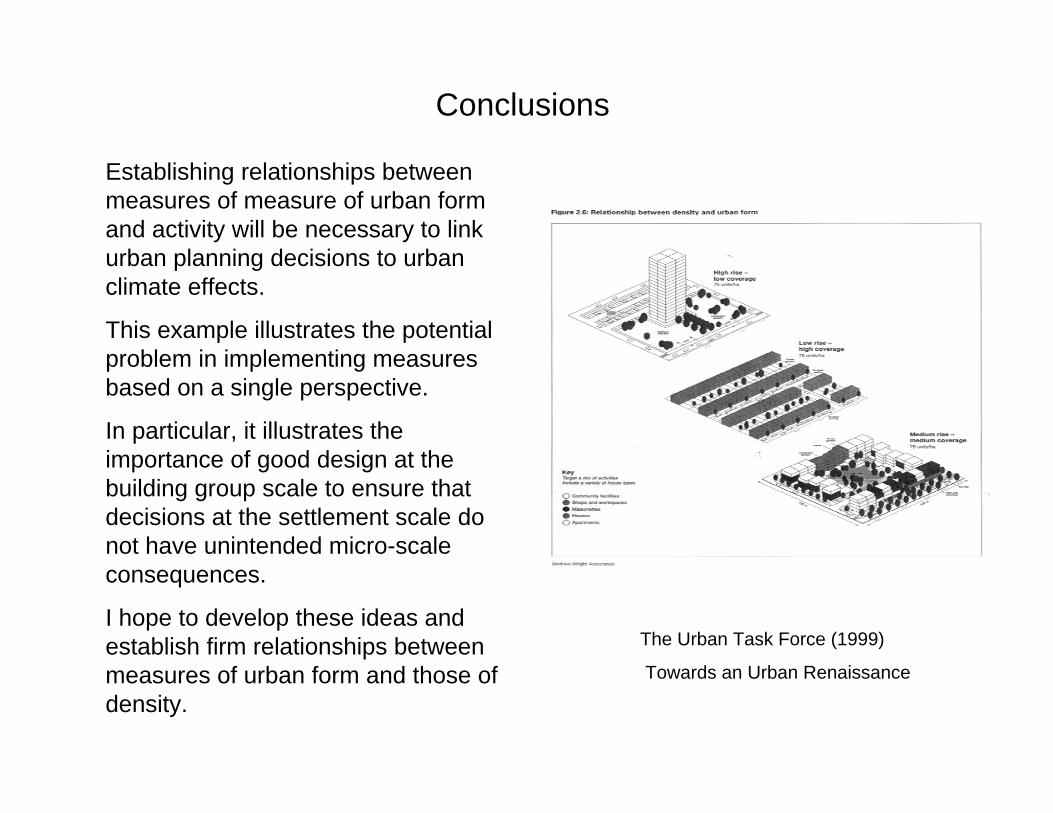
Conclusions
Establishing relationships between measures of measure of urban form and activity will be necessary to link urban planning decisions to urban climate effects.
This example illustrates the potential problem in implementing measures based on a single perspective.
In particular, it illustrates the importance of good design at the building group scale to ensure that decisions at the settlement scale do not have unintended micro-scale consequences.
I hope to develop these ideas and establish firm relationships between The Urban Task Force (1999)
measures of urban form and those of Towards an Urban Renaissance
density.