urban climates and global environmental change mem 05.pdf · urban climates and global...
TRANSCRIPT

1
Urban Climates andUrban Climates andGlobal Environmental ChangeGlobal Environmental Change
Matthias Roth, Dept. of Geography, NUS Matthias Roth, Dept. of Geography, NUS 4 March 2005, MEM4 March 2005, MEM--NUSNUS
DMSP: 27 Nov 2000; R. Simmon (NASA/GSFC)
Outline
• Context
• Urban Climates local examples
global examples
• Urban Climates and GEC

2
Context
• For the first time about half of the world's population is living in urban areas: [Figures according to the UN's World Urbanization Prospects: The 2001 Revision.]
2000 2030• Urban population 47% (2.9 b) 60% (5 b)
• 95% of growth will be in less developed countries60% of growth over next 3 decades will be in Asia (China and India)
• By 2015, 16 of the world's 24 megacities (cities with more than 10 million people) will be located in Asia
• The urban transition now underway in Asia involves a volume of population much larger than any other region in the world and is taking place on a scale unprecedented in human history.
• How sustainable?
• Several of urban environmental problems are directly or indirectly related to the climate of these cities.
• Urbanization initiates one of humanity’s most dramatic land use changes.
• Nature of urban climates needs to be understood to able to improve conditions and mitigate potential adverse effects.
• Understanding urban climates in terms of their impact or response to GEC, e.g. lessons to be learned for global climate change?
• Prediction of future urban climates: What will be the nature of future cities and what will be their influence on the regional and global climate?
Issues
“Cities represent potential ‘laboratories’ in which to studyclimate change and could be one of the most effective
agents to mitigate unwanted change”. (Oke 1997)

3
IGES/APN Mega-City Project Workshop January 23-24, 2002, Kitakyushu, Japan
Contrast between “ideal” and “non-ideal” environments
Urban effects on climate
Urbanization produces radical changes in the nature of the surface and atmospheric properties of a region through introduction of new surface materials, the creation of the urban canopy and the emission of heat, moisture and pollutants:
• Radiative: Albedo, emissivity, sky view factor
• Thermal: Thermal admittance, heat capacity (massive storagefor heat)
• Moisture: ‘Sealing’ of evaporating surfaces (less moisture)
• Roughness: Obstacles (buildings, trees) increase turbulent transport
• Emissions: Aerosols and greenhouse gases due to combustion offuels, industry, cars, etc. affect the radiative transfer andact as condensation nuclei; injection of waste heat
New microclimate (each apparently minor change is an incrementalcontribution to the creation of a new climate at a larger scale)

4
Scales and layer of the urban atmosphere
Cities affect climates at the local (< 1 km horizontally; < 100 m vertically) and meso (< 100 km horizontally; < ~1 km vertically) scales.
Oke, 1997: The Surface Climates of Canada
Mesoscale
Local scale Microscale
Local advection
Advection occurs at the local (a) and micro (b) scales(After Oke 1997)
5
Urban effects on climate - Thermal
• Arises from differences in urban/rural cooling rates
• Most pronounced at night under clear skies with light winds
• Several types of UHIs can be defined depending on location. Air T vs.surface T UHI!
What do you get if:
• extra heat sources (fires etc.)
• relative dryness (reduced evaporation)
• shelter in the streets (reduced convection)
• obstructed horizon (less free to radiate heataway)
• multiple reflection between walls (betterabsorption)
• thermal inertia (the city warms and coolsmore slowly)
• greenhouse effect of pollution
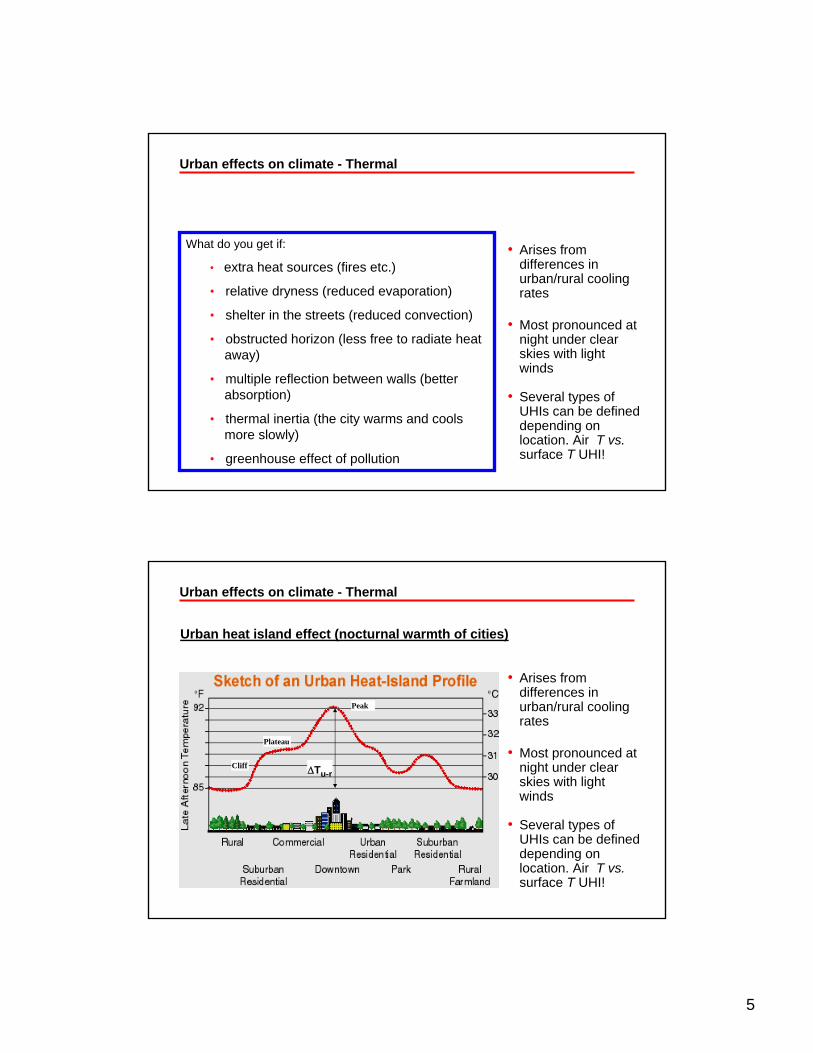
Urban effects on climate - Thermal
Urban heat island effect (nocturnal warmth of cities)
∆Tu-r
Peak
Plateau
Cliff
• Arises from differences in urban/rural cooling rates
• Most pronounced at night under clear skies with light winds
• Several types of UHIs can be defined depending on location. Air T vs.surface T UHI!

6
Definition of “surface”
(From Voogt 1997)
IGES/APN Mega-City Project Workshop January 23-24, 2002, Kitakyushu, Japan
SUBSTRATE
AIR
SURFACE
UCLUBL
Fixed- tower, sodar
Standard- grass
Non-standard- roof, roadside
‘True’ 3-D T°- complete surface
Bird’s-eye 2-D T°- aircraft, satellite
Zero-plane T°- model output
Ground T°- road
Traverse- aircraft, tetroon
Fixed- screen
Traverse- automobile
Classification of heat island types
7
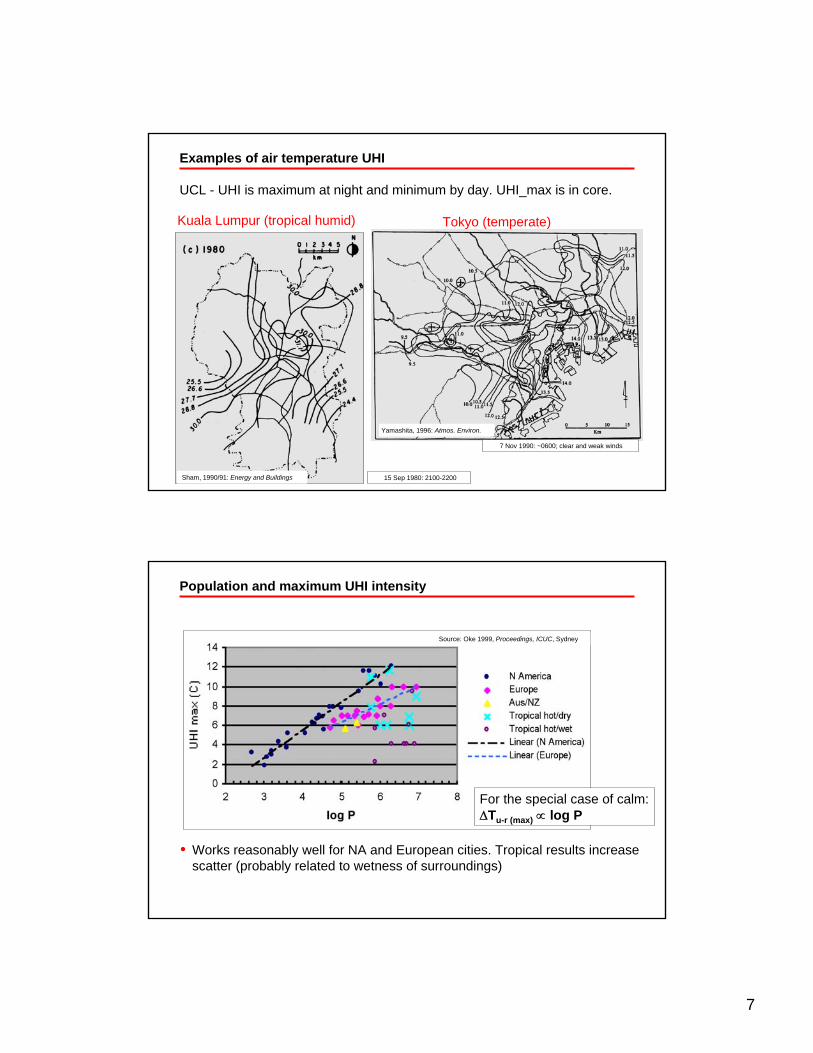
Examples of air temperature UHI
UCL - UHI is maximum at night and minimum by day. UHI_max is in core.
Tokyo (temperate)
Sham, 1990/91: Energy and Buildings
Yamashita, 1996: Atmos. Environ.
Kuala Lumpur (tropical humid)
15 Sep 1980: 2100-2200
7 Nov 1990: ~0600; clear and weak winds
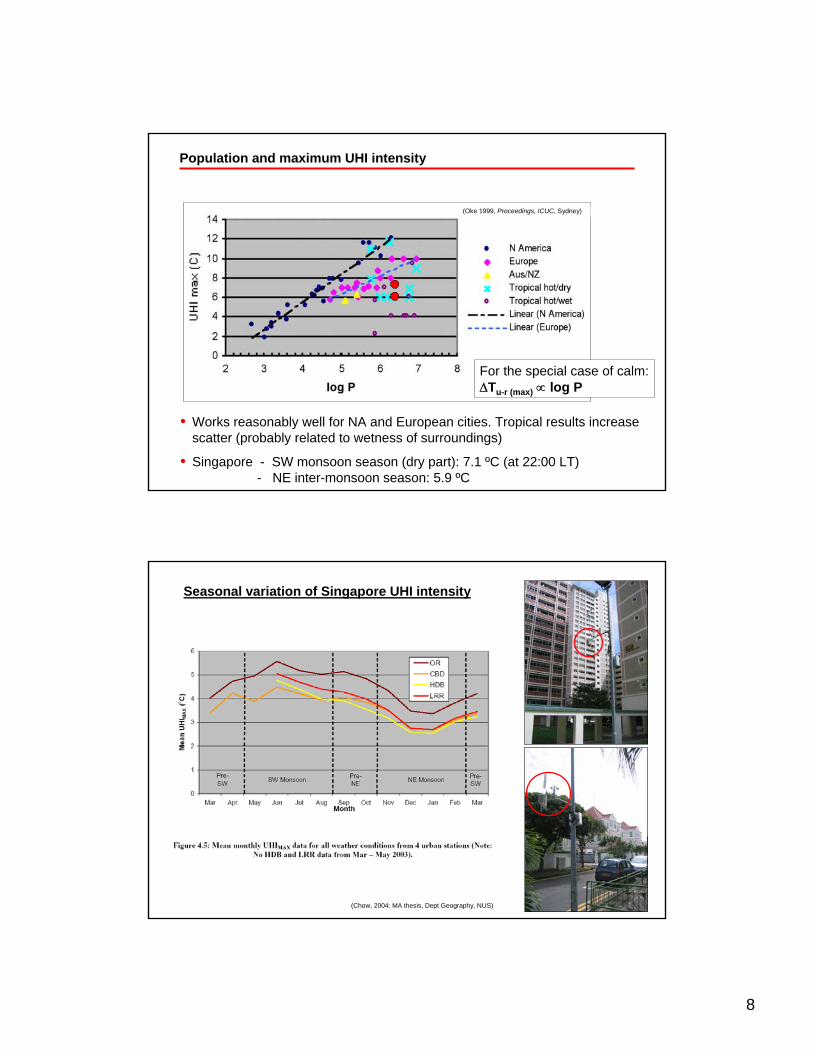
Population and maximum UHI intensity
For the special case of calm: ∆Tu-r (max) ∝ log P
• Works reasonably well for NA and European cities. Tropical results increase scatter (probably related to wetness of surroundings)
Source: Oke 1999, Proceedings, ICUC, Sydney
8
Population and maximum UHI intensity
For the special case of calm: ∆Tu-r (max) ∝ log P
• Works reasonably well for NA and European cities. Tropical results increase scatter (probably related to wetness of surroundings)
• Singapore - SW monsoon season (dry part): 7.1 ºC (at 22:00 LT)- NE inter-monsoon season: 5.9 ºC
(Oke 1999, Proceedings, ICUC, Sydney)
Seasonal variation of Singapore UHI intensity
(Chow, 2004: MA thesis, Dept Geography, NUS)

9
Surface temperature UHI at different scales
Above: Visible (left) and thermal (right) images of sections of Baton Rouge, LA. Yellow and red areas are hot and generally correspond with roads and buildings; blue and green areas are cool and indicate water and vegetation. The bright red (dark green) areas are about 65 ºC (25 ºC). [From: http://wwwghcc.msfc.nasa.gov/urban]
Left: [From:http://Satellite.Zodiak.com/destination/frames_version/mapping/map_scales/building_scale.html]
Surface - UHI is maximum by day and minimum at night. Largest values are in areas of large buildings (in terms of area) or large paved surfaces:
Daytime surface temperatures in Singapore
1º 17’ N / 103º 51’ EApril 28, 2000 (11:09 LT)
Traverse route
CRISP-NUS: Landsat-7

10
50km
Daytime Nighttime
50km 50km
(Source: Jin, AGU2003)
Day- and nighttime surface temperatures in Beijing
Urban effects on climate - Winds
Airflow
The city is one of the roughest surfaces known and as whole affects regional flow:
• Weak winds: Thermal effects dominate resulting in flow towards warmcity
• Strong winds: Convergence causes uplift over city; reduced Coriolisturning force; disruption of mesoscale and synoptic weather fronts, cloud development and perhaps precipitation
Turbulence• Increased friction and heat result in perturbations of wind and turbulence
• Increase in turbulence intensity (up to 50%); implications for dispersion of pollutants, wind engineering

11
Flow around buildings
Vortices, turbulent wakes and cavities are typical characteristics of flow around buildings.
(From: http://www.newmerical.com/Home-english/Faq/Airwake4.html)
(After Woo et al. 1977)
Anomalously high concentrations of:
• Aerosol particle (e.g. from SO2 and NO2 emissions, diesel trucks,smoke particles)
• Radiatively active gases (e.g. ozone, carbon dioxide) which interferewith the transmission of solar (depletion) and infrared radiation
• Up to 85% (?) of greenhouse gases are emitted by cities
• Pollutants such as sulfates and sulfuric acid increase the number ofsmall CCN and hence water droplets in clouds.
These small droplets float in the air with a low probability ofbumping into each other and coalesce into raindrops largeenough to fall to the ground before they evaporate.
Urban effects on climate - Pollution

12
Conditions to produce rainfall are enhanced in the urban atmosphere:Convergence of air flow due to roughness, UHI and more CNN.
Observational evidence shows that a large city modifies clouds and precipitation in its vicinity (e.g. METROMEX project in St. Louis) but much remains to be done to develop a full understanding of the physical mechanisms.
Does air pollution suppress or enhance overall rainfall amount from convective clouds? Particulate air pollution acts to delay conversion of cloud water into precipitation:
Convective precipitation processes are delayed to greater heights in the clouds, respectively delay the downdraft and allowing the clouds to invigorate further. This causes:• In dry and unstable conditions: Reduced precipitation due to very low
precipitation efficiency.• In tropical and moist subtropical conditions: Enhanced storm vigor,
secondary cloud formation overcompensates the reduced precipitationefficiency and leads to more overall rainfall.
Urban effects on climate - Precipitation
Conceptual model of increase in summer precipitation due to pollution
UHI produces convergence which together with pollution's interference with raindrop formation interacts to cause the clouds to intensify before producing precipitation.
Air pollution delays onset of precipitation, so that the intense storm clouds can build higher and larger before they start precipitating.
These larger and more intense thunderstorm clouds produce eventually heavier rainfall on the city and the downwind areas.
(Credit: NASA)
QuickTime™ and aYUV420 codec decompressor
are needed to see this picture.

13
Higher rainfall areas downwind of major cities
From Tropical Rainfall Measuring Mission (TRMM) satellite.Credit: Jim Williams, Scientific Visualization Studio, NASA’Goddard Space Flight Center
Higher rainfall rates (in blue) depicted here are taken from measurements of mean monthly rainfall during the warm season (May - September) during 1998-2000.
U
U
Ground observations of rainfall trend in Mexico City
(From Jauregui, E. and Romales E., 1996: AE 30, 3383-2289)
urban stationrural station
14
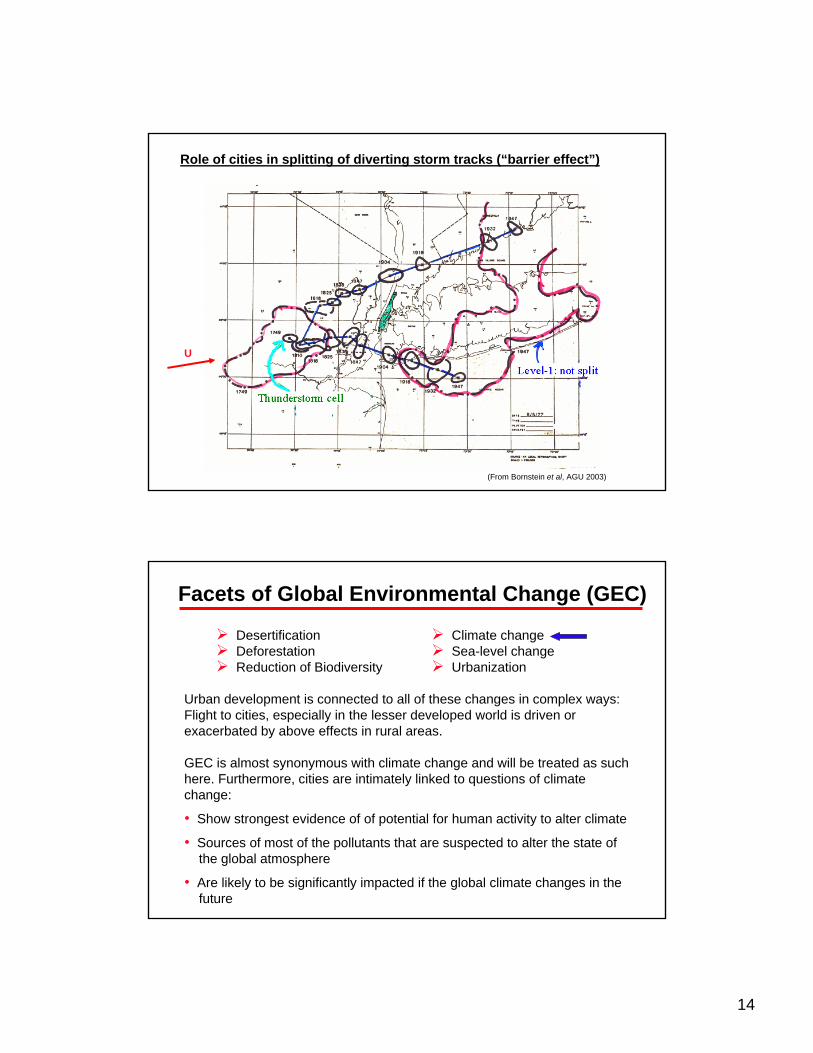
Role of cities in splitting of diverting storm tracks (“barrier effect”)
(From Bornstein et al, AGU 2003)
U
Facets of Global Environmental Change (GEC)
DesertificationDeforestationReduction of Biodiversity
Urban development is connected to all of these changes in complex ways:Flight to cities, especially in the lesser developed world is driven or exacerbated by above effects in rural areas.
GEC is almost synonymous with climate change and will be treated as such here. Furthermore, cities are intimately linked to questions of climate change:
• Show strongest evidence of of potential for human activity to alter climate
• Sources of most of the pollutants that are suspected to alter the state ofthe global atmosphere
• Are likely to be significantly impacted if the global climate changes in thefuture
Climate changeSea-level changeUrbanization

15
Level of understanding of variables affecting the global climate varies in the weather/climate change assessment and prediction!
How Is Urbanization Affecting Earth’s Climate?
Change in:
• Land-use
• Aerosol content
• GHG conc.
Urban climate and global warming
• The UHI grows with time likeobserved global warming
• So, is global warming due to cities?- directly, no - area of extra heat toosmall (< 1% of global surface)
- indirectly, yes – source of most GHGs and aerosol (85%?)
• Side issue – global record may becontaminated by inclusion of urbanstations (wrong scale of effect)
• Cities have seen size of thermal changes projected for the future at global scale, and have adapted tothem: Cities as “laboratories” to studyimpact of global warming? E.g. PhoenixCO2 dome (50% above av. conc.)

16
“Global” urban heat island effect?
• Comparison of surfacetemperatures of urban andnearby forests
• Cities have higher surface Tthan forests
(From Jin, AGU 2003)
Urban climate and global warming - consequences (I)
Impacts of urban heat islands on temperature-sensitive aspects of cities in cold and hot regions:
Climate impactCold Hot
Biological activity (plant growth, disease) + ?
Human bioclimate (comfort, wind-chill, heat stress) + (W) / - (S) -
Energy use (space heating, air conditioning) + (W) / - (S) -
Water use (garden irrigation – pos. correlation with T) - -
Ice and snow (transport disruption) + NA
Air pollution chemistry (weathering, photochemistry) - -
+ = benefitial; - = undesirable; (W) = winter; (S) = summer
Oke, 1997: Applied climatology: principles and practice

17
Urban climate and global warming - consequences (II)
Human bioclimate
• Extra warmth is useful in cool,but a burden in hot, climates
• Projected bioclimates in warmerworld suggest:
- increasing discomfort - increasing strokes and heat-- related deaths- tropical world, where growth
is greatest, is most at risk
Biological activity
• Activity is stimulated by warmth. Change in flora, fauna and disease.
Shanghai, 1980-1989; threshold at ~34 ºC?(From Oke 1997, after Kalkstein and Smoyer 1993)
Maximum temperature vs. daily mortality
The impact of weather is relative rather than absolute.
(From Kalkstein, 2004)
New York Jacksonville

18
Cook County, Illinois: July, 1995
During the hottest days, mortality increased by over 100 %
(From Kalkstein, 2004)
0
100
200
300
400
500
1 5 9 13 17 21 25 29
Day
Dea
ths
Urban climate and global warming - consequences (III)
Air pollution• Extra warmth boosts rates of:
- chemical reactions- emissions – HC from vegetation &
fuel, NOx from power stations• Photochemical concentrations worsen
Energy use• Extra warmth reduces demand for
space heating but increases it for cooling• Air-conditioning:
- increases heat burden outside- power plants increase heat andpollutants (incl. GHGs)
Los Angeles, US for every day in 1986 at 4 pm(From Oke 1997, after Akbari et al 1989)
(From Oke 1997, after Wackter and Bayly 1988)
Connecticut, US

19
Urban areas affect aerosol composition and transport
(From Shepherd et al 2004)
Terra
Regional pollution transport
QuickTime™ and aGIF decompressor
are needed to see this picture.
• Air mass carryinganthropogenic pollution(sulfate - SO4) andyellow sand (kosa) frommainland Asia towardsthe Pacific Ocean andover Japan
• Common scenarioduring wintertime
(From Uno 2005)

20
“Global” pollution transport
• Trans-Pacific transport ofsatellite-visible tracer(yellow sand) - known toimpact Asian anthropogenicpollutants (1998)
• Trans-Pacific transport ofaerosol (2001)
(From Uno 2005)
Ecological footprint of cities
Not just area physically occupied but also area that contributes resources and, in turn, is affected by and produces waste and pollutants.
Positive: Economic growth associated with cities
Negative: Infrastructure cannot keep pace with speed of growth. Cities are large point sources of pollution plumes containing GHGs, ozone precursors and aerosols which potentially affect the atmosphere on a global scale.
SOURCEbiophysical processesDepletionPollutionDisturbance
SINKbiophysical processesPollutionDisturbance

21
IGES/APN Mega-City Project Workshop January 23-24, 2002, Kitakyushu, Japan
The Urban System Interactions between the city, human environment and biophysical environment
INPUTSEnergy MoneyFood InformationWater Raw MaterialsManufactured goods
HUMAN THE CITY BIOPHYSICALENVIRONMENT ENVIRONMENTPeople Physical Structure Atmosphere & Energy FlowsEthnicity Building Type Hydrological CyclePolitics Layout Soils, Vegetation, FaunaTechnology Geology & Landforms
OUTPUTSWastes EmploymentLiquids WealthSolids Manufactured GoodsGases Degraded Energy
LINKS TO Urban SystemsOTHER Rural Systems
RegionsTransport Communication
(From Bridgman et al, 1995)
Urban and rural population, 1950-2030
(Source: UN, World Urbanization Prospects 2001)