urban air quality and transportaion
TRANSCRIPT

CONTEXTUALIZED TO KATHMANDU VALLEY
Prepared BY: Er. Bishnu Pd. Devkota
067MST258

Introduction Objective of the Study Literature Review Research Methodology Historical Background: Kathmandu Valley Present Issues: Kathmandu Valley Analyzing the data Future Forecast: Kathmandu Valley Results Conclusions/Recommendations References

Urbanization: to make an area of countryside or a village into a town (Encarta® 2008)
Air Pollution: addition of harmful substances to the atmosphere resulting in damage to the environment, human health, and quality of life. (Encarta ® 2008)
The major source of air pollutant in many urban area is found as the exhaust from vehicles.
The previously completed research works about the air pollution in Kathmandu valley shows the transportationas the major source of pollution.
I have reviewed more than 10 research reports about Kathmandu valley and additional 10 reports from various parts of the world. This means that the data presented in this presentation are secondary data. To get more data I have visited a lot of government and other official websites that are listed in the references.

The main objective of this study is to extract the major issues or sources of air pollution within the transportation mechanism in the context of Kathmandu valley and conclude for some reasonable recommendations
It also has the following objectives:
To collect various types of air pollution parameters
To evaluate the major sources
To describe the transportation as a source of air pollutant
To collect the major causes of air pollution within transportation system
To evaluate the causes on the basis of secondary data
To provide some recommendations
Urban transport and environment in Kathmandu Valley by Shobhakhar Dhakal, Japan
Air pollution and role of urban transportaion in Kathmandu Valley by Nawaraj Khatiwada(SchEMS and MOPE)
Assessment of ambient air quality in Bishnumaticorridor, Kathmandu metropolis
Kathmandu university medical journal (2003) vol-1, no.4, Issue 4
Climate and air quality : a case study by Sunil Pokhrel, University Edwardsville
CIA: Asia network, vol-5

GEOGRAPHY
oValley area: 640 sq. kmo Floor area: 400 sq. km
•Kathmandu – metropolitan city•Kirtipur – municipality•Lalitpur – sub-metropolitan city•Bhaktapur municipality•Madhyapur municipality•VDCs

Source: July 2004, IGES

Transportation Sector City transportation and long distance travel Vehicular emission Resuspension of particles Solid wastages dumped on the road
Industry Brick kilns Cement factory
Construction activities 3000 houses per year (1990-2000)
Other sources Air transport Tyre burning

Source: July 2004, IGES
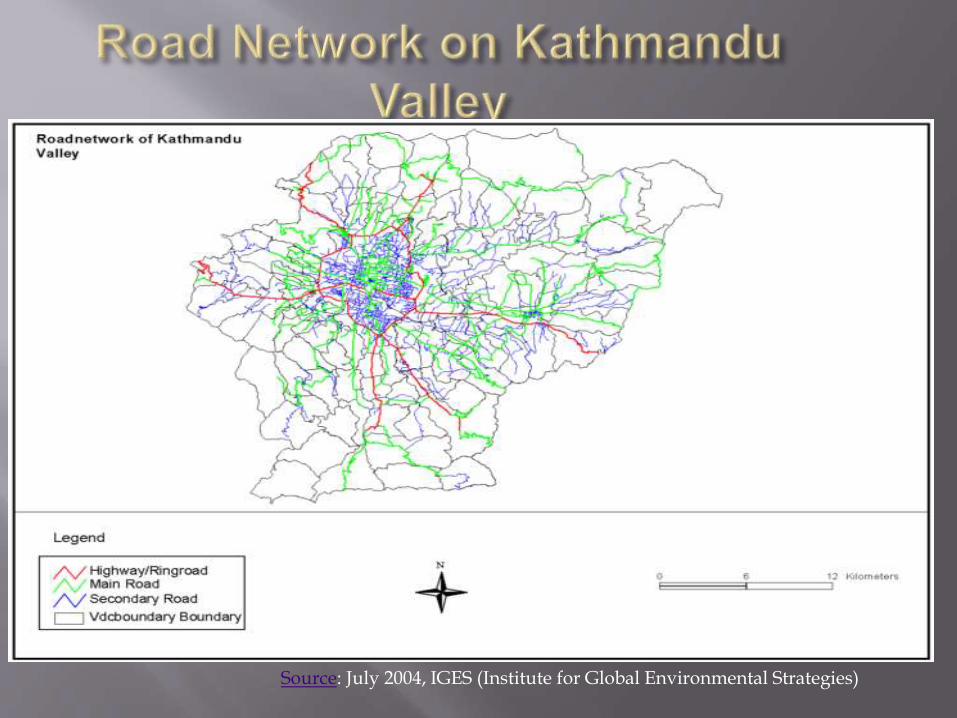
Source: July 2004, IGES (Institute for Global Environmental Strategies)

Source: Encreta 2008

Source:

NAAQS=National Ambient Air Quality Standard
Source: July 2004, IGES


In 1987, EPA (Environment Protection Agency) replaced the earlier Total Suspended Particulate (TSP) air quality standard with a PM-10 standard. The new standard focuses on smaller particles that are likely responsible for adverse health effects because of their ability to reach the lower regions of the respiratory tract. The PM-10 standard includes particles with a diameter of 10 micrometers or less (0.0004 inches or one-seventh the width of a human hair). EPA's health-based national air quality standard for PM-10 is 50 µg/m3 (measured as an annual mean) and 150 µg/m3
(measured as a daily concentration). Major concerns for human health from exposure to PM-10 include: effects on breathing and respiratory systems, damage to lung tissue, cancer, and premature death. The elderly, children, and people with chronic lung disease, influenza, or asthma, are especially sensitive to the effects of particulate matter.


In PM 10 Concentration: NAAQS: 120 microgram/ cubic meter
Highest concentration in winter season
Sag in the curve coincide with rainy season
So2 Concentration: NAAQS: 70 mocrogram/cubic meter (24 hr average)
Highest values in Bhaktapur
Operating season: December to may
CO Concentration: NAAQS: 10,000 microgram/cubic meter (8hr
average)


Large scale introduction of bus system will reduce large no of vehicles and save energy. However, in absence of progressive emission standards this will increase PM10 and SO2
In long-run a number of countermeasures would be necessary.
Tightening of emission standards is necessary but not sufficient: effective for SO2, PM10 and Nox but ineffective for reducing CO2.
Greater use of indigenously produced energy resources (electricity in this case)

Promoting public transportation, especially with those which high occupancy modes are essential for a number of factors
A package of countermeasures are necessary which only can address various priority issues such as PM10, congestion, energy saving, greater use of electricity and CO2
There should be synergies (coordination), not the conflicts, between local and global priorities in the Kathmandu Valley
Issues: Data quality (vehicle stock, operating factor, fuel efficiencies, emission factors)

http://www.iges.or.jplenlue
www.google.com.np
www.kathmandu.gov.np
http://ces.ioe.edu.np
www.dor.gov.np
http://www.environment-agency.gov.uk/
